
Abstract
The effect of stacking sequence of the various forms of glass fibre reinforcement on unsaturated polyester resin composite subjected to tensile and flexural loading was investigated. The Taguchi statistical technique had been used to identify a sustainable stacking sequence with unidirectional glass filament structure, glass fibre chopped strand mat, and woven glass roving mesh as reinforcement. The study used top, middle, and bottom layer positions of the reinforcing material stack inside the composite as control factors for tensile strength, and as well as flip (turning the face of the sample about the testing probe) for flexural strength. Response tables and analysis of variance were used to identify the most influential factors, and response graphs indicated the most important level for control factors. It was demonstrated that the location with the highest contribution for tensile strength was the middle layer, and in the instance of flexural loading, the bottom layer rear to the probe of the universal testing machine was the primary control factor. The strongest level was found to be one made of chopped strand mat sandwiched between two cross-oriented unidirectional filament structures. The uniqueness of this research is to establish the optimal way to stack reinforcements in superstructures such as walls, tables, beams that are only partially supported, poles, and boats, considering the different types of loads and the directions in which the forces act. The Finite Element Method (FEM) was used, to simulate the findings.
Introduction
Glass fibre reinforced composite materials are a promising replacement for traditional materials in applications requiring lightweight materials with high strength. 1 Such composites have applications in high-stress areas such as aviation, automobiles, instrument enclosures, boats, pressure vessels, ballistic armour, and so on.2,3 Glass fibre composites outperform aluminium and steel due to their high strength to weight ratio, low fuel consumption, and corrosion resistance. The mechanical properties 4 of composites are primarily determined by the strength of the fibre, the strength of the matrix, the chemical stability of the matrix, the ability of the fibre matrix interface to transfer stress, the orientation of a specific type of reinforcing material, the length distribution of the fibre, the cross sectional area of the fibre, and the stacking sequence of different reinforcing layers in multi-layer composites.3,5–20 The literature review reveals that the focus of glass fibre composite research is on (i) the use of various forms of glass fibre reinforcement in combination with different resin systems and their mechanical response2,21,22 (ii) the use of hybrid reinforcements in the manufacture of glass fibre composites11–18,23 and (iii) the influence of stacking angle of reinforcing materials in composites on their desired applications and purposes. 24
Any structural component experiences multidirectional load during use. This multidirectional external stress necessitates the placement of fibres in all directions. The strength of the unidirectional structure (U) is greatest in the directions of fibre alignment, whereas the chopped strand mat (C) provides a more isotropic approach because the fibres are uniformly distributed in all directions, whereas the woven structure (W) demonstrated orthogonal mechanical response. As a result, using exclusively U, W or C as a reinforcement in making composite cannot be the solution. This requires the optimal arrangement of reinforcements as well as the judicious application of each type of reinforcement (U, W, C). The authors were unable to identify any previous research that determined the best combination of composite reinforcements, such as unidirectional glass filament structure (U0/U90), woven glass roving mesh (W), and glass fibre chopped strand mat/nonwoven (C). Elbadry et al. 17 studied composites made of plain woven, short fibre, and a sandwich layer of glass fibre reinforcements and found that plain woven composites had better mechanical characteristics. This demands a thorough study that will discover the most efficient reinforcement combinations through destructive testing using a suitable method with fewer experimental runs for evaluating mechanical response.
Non-statistical approaches, such as artificial neural network (ANN), 25 genetic algorithm (GA), and adaptive neuro-fuzzy inference system (ANFIS), require huge quantities of data and are time demanding, 26 while particle swarm optimisation (PSO) has lower iterative convergence rates. 27 Statistical approaches are fast and reliable, may uncover significant factors, help comprehend factor interactions, and reduce the number of experimental runs. 28 The Taguchi approach may optimise numerous control parameters and get more quantitative data from fewer experimental runs. 29 The Taguchi technique was adopted for optimisation and precise prediction.
The current study aims to identify acceptable combinations of unidirectional glass fibre filament structure (U0/U90), woven glass roving mesh (W), and glass fibre chopped strand mat (C) with optimal stacking sequence to maximise tensile and flexural strength. Taguchi orthogonal arrays were utilised to minimise the number of experimental runs, and the signal-to-noise ratio was used to analyse the influence of stacking sequences on composite tensile and flexural strength.
Experimental
Materials
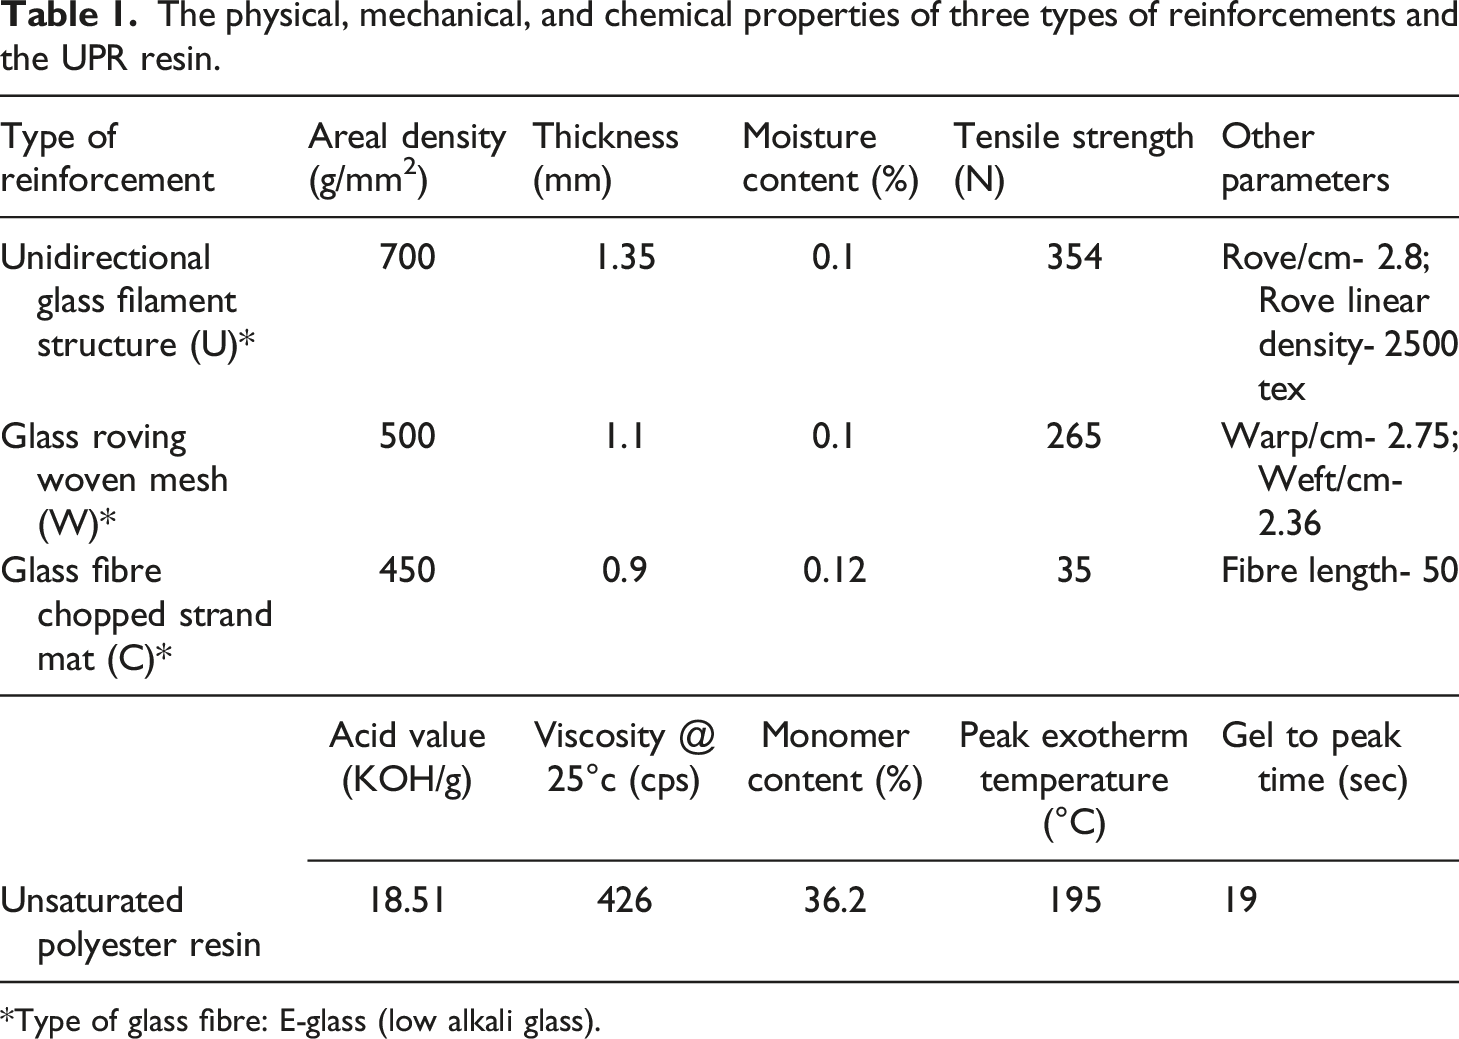
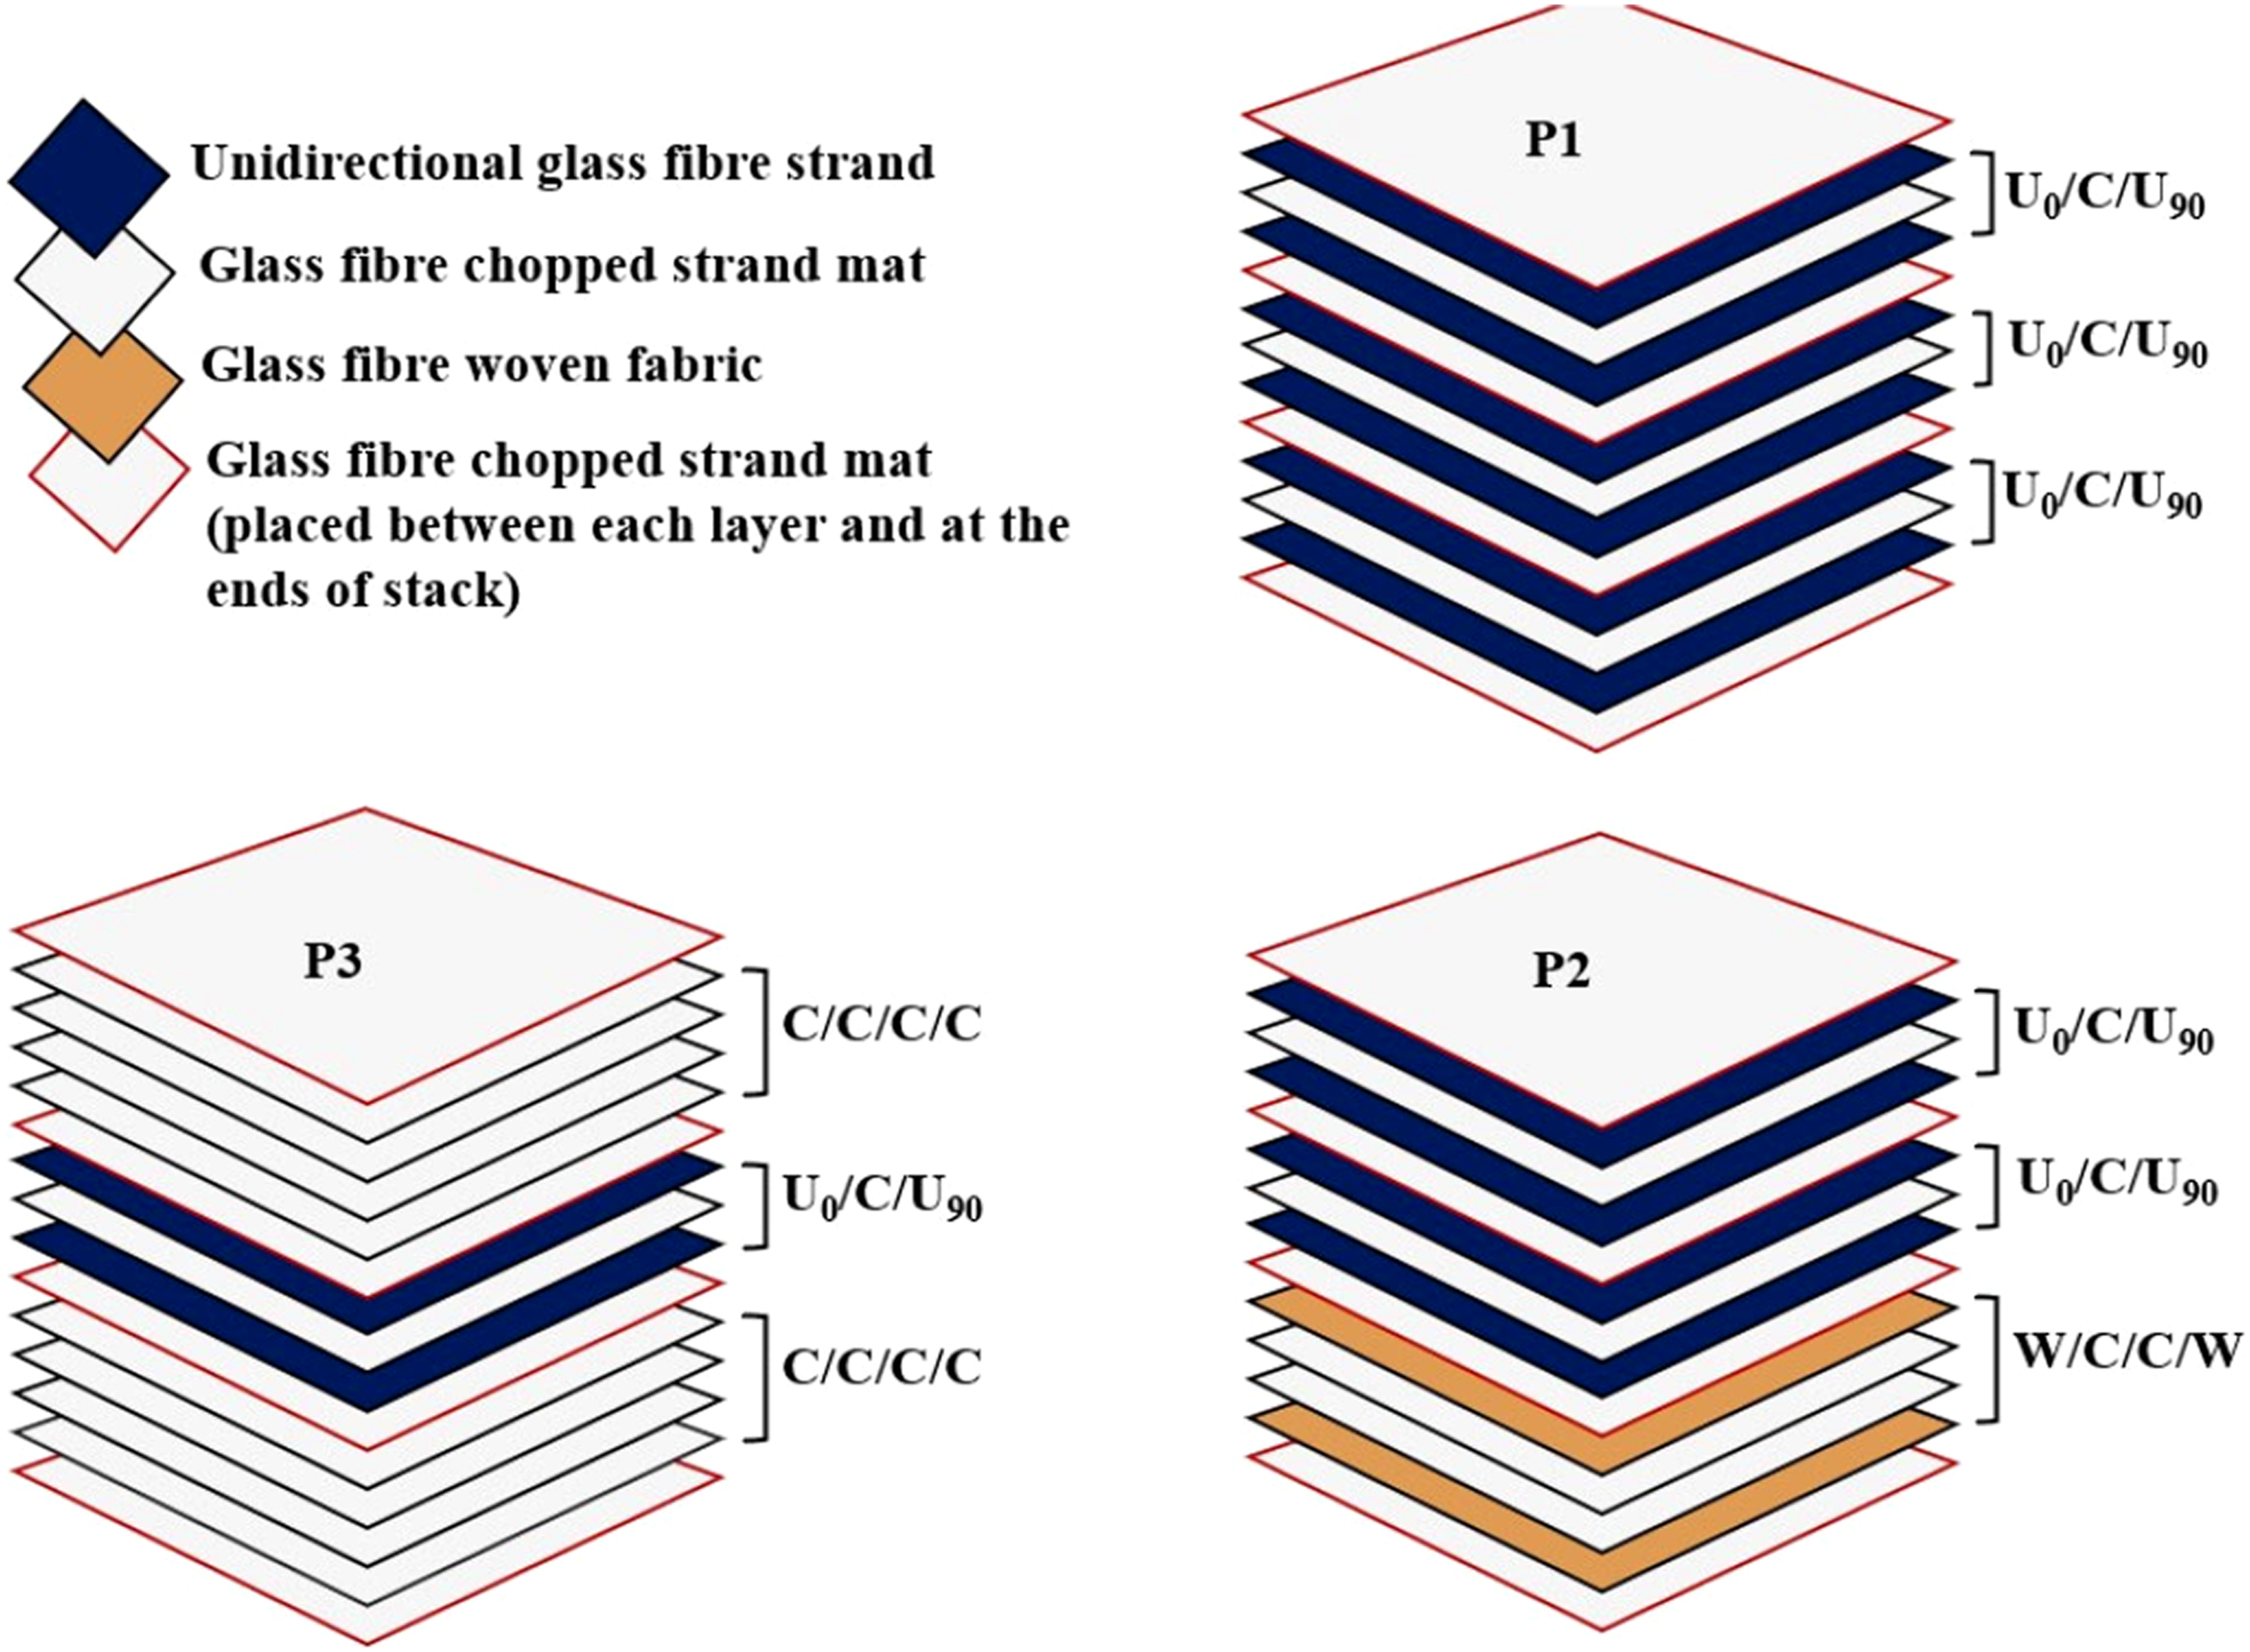
The composite developed for the study was based on combinations of three kinds of E-glass fibre based fabrics, namely unidirectional glass filament structure (U), glass roving woven mesh (W) and glass fibre chopped strand mat (C) as a reinforcing system (Figure 1) from Owens Corning, India Ltd. Vertical filaments in a unidirectional glass filament structure were kept in place by a polyester thread (Figure 1a), and the filaments were arranged in parallel, in the same plane. In each unidirectional glass filament construction, the filament direction was 900 with the direction of the filament in the next. Composite matrix used unsaturated polyester resin (UPR, Fibre Bond-555). Before application, UPR was activated with cobalt napthalate (1 wt%) and catalysed with methyl ethyl ketone peroxide (1 wt%). Table 1 shows the physical, mechanical, and chemical parameters of three reinforcements and UPR resin. Photographs of glass fibre reinforcements used in the study (a) unidirectional glass filaments held in position by polyester threads, marked in figure (U), (b) woven glass roving mesh (W), (c) glass fibre chopped strand mat (C). The physical, mechanical, and chemical properties of three types of reinforcements and the UPR resin. *Type of glass fibre: E-glass (low alkali glass).
Taguchi experimental design
The Taguchi based orthogonal array L9 (33) and L18 (21 × 33) with mixed levels were selected to study the contribution of each control factor on the tensile strength and flexural strength respectively. The study involved three and four control factors for tensile strength and flexural strength respectively. The three factors were the position of reinforcing materials along the thickness dimension of the final composite (Figure 2). An additional factor flip (FLIP) was also considered for flexural strength analysis of composite. The prototype composite samples were made in a way using fewest number of reinforcing layers to keep the same level of fibre volume fraction and uniform thickness and to avoid slippage between two adjacent reinforcing layers. The prototype samples [U0/C/U90], [W/C/C/W], and [C/C/C] were developed by impregnating the reinforcement stack with a resin. The ‘level value’ of each control factor was determined by tensile and flexural tests performed on prototype composite samples (Table 2). Level 1 was a prototype composite with three layers, while levels 2 and 3 were prototype composites with four layers of basic reinforcing material in various combinations. Except for FLIP, all the other factors in this study had three levels (Figure 2). For the analysis of tensile and flexural responses, nine different composite samples or runs were designed. However, flipping, or reversing the nine composite samples, resulted in 18 flexural testing runs (2 × 9 = 18) (Table 3). Schematic depiction of the sequential preparation of glass fibre reinforced UPR composite samples with the control factors. Control factors and levels of Taguchi DOE for tensile and flexural behaviour analysis. Orthogonal array for tensile and flexural strength test. *Flipping of Run 1 generates run 10 and so on.


The selection of optimum tensile and flexural strength was based on the Taguchi method with the principle of “Largest is the Better.” The signal to noise ratio (S/N ratio) as a performance criterion was computed using the equation (1). Higher S/N ratio represents better performance.26,30
Sample preparation
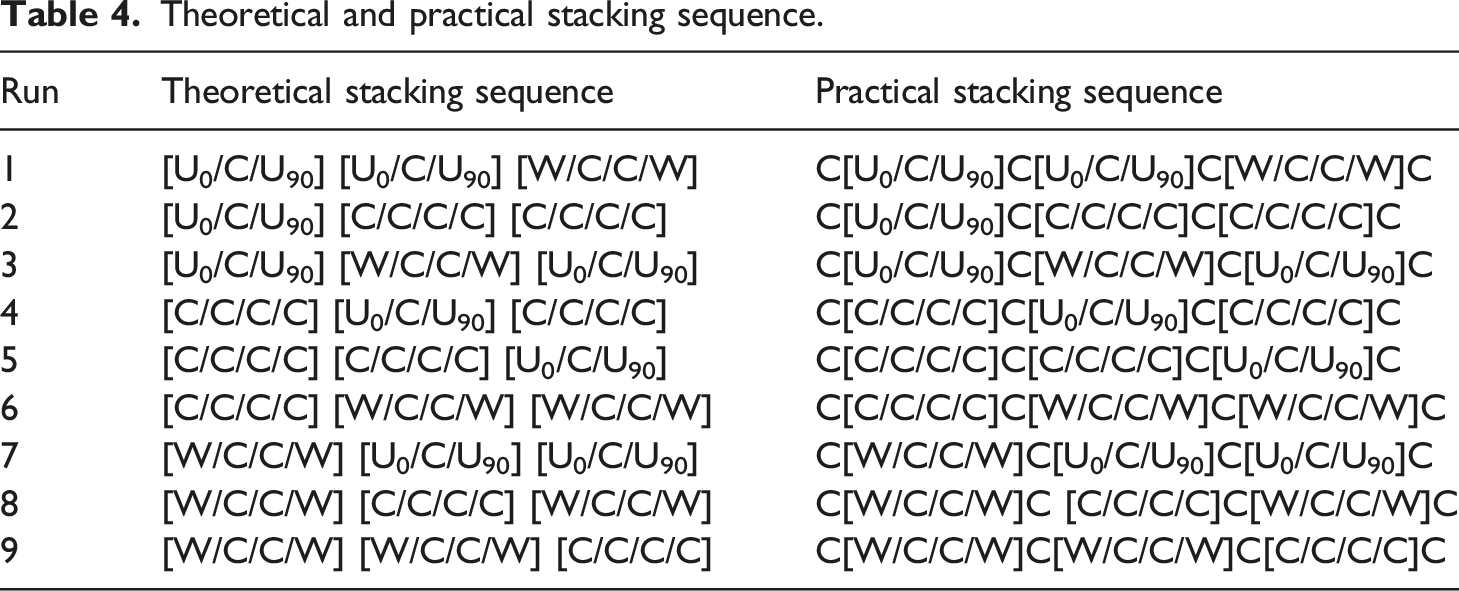
Theoretical and practical stacking sequence.
The mould had a stack of the desired reinforcing layers to maintain a fibre to resin ratio of 1:1 (fibre volume fraction ∼0.5). The stack was then left for about 3 min to allow air bubbles to escape from the surface of the resin before the mould was closed and placed on a movable lower plate of the hydraulic press. It was then pressed in a hydraulic press at a pressure of about 10 kg/cm2 and cured for 4–5 min at a temperature of 140 ± 50C with a gap of 8 mm.
A preliminary study was carried out that revealed that inter-laminar slippage made it impossible to put two successive woven glass roving mesh and unidirectional glass filament structures in the composite. This resulted in delamination of reinforcing material under tensile loading, as shown in Figure 3. Thereby, for nine experimental runs, an additional layer of chopped strand mat placed between each level ([U0/C/U90] and [W/C/C/W]) reduces such slippage. Table 4 demonstrates the theoretical and practical stacking sequences. Photograph showing delamination of woven glass roving mesh as encircled with dashed white line under tensile loading.
To eliminate the effect of variations in fibre content on tensile and flexural strength though it is an important factor,
31
the fibre per unit volume of composite, i.e. fibre volume fraction, and bulk density (Figure 4) were kept constant. The figure depicts that there is no such statistically significant variation in fibre volume fraction. Bar diagram showing average volume fraction and line showing average density of developed composite samples.
Evaluation
ASTM D792 was used to find out the specific gravity of the composite samples. The test value was then used to determine the bulk density. Standard test methods, ASTM-D683-86, ASTM D 790-71, and ASTM D 2584-68 were used to measure tensile strength, flexural strength, and fibre volume fractions respectively. Scanning electron microscopy was used to examine the ruptured composite samples using ZEISS EVO 40 SEM (Carl Zeiss AG, England), Figure 4 shows the bulk density and fibre volume fraction of the developed samples.
Finite element method
Along with the tests, finite element method (FEM) was used for analysis following static structural module of ANSYS 2022 R2 programme. The samples prepared for validation were with the optimum stacking sequence. Since the loading approach is multidirectional in specific application areas, three separate FEM models of varying complexity were constructed.
Results and discussion
Figure 5 illustrates the failure under tensile loading of specimens whose breaking strength is closest to the average value for each run. Flexural failure is a combination of tension and compression failure modes, and can therefore be explained by the nature of failure under tension.
32
The multidirectional arrangement of the reinforcements led to this type of failure mode (prototype composite). Tension, compression, and flexural deformations in woven roving mesh rich laminates (RUN 6, 8, 9) were more complicated than in specimens based on unidirectional glass filament structures (RUN 1, 3, 7). As a result of the discontinuous nature of the reinforcement, chopped strand mat-rich laminates demonstrated a lower tensile strength and a higher breaking strain. Thus, the specimens demonstrate a combination of these fundamental failure mechanisms and presented a complex nature of failure in order to determine the optimal stacking sequence for a specific application. Stress-strain curve of specimens of 9 runs that have tensile breaking strength nearest to the corresponding average value (Run numbers are specified in the right end of each curve).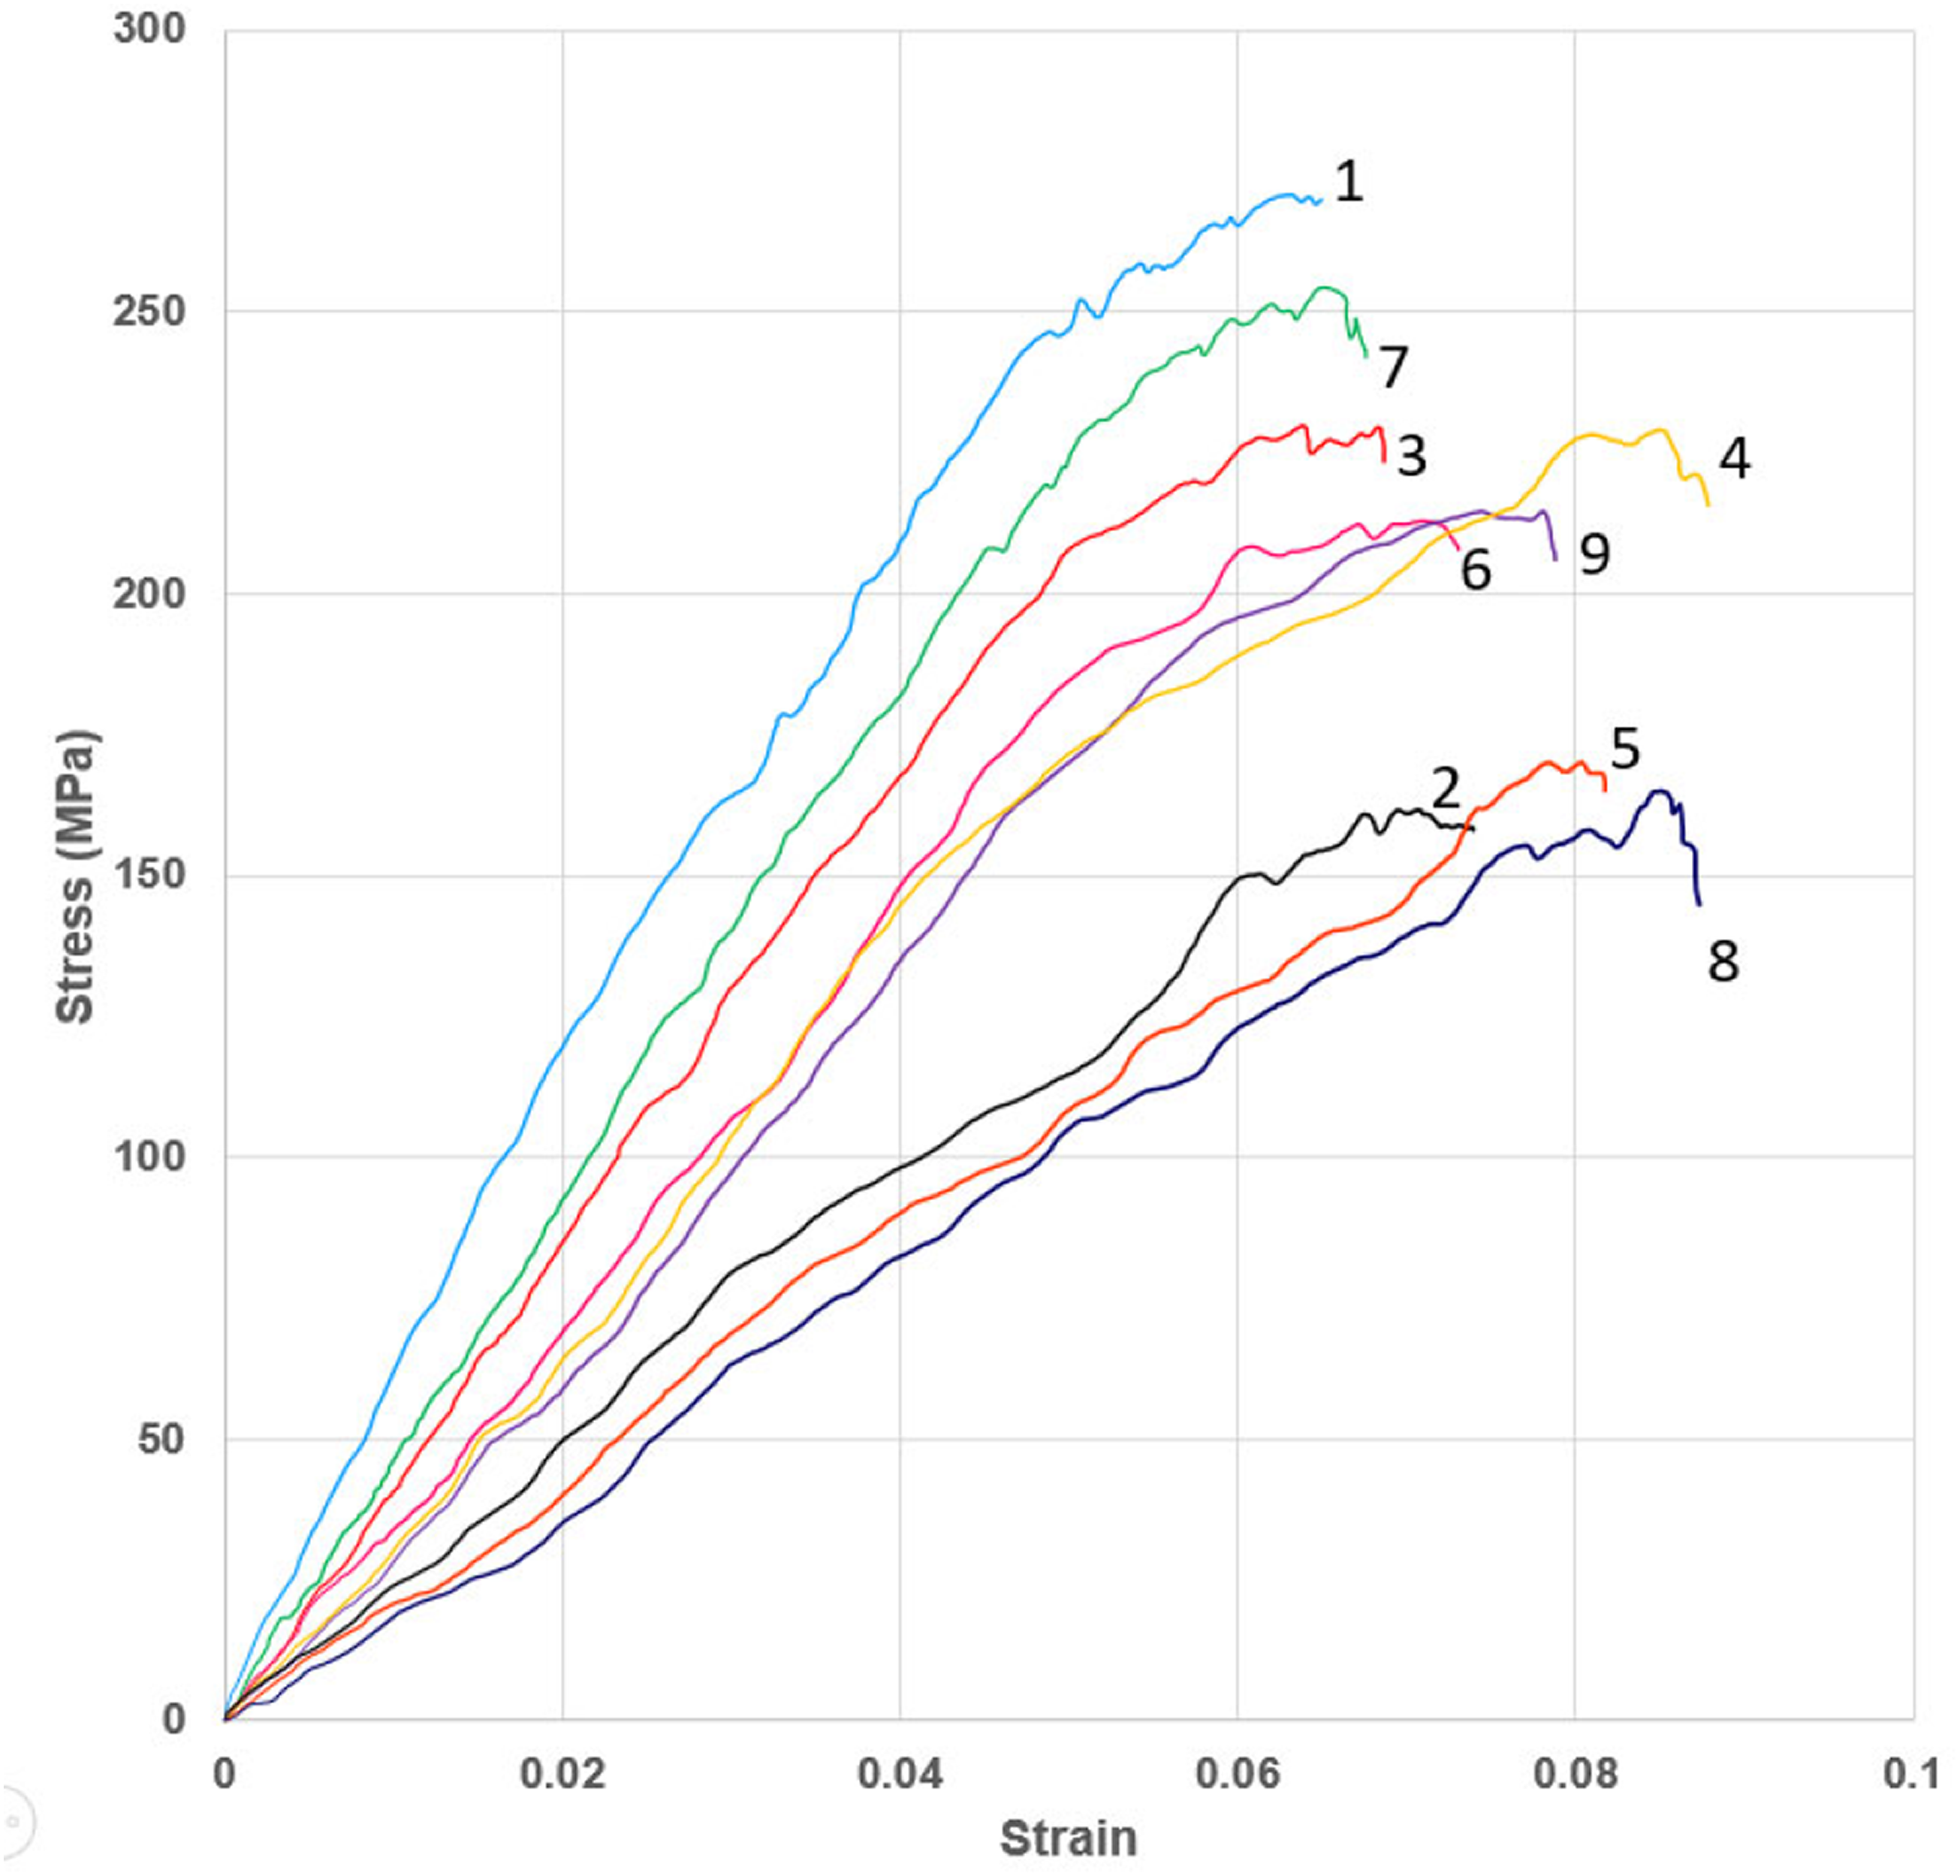
Analysis of S/N ratio of tensile and flexural strength


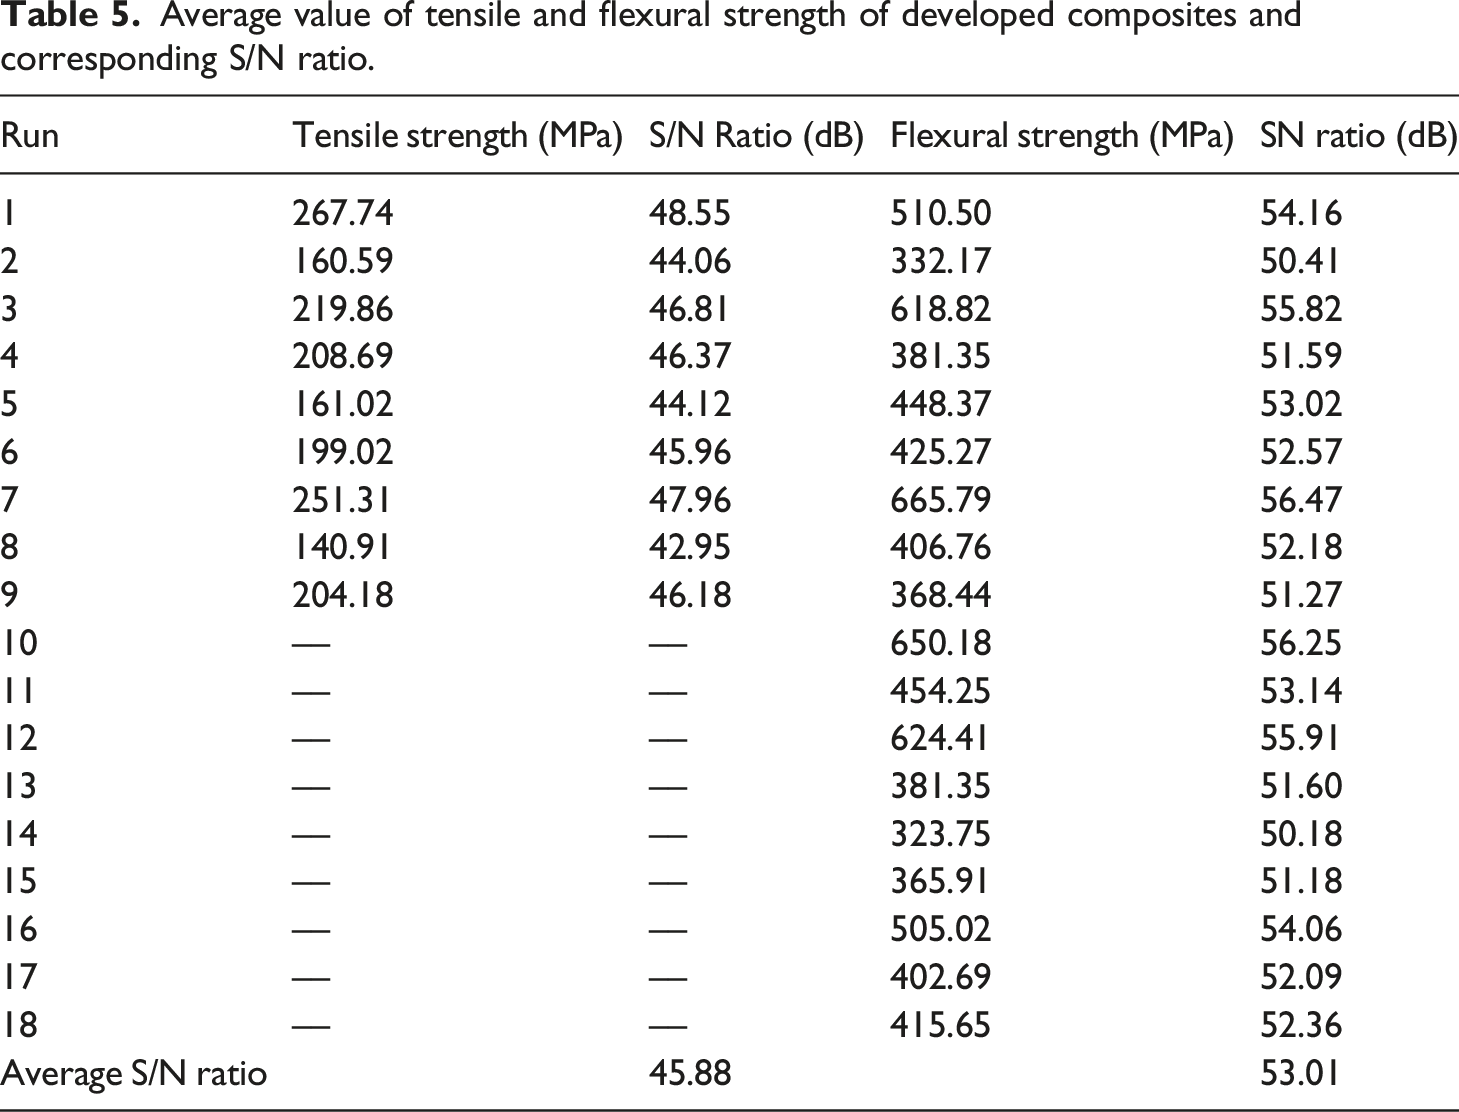
Average value of tensile and flexural strength of developed composites and corresponding S/N ratio.
Taguchi response table for average S/N ratio of tensile and flexural strength.


Mean of response graphs for tensile strength and corresponding S/N ratio for control factors (a) top, (b) middle, and (c) bottom layer.

Mean of response graphs for flexural strength and corresponding S/N ratio for control factors (a) top, (b) middle, (c) bottom layer, and (d) FLIP.
Effect of control factors: Position of reinforcement
The most significant control factor was identified using the rank table. In the instance of tensile strength, a higher delta value indicated that the influence of the middle layer was greatest. The curing conditions of composite samples during compression moulding reduced the viscosity of the resin matrix, and the resin matrix flushed out of the mould, as illustrated by the encircled section in Figure 8. The migration of the resin matrix rendered the two outermost layers (TL, BL) resin-rich, leaving the middle layer as a reinforced enrich layer and enhancing its influence. Photograph showing flushing of unsaturated polyester resin outside mould.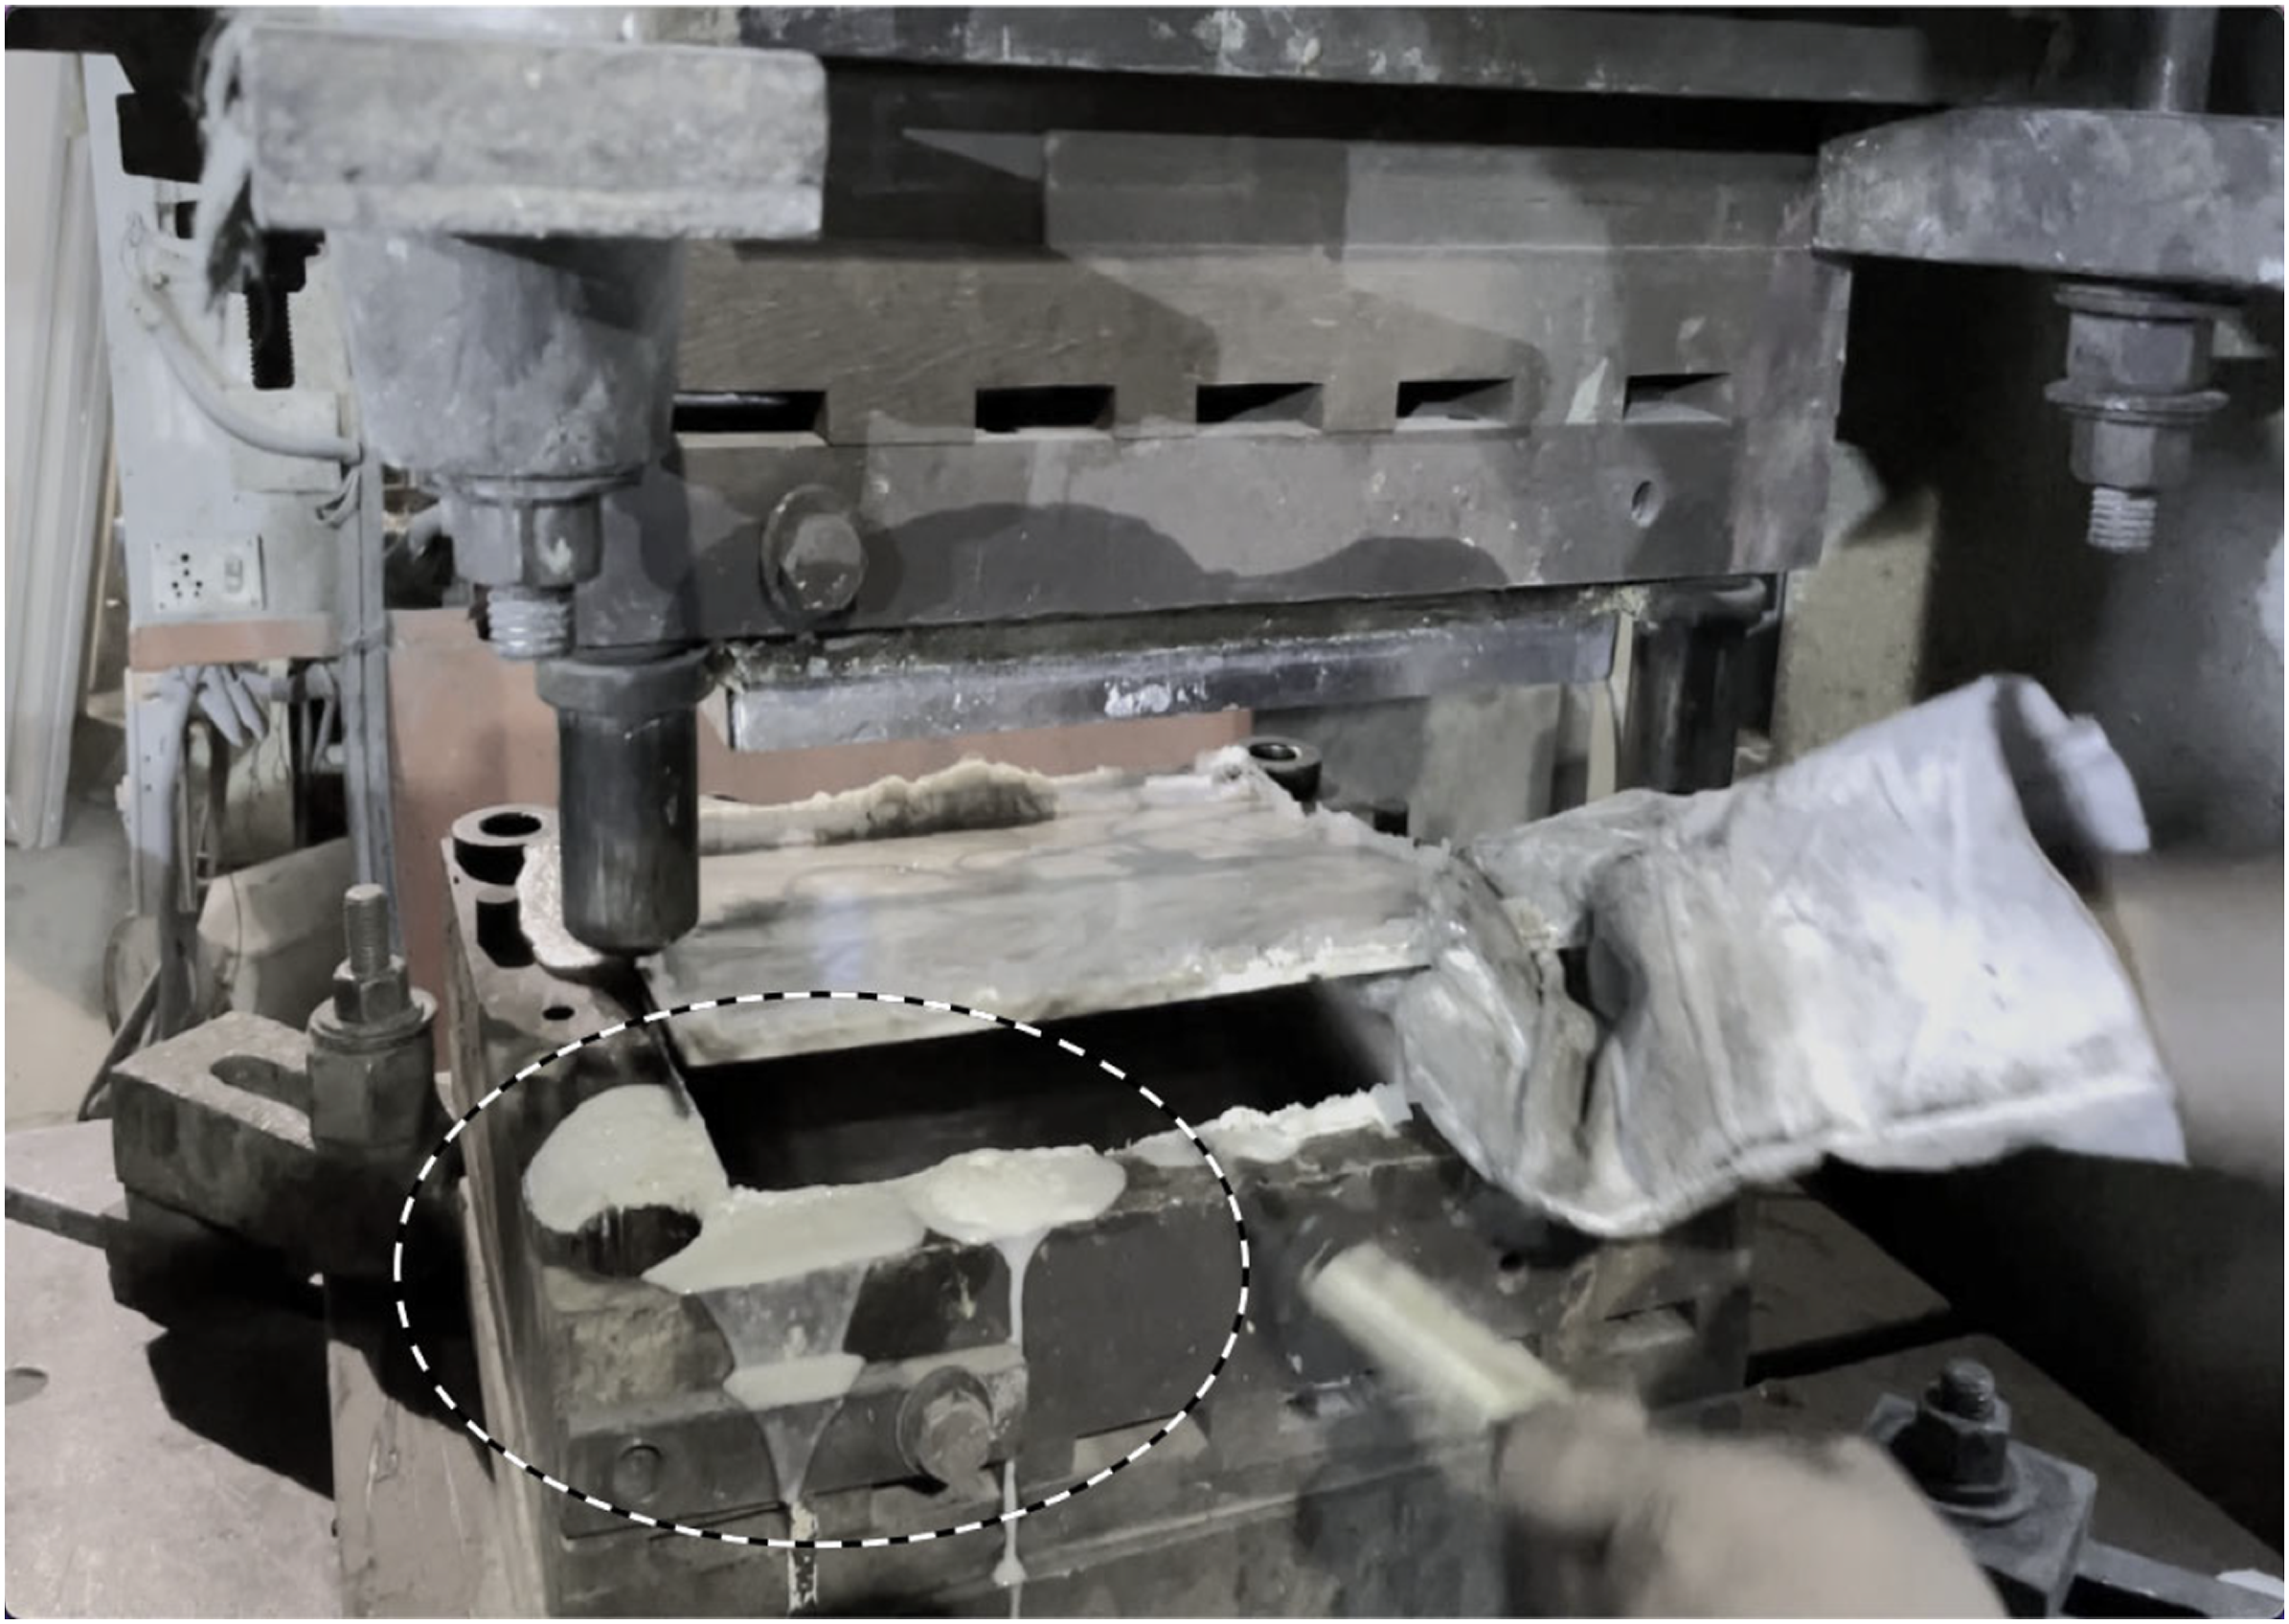
The most influential factor in flexural strength was found to be the bottom layer (BL). The deformation nature of the samples under 3-point bending responsible for reduced flexural strength at TL and ML during flexural loading. The side facing the probe of the universal testing machine experienced compression type loading during flexural testing, while the rear end experienced extension type deformation with a gradient of strain deformation along the thickness direction of sample. According to the theory of bending deformation, the material can withstand higher compressive forces than extension forces 34 and failure was induced by the layer extending away from the probe. As a result of the extension type of deformation that BL has experienced, designated it (BL) as the dominant and contributing control factor for flexural strength.
Effect of level: type of reinforcements
The tensile and flexural strength values were found to be higher for level 1 (U0/C/U90) where the glass fibre chopped strand mat was sandwiched between two layers of unidirectional glass filament structure (Response graphs, Figure 7 and Figure 8). The inclusion of a non-crimp
35
unidirectional glass filament construction with the filaments held in place by a polyester thread (Figure 1) allowed for greater reinforcement strength and consistent flow of matrix throughout the structure. The fractographic analysis (Figure 9a) verified the uniform flow of resin matrix on the surface of the unidirectional mat which promotes the better adhesion between the resin reinforcement. Moreover, Figure 9(b) showed the shattering of the glass filaments. Scanning electron micrograph showing (a) complete wetting of unidirectional glass filament structure (b) breakage of the glass filaments under tensile load (c) non-uniform distribution of matrix at the cross over points in woven glass roving mesh (d) impression of pulled out fibre in woven reinforcement under tensile load (e) tensile fracturograph of chopped strand mat based composite.
The scanning electron microscopy of a woven glass roving mesh-based composite (Figure 9c) revealed a non-uniform distribution of matrix at the cross over point, which is the prime feature of woven cloth. In the case of level 2, improper load transmission from matrix to reinforcement as an account of the inadequate distribution of unsaturated polyester resin may be responsible for lower tensile and flexural strength. This can be further realised by the presence of the voids inside the composite made of woven mat based reinforcements (Figure 9d).
However, when the composite was constructed entirely of glass fibre chopped strand mat, the minimal values of tensile and flexural strength were attained. Fibre length was one of the most essential aspects affecting composite mechanical characteristics. 36 Fibre must be longer than a critical length (Lc) to observe fractures related to reinforcement breaking. 37 The average length of glass fibre in the used chopped strand mat was 50 mm, while the other two forms of reinforcement were made of continuous filament. The longer length glass fibre filament based reinforcements offered higher tensile and flexural strength as observed in the study of Elbadry et al. on glass fibre chopped strand mat and woven mesh reinforced composites. 17 The tensile fracturograph of chopped strand mat based composite is shown in Figure 9(e).
Analysis of variance
ANOVA for S/N ratio of tensile strength.

ANOVA for S/N ratio of flexural strength.


Bar diagram showing percentage contribution of each factor towards S/N ratio of tensile and flexural strength.
Analysis of optimum conditions

Confirmation of Taguchi design of experiment

Design of proposed sample with the application area.

The optimum S/N ratio for tensile strength is as follows:


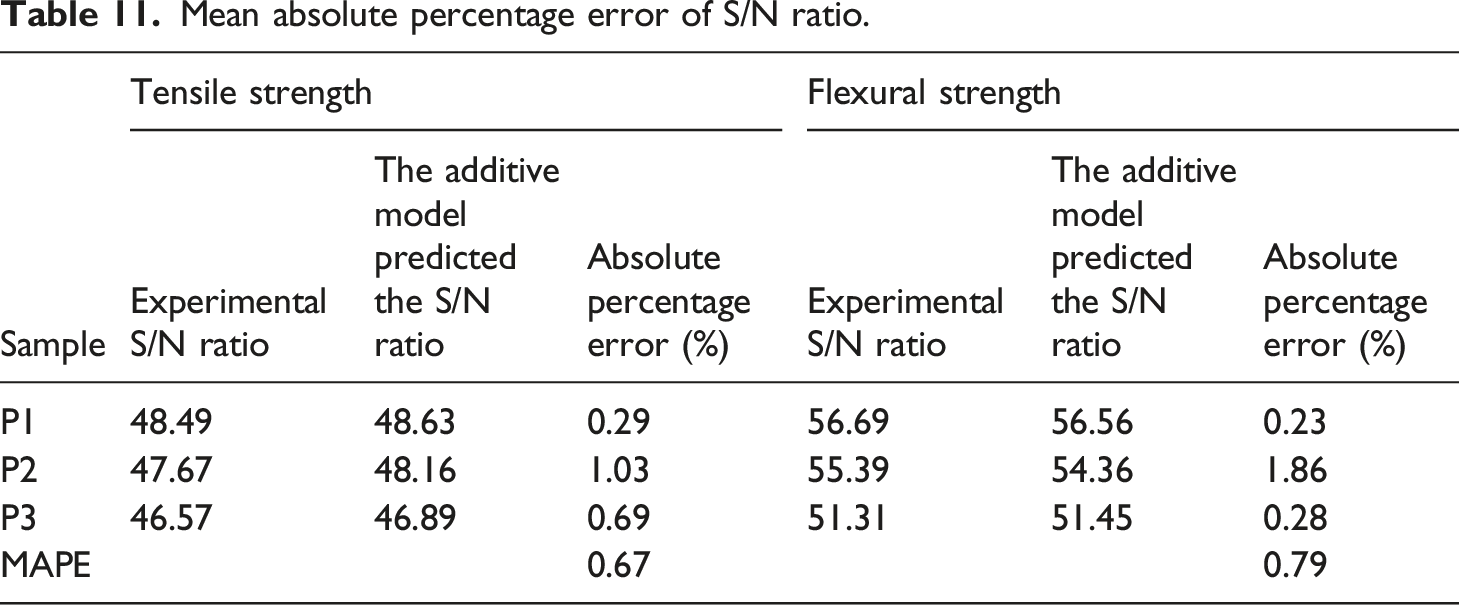
The optimum S/N ratio (56.56 dB) for flexural strength was also calculated using an additive model. The averages of S/N ratio of tensile and flexural strength for the composite (P1) developed under optimum conditions were 48.49 dB and 56.69 dB respectively which were in good agreement with the S/N ratio values predicted using the additive model.
Designing and validation of composite samples for a specific application area
The selected L9 and L18 orthogonal arrays identified run 7 as a common experimental design. However, the appropriate reinforcing material combinations in the engineering of composite samples for maximum tensile and flexural strength were determined by the kind of loading, the type of material, and its location (position), such as
The designs of the composite samples manufactured for validation following the application were presented in Table 10.
The ANSYS simulation software was now used to comprehend stress distribution inside the structures, made of P1, P2, and P3 when they were put under real-life loading conditions. Figure 11 revealed that the stress distribution took a multidirectional approach, which is difficult to achieve using only U, W, and/or C. Only such multi-direction real-life loading can be resolved by the logical sequence as revealed by Taguchi analysis using U, or W, and/or C at appropriate positions. (a) Von-Mises equivalent stress distribution of wall like super structure. (b) Von-Mises equivalent stress distribution of a Table top. (c) Von-Mises equivalent stress distribution of a pole structure under wind speed of 100 m/s.
Figure 11(a) showed the parallel stress contour lines for wall like superstructure. It also showed that compression deformation occurred along the direction of the load, while shear deformation occurred perpendicular to the direction of the load. ANSYS analysis suggested that reinforcing fibres should be arranged in a way that gives an orthogonal response as an upshot of arrangement of U [U0/C/U90] to stop generation and spreading of crack when subjected to downward load of 5000 N. The order in which P1 was stacked showed that U and C were used together to keep reinforcements from sliding between layers and get the most use out of their strength.
The normal force (500 N) is applied evenly across the top flat surface of the tabletop, which is held in place by four static supports at the corners in the case of P2 (Figure 11b). The findings of Taguchi analysis, which identified the bottom layer (BL) as the most influential factor in flexural deformation, were confirmed by ANSYS. According to ANSYS simulation, the ideal stacking order for P2 with a normal load on the rear of [U0/C/U90] is the only solution to withstand the bending type of deformation. Mean of response graph for flexural strength and corresponding S/N ratio (Figure 7a) indicates that there is no such significant variation in flexural performance due to the placement of either Level 1 or level 2 at top layer. Thereby, using of Level 2 i.e. [W/C/C/W] in comparison to [U0/C/U90] made the stacking sequence more cost effective.
The ANSYS simulation shows that the load (at 100 m/s wind speed) exerted along the x-direction of the pole is normal to the main shaft of the pole, whereas the extended sides (handles) experience gravity induced moment in real life due to weight arrangements at the tips. When designing the pole, the use of U in the middle layers provides the desired strength to withstand external load, whereas the use of low profile isotropic C in the other layers can handle the cost component while designing the pole.
Empirical model for tensile and flexural strength using regression analysis
The regression models for tensile strength and mean of flexural strength are presented as follows:

The experimental values of newly engineered samples P1, P2, P3 were plotted as functions of predicted values. It was observed from Figure 12 that the predicted models can explain the 89.8% and 97.1% of the experimental data of tensile and flexural strength respectively. Experimental value of means as a function of predicted values for (a) tensile strength and (b) flexural strength.
Additive model for S/N ratio of tensile and flexural strength
Mean absolute percentage error of S/N ratio.
Conclusion
In this work, the Taguchi design of experiment was used to find out how different types of reinforcement and how their placement affected the tensile and flexural strength of the final composite. This was confirmed by FEM. The Taguchi model was designed by using the top layer (TL), middle layer (ML), and bottom layer (BL) of reinforcing material as a control factor for tensile strength and an additional control factor flip (FLIP) for flexural strength. The varied combinations of reinforcements were the level of control factors for fabricating composites with uniform volume fraction of fibre and bulk density. (i) In the instance of tensile strength of the composite, the Taguchi design of experiment selected the middle layer, ML (Figure 2) as the most suitable position of the reinforcement. At a 95% confidence level, the ANOVA revealed that ML was the significant factor (p-value (ii) Chopped strand mat as reinforcing materials had the lowest tensile and flexural strength scores. The composites with chopped strand mat sandwiched between two cross-oriented unidirectional filament layers, [U0/C/U90] i.e. level 1 as reinforcing materials contributed to the maximum tensile and flexural response, according to Taguchi experimental analysis. (iii) The Taguchi model derived in this research was verified via confirmation experiment and engineered composite sample (P1) not used in the selected orthogonal array. The predicted S/N ratios 48.63 (dB) and 56.56 (dB) at the optimum conditions of tensile and flexural strength were in agreement with experimental S/N ratios of 48.49 and 56.69 (dB) respectively for the proposed composite structure (P1). (iv) The empirical models established by regression analysis were utilised to forecast tensile and flexural strength, and they were able to explain 89.8% and 97.1% of the experimental data for tensile and flexural strength for samples P1, P2, and P3, respectively. (v) The study aids in the engineering of glass fibre composites (P1, P2, P3) with various reinforcement combinations based on the type of load and the direction of load during usage and validates the performance of designed composite for feasible application areas such as a wall, simply supported beam, tabletop, boat, and pole (Table 10). Table 10 will aid the industry in developing a composite sample with the best stacking sequence for their specific purpose. The reinforcing pattern depicted in Figure 13 may represent the best stacking sequence for maximum tensile and/or flexural strength. Validation of the logical stacking for samples P1, P2, and P3 was attained using the finite element method (FEM) with ANSYS software. Schematic representation of three proposed stacking sequences, P1, P2 and P3.
Footnotes
Acknowledgements
The authors would like to thank Fibro Plastichem India Private Limited for supplying materials and providing facilities to carry out the study.
Declaration of conflicting interests
The author(s) declared no potential conflicts of interest with respect to the research, authorship, and/or publication of this article.
Funding
The author(s) received no financial support for the research, authorship, and/or publication of this article.
Data availability statement
Tables 1–11 include all the data that are embedded in the main body of the manuscript. The parameters computed and included in the body of the manuscript for replication of results are the S/N ratio,