
Abstract
Firefighters rely heavily on their firefighter’s protective clothing (FPC) for their safety. The effectiveness of an appropriately engineered turnout suit decreases over time when repeatedly exposed to radiative heat and flame. A measure of durability is the radiative protective performance (RPP) rating, which is influenced by properties like thickness, surface area, and areal density (mass per unit area) of outer shell fabric in multilayered ensembles. Four independent variables were considered: fabric material, pick density, exposure cycles and heat flux intensity. In addition to RPP, changes in the thickness, shrinkage, and mass loss was also tracked. An evaluation of properties was conducted at the end of each cycle to determine the effects of the heat flux (21, 42 and 63 kW/m2), number of exposure cycles (from one to five) and effects of each attribute. Two types of fabrics were used in this study, one made with meta aramid (Nomex® IIIA) yarns in both warp and weft (type-A fabric), and the other made with Nomex® IIIA (warp) and para aramid (Kevlar®) (weft) (type-B fabric). Type-A fabrics displayed a greater degree of differentiation in their properties than type-B fabrics. With the same exposure conditions, the thickness, shrinkage, mass loss and RPP gradually increased. A regression analysis conclusively established that pick density significantly affects the performance of the outer-shell fabric used in FPCs. Textile designers may find the results useful for creating more thermo-stable and durable turnout suits in the future.
Keywords
Introduction
The number of fire-related deaths in India during 2015–2019 averaged 39 per day, ranking fifth globally in 2017.1,2 The high death rate was attributed to poor infrastructure, insufficient training and inadequate specialized equipment. 3 In order to ensure safety it is crucial to adopt the best available technologies, including those for turnout suits. A better preparedness and optimal utilization of resources could help to reduce fire-related casualties. Firefighters face multiple challenges during the course of an operation, making their job risky and potentially dangerous. Most of the fire-related injuries were identified to result from thermal exposure (burns and heat stress), chemical contaminants (smoke, carcinogens and poisonous gases), biological distress (blood-borne pathogens), physical accidents (impacts, falling objects and rough surfaces) and environmental factors (temperature and high humidity). Chronic illnesses or even death resulted sometimes when workers were exposed to such unhealthy environments.4,5
The primary purpose of firefighter’s protective clothing (FPC) is to reduce heat stress on the wearer and minimize obstructions to their activities while maintaining integrity under high temperatures. During firefighting operations, the firefighters must wear such clothing that would not melt, break, or split when exposed to flame and which possessed liquid-repellent properties. At high temperatures, they should resist shrinkage and remain strong and flexible. 6 The surface area of outer shell fabrics plays a key role in maintaining the performance of FPC. Shrinkage along the plane of fabric did not directly affect thermal insulation property but it had indirect effects. Consequent to thermal exposure, a chain of events occurred, including shrinkage of the fabric, narrowing of the air gap between the fabric and the skin and heat transfer modes within the gap. The RPP of turnout suits continuously deteriorated since these events were dynamically linked to one another.7,8 The availability of such materials in terms of their ability to shield against flames, radiation, and liquid chemicals is limited. In modern firefighter’s protective clothing blends of two aramid isomers, meta aramid and para aramid were shown to have several advantages.9,10 Fibers of this family are flame-resistant, high temperature melting or decompose before melting. Despite their lightweight, the aramids are durable and highly mechanically strong. Compared to Nomex® fiber, Kevlar fiber exhibited more textile-like properties but when exposed to extremely high temperatures, such as those in fire environments, it shrinked and splitted. 11 This problem was overcome in Nomex® IIIA fabric by using blended aramids. Nomex® IIIA is in great demand because it meets all the properties necessary for FPC. These benefits justify the selection of Nomex® IIIA as substrate for the present investigation. Its applications included outer-shell fabrics, nonwovens, spun lace thermal barriers, knitted underwear and blends with viscose for jackets and trousers. 12
The firefighter’s suits have been designed to withstand intense heat, open flames and provide protection against poisonous gases, steam, heated liquids, etc.13–16 The effectiveness of these properties gradually declined over time due to repeated exposure to heat. Consequently, NFPA recommended the retirement age of turnout suits at a maximum of 10 years in order to prevent failure. 17 Using a visual inspection and performance testing approach, McQuerry 18 evaluated 250 old turnout suits of different ages. The authors found that thermal protective performance (TPP), total heat loss, and flammability properties supported a wear life of more than 10 years while mechanical properties and water penetration properties supported a wear life of 10 years or less. The factors that shortened the wear life of FPC included damage to its physical and mechanical properties or chemical reactions that destroyed its thermal properties. 19 The outer shell fabrics greatly influence the efficacy of a multilayered FPC ensemble since the fabrics protect against the initial impact of heat, flame and abrasion. Post-exposure TPP was greatly impacted by the mass per unit area of the fabric, 20 the nature of the constituent fiber,21,22 the intensity, frequency and duration of exposure etc. 23 A low-intensity heat flux severely impaired many mechanical properties of a highly thermally stable and heat resistant aramid fabric (X-FIPER®). Even though the thermal protection performance did not differ significantly from that of the control sample, the SEM photographs clearly demonstrated surface damage. 24 Other factors, such as weathering, 25 laundering, 26 hot laundering, 27 dry cleaning, 28 and abrasion 29 were also found to affect the durability of FPC.
It is apparent from the survey of literature conducted in the preceding text that a great deal of research has been done on various aspects of FPC with special reference to those made from aramid fibers. In this article we report the effect of repeated radiative heat exposure (at three levels of heat flux, namely 21, 42, and 63 kW/m2) on PL1, PL2 and PL3 fabrics developed with meta aramid yarns (Nomex® IIIA) in both warp and weft directions (type-A) and another PL4, PL5 and PL6 made from meta aramid yarns in warp and pure para aramid (Kevlar) yarns in weft (type-B). An experimental method to determine the performance seems to be lacking whenever performance is also a key factor of FPC. The novelty of this research is to understand the performance of FPC with the help of change in physical and protective properties of fabrics. The properties studied were change in thickness (%), shrinkage (%) and mass loss (%) and their impact on the RPP of the fabrics. According to this research, the change in physical properties are very important for FPC. The findings will also assist researchers and manufacturer in the development of high durable outer layer for FPC.
Materials and Methods
Materials
Characteristics of type-A and type-B fabrics.

The experiments involved two types of fabric namely type-A and type-B, which differed both in material content and picks per inch, namely, 40, 46, and 52 PPI. Fabrics of type-A were classified as PL1, PL2, and PL3, and fabrics of type-B were classified as PL4, PL5, and PL6, according to the fabric count (Table 1). The fabrics were produced on handloom, and the thread counts were evaluated in accordance with ASTM D3775. 30
Methodology
Physical Properties
The physical properties of fabrics were evaluated by following the prescribed standard ASTM D 3776–09 for measuring mass per unit area
31
and ASTM D 1777-96 for fabric thickness (h).
32
In order to estimate the shrinkage encountered by the fabric due to exposure to radiant heat, the following procedure was adopted: The exposed area (10 cm x 10 cm) of the test specimen measuring 15 cm × 15 cm was marked with equally spaced (2 cm apart) lines along the warp and weft directions (refer to Figure 1). The dimension of each line in the warp and weft directions was measured before and after exposure to heat flux of known intensities (21 kW/m2, 42 kW/m2, and 63 kW/m2). The average dimensions of warp and weft lines falling within the exposed area were measured before and after the completion of each exposure cycle to calculate the surface area. Schematic diagram of sample holder showing the position of markings on test specimen prepared for the estimation of shrinkage on exposure to radiant heat.
Radiativeprotective performance (RPP)
The RPP rating of a test specimen exposed to radiative heat flux of known intensity was determined according to ISO 6942,
33
using an RPP tester. The tester comprised four sections: (a) a series of electrically heated quartz lamps as the source of radiative heat, (b) fabric mounting assembly provided with a centrally placed exposure area of 100 cm2 (c) a copper calorimeter, mounted on a movable insulation board following ISO 9151
34
and (d) an resistance temperature detector(RTD)sensor to detect temperature changes (Figure 2). The intensity of heat flux was controlled with a rheostat by regulating the voltage applied to the quartz lamps. The test specimen (15 cm × 15 cm) was mounted in the sample holder and placed in its designated location. The sensor was moved back and forth to ensure its proper contact with the test specimen. The output signal generated by RTD was fed to a data acquisition system, where the data was analyzed through ADAM 4015 processor and stored in the computer’s memory. A Stoll curve was constructed by recording the temporal variation of temperature to determine the protection time (Figure 2). Arrangement of components of RPP tester.
The empirical equation of Stoll curve, which relates cumulative heat (G) and time (t) is given by
The heat flux was calculated (according to ISO 9151),
35
using the equation
The above relationship is based on the assumption that the absorptivity of black paint coated on the copper calorimeter is 0.9.
Stoll and Chianta
36
established a relationship between heat flux and second-degree burns - points at which the epidermis separates out from the remaining structure of the human skin as a result of heat exposure. The Stoll curve, derived from these data,
37
quantifies the temperature and time required for a second-degree burn to occur under diverse conditions. Using the Stoll curve as reference, the duration of time needed for the unexposed side of the fabric to exceed the Stoll curve is called protection time for a given heat flux. The temperature of the opposite surface gradually rises when the test specimen is exposed to radiant heat. The processor converts temperature changes to cumulative heat flux and plots them as a function of exposure time (Figure 3). The time it takes for the cumulative heat flux to cross the Stoll curve determines the protection time. Stoll curve criteria for second-degree burn evaluated with PL1 fabric sample exposed to 63 kW/m2 of heat flux.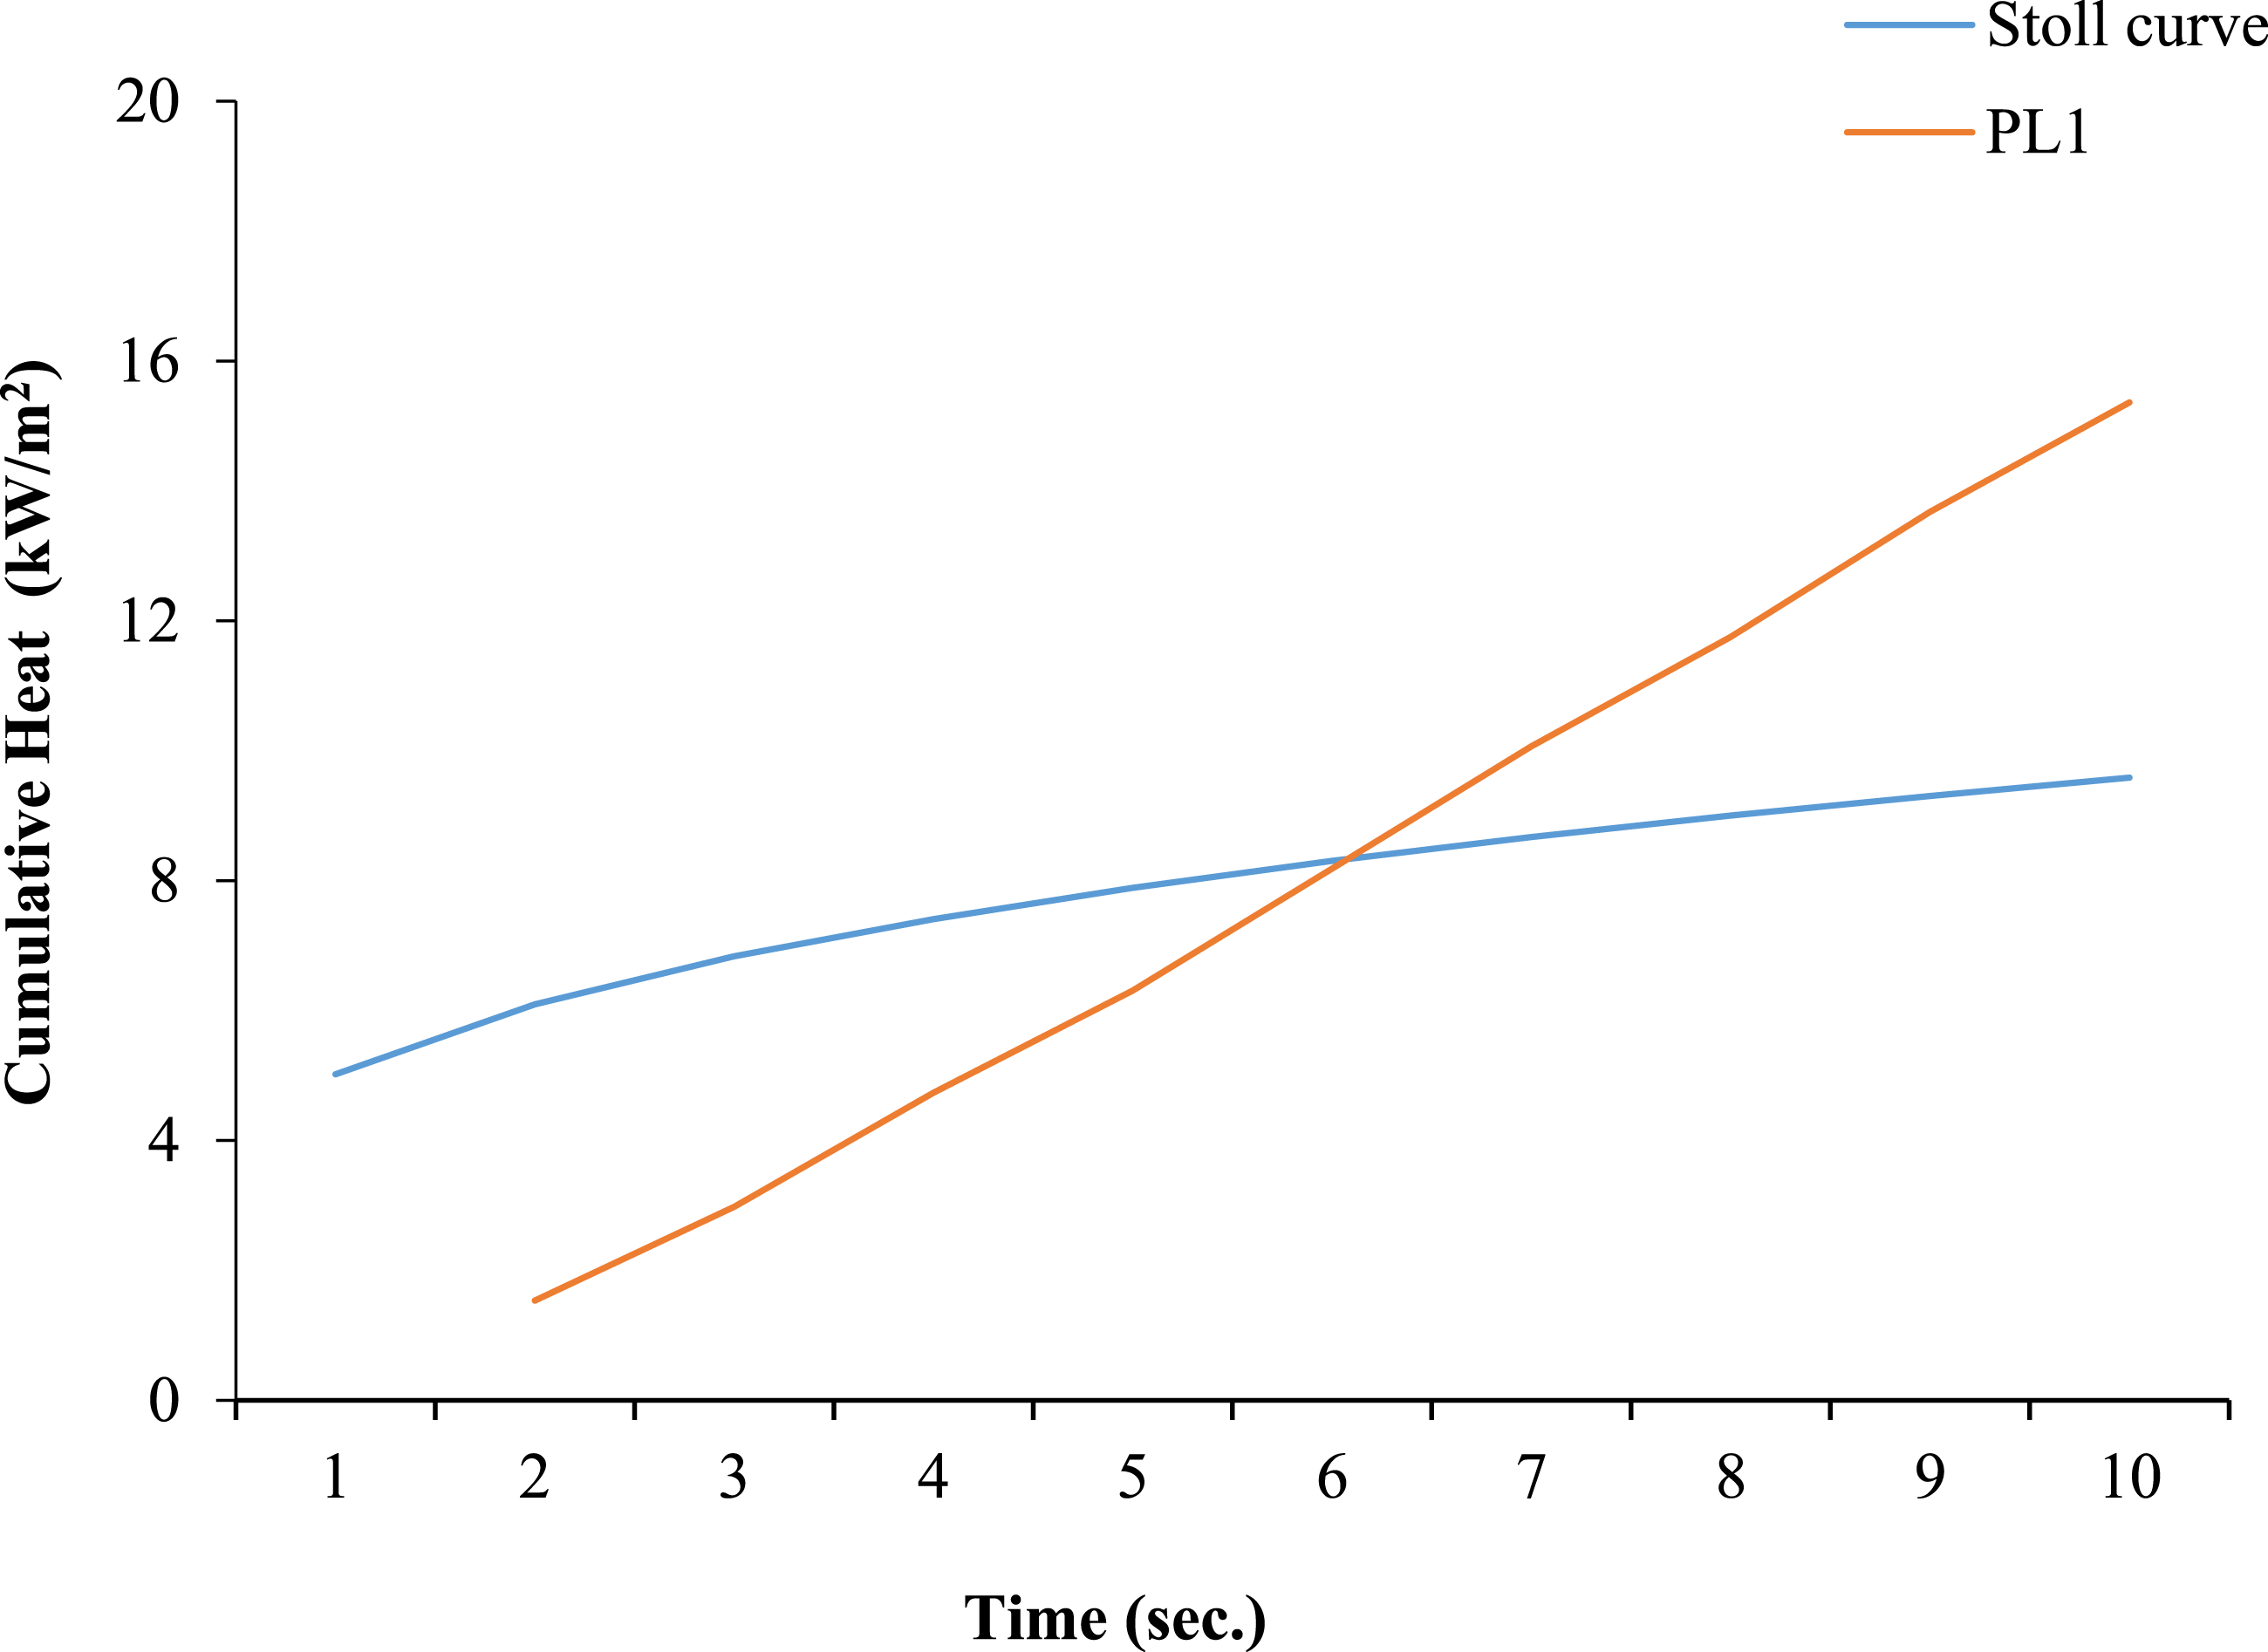
Design of Experiment
Thermal protection is an essential feature of turnout suits for firefighters. Repeated exposure of FPC to heat flux, regardless of its form (radiative, conductive or convective) can compromise its effectiveness. The performance of FPC is largely dependent on the retention of properties such as thickness (h), mass (m), surface area (SA) and RPP rating of the outer shell fabric comprising the FPC. In light of the above facts, it was deemed important to monitor the changes in the aforementioned properties when exposed to heat at a fixed intensity by using type-A and type-B fabrics.
Analysis of Raw Data
Before measuring initial values (P0) corresponding to mass loss (m0), thickness (h0), and surface area (SA0), test specimens were equilibrated at standard environment conditions (ASTM-D1776). The test specimen was then exposed to radiative heat flux for 15 s at a preset intensity (viz.21, 42, and 63 kW/m2), cooled to ambient temperature (∼32.5oC) for 30 min and its final values of m1, h1, and SA1 were evaluated immediately. Following the first cycle, which concluded with the completion of the entire operation, four more cycles were run in tandem. Between successive cycles, the exposed test specimen was equilibrated in a standard environment (27oC at 65% RH). For evaluating the performance of FPC, the most commonly applied radiant heat fluxes are 21 kW/m2 (low), 42 kW/m2 (medium), and 84 kW/m2 (high). This is because the firefighters generally experience heat flux that fall within this range depending on the type of fire. 38 In the range of high heat flux, 63 kW/m2 was used instead of 84 kW/m2, due to the limitations of the RPP tester. Each sample (PL1 to PL6) was treated in the aforementioned manner and the change in the level of the parameter (P) after each exposure cycle was calculated as follows:
Case I: p1 > p0
The generalized form of equation (3) for the nth cycle may be represented by the following eqn
Case II: p1 < p0
Results and discussion
Physical properties of the fabric
Initial physical properties and RPP rating of samples.

Experimentally determined values of mass loss (%), shrinkage (%) and change in thickness (%) at Q = 63 kW/m2 in type-A and type-B fabrics at different pick densities.

*Values in rows represent the range of estimates (expressed as %) at different pick densities.
Analysis of change in thickness
The main factor that determines the RPP rating is the thickness of the fabric.
39
Retention of the fabric thickness at extreme temperatures improves thermal protection against skin burns. As shown in Figure 4 and 5, the protection improved with an increase in fabric thickness. Rate of increase in thickness of type-A fabric as a percentage of the initial thickness at (a) Q = 21 kW/m2 and (b) Q = 42 kW/m.2. Increase in thickness as a percentage of the initial thickness at Q = 63 kW/m2 for (a) type-A fabric, (b) type-B fabric.

Effects of thermal exposure on fabric thickness at Q = 21 and 42 kW/m2
Figure 4(a) and (b) show the effect of repeated exposure to the thermal radiations at Q = 21 kW/m2 and 42 kW/m2, respectively, on the thickness of type-A fabrics. The thickness in both conditions increased linearly with an increase in the number of exposure cycles. It is assumed that all the trend lines pass through the origin because change in thickness is zero when the fabric is not exposed to heat. The slopes of the lines indicate the rate at which thickness increased with pick density. At Q = 21 kW/m2, the rate of increase in thickness was highest for PL2 (Slope = 1.081), and those for PL1 and PL3 were very close to one another [for PL1, y = 0.694x, R2 = 0.954, range = 0.4–3.7%; for PL2, y = 1.081x, R2 = 0.974, range = 0.6–5.2%; for PL3, y = 0.758x, R2 = 0.975, range = 0.4–3.9%]. The correlation coefficients of linear regression lines were high in all cases (>0.95).The rates decreased in the order PL2 > PL3 > PL1. Upon exposure of type-A fabrics to heat fluxes at 42 kW/m2, the rates decreased in the order PL3 > PL1 > PL2 [for PL1, y = 1.480x, R2 = 0.973, range = 1.8–7.3%; for PL2, y = 1.95x, R2 = 0.989, range = 1.6–9.6%; for PL3, y = 2.802x, R2 = 0.964, range = 3.9–13.7%]. Under heat fluxes at 21 kW/m2and 42 kW/m2, the thickness of type-B fabrics did not change significantly from its initial value, and therefore the experimental results have not been reported in detail.
Effects of thermal exposure on thickness of fabrics at Q = 63 kW/m2
Fabrics behaved differently when exposed to radiative heat at 63 kW/m2 [see Figure 5 (a) and 5(b)]. The thickness of type-A fabric increased by 3%–4% after the first exposure cycle at Q = 63 kW/m2, and by 25–30% after five exposure cycles [ in PL1, y = 0.250x2 + 4.695x–1.130, R2 = 0.998, range = 3.7–28.8, POI = (−9.4,–23.2), upward; in PL2, y = 0.907x2 + 0.383x + 1.048, R2= 0.995, range = 2.6–25.2, POI = (−0.2, 1.0), upward; in PL3, y = 0.785x2 +1.034x + 2.157, R2= 0.996, range = 3.9–26.8, POI= (−0.7, 1.8), upward]. Comparing type-B fabrics (see Figure 5b), the corresponding changes range between 2-3% and 7–12% [in PL4, y = 0.375x2 − 0.018x + 2.412, R2 = 0.985, range = 2.9–11.8, POI = (0.02, 2.4), upward; in PL 5, y = 1.403x + 0.245, R2 = 0.987, range = 1.8–7.1%; in PL 6, y = 0.399x2–0.763x + 2.237, R2 = 0.997, range = 1.8–8.5%, POI = (1.0, 1.9), upward]. Thickening might have been caused by (a) encrustation on the fabric surface or (b) shrinkage as the result of exposure to radiative heat. The trend line for thickness against exposure followed a parabolic equation with a high correlation coefficient. All fabrics constructed with various pick densities show the same pattern. The trend lines obeyed parabolic equations (y = ax2 + bx + c) for fabrics of both type-A and type-B, regardless of pick density. Parabolic pass through point of inflection (POI), the vertex, which resides on an axis of symmetry. Vertex coordinates were located as follows:
The equation representing the parabola may be written as
Taking the derivative
At POI
The value of abscissa corresponding to the vertex was determined by putting the values of a and b in equation (6) and that of the ordinate by plugging the value of x in regression equation. If the coefficient ‘a’ of x2 is negative, then the vertex is located at the maximum and the parabola opens in downward direction. The parabola opens upwards if ‘a’ is positive, and here the point of inflection (POI) represents the minimum. With the exception of PL 5 in Figure 5(b), the regression equation for each of the fabrics, PL1 to PL 6 was parabolic bearing positive values for ‘a’ suggesting that each trend line had upwards direction (refer to Figure 5). The best fitting line for PL 5in Figure 5(b) was a straight line (Slope = 1.403 and Intercept = 0.245).
Analysis of change in surface area
Shrinkage and retained surface area (RSA) are inter-related as
Equation (9) allowed expressing the converse of RSA as percent shrinkage.
Effects of thermal exposure on shrinkage of fabrics at Q = 21 and 42 kW/m2
The relationship between shrinkage, pick density, number of exposure cycles, and the intensity of heat flux Q has been established empirically. Type-A fabrics experienced shrinkage of 0.5–2.2% at low heat flux levels (21 kW/m2). As the number of exposure cycles and pick density were increased, shrinkage increased linearly (Figure 6). The correlation coefficients were high and the regression line had a negative intercept on the y-axis in each case. [in PL1: y = 0.199x − 0.131, R2 = 0.923, range = 0.50–0.90; in PL2: y = 0.288x – 0.087, R2= 0.983, range = 0.50–1.40; in PL3: y = 0.526x − 0.472, R2= 0.998, range = 0.6–2.19]. Compared to PL2 and PL3, the regression equation associated with PL1 had a lower R2 value. Analysis of shrinkage data for type-A fabrics at medium heat flux of Q = 42 kW/m2 [in PL1, y = 0.690x − 0.504, R2 = 0.959; in PL2, y = 0.772x − 0.310, R2 = 0.976; in PL3, y = 0.882x − 0.577, R2 = 0.952] showed a non-linear path in each case. The R2 values obtained for the second-degree polynomial regression lines were moderately high. Furthermore, due to heat fluxes increasing from 21 kW/m2 to 42 kW/m2, percent shrinkage did not rise significantly (ranging from 0.4–3.17, 0.4–3.37, and 0.8–3.76 for PL1, PL2, or PL3, respectively). The estimates of fabric mass, shrinkage, and thickness using Q = 63 kW/m2, indicated that the values are significantly lower in type B fabrics than in type A fabrics. In type B fabric, the magnitude of estimates was very low, especially at low (21 kW/m2) and medium (42 kW/m2) intensity of heat fluxes, and there was very little variation between successive data points. In consideration of this, further analysis of the fabric B data for the low and medium heat fluxes was not conducted. Shrinkage profile of type-A fabrics as a function of the number of thermal exposure cycles at (a) Q = 21 kW/m2 and (b) Q = 42 kW/m2; values are expressed as a percentage of initial surface area.
Effects of thermal exposure on shrinkage of fabrics at Q = 63 kW/m2
From PL1 to PL6, the trend lines for the percent shrinkage as a function of thermal exposure cycles followed linear equations at Q = 63 kW/m2 for type A fabrics [in PL1, y = 2.158x − 1.425, R2 = 0.951, range = 0.90–10.23; in PL2, y = 2.420x − 0.28, R2 = 0.997, range = 2.19–11.64; in PL3, y = 2.641x + 0.377, R2 = 0.998, range = 3.08–13.51] and type B fabrics [in PL4, y = 0.661x + 0.536, R2 = 0.990, range = 0.11–3.76; in PL5, y = 0.748x + 0.790, R2 = 0.994, range = 1.59–4.65; in PL6, y = 1.378x − 0.048, R2 = 0.956, range = 1.59–7.36] (see Figure 7). Generally, the correlation coefficients hover around 0.99 in each set of experiment, with PL1 and PL6 standing out as the exceptions. The shrinkage of type-A fabrics with equal number of thermal exposure cycles are significantly higher than those of type-B fabrics. It establishes that blending of Kevlar® with Nomex® (as in Type-B fabrics) considerably improve the resistant to shrinkage Shrinkage profile of (a) type-A and (b) type-B fabrics as a function of the thermal exposure cycles at 63 kW/m2; increase in shrinkage calculated as a percentage of initial surface area of fabric.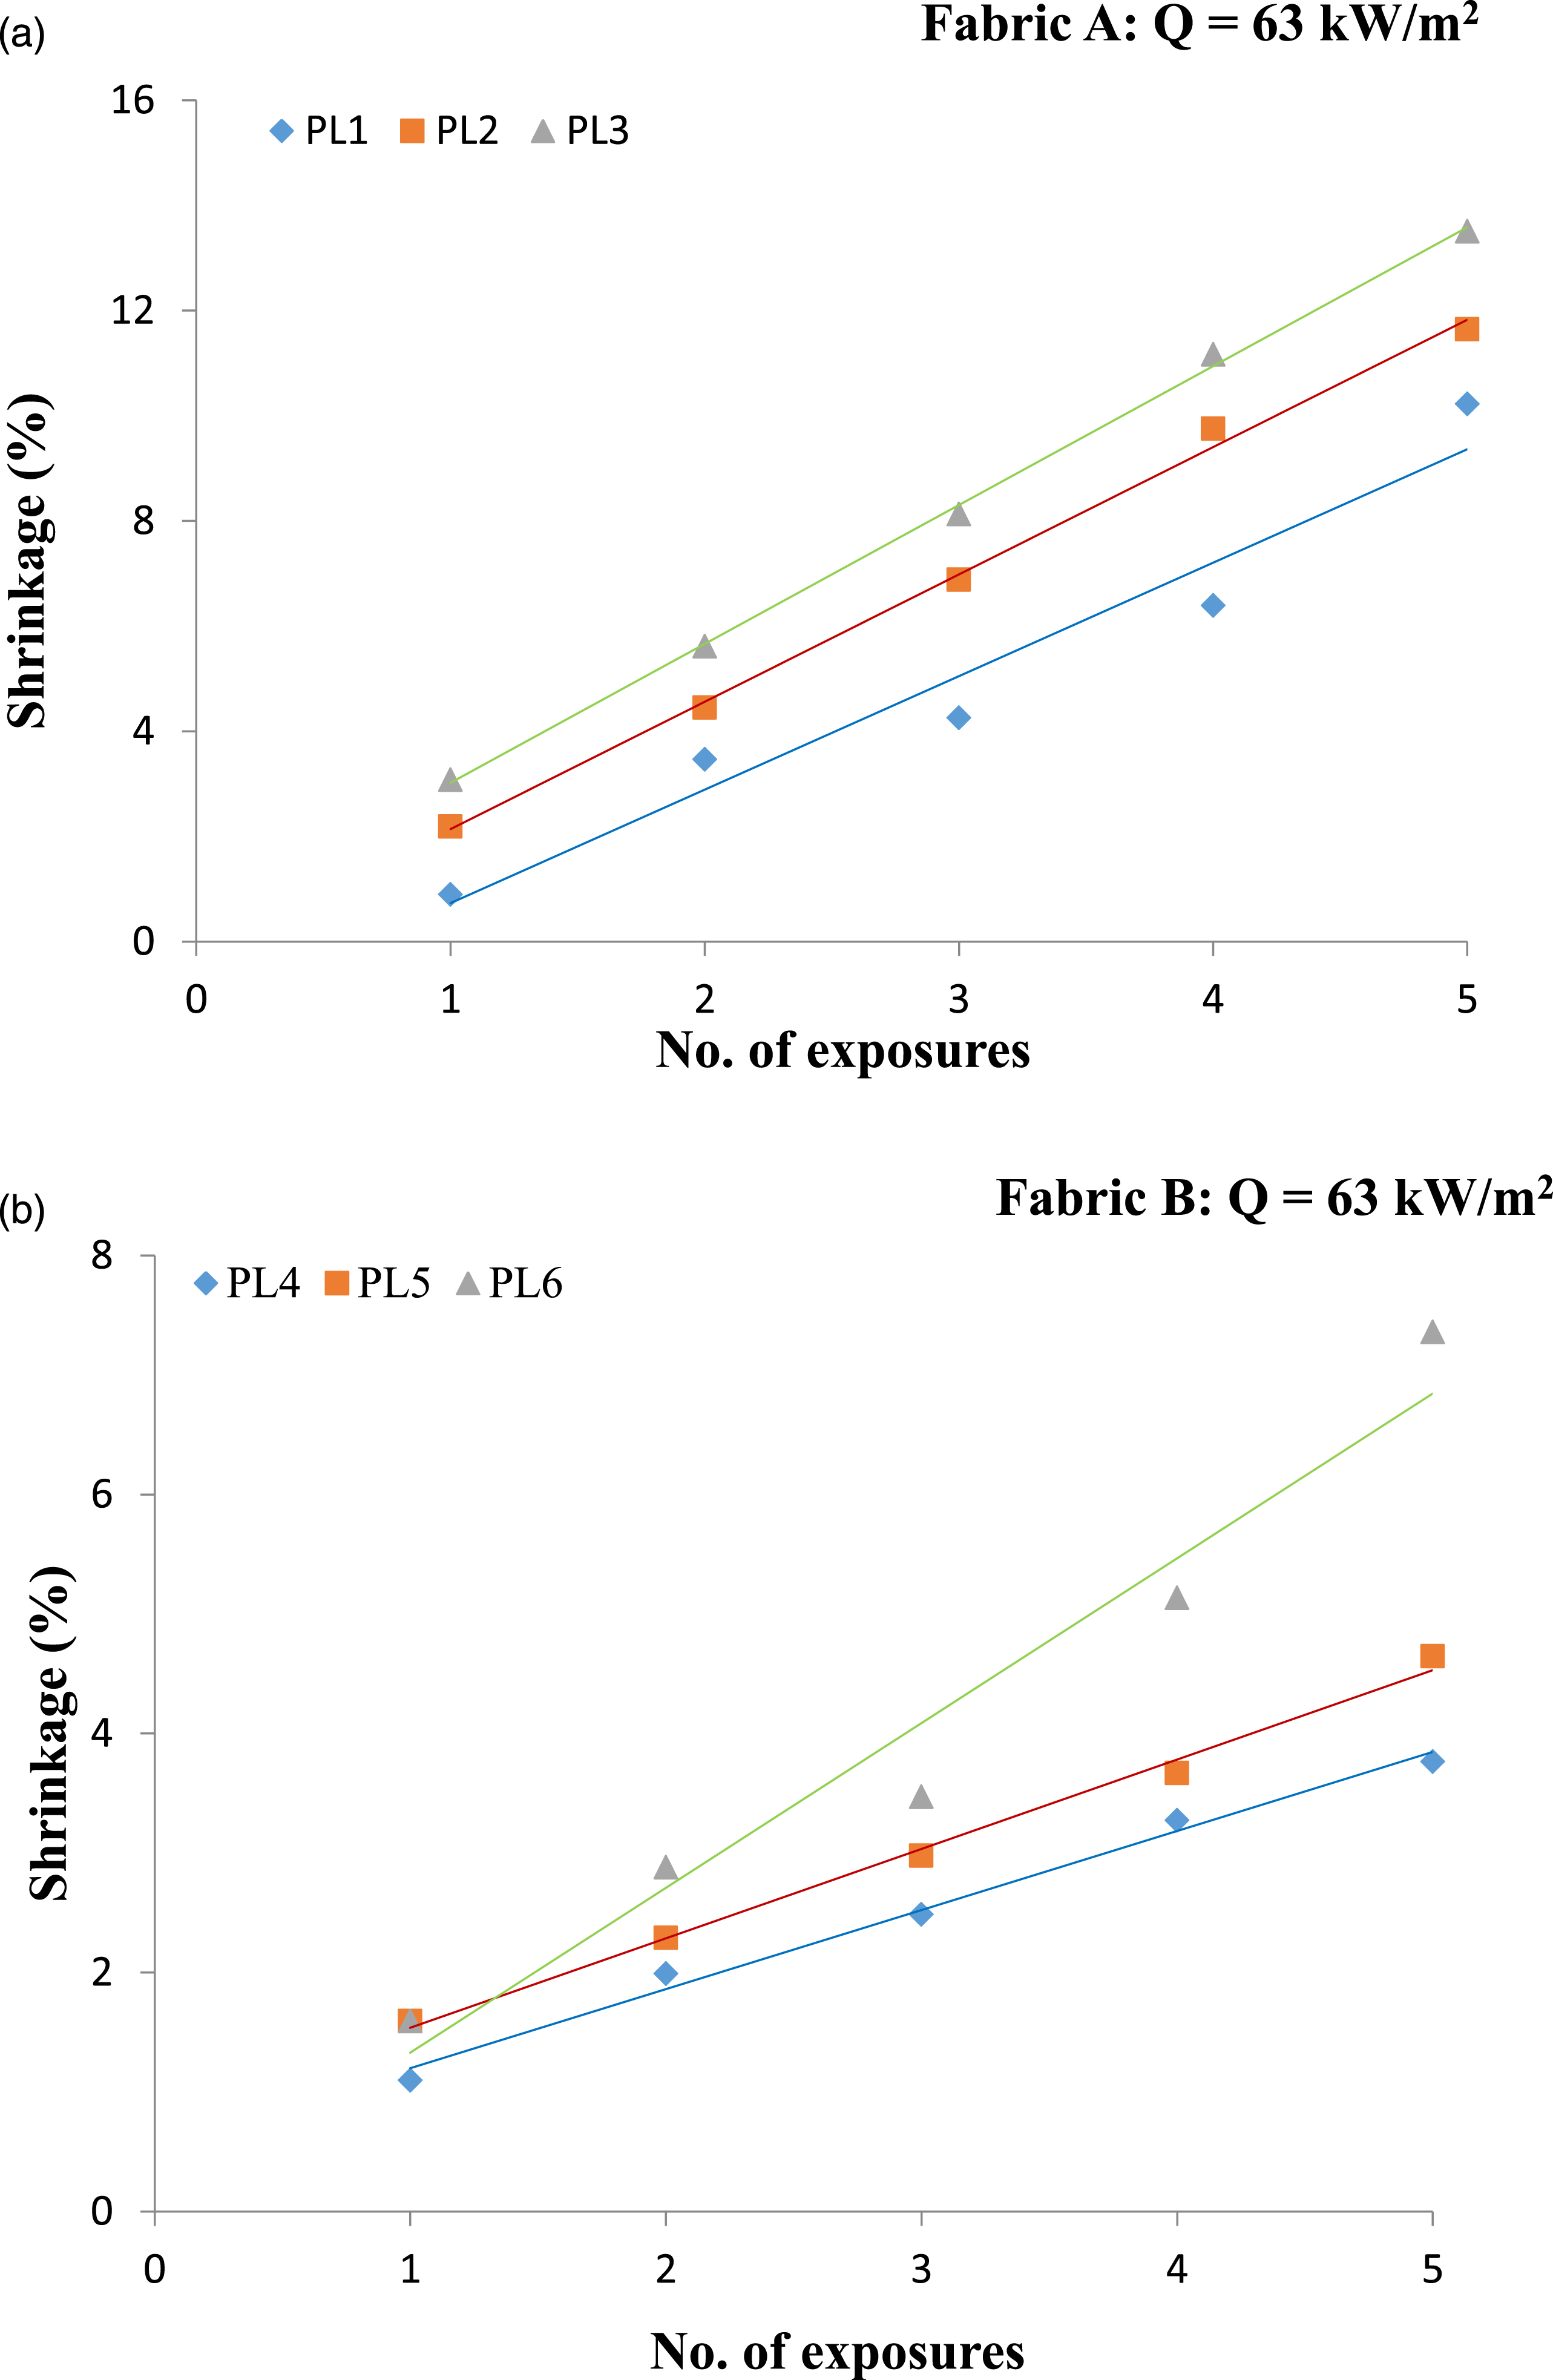
Analysis of change in Mass
When repeatedly exposed to Q, both type-A and type-B fabrics suffered loss of mass, with mass dependent on the type of material, pick density, intensity of heat flux and the number of exposure cycles.
Effects of thermal exposure on mass of fabrics at Q = 21 and 42 kW/m2
At Q = 21 kW/m2, mass loss (%) in type-A fabric ranged between 0.2 and 1.12%, depending on number of exposure cycles and pick density. The trend lines for PL1, PL2, and PL3fit into quadratic (or parabolic) equations [in PL1, y = −0.008x2 + 0.165x + 0.022, R2 = 0.979, range = 0.20–0.64%, POI = (8.86, 0.81), downward; in PL2, y = −0.007x2 + 0.165x − 0.086, R2 = 0.987, range = 0.08–0.54%, POI = (10.3, 0.87), downward, in PL3, y = 0.019x2 − 0.015x + 0.105, R2 = 0.992, range = 0.10–0.53%, POI = (−2.3, −0.04), upward] (See Figure 8). Since the coefficients of x2 in the regression equations of PL1 and PL3 are negative, the curves will open downwards with the vertex falling at the maximum. A parabolic trend line is also observed for PL3 that opens upwards, suggesting that mass loss (%)will always on the rise with an increasing number of thermal exposure cycles. Change in mass at (a) 21 kw/m2 and (b) 42 kw/m2 of type-A fabrics expressed as a percentage of the original mass.
At Q = 42 kW/m2, the regression equations corresponding to PL1 and PL3 are straight lines [in PL1, y = 0.145x + 0.420, R2 = 0.982, range = 0.53–1.12%; in PL2, y = 0.040x2 – 0.029x + 0.226, R2 = 0.991, range = 0.22–1.11%, POI = (0.36, 0.52), upwards; in PL3, y = 0.168x+0.027, R2 = 0.995, range = 0.20–0.85%]. The regression line for PL2 fits into a parabolic equation with opening direction upwards. Type-A fabric exhibits marginal mass loss when Q is set at either 21 kW/m2 or 42 kW/m2.
Effects of thermal exposure on mass of fabrics at Q = 63 kW/m2
There are tangible changes in mass loss (%) for both type-A and type-B fabrics at Q = 63 kW/m2 (see Figure 9). The trend lines of all curves are parabolic and the regression equations (y=ax2 + bx + c) contain negative ‘a’ values, indicating that they all open downward and have real maxima [in PL1, y = −0.076x2 + 0.972x + 0.378, R2 = 0.997, range = 1.3–3.4%, POI = (6.4, 3.5), downward; in PL2 y = −0.052x2 + 1.006x + 0.378, R2 = 0.991, range = 1.4–4.1%, POI = (9.7, 5.2), downward; in PL3, y = −0.132x2 + 1.623x-0.075, R2 = 0.999, range = 1.4–4.7%, POI = (6.1, 4.9), downward]. Upon applying the first exposure cycle to type-A fabric, the mass loss (%) increased gradually with pick density (slope of PL3 > PL2 > PL1). In contrast, percent mass loss in type-B fabrics are slightly different in that the regression lines of PL4 and PL5 strongly overlap throughout the experimental space [in PL4, y = −0.071x2 + 0.820x + 1.686,R2 = 0.997, range = 2.5–4.0%, POI = (5.8, 4.10), downward; in PL5, y = −0.013x2 + 0.490x + 2.009, R2 = 0.998, range =2.5–4.1%, POI =(18.8 6.6%), downward; in PL6, y = −113x2 + 1.161x +1.636, R2 = 0.993, POI=(5.1,4.6%), downward] (as shown in Figure 9). Both types of fabrics incurred mass losses that never exceeded 5% of their original masses. Increase in mass loss (%) in (a) type-A and (b) type-B fabrics with an increase in the number of exposure cycles at Q = 63 kW/m.2.
Analysis of RPP Ratings and its retention
Table 2 summarizes the initial RPP ratings of all fabric samples. RPP rating of type-A fabric samples at Q = 21 could not be evaluated since protection times of fabrics are greater than the exposure time (15 s). In type-A fabrics, the RPP ratings do not change appreciably for Q = 42 kW/m2, and in type-B fabrics, the RPP ratings are higher than those of type-A fabrics. For Q = 63 kW/m2, the RPP rating holds a linear relationship with number of exposure cycles (see Figure 10), the RPP appearing to have improved as a result of increased thickness and shrinkage [in PL1, y = 0.478x + 9.084, R2 = 0.992, range = 9.49–11.47; in PL2, y = 0.46x + 9.626, R2 = 0.974, range = 9.95–11.89; in PL3, y = 0.51x + 9.914, R2 = 0.985, range = 10.4–12.54]. For fabrics of type B, the regression equations are also linear with high R2 values [in PL4, y = 0.414x + 10.11, R2 = 0.996, range = 10.56–12.23; in PL5, y = 0.329x + 10.80, R2 = 0.996, range = 11.17–12.46; in PL6, y = 0.308x + 11.62, R2 = 0.998, range = 11.93–13.17]. The maximum RPP of these fabrics is 13 cal/cm2 when the pick density is adjusted to 52 PPI (PL6). RPP improves because thermal shrinkage increases the fabric thickness after multiple exposure cycles. Fabrics of Type-A performs similarly on all counts (R2 > 0.99) and has RPP ratings ranging from 9.5 to 12.5 as compared to 10.6 to 13.1 for type-B fabrics. It is apparent that the enhancement of the RPP rating is made possible by Kevlar® fibers, but pick density is equally important. Increment in RPP ratings (cal/cm2) of (a) type-A and (b) type-B fabrics with an increase in the number of exposure cycles at 63 kW/m.2.
The performance of FPC may be evaluated from its RPP rating and other physical properties (change in mass, thickness and surface area of fabric) – the higher the RPP rating more durable is the fabric. Earlier studies showed that the outer shell fabrics suffered a loss of tear strength after repeated exposure to heat, while their flame-resistant properties remained virtually unchanged. 40 When multiple exposures to FPC were applied, fabric performance was reduced because thickness, surface area, and mass were altered. If the incident heat flux is sufficiently strong and the fabric is exposed to enough heat cycles, the fabric can gain adequate energy to affect the thermal insulation. With higher numbers of cycles, the fabric’s performance declined gradually. 23
Impact of pick density on RPP rating of type-A
In the backdrop of the above mentioned reports in the literature, the subsequent investigation was focused on establishing the interrelation between RPP, mass loss (%), shrinkage (%), and thickness with increase in the exposure cycles at Q = 63 kW/m2. When type-A fabric with a pick density of 40 PPI (PL1) was exposed at Q = 63 kW/m2, the mass loss-RPP profile showed linear relationship with an increase in the number of exposure cycles [Figure 11(a), y = 0.904x + 8.271, R2 = 0.976].Using same settings for shrinkage and thickness measurements, the trend lines obtained conformed to quadratic equations for shrinkage [Figure 11(b), y = −0.013x2 + 0.365x + 9.148, R2 = 0.986, POI = (14.04, 11.33), downward] and thickness [Figure 11(c), y = −0.0009x2 + 0.107x + 9.138, R2 = 0.997, POI = (59.4, 18.7), downward], and the curves opened downwards in both cases. At pick density of 46 PPI (PL2), plots of mass loss-RPP[(Figure 12(a)), y = −0.073x2 + 1.057x + 8.681, R2 = 0.969, POI = (7.24, 12.6), downward], shrinkage-RPP [(Figure 12(b)), y = −0.008x2 + 0.308x + 9.373, R2 = 0.976, POI = (19.3, 12.7), downward], and thickness-RPP profiles [(Figure 12(c)), y = −0.002x2 + 0.154x + 9.761, R2 = 0.931, POI = (38.5,9.55), downward] obeyed quadratic equations. At pick density of 52 PPI (PL3), mass loss-RPP trend line followed quadratic equation [(Figure 13(a)), y = 0.115x2 – 0.123x + 10.40, R2 = 0.962, POI = (0.53, 10.01), upward]. Shrinkage-RPP [(Figure 13(b), y = 0.192x + 9.844, R2 = 0.982)], and thickness-RPP [(Figure 13(c)), y = 0.087x + 10.23, R2 = 0.974)] had strong linear relationships. Effects of mass loss (%), shrinkage, and change in thickness on RPP at pick density of 40 PPI in type-A. Effects of mass loss (%), shrinkage, and change in thickness on RPP at pick density of 46 PPI in type- A fabrics. Effects of mass loss (%), shrinkage, and change in thickness on RPP at pick density of 52 PPI in type- A fabrics.

Impact of pick density on RPP rating of type-B fabrics
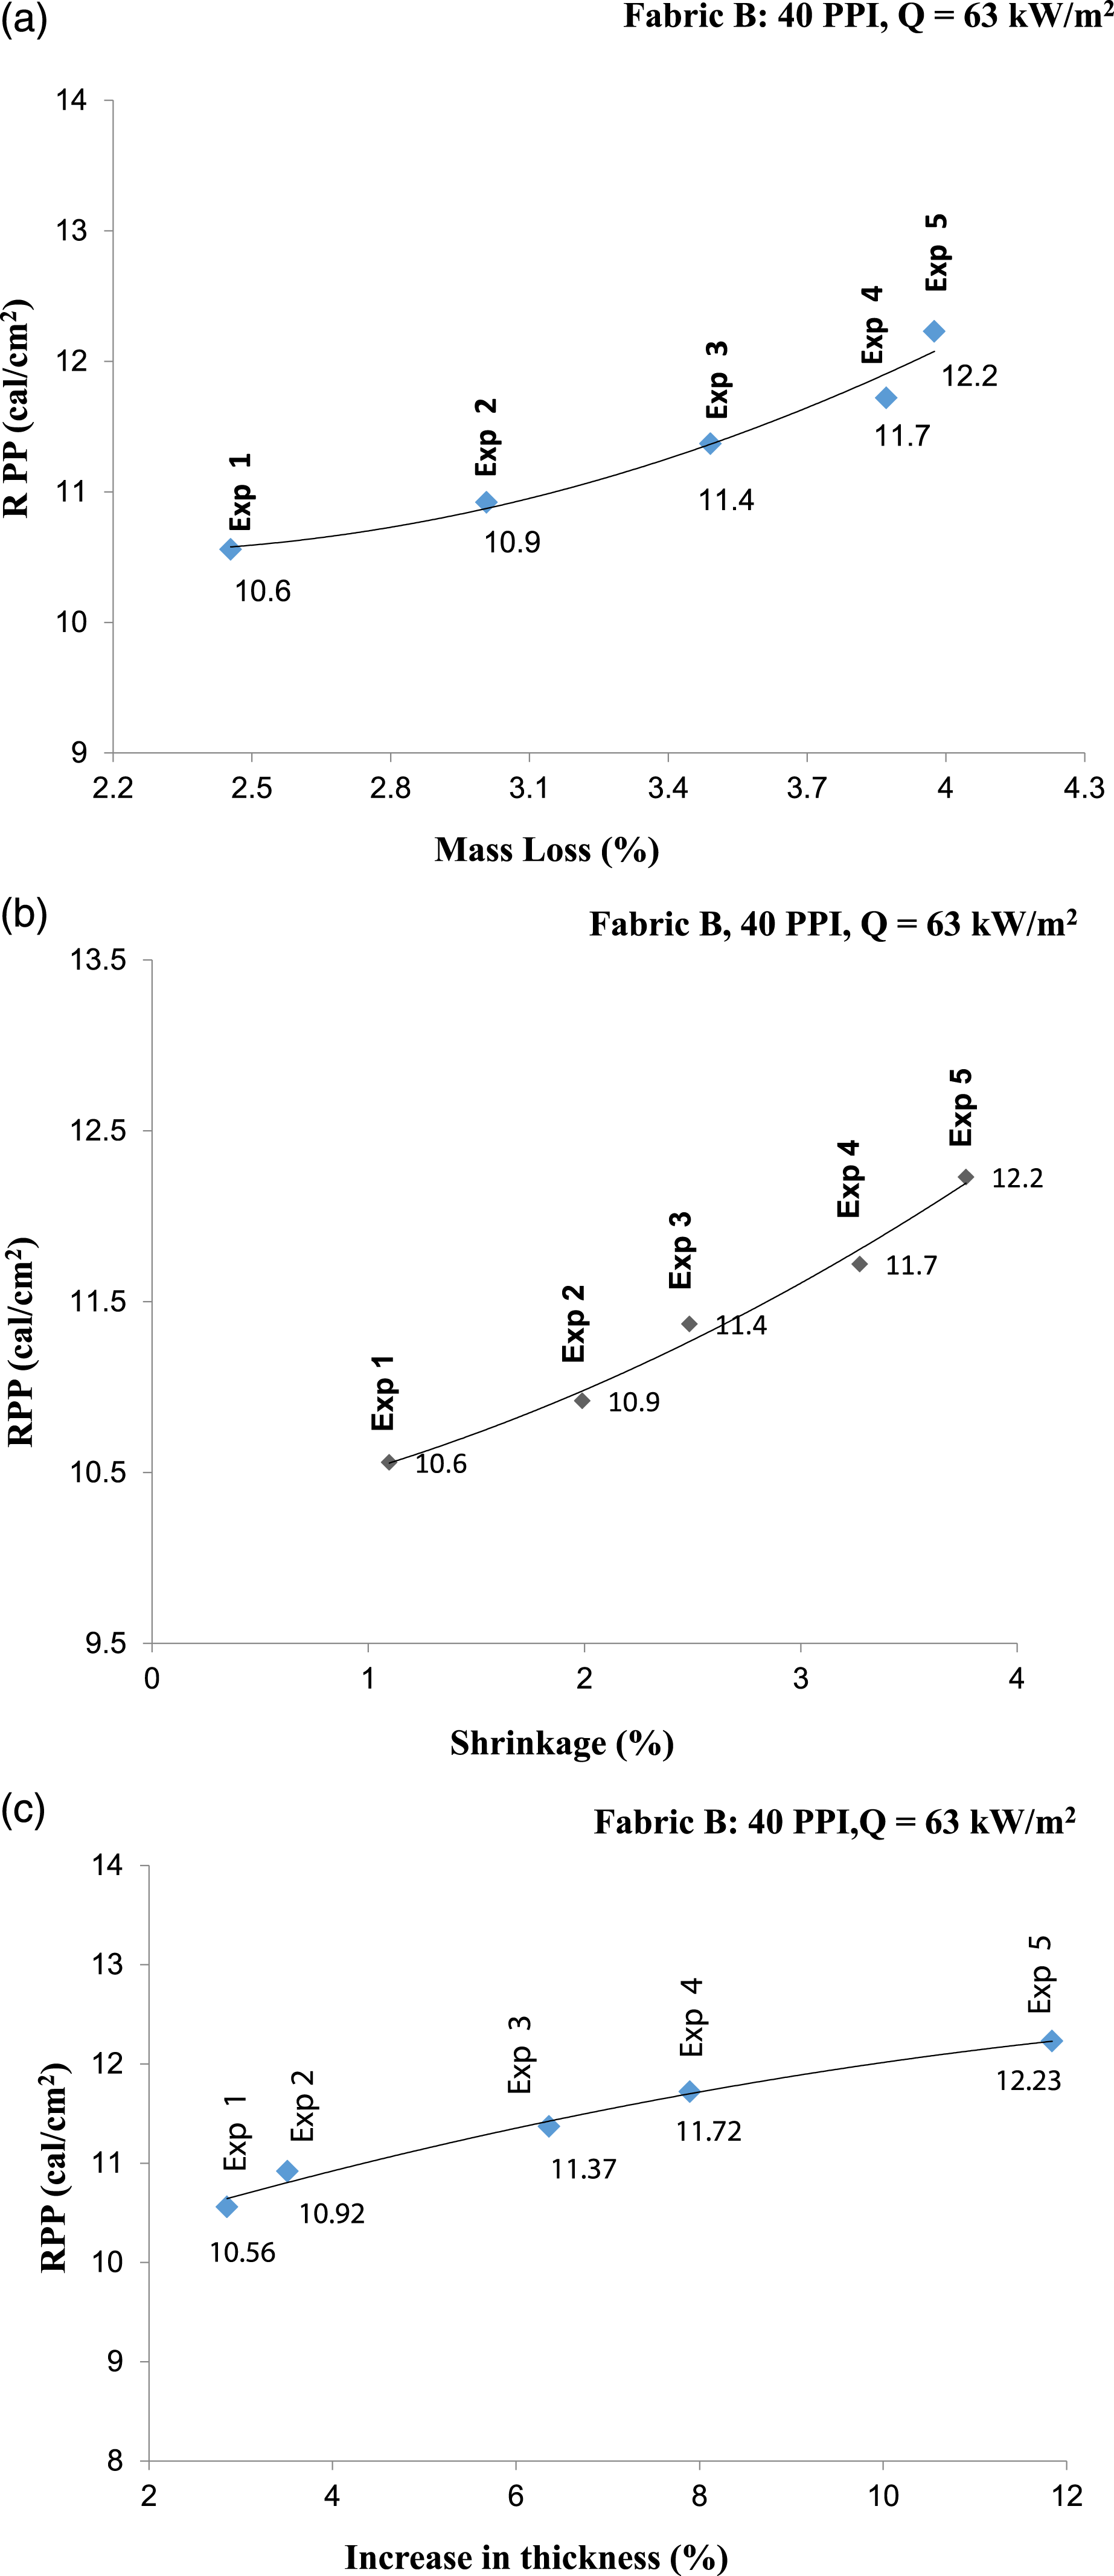
In case of type-B fabric, at 40 PPI (PL4), the regression lines for all of mass loss-RPP [(Figure 14(a)),y = 0.467x2 − 2.020x + 12.72, R2 = 0.964, POI = (0.47, 11.9), upward], shrinkage-RPP [(Figure 14(b)), y = 0.079x2 + 0.226x + 10.21, R2 = 0.986, POI = (−1.43, 9.7), upward], and thickness-RPP plots [(Figure 14(a)), y = −0.008x2 + 0.3x + 9.855, R2 = 0.986, POI = (18.75, 12.67), downward], obeyed quadratic equations. At pick density of 46 PPI (PL5), Figure 15 illustrates the quadratic regression equation relationship between mass loss-RPP [Figure 15(a) (y = 0.146x2 − 0.159x + 10.65, R2 = 0.998, POI = (0.54, 10.02), upwards], shrinkage-RPP [(Figure 15(b), y = 0.437x + 10.46, R2 = 0.993], and thickness-RPP [Figure 15(c), y = −0.025x2 + 0.453x + 10.45, R2 = 0.999, POI = (9.06, 11.9), downward]. Effects of mass loss (%), shrinkage, and change in thickness on RPP at pick density of 40 PPI in type- B fabrics. Effects of mass loss (%), shrinkage, and change in thickness on RPP at pick density of 46 PPI in type

At pick density of 52 PPI (PL6), The mass loss-RPP plots produced quadratic regression equation (Figure 16(a), y = 0.23x2 – 1.097x + 13.23, R2 = 0.949, POI = (23.8, 12.5), upwards), while the trend lines of shrinkage-RPP [(Figure 16(b)), y = 0.213x + 11.67, R2 = 0.953)], and thickness-RPP profiles were linear [(Figure 16(c), y = 0.216x + 11.58, R2 = 0.979)]. Effects of mass loss (%), shrinkage, and change in thickness on RPP at pick density of 52 PPI in type-B fabrics.
Conclusions
The performance of thermal protective clothing is greatly affected by heat. Since the outer shell fabric comes close to a high-risk environment during an operation, it was deemed necessary to conduct an in-depth investigation on the effects of heat on type-A (Nomex® IIIA yarn in both warp and weft directions) and type-B fabrics (Nomex® IIIA yarn in warp and Kevlar® yarn in weft directions). The major conclusions drawn from the above study may be summarized as follows. 1. The physical properties like thickness, surface area and mass with RPP ratings of fabrics contribute to their performance. The thickness of fabrics increases with an increase in pick density, and an increase in the number of thermal exposure cycles. This rule applies to both types of fabrics. The increase in thickness values ranges from ∼2.5 to 30% for type-A and 3-to 12% for type-B fabrics. 2. Thermally-induced shrinkage occurs in both types of fabrics, but ∼90–95% of the original surface area is retained. Type-A fabrics retain 88% of surface area, and type-B fabrics nearly 95%. In either fabric type with a pick density of 46 ppi, the amount of shrinkage after one exposure was less than 1%. 3. There was a loss of mass within 5% of the original mass for the fabric test specimens. This loss was attributed to the removal of volatile substances and absorbed moisture from the fabrics. Regression analysis revealed that the trend lines follow quadratic equations in many cases. 4. Thermally exposed fabrics shrink and become thicker during the cooling process. In shrinkage fabrics, the yarns come closer together, and the mass per unit area increases. Higher RPP ratings are obtained for outer shell fabrics that shrink more. In a similar vein, increasing picks per inch will increase mass per unit area and consequently improve the RPP rating. 5. In both types of fabrics, the effect of thermal exposure cycles (1–5 cycles) on RPP was investigated at three levels of Q (21, 42, and 63 kW/m2) and three levels of pick density (40, 46, and 52 PPI). The RPP was evaluated by maintaining PPI at a fixed level (40, 46, or 52 PPI) and Q at 63 kW/m2. An empirical relationship between RPP and mass loss (%), shrinkage (%), and thickness (%) was established using regression analysis. In many cases, the trend lines follow quadratic equations with high correlation coefficients, indicating that the RPP has either a maximum (or a minimum) value at POI. The regression analysis also determined that the pick density of the outer-shell fabric strongly influences its performance.
Footnotes
Declaration of conflicting interests
The author(s) declared no potential conflicts of interest with respect to the research, authorship, and/or publication of this article.
Funding
The author(s) received no financial support for the research, authorship, and/or publication of this article.