
Abstract
The present study reports the mechanical performance of polytetrafluoroethylene (PTFE) coated fabrics. Glass fabrics with two weave structures, three dimensional plain-woven knitted (3D) and satin weave (SW) were tested. These fabrics were coated with PTFE in different weight percentages (30% and 60%). Mechanical tests included uniaxial tensile, tear (double tongue and pendulum tear), puncture, yarn pull-out and low-velocity impact (LVI) tests. The influence of weave pattern and PTFE coating on these mechanical properties was investigated. In the case of yarn pull-out and tensile tests, 60% PTFE coated glass fabrics exhibited better performance due to the increased adhesive bonding and inter-yarn friction. However, the 30% PTFE coated glass fabrics exhibited better performance for tear, puncture, and LVI tests. The SW fabrics exhibited superior performance to the 3D fabrics in all the mechanical tests performed. Overall, the results indicate that SW fabrics offer better mechanical performance than 3D fabrics under different loading conditions. In terms of coating percentage, 30% PTFE coated fabrics exhibited better mechanical performance than the 60% coated ones.
Introduction
Coated woven fabrics are technical textile fabrics widely used in canopies, flexible civil structures, protective clothing, anti-wear system, stadiums, gymnasiums and airport lounges.1-3 These fabrics offer a high strength-to-weight ratio, making them suitable to cover large spaces. Coated fabrics provide dimensional stability and strength while coating protects the fabric from external elements, such as water and air, and stabilizes the weave. 4 Typically used fabrics are hemp, wool, cotton, glass, basalt and nylon, with coatings such as vinyl, neoprene, polyvinylchloride (PVC) and PTFE.5-7
Although many textile structures like woven, nonwoven, braided and knitted are available, typically woven and nonwoven fabrics are used. Glass fabric is commonly used due to high dimensional stability and nonflammability.8-9 In general, glass fibres are coated with PVC and PTFE. PVC coated glass fabric exhibits relatively low strength and is susceptible to UV rays. PTFE coated glass fabrics, on the other hand, have good resistance to climatic conditions, are fireproof, have good self-cleaning properties, are water repellent and has anti-adhesive properties.8,10,11
The mechanical performance of coated fabrics is usually characterised in terms of tensile strength, strain to failure, tear strength and energy absorption. Anisotropic tensile behaviour of plain-woven fabrics was reported in Ref. 12,13 through the measurement of tensile performance of the fabrics in different directions apart from the constituent yarn’s orientation.
The studies of Luo et al. 14 and Luo and Hu 15 suggested that PVC coated fabric’s tensile and tearing behaviour decreased with an increase in the initial crack length. Pamuk and Ceken 16 applied statistical theory to model the technical fabrics under a tear strength test. Zhang et al. 1,17-19 performed uniaxial and biaxial tensile tests to obtain tensile strength and failure strain. It was reported that the mechanical properties of coated woven fabrics mainly depend on the woven substrate, crimp interchange of yarns and properties of the coating. Sun et al. 20 studied the puncture behaviour of three woven fabrics (woven fabrics, plain woven, 2/2 twill woven, and 2/1 twill) through experimental methods. The results showed that the yarn strength and yarn pull-out behaviours significantly influence the fabric’s performance. Stab and puncture resistance of Kevlar fabric coated with polyethylene 21 and Al2O3–13 wt% TiO2 plasma sprayed ceramic coating 22 was studied and proved that the coating of polyethylene significantly improves the stab and puncture resistance. Sebastian et al. 23,24 and Motamedi et al. 25 reported early yarn pull-out of plain-woven cotton fabrics. Nilakantan et al. 26,27 reported the correlation between the probabilistic impact response of woven Kevlar fabrics to the yarn pull-out response. Ambroziak, 28 Kato 29 and Klosowski 30 performed uniaxial and biaxial tensile tests on PTFE and PVC coated fabrics. Also, reported the tearing performance of coated fabrics (automobile seat covers), 31 upholstery flocked fabrics 32 and cotton. 33
When coated fabrics are used as canopies, floor panels, air-inflated domes and tents, they undergo sudden tearing, puncture, tension and shear due to external conditions and the impact of sharp objects. The main reason for most of the coated fabrics' failure was the failure due to wind-borne debris, especially for coastline cities. It is necessary to study the impact properties of these fabrics for such applications. 34 The strength and failure of coated fabrics are complex and essential issues. 34 These properties depend not only on the material’s inherent nature but also on the loads and environmental factors. The above-discussed results mainly reported the mechanical performance of PTFE coated two dimensional (2D) plain woven fabrics. The 2D fabrics have lower in-plane shear strength and can be enhanced by replacing 2D fabrics with 3D fabrics. The presence of yarn in the thickness direction improves the in-plane stiffness and fracture toughness of the fabrics. The mechanical properties of the warp and weft yarns do not fully utilise the presence of crimp within the fabric structure. Therefore, using the fabric structure with a lower yarn crimp is recommended to impart adequate mechanical strength.35-38
To the best of the author’s knowledge, there are no studies available on the mechanical performance of PTFE coated 3D and SW fabrics. The inferences made based on the present study facilitate engineers in selecting the best fabric to be used in the applications like gymnasiums, stadiums, exhibition halls and airport lounges.
This paper presents the influence of PTFE coating and weave patterns on the mechanical performance of PTFE coated glass fabrics. Two weight percentages of PTFE (30% and 60%) were coated onto the glass fabrics. The mechanical performance was assessed through uniaxial tensile, puncture, double tongue tear, pendulum tear, yarn pull-out and LVI. The response was analyzed through time histories and failure analysis.
Experimental
Materials
PTFE coated 3D and SW glass fabrics were supplied by Taconic International Ltd, Mullingar, Ireland. The 3D fabric was constructed by knitting two 2D plain woven fabrics in the thickness direction. According to the supplier’s communication, the PTFE coated fabrics were produced by a multipurpose coating process, in which fabric was submerged into a dispersion pan. The PTFE dispersion had a particle size of 0.25 μm. The description of the coating process was provided in Ref.
39
. The weight fractions of PTFE in the fabrics were 30% and 60%. Since the coating process is proprietary, coating schematics are not presented. The surface images and properties of the fabrics are presented in Figure 1 and Table 1, respectively. Surface images of different coated fabrics. Basic properties of the coated fabrics.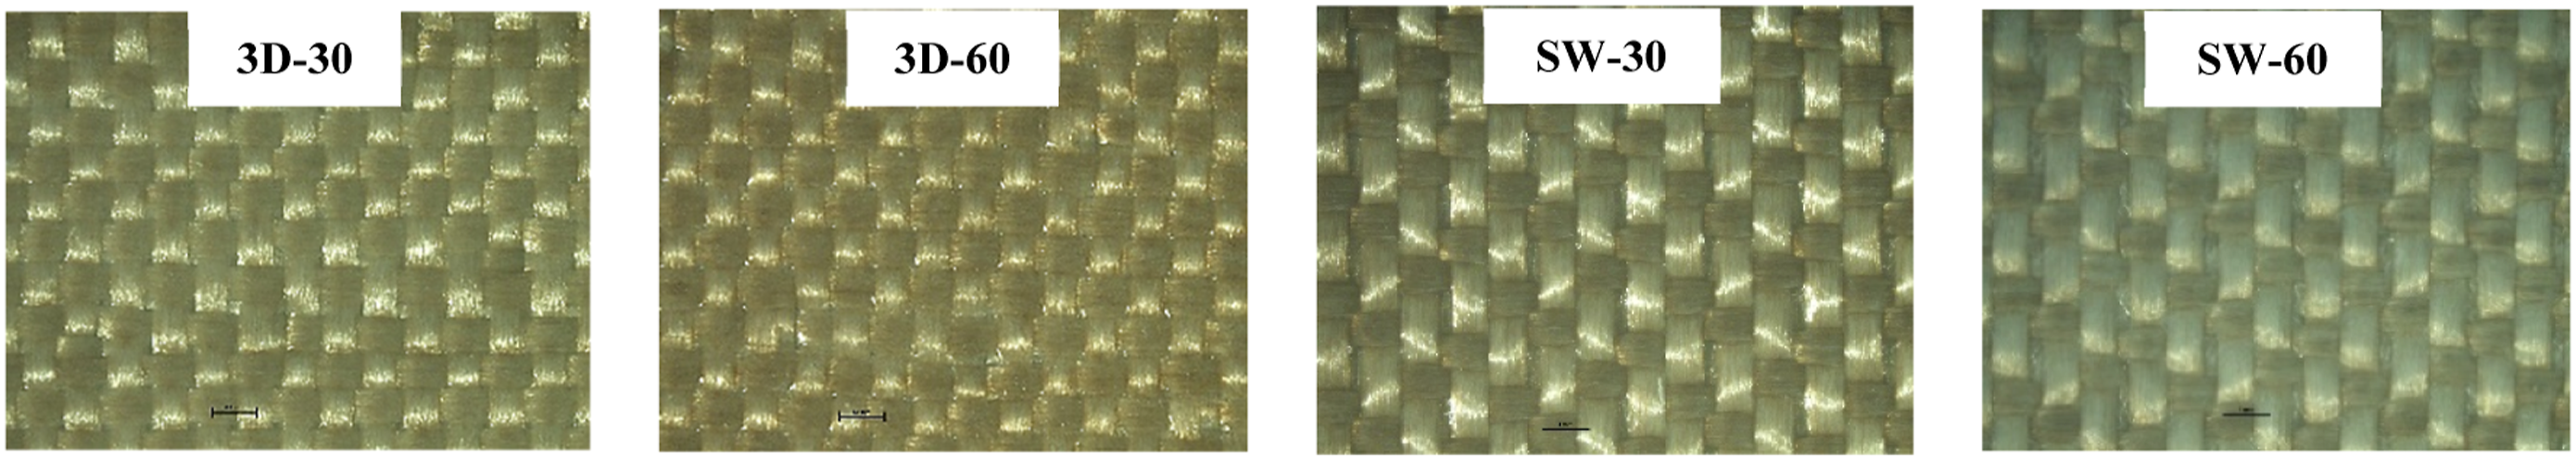

Mechanical characterization
The performance of PTFE coated fabrics under different loading conditions was characterised by performing different static tests, such as uniaxial tensile, tear, puncture and yarn pull-out, and dynamic tests like LVI. All the tests were carried out under room temperature conditions. For each test, five samples were tested and their average values were presented.
Uniaxial tensile
Uniaxial tensile tests were performed on PTFE coated fabrics as per ASTM D5035.
40
The test was carried out on 5 kN Tinius Olsen (H5KS) machine (Figure 2). Rectangular specimens of 250 mm length and 50 mm width were cut from the fabric and clamped between the jaws maintaining a gage length of 75 mm. The tests were performed at a 300 mm/min speed in displacement control mode. The load was gradually increased and the test was continued till complete failure of the specimen. Uniaxial tensile test setup.
Puncture
Quasi-static puncture tests were performed on the PTFE coated fabrics using an Instron 5565 Universal Tester (Instron, USA). A probe was mounted to the machine’s crosshead, as shown in Figure 3 and load was applied at a rate of 2 mm/min. Fabric with 105 mm diameter was placed between the two circular plates with a hole diameter of 45 mm and the load-displacement response was measured to compare the performance. Quasi-static puncture setup.
Tear
The tear test was performed on the PTFE coated fabrics to extract information regarding tearing strength. The two types of tear tests were performed with different configurational setups and a different rate. The first one was the double tongue tearing test
41
which was performed at a quasi-static rate on the tensile tester machine with a configuration as shown in Figure 4(a). The second one was the impact pendulum tear test (Figure 4(b)),
42
which is a dynamic test at a higher impact rate. In this configuration, a pendulum having a certain weight strikes the fabric. These two tests give an estimate on the tearing strength of coated fabrics. Double tongue and pendulum tear test setups.
Yarn pull-out
The yarn pull-out test is a phenomenon of pulling yarn from the woven fabric preform/structure. It is the measure of the tightness of the fabric as well as the inter-frictional force acting among the yarns during pulling a load. This can be of two types; one is a single yarn pull-out test and the other is a multi-yarn pull-out test. For the present study, a multi yarn pull-out test
43
was carried out. A load versus yarn pull-out extension curve was plotted through the yarn tensile tester apparatus. Tinius Olsen H5KS tensile testing machine shown in Figure 5 was used for the yarn pull-out test. The test was performed using a load cell of 1 kN at a pull-out speed of 10 mm/min. Experimental setup and fabric sample. (a) Yarn pull-out test setup (b) Fixture and fabric specimen.
Overall dimensions of the sample were: 16 cm in width and 12 cm in length. Since the yarn was very fine, it was not possible to segregate the individual finer yarn from the coated fabric. Therefore, strips of 5 mm width and 8.5 cm length were cut. 8.5 cm is the length of the separated yarn which is to be pulled with loading (Figure 5(b)). The fabric was fixed in the fixture as shown in Figure 5(b) and the upper portion of the fabric with multiple thin strips was fixed to the upper jaw tightly. The value of the load and pull-out extension was recorded for postprocessing.
Low velocity impact
The LVI tests were performed on a Fractovis Plus CEAST9350 Impact Tester as per ASTM D3763. 44 The specimen of 120x120 mm2 was kept on the support and the position adjusted to align the index line with the impactor. 45 The stainless steel impactor with a hemispherical nose of 12 mm diameter was used. The sample was mounted on the fixture so that the impact point is located in the centre of the specimen. The fabrics were impacted at three different energy levels, 5J, 10J and 15J, with an impactor mass of 4.5 kg. The parameters like height, the velocity of the striker and mass were selected at appropriate levels. After each impact test, the specimen was removed from the fixture and pictures of front and back surfaces were captured through a high definition camera. The camera used was Canon EOS 1300 D, with a resolution of 18x, an optical zoom of 18 Megapixels and 50e250 mm lens. Five samples were tested for each fabric sample.
Results and discussion
Static mechanical properties of PTFE coated 3D and SW fabrics.

Summary of the impact properties of PTFE coated fabrics.

Pmax= Peak force, Ea= Energy absorption, Dmax= Peak deformation, A= Damage area.
Tensile properties
Figure 6 presents the tensile response of PTFE coated fabrics. Up to a displacement of 0.4 mm, the increase in load was almost the same for all the fabrics. This was due to the crimp region of all fabrics and straightening of the interlaced yarns. Once the load started increasing, the slope of the curve depended on the constituents of the fabrics. Load increased with the displacement till it reaches its threshold and dropped down without showing any plastic deformation. Since the SW has a large number of effective yarns in the loading direction, it exhibited the highest load. In terms of the PTFE coating, the fabric with a higher PTFE coating led to a higher tensile load. The 60% PTFE coated fabrics were able to better resist the tensile load due to good interaction between the yarn and coating.
19
This was due to the increase in the adhesive force and inter-yarn frictional force during loading, helping to transfer load between the fibres. In the present case, the coated fabric having higher coating content led to the more engagement of the yarn during the tensile loading. This resulted in higher failure load as shown in the Figure 6. The trend of the tensile load was found as SW-60>SW-30>3D-60>3D-30. Tensile load-displacement response of PTFE coated fabrics.
Macroscopic failure analysis, as shown in Figure 7, was carried out to identify the various tensile failure mechanisms of PTFE coated fabrics. The failure was at the mid-section of the fabrics and the nearby yarns were pulled out. In all the fabrics, some of the yarns fractured first and the load was transferred to the closest yarns. Due to the adhesive strength, the yarns were difficult to pull out from the PTFE coating/substrate interface and most of the yarns fractured at the same section. The common and main failure mode in all the fabrics was yarn fracture as shown in Figure 7. Fabrics with 30% PTFE coating failed almost perpendicular to the load in a uniform manner due to the presence of brittle yarns
19
(Figure 7(a) and Figure 7(c)). The failure in 60% PTFE coating fabrics was in a staircase fashion (Figure 7(b) and Figure 7(d)) with a combination of tensile and shear fractures. Misalignment between the yarns and the tensile load created shear stress in the gauge area, which may have caused the staircase-pattern. The higher coating constrained the deformation of yarns, allowing better load transfer within the fabric. The shear force played a dominant role in material failure. The major failure mode was yarn pull-out with shear fracture. Tensile failure of different PTFE coated fabrics.
Puncture properties
The load-displacement response of punctured PTFE coated glass fabrics is shown in Figure 8. It was observed that the load increased with the displacement. After the initial load peak, fluctuations were due to the cracking of PTFE coating, tensioning of yarns, subsequent yarn failure and penetration.
46
From the initial peak to the final peak, the probe moves constantly through the fabric, initiating yarn slippage due to the contact between the probe and yarns. As the probe penetrates through the fabric the friction, puncture force and contact pressure differ resulting in sharp rises and abrupt drops in the load. The rise and drop in the load during the entire puncture test were mainly due to the intermittent failure in the fibre and the matrix. There are considerable differences in the strength and modulus of the fibre and the matrix. This resulted in the fluctuation in the puncture loading. The difference in the peaks of different fabrics indicates the difference in puncture force. SW fabrics exhibited better puncture performance than the 3D fabrics. Though 3D fabrics had yarn in the thickness direction, the presence of longer straight yarns in SW fabrics provided additional tensile resistance. The fabrics with 30% PTFE coating exhibited better puncture resistance than the 60% ones due to the utilization of more yarn strength. The fabric with lesser coating content offer least ductile deformation due to small quantity of the PTFE resin (PTFE more ductile than the glass fibres). In 60% PTFE coated fabrics, more PTFE coating restricted the motion of yarns causing more initial cracks, which resulted in early loss of resistive force. The lower mobility of the yarn in case of higher coating percentage led to the partial utilisation of the tensile strength of the fibres. The restriction in the yarn mobility resulted in the failure of fabrics in other mode also such as shear, compression, fibre cutting, etc. which has usually lower strength than the tensile strength of the fibres. Load-displacement response of puncture test.
Figure 9 shows the failure images of punctured PTFE coated fabrics. All the fabrics were fully punctured. The damage was almost the same in all the fabrics. All the yarns that were in contact with the probe had failed and some yarns close to the probe were pulled out. On the front face of all the fabrics, main failure mechanisms include PTFE cracking, deformation of yarns, yarn splitting and yarn slippage. On the back face of the fabrics, failure mechanisms include yarn splitting with deformation, yarn failure and splitting of yarns. The yarns were failed in tension and bending. The extent of puncture damage in 30% PTFE coated fabrics was smaller than the 60% ones. In 60% PTFE coated fabrics, higher bulge formation followed by yarn pull-out and yarn breakage was observed. Punctured images of PTFE coated fabrics.
Tear properties
Figure 10 shows the typical force-displacement response of PTFE coated fabrics under the double tongue tear test. From this response, two observations can be made. First: for the same PTFE coating percentage, the SW fabric showed a higher tearing force than the 3D fabric. Second, the fabric with a lower PTFE coating percentage (30%) showed more tearing force for the same preform geometry. During the tear test, the fracture propagated in the transverse direction of the constituent yarn. As the satin structure has a more significant number of effective fibres in comparison to the 3D structure, SW fabrics have more excellent tearing resistance than the 3D ones. The SW fabric has a lower interlacement point and a higher number of floating yarns with lower crimp, leading to higher tearing force. This improved the load-bearing capacity of the fabrics. In the case of 3D fabrics, there is a small number of interlacement points and a large movability of the yarn. For 3D-30 and SW-30 fabrics, more force was needed to debond the yarn and PTFE resin. For the same fabric geometry, a reduction in the tearing force may be the consequence of yarn deterioration, which occurs due to the presence of more PTFE coating material through a degrading chemical reaction in the surrounding atmosphere. In the double tongue tear test, the trend followed by the coated fabrics was SW-30>3D-30>SW-60>3D-60. Force-displacement response of double tongue tear test.
Figure 11 shows the failure of fabrics for the double tongue tear test. In the case of 3D fabrics (Figure 11(a) and Figure 11(b)), the failure was initially linear and then exhibited a shearing behaviour due to the resistance offered by the yarn in the third direction. The failure modes observed for 3D fabrics were yarn splitting with fabric crush and debonding. The tearing in SW-30 (Figure 11(c)) was lower and it was just tearing through yarn failure, yarn splitting and debonding between the coating and yarns. The tear propagated along a straight path in SW-30 fabrics. For SW-60 fabrics, initial failure was a combination of the straight tear with shear, interface failure and yarn pull-out. Double tongue tear failure of PTFE coated fabrics.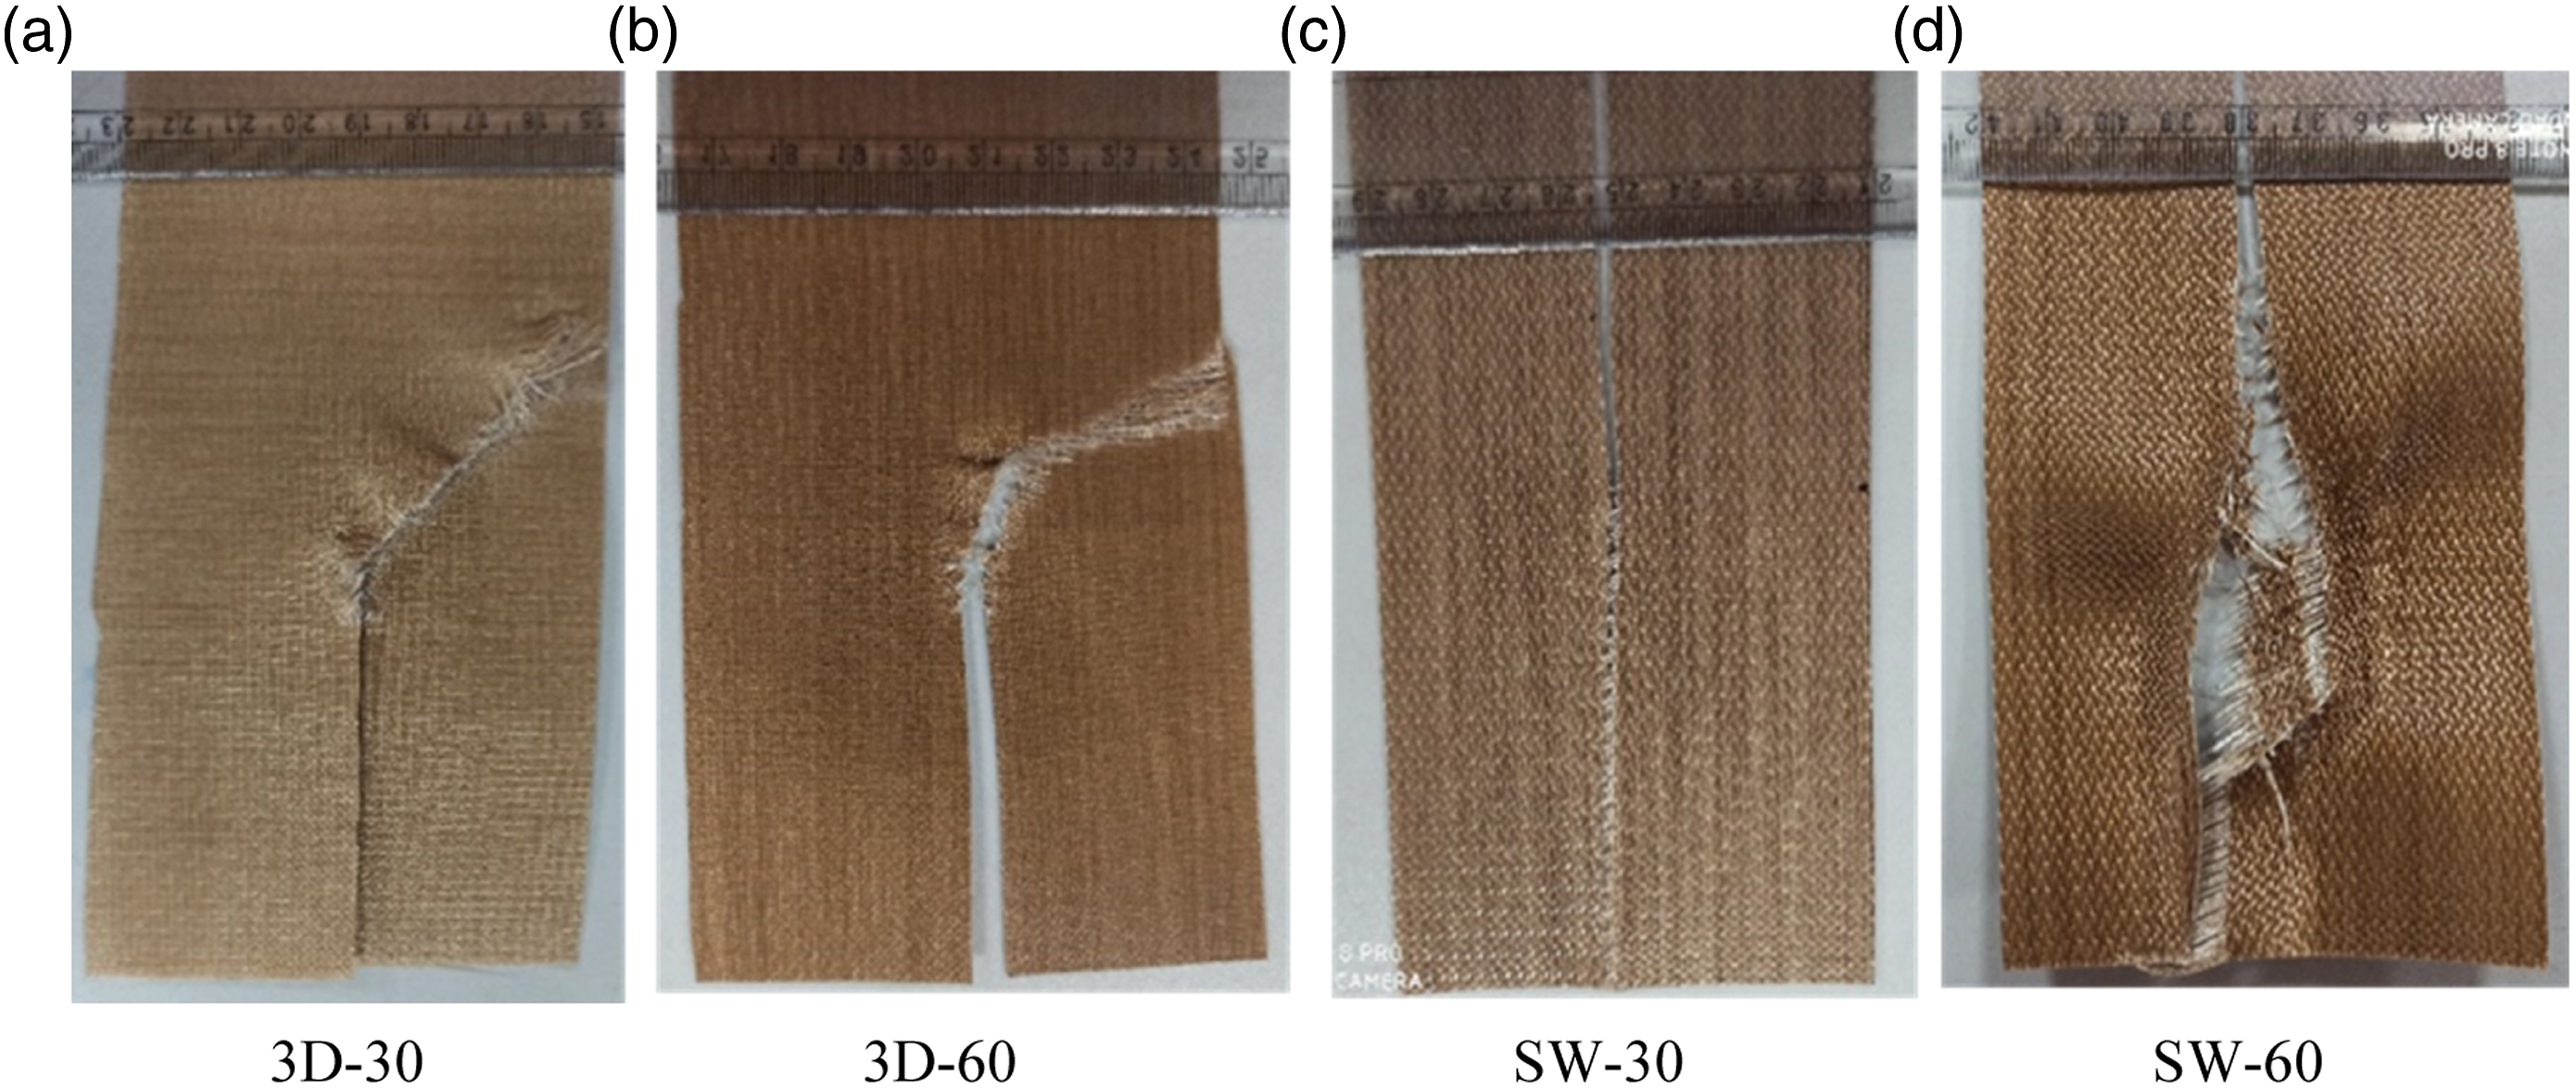
Figure 12 presents the tearing force of PTFE coated fabrics under the pendulum tear test. In this test, all fabrics were torn, except for SW-30 fabric. Therefore, the tearing force of SW-30 fabrics was not recorded. The main reason is that the PTFE penetrates the fabric during the coating process and interrupts the yarn’s mobility within the fabric structure. This makes the fabric rigid, decreasing the coated fabrics' tear strength. Therefore, fabrics with lower (30%) PTFE coating exhibit a better-tearing force than the higher (60%) PTFE coating fabrics. Thus, the tearing force of 3D-30 was 39.59% and 37.50% higher than the 3D-60 and SW-60 fabrics, respectively. In the case of 3D fabrics, due to the presence of the binder in the third direction, the fabric compacts resulting in lower mobility or jamming of the transverse constituent’s yarns compared to the SW structure. For the higher percentage of the coating (60% PTFE), the restriction in the movement of the yarns within the fabric resulted in lower tearing force/resistance. Similar trends were also noticed in the double tongue tearing test. The yarn present in the transverse direction mainly counters the tearing load. Higher amounts of transverse yarns in SW fabrics led to a higher tearing force than the 3D architectures. Tearing force of PTFE coated fabrics from pendulum tear test.
Figure 13 shows the failure of PTFE coated fabrics under the pendulum tear test. In 3D-30 fabric (Figure 13(a)), less PTFE coating induced shear deformation, causing the congestion of yarns at the torn front. It can be seen that the 60% coated fabrics (Figure 13(b) and Figure 13(d)) exhibited tearing following a straight line along the width of the sample and the fracture of yarns in these fabrics was uniform. The tear propagated through all the fabrics except for the SW-30 fabric (Figure 13(c)). The presence of more resin in the 60% PTFE coated fabrics restricted the shear deformation. The tearing in 30% coated fabrics was the combination of tearing along with yarn slippage. Pendulum tear failure of PTFE coated fabrics.
Yarn pull-out properties
A typical load-displacement response from yarn pull-out is shown in Figure 14. From Figure 14, it can be observed that the highest pull-out force was observed for the SW-60 fabric and the lowest for the 3D-30, following the trend of SW-60>SW-30>3D-60>3D-30. The fabric with a higher PTFE coating exhibited a higher pull-out force during yarn pulling in both the SW and 3D fabrics. There was an increased inter-yarn frictional force due to the higher percentage coating. The highest coating (60%) percentage acted in two ways; the first is increased adhesive bonding among the yarns, and the second is the increase in the yarn sliding friction. In the SW fabric, the peak load was achieved at lower displacement in the case of the 60% PTFE coating. The apparent reason for the higher pull-out force is more restriction of the yarn in the fabric structure or, say, due to lesser mobility of the yarn. The reduced mobility of the yarn resulted in the higher load demand for the net displacement of the fibre within the fabric. Force-displacement response for yarn pull-out.
In the case of 3D fabrics, the coating material had a prominent effect on their yarn pull-out resistance. Compared to the SW fabric, the 3D fabric has a lower number of effective yarns in the loading direction due to the weave architecture of the 3D fabrics. The additional yarn in the third direction reduced the compelling yarns in the loading direction; thus, a lower value of pull-out force was achieved. The greater resin coating leads to the smaller displacement of the fibre and early breakage of the fibre. In 3D fabrics, there is a reduced number of yarns in the planar direction which increases the inter yarn spacing compared to the SW, which is the primary reason for the reduction in the inter yarn frictional force. This can be attributed to the better coating impregnation in the SW than in the 3D fabric. Hence, there was a reduction in the peak force during the pull-out test. The yarn pull-out test showed an increase in the inter yarn frictional force.
Figure 15 shows the failure of fabrics for the yarn pull-out test. Yarn decrimping, translational motion and final fibre breakage were observed. Since the fabric consisted of coated very fine yarn, the yarn breaks after exhibiting sliding/translational motion during the test. Fabrics failure under yarn pull-out loading.
Impact properties
This section deals with the influence of PTFE coating and weave pattern on LVI performance through force-time, force-deformation and energy-time histories. Also, the impact properties, peak force, energy absorption, peak deformation and specific energy absorption are compared.
Force-time
Figure 16 shows the force-time histories of PTFE coated fabrics at impact energy levels of 5J, 10J and 15J. At 5J impact energy (Figure 16(a)), the response of all the fabrics was smooth without any drop/changes in the force, indicating zero damage. At this energy level, the peak force decreased in SW-60>SW-30>3D-60>3D-30. A higher peak force indicates a strong impact resistance. The same trend was found in the case of the yarn pull-out test and tensile test. Due to the higher PTFE coating, more PTFE was available surrounding the fibre, improving load transfer for the coated region to the fibre through enhanced adhesive force and frictional force. The improved engagements of the fibres in the case of the fabric with higher resin content during the impact gave a higher impact load, as shown in Figure 16. Also, there was more PTFE material to absorb the impact shock, resulting in a higher peak force with reduced damage. The higher coating percentage gave higher rigidity, which improved the higher initial loading slope and increment in the penetration resistance. Force-time histories of PTFE coated fabrics: (a) 5J, (b) 10J and (c) 15J.
At 10J impact energy, a sudden drop was observed in the case of SW-60 and 3D-60 fabrics due to yarn and matrix failure, while no damage occurred in SW-30 and 3D-30 fabrics. At a higher energy level, in the 30% PTFE fabrics, the force reached its maximum level in a shorter time (Figure 16(b)) than 5J (Figure 16(a)). It indicates that fibres had less time to react to the impact load; therefore, there was no room for the molecular rearrangement inside the fibres, which failed. At 10 J, the peak force was reduced for SW-60 and 3D-60 laminates, following the trend SW-30>3D-30>SW-60>3D-60. At 15 J, all the fabrics failed, evident from the sudden drop of the impact load (Figure 16(c)). The peak force trend was observed as SW-30>3D-30>3D-60>SW-60.
Force-deformation
The force-deformation response of PTFE coated fabrics is shown in Figure 17, which characterizes the impact performance of fabrics in terms of absorbed energy. The closed-loop area refers to the energy absorbed during the impact. At 5 J, all the fabrics exhibited a closed-loop response. The close loop reveals no fracture or permanent indentation occurrence inside the laminate. The response was smooth and impact energy was consumed in the elastic deformation of the fabrics. The hysteresis confirms it in the unloading curve and the fabric recovers some of the elastic energy. Force-deformation histories of PTFE coated fabrics: (a) 5J, (b) 10J and (c) 15J.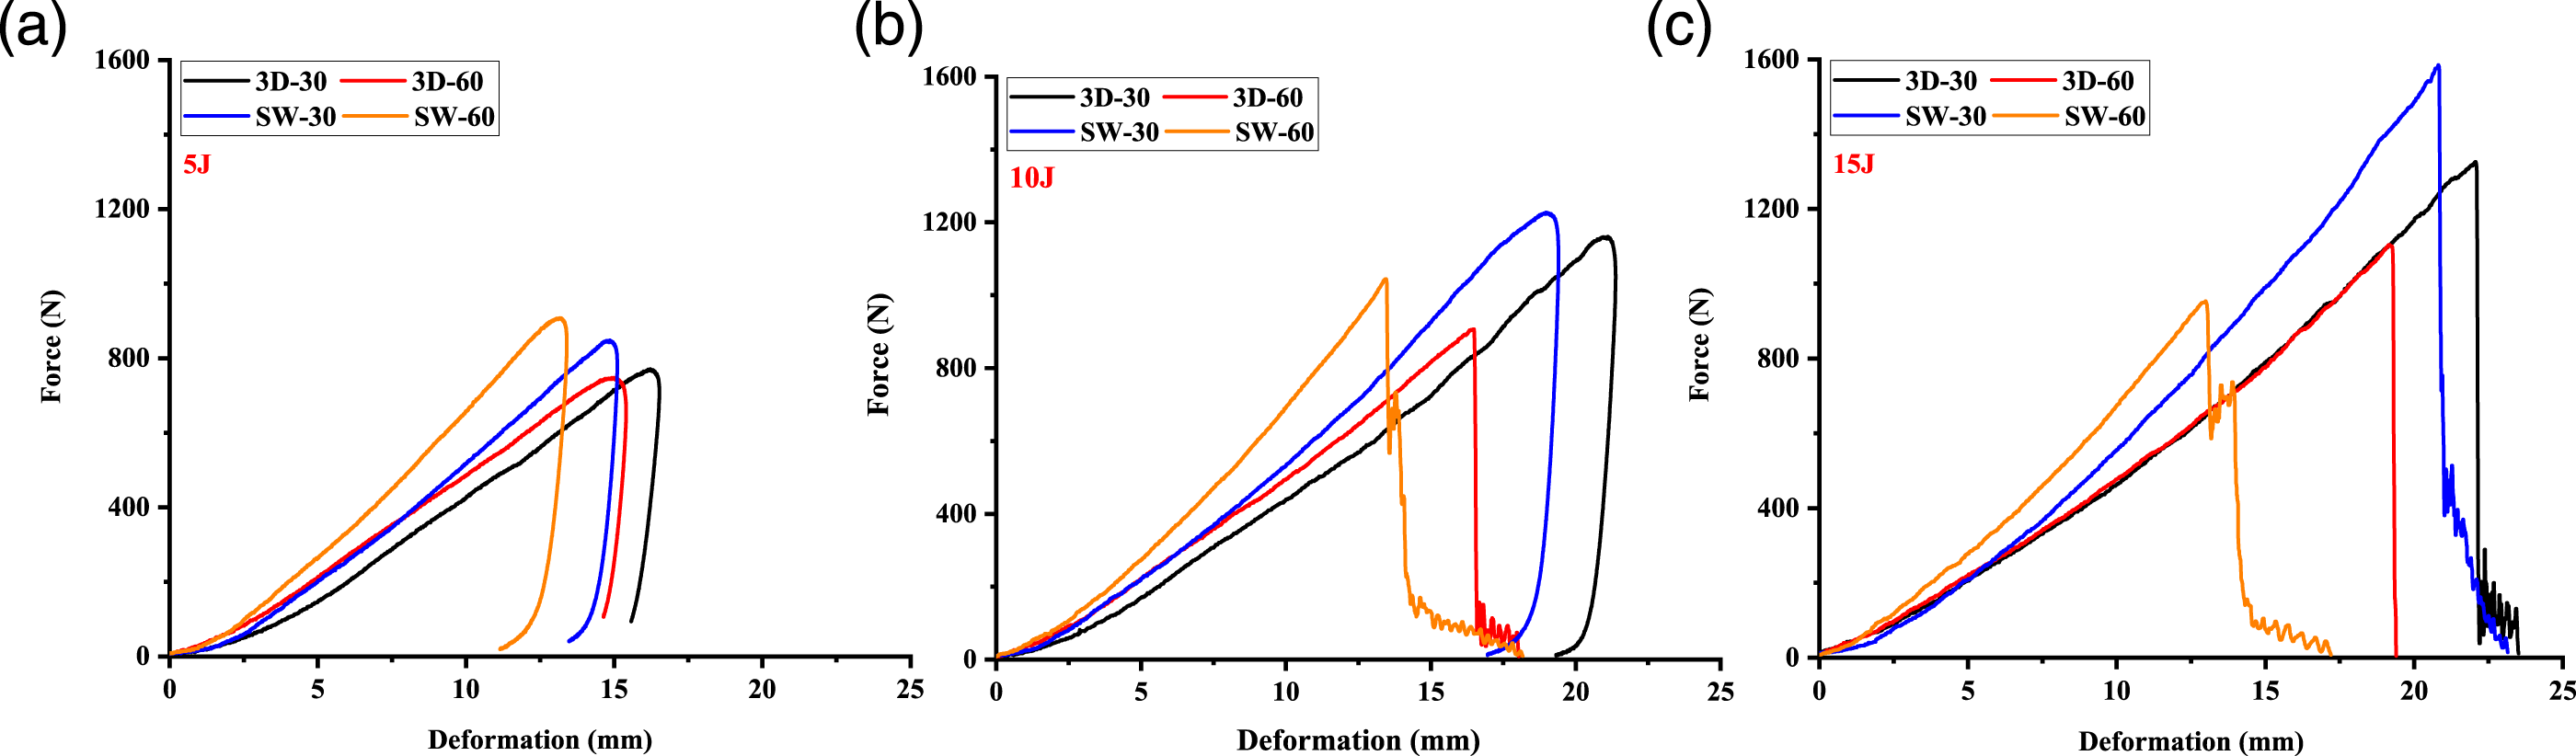
At 10J, the closed-loop was observed only for 3D-30 and SW-30 fabrics (Figure 17(b)), while the 60% PTFE fabrics were perforated. This indicates that the 60% coated fabrics absorbed all the energy and fractured, while the 30% coated fabrics were intact and showed elastic deformation without significant failure. The higher resin content resulted in more matrix cracking due to lower fracture strength. The bounce back in the case of 30% PTFE fabrics indicated their impact resistance. There was less load transfer at lower coating levels, less fibre breakage, and energy was dissipated through other means such as laminate vibration, wave propagation, etc. In the case of a 15J impact (Figure 17(c)), it was observed that there was an open loop in the response, confirming the permanent damage of the fabrics. At this energy level, the impact load was transferred through fibre break and matrix cracks. The sudden drop in the loading curve depicts the fibre’s failure (or perforation).
Energy-time
Typical energy versus time response of PTFE coated fabrics at different energy levels is shown in Figure 18. As the impactor contacts the fabric, some of the impactor’s energy is absorbed by the fabric in elastic deformation, PTFE cracking and plastic deformation. At all energy levels, all the specimens exhibited a similar trend. From the energy-time response, it can be seen that the energy increases with time and reaches a peak value. Beyond this point, the response varied depending on the impact energy level. If the response becomes stable after a peak value, it indicates partial perforation with the rebounding of the impactor. If the response stops after reaching a peak value, it indicates complete perforation. The response reduces after reaching a peak value due to rebounding; otherwise, it stops.
35
Energy-time histories of PTFE coated fabrics: (a) 5J, (b) 10J and (c) 15J.
At 5J, all the fabrics exhibited good performance by absorbing the total energy of the impactor with zero perforation. The energy was absorbed through the elastic deformation formation of a dent. All the fabrics exhibited an almost similar response for the applied energy level (Figure 18(a)). After reaching the peak value, the response dropped slightly, indicating the rebounding of the impactor.
At 10J, the 60% PTFE coated fabrics reached peak energy at approximately 7–7.5 ms, while 30% PTFE coated fabrics reached almost 15 ms (Figure 18(b)). Up to 2.5 ms, all the fabrics had a similar response indicating the elastic deformation. Beyond this point, the energy increased up to 7–7.5 ms and 15 ms for 30% and 60% PTFE coated fabrics, respectively. This increase was due to an enormous amount of energy dissipation in PTFE/fibre interface damage, friction between impactor/fabric and yarn pull-out. 60% PTFE coated fabrics were more rigid, which led to more PTFE failure absorbing less energy. Tear tests also confirmed this. For 30% PTFE coated fabrics, the energy dropped slightly after reaching the peak value signifying the rebounding of the impactor. At 15 J, there was no drop in the energy after reaching the peak value, indicating the perforation of the impactor in all the fabrics (Figure 18(c)). Therefore, at 15J, all the impactor’s kinetic energy was transferred entirely to the fabric, and the energy absorbed by the composites reached a constant value resulting from the damage and friction.
Comparison of impact properties
The impact response parameters obtained from experiments were further interpreted in terms of peak force and energy absorption. Figure 19 shows the influence of PTFE coating and weave pattern on the fabrics' peak force and energy absorption at different energy levels. Through these parameters, the influence was explained quantitatively. The peak force increased with incident energy level for all the fabrics except SW-60 (Figure 19(a)). In the case of 3D fabrics (Figure 19(a)), the peak force increased by 3.17%, 28.04% and 20.13% from 60% to 30% PTFE coating for 5J, 10J and 15J energy levels, respectively. In the case of SW fabrics (Figure 19(a)), the peak force increased from 60% to 30% PTFE coating by 6.54%, 14.90% and 27.26%, respectively, for 5J, 10J and 15J energy levels. Comparison of impact properties: (a) peak force and (b) energy absorption.
In the case of energy absorption (Figure 19(b)), at an impact energy of 5J, all the fabrics exhibited the same energy absorption as they did not fail. At 10 J and 15J, the energy absorption increased with the incident energy level. Similar to peak force data, fabrics with 30% PTFE coating outperformed the 60% PTFE coated fabrics. 30% PTFE fabrics contain less coating where more fibres are in close contact with the impactor than the 60% coating fabrics. The thickness difference of the fabrics proves this difference. When fibres are in close contact, they play a significant role in dissipating the impactor’s energy, undergoing more deformation (elastic or plastic depending on incident energy) and taking more load from the PTFE. Therefore, the peak force and energy absorption hierarchy of PTFE coated 3D and SW fabrics were 3D-30>3D-60 and SW-30>SW-60, respectively.
Impact damage
Impact induced damage was inspected visually and by optical micrographs. The failure mechanisms which occur during the impact process depend on the type of impactor, impact energy and structure of the target. Figure 20 shows the impact-induced damage in PTFE coated fabrics at 5J. The damage on the front and back faces of all the composites was minute (barely visible) and the back face exhibited negligible deformation. In the case of 3D fabrics, a small dent on the front and a slight bulge on the back faces were formed due to the localisation of the impact energy. The binder yarn restricts the energy propagation in the waveform. However, in the case of SW fabrics, it was not visible due to the higher float length and the lesser interlacements point comparatively. Here, the straight yarn offers energy dispersion in another mode, such as wave propagation and hence, no dent is found. Impact damage in different PTFE coated fabrics at 5J.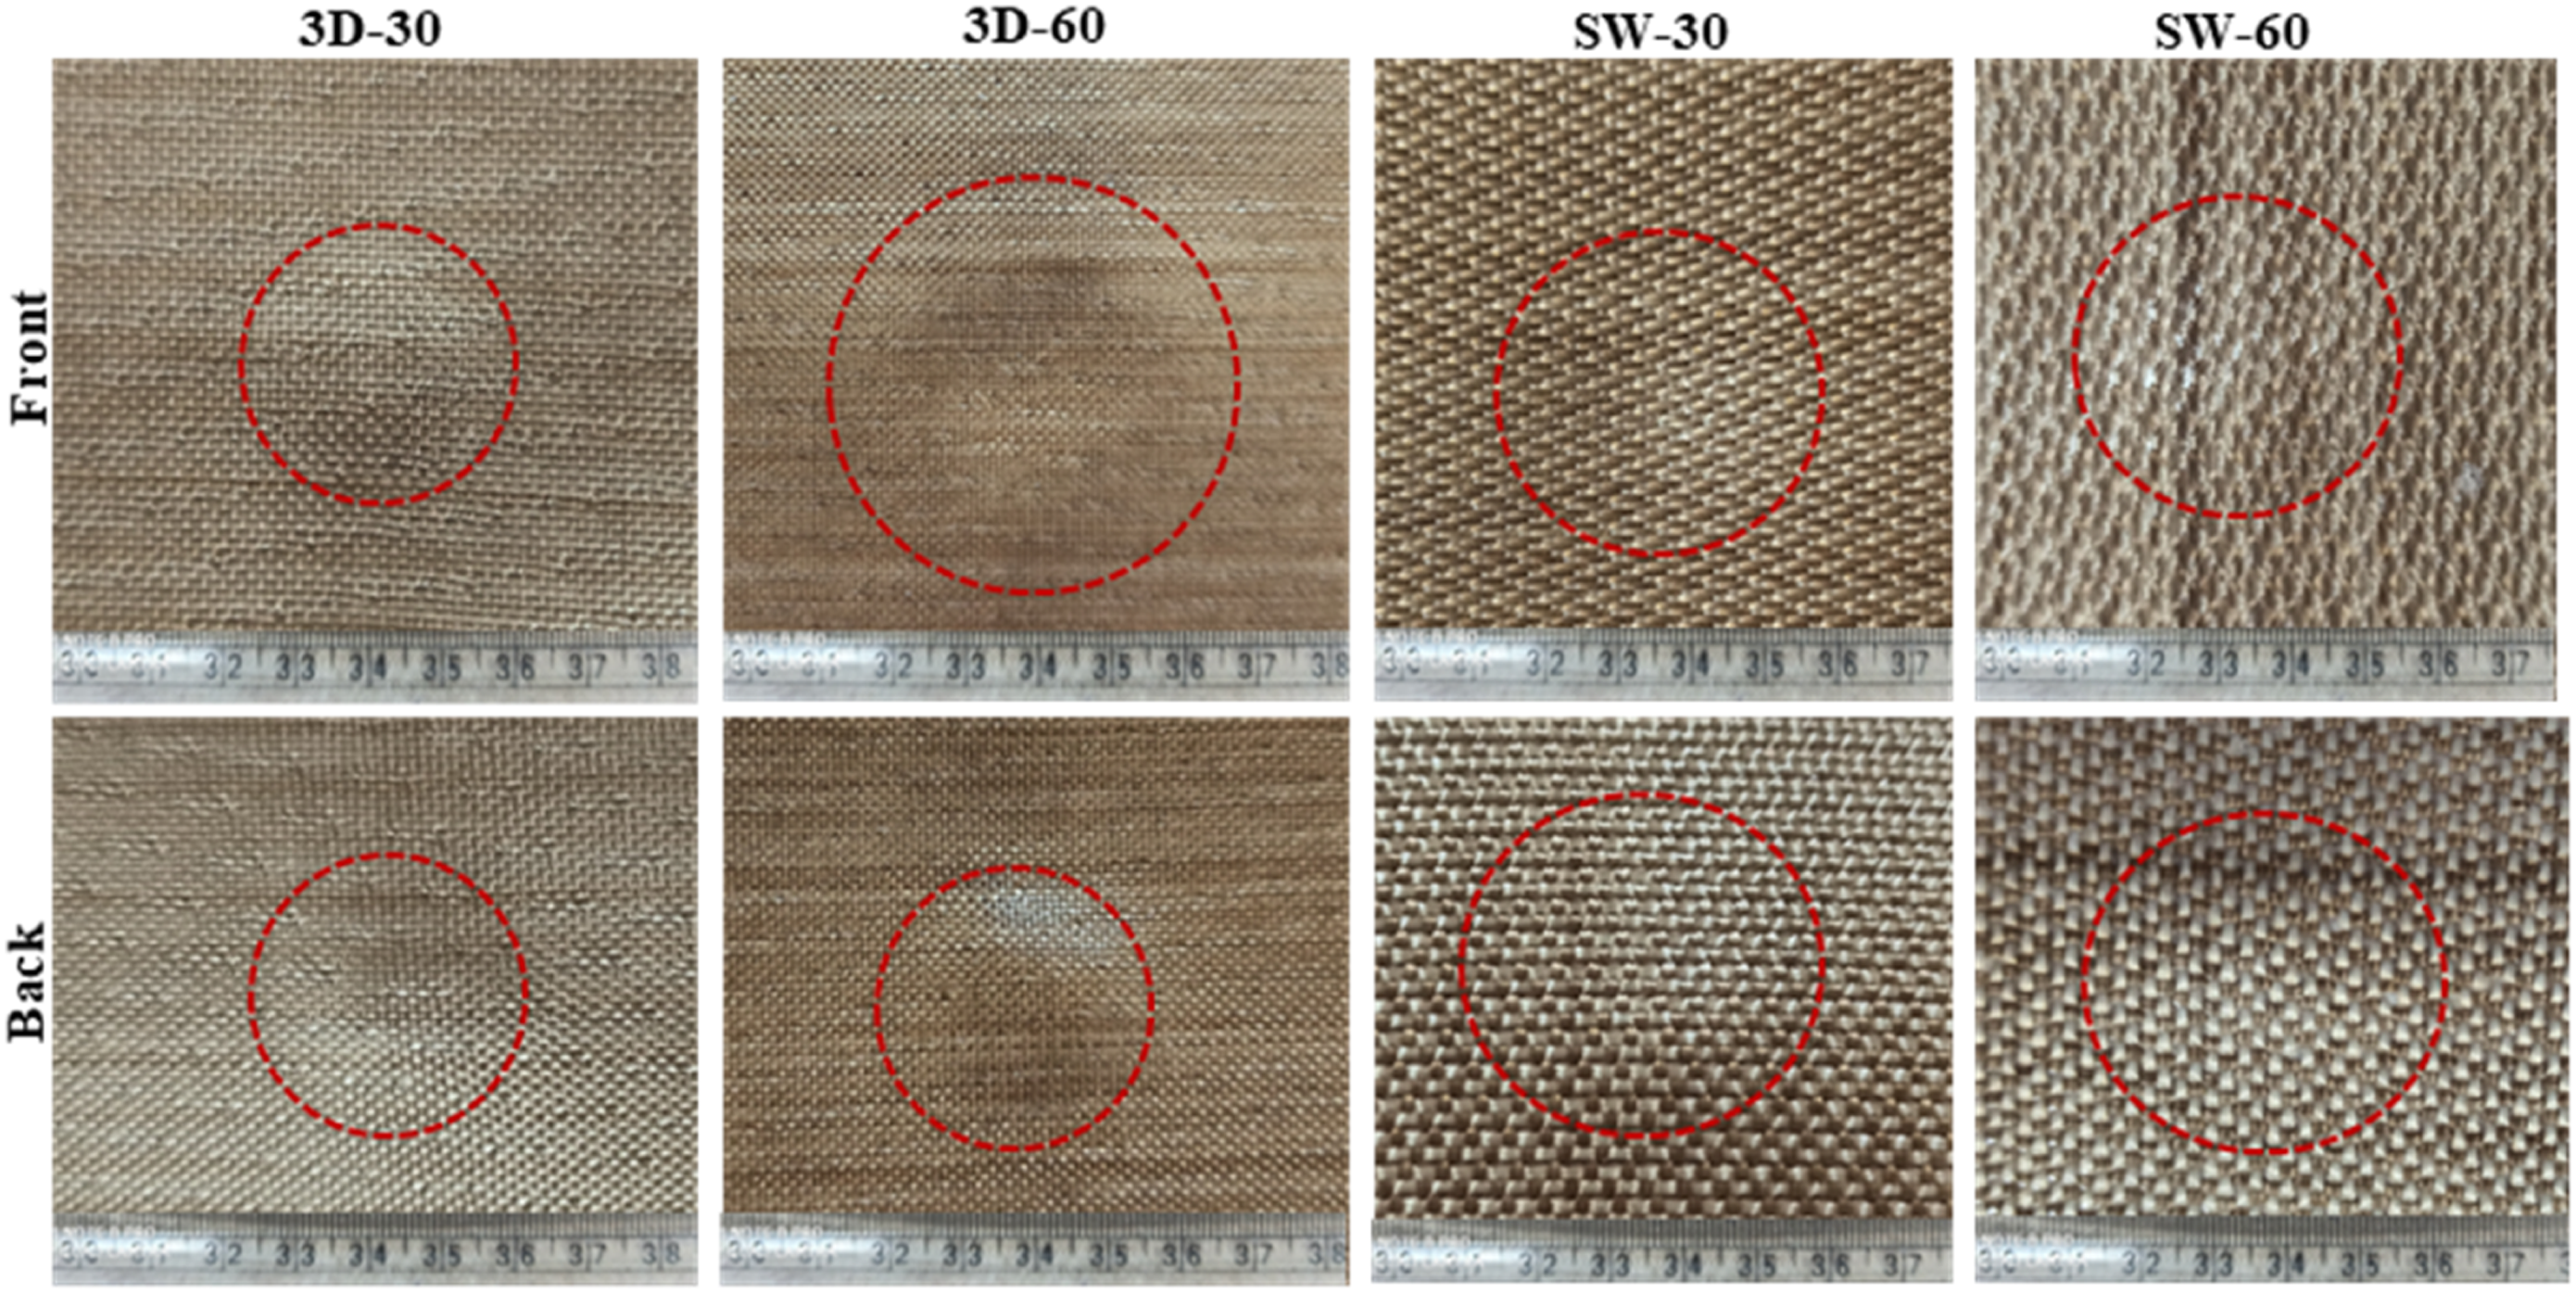
Figure 21 shows the impact-induced damage in PTFE coated fabrics at 10J. In all the specimens, the damage was in the form of a circular dent near the impact zone. At this energy level, fabrics with 30% PTFE coating (3D-30 and SW-30) exhibited a small dent formation on the front face and a negligible dome formation on the back face. The 60% PTFE coated fabrics exhibited a dent on the front face. Damage on the back face of these fabrics varied depending on the fabric structure. For 3D-60 fabrics, the damage was in a cross shape, while for SW-60 fabrics, it took a more linear shape. Major failure in 60% PTFE coated fabrics was characterised by yarn splitting and bursting. SW-60 fabrics exhibited tensile failure of yarns near the impact zone, but this was not observed for 3D-60 fabrics. This may be due to the presence of yarn in the z-direction, which restricts yarn motion. The higher dome formation in the case of the 60% coating results from the permanent deformation of the resin content, which is comparatively less available in the lower coating. Therefore, more resin content, more damage through the matrix cracking, matrix failure etc. Impact damage in different PTFE coated fabrics at 10J.
Figure 22 shows the impact damage of PTFE coated fabrics at 15J. At this energy level, all the fabrics were damaged catastrophically. In the case of 3D fabrics, failure on both the front and back faces was due to yarn splitting, yarn pull-out, yarn deformation and minor cracks. Yarns splitting and bursting were the major damage modes in the SW fabrics. Among all the fabrics, SW-30 exhibited less damage. Impact damage in different PTFE coated fabrics at 15J.
For 15J energy, the impact-induced damage was studied microscopically, as shown in Figure 23. All the fabrics exhibited full perforation. Commonly observed damage mechanisms were yarn splitting, deformation, PTFE-fibre debonding and yarn bursting. However, the extent of these damage mechanisms varied depending on the resistance offered by the target to the impactor. Yarn deformation was more evident in 3D fabrics compared to the SW fabrics. For the same fabric structure, the extent of damage in 30% PTFE coated fabrics was small compared to the 60% PTFE coated ones. 60% PTFE coated fabrics failed in a brittle manner due to the fabric’s rigidity. The extent of damage on the front face was estimated by measuring the area. Table 3 presents the impact properties along with the damaged area. Microscopic impact failure of PTFE coated fabrics at 15J.
Since the fabrics have different areal weights, it is required to compare the fabric’s performance in terms of the specific impact energy absorption. The specific energy for all the samples is shown in Figure 24. Figure 24 shows that maximum energy was absorbed by 3D-30 followed by the 3D-60, SW-30 and SW-60, respectively (that is 3D-30>3D-60>SW-30>SW-60). Since the 3D fabric structure involves an additional binding yarn in the third direction. This binding yarn plays a vital role in the damage propagation and gives high damage tolerance by restricting crack propagation through the binding yarn in the thickness direction. The primary purpose of 3D weave structures is to improve impact performance by enhancing damage resistance and in-plane stiffness. Therefore, 3D>SW in terms of specific energy absorption. Comparison of specific energy absorption.
Conclusions
The present study investigated the mechanical performance of PTFE coated glass fabrics with 3D and satin weave fibre architectures. Traditional textile characterization tests like yarn pull-out, tensile, tear, puncture and LVI tests were performed to assess the influence of PTFE coating on these fabrics. Based on the tests, the following conclusions on fabric performance were drawn: • In terms of tensile properties, SW fabric exhibit higher performance than 3D woven fabrics. For both fabric types, a higher percentage coating of PTFE yielded a better performance as the higher coating percentage constrained yarns' deformation and provided better load transfer between the yarns. • Fabrics with 30% PTFE coating exhibited better puncture resistance due to more yarns in the loading direction. The 60% PTFE fabrics had more coating, which restricted the motion of yarns during transverse loading and exhibited lower puncture resistance. As with the tensile loading trends, the SW fabrics performed best. • The 30% PTFE coated fabrics exhibited better double tongue and pendulum tear test performance, requiring more tearing force to failure than 60% PTFE coated fabrics. SW fabric exhibited more tearing force due to a more significant number of effective yarns. • Yarn pull-out tests indicated that 60% PTFE coating increased the bonding between yarns, increasing yarn sliding friction. The yarn pull-out force of SW was better than the 3D fabrics due to more long straight yarns. • The 30% PTFE coated fabrics exhibit better impact performance by absorbing more energy. The 60% PTFE fabrics were more rigid, leading to more PTFE failure than fibres breakage, causing lower impact resistance.
This study indicates that typical 2D woven fabrics can be replaced with 3D and SW fabrics having lesser yarn crimp for better mechanical performance under different loading conditions. 36 The properties obtained in the present study could be used to better select fabrics for various applications. For example, canopies are more vulnerable to impact damage; the results of this study indicate that for this type of application, PTFE coated SW fabrics offer excellent properties.
Footnotes
Acknowledgements
This project has received funding from the EI and from the European Union’s Horizon 2020 research and innovation programme under the Marie-Sklodowska Curie grant agreement No 713654. The authors would also like to thank Cyril Stockil, Product Development Manager, Taconic International, Ltd, Mullingar, Ireland for supplying the fabrics.
Declaration of conflicting interests
The author(s) declared no potential conflicts of interest with respect to the research, authorship, and/or publication of this article.
Funding
The author(s) disclosed receipt of the following financial support for the research, authorship, and/or publication of this article: This project has received funding from the EI and from the European Union’s Horizon 2020 research and innovation programme under the Marie-Sklodowska Curie grant agreement No 713654