
Abstract
This report presents a new critical tearing strength prediction model, the modified stress field model. Firstly, the critical tearing strength of six coated fabrics is obtained using the single-edge notched tests. The results show that the warp and weft strength utilization of different coated fabrics is similar. Based on the test data, the prediction effects, parameter meanings, and basic properties of three models, namely Thiele’s empirical formula, the stress field model, and the modified stress field model, are discussed and compared. Then, the predicted results and properties of the three models in different crack ranges, specifically the small crack range, are compared, and their application scopes are verified. The two commonly used models lack the improved prediction effects in the small crack range that is provided by the modified stress field model. Finally, to reduce the workload while maintaining a certain accuracy, a crack combination of 3 mm + 15 mm is recommended, which is further confirmed using the root-mean-square error index. The prediction results of Thiele’s empirical formula and the modified stress field model under this crack combination are compared. The new model can still maintain good prediction effects even when extrapolating for small cracks using limited test data. Because of its precision and convenience, the proposed model may relatively facilitate the application of single-edge notched or uniaxial central tearing tests.
Introduction
As new long-span structures, membrane structures are developing rapidly worldwide because of their light and aesthetically appealing appearance. These structures have widespread applications, particularly in public facilities and in open or half-open buildings. However, despite their various advantages, membrane structures occasionally fail. Although membrane structures are flexible, when there is strong wind or heavy snow, existing cracks, holes, and creases in membrane materials may cause stress concentration to arise and lead to tearing, and consequently overall failures.1,2
Architectural coated fabrics primarily comprise coatings, substrates, and top coatings
3
(Figure 1). The coatings mainly include polyvinylchloride (PVC), polytetrafluoroethylene (PTFE), silicone, and polyurethane. Among them, PVC and PTFE coatings are widely used in architectural coated fabrics. PVC coating is often flexible and covered with polyvinylidene fluoride (PVDF) to improve chemical stability, whereas PTFE coating is inert and usually of higher stiffness. The architectural coated fabrics mainly include polyester fiber fabrics with PVC coating and glass fiber fabrics with PTFE coating. Usually, PVC-coated fabrics are ductile, low-cost, and self-cleaning but have low strength, meanwhile, PTFE-coated fabrics have high strength and good durability but poor ductility. In addition, the glass fibers are not resistant to folding. Therefore, PTFE-coated fabrics are more sensitive to creases during construction and transportation, which are major factors leading to stress concentration and tearing.
4
Composition of coated fabric.
Thus, regardless of the membrane structure or material, tearing may have serious consequences, and the tearing strength of membrane materials is very important. However, design and calculation are still conducted based on the tensile strength in domestic and international technical standards, and the tearing strength is only proposed as a property parameter.5–7 Furthermore, different tearing tests have been adopted with different specifications.8,9 The trapezoidal tearing test has the widest application in specifications for membrane structures because of its simple failure mode and stable results. Many studies have focused on this method. Hager et al. 10 performed experimental studies and listed the factors influencing the trapezoidal tearing strength. Steele et al., 11 Chu et al., 12 and Wang et al. 13 conducted theoretical studies and proposed formulas to predict the trapezoidal tearing strength. In recent years, finite element analysis has become a new research method, and Wang et al. 14 adopted it to simulate the trapezoidal tearing process of coated and uncoated fabrics. The trapezoidal tearing test has received considerable attention; however, its tearing strength is determined by the size of the tearing del-zone, which is a triangular zone formed owing to uneven elongation of some longitudinal yarns at the crack tips in specimens. 15 This characteristic indicates that the stress state deviates from those of actual membrane structures, which are mainly subjected to multi-axial stress and have loads carried by whole sections.
Therefore, a tearing test whose stress state is closer to that of membrane structures should be adopted to obtain the tearing strength. Among various tearing tests, the single-edge notched and uniaxial or biaxial central tearing tests can meet this requirement. The biaxial central tearing tests are closer to practical situations, while single-edge notched and uniaxial central tearing tests partly approximate realistic situations, which have loads carried by whole sections but are subjected to uniaxial stress. However, specific equipment is often required for achieving multi-axial stress, whereas uniaxial stress can be attained easily. Therefore, the single-edge notched and uniaxial central tearing tests are also of significance and can be the first step of the study in a practical situation. Recently, numerous studies have been focused on these tests, specifically in the fields of architecture and aviation, to achieve a deeper understanding of their mechanisms. Among these, experimental and theoretical studies have taken up major parts. Maekawa et al. 16 focused on the tearing properties of airship envelope materials based on biaxial central tearing tests and inflatable cylinder tests. They proposed a model in which the stress was exponentially distributed in the crack section. The results showed that the predicted tearing strength of the model agreed well with the test results. Bigaud et al. 17 performed uniaxial and biaxial central tearing tests on PVC-coated fabrics and analyzed the factors affecting the failure modes and tearing strength. They also used the finite element method and fracture mechanics theories to analyze the test results. Liu et al. 18 conducted single-edge notched tests on an airship envelope material and established a single-edge notched tearing strength prediction model, which could acquire results similar to the test results. Zhang et al. 19 studied the uniaxial central tearing properties of a PVC-coated fabric and systematically illustrated the effects of the notch shape, notch size, loading rate, specimen size, and other factors on the tearing behavior. They also established a model for predicting tearing strength based on the stress field model established by Maekawa et al. 16 Sun et al. 20 performed uniaxial central tearing tests on PTFE-coated and PVC-coated fabrics. They proposed a new tearing strength prediction model based on the theories of fracture mechanics. Chen et al.21–23 systematically studied the uniaxial and biaxial central tearing properties of airship envelope materials and considered factors such as the notch length, notch angle, off-axis angle, and stress ratio. They finally proposed formulas to predict the tearing strength with and without the off-axis angle based on the Griffith energy theory and Tsai–Hill criterion, respectively. Wang et al. 24 performed uniaxial central tearing tests on a new airship envelope material and proposed a tearing strength prediction model by assuming a stress distribution on yarns. Sun et al. 25 investigated the uniaxial central tearing properties of a PTFE-coated fabric, including the tearing process, failure modes, and tearing strength. Godfrey et al.26,27 proposed a model to predict the uniaxial central tearing strength of uncoated and coated fabrics, and the adopted coatings including silicone, urethane, and PVC.
In recent years, new research perspectives and measuring methods have been adopted in single-edge notched, and uniaxial and biaxial central tearing tests. In contrast to the traditional perspective, which mainly focuses on tearing strength, some researchers have attempted to find inherent parameters using concepts in fracture mechanics. Bao et al. 28 conducted uniaxial and biaxial central tearing, single-edge notched, and trapezoidal tearing tests on a PVC-coated fabric. The critical strain energy release rates (G IC ) obtained by theoretical and test methods were introduced and compared. He et al. 29 conducted uniaxial central tearing tests on PTFE-coated fabrics. They calculated and analyzed G IC based on the virtual crack closure technique and noted that G IC could be adopted as a material constant to measure tearing performance. As a new technology, the digital image correlation (DIC) method has been used gradually for architectural coated fabrics owing to its accuracy and non-contact nature. Bao et al. 30 employed this method to study the uniaxial and biaxial central tearing properties of a PVC-coated fabric and obtained the strain distribution. He et al. 31 conducted detailed DIC parametric studies and revealed the biaxial central tearing properties of a PVC-coated fabric. Chen et al.32,33 also employed the DIC method to analyze the uniaxial and biaxial central tearing properties of an airship envelope material and conducted theoretical studies on the single-edge notched properties of this material.
From the aforementioned studies, majority are experimental works which focus on the tearing properties of one or two coated fabrics, while theoretical studies are inadequate. Among different studies, Thiele’s empirical formula and the stress field model are still the most widely used, but usually only their prediction effects are examined.16,19,20,24,30,32 To date, no detailed analyses reveal their properties, parameter meanings, and application scope. Furthermore, in existing theoretical studies, their proposed models may be established based on different assumptions or theories, but in most cases, all test data are involved in fitting constant acquisition requiring numerous tests. The predicted results are typically compared within the tested crack range, which may be one of the reasons why good prediction effects are always obtained. There are almost no models that can use limited test data to offer good prediction effects; and for the predicted results in different crack ranges, particularly for small cracks in which extrapolation is often needed, the relevant studies are still insufficient. Therefore, intensive research on two commonly used models is required. In addition, a new model that requires fewer test data and has good prediction effects in different crack ranges must be developed. This can have great significance in engineering fields, as it will reduce the amount of workload while maintaining certain prediction accuracy.
In this report, a new critical tearing strength prediction model, which is a modified stress field model, is proposed. To investigate its properties, a comparison among Thiele’s empirical formula, the stress field model, and the new model is conducted. Before theoretical research, single-edge notched tests are performed on six architectural coated fabrics with different types and properties. Based on the test results, the prediction effects, basic properties, and parameter meanings of the three models are first inspected and compared. Then, the prediction effects of the three models in different crack ranges are checked, and the application scopes are assessed. In particular, the predicted results in the small crack range are compared in detail. The modified stress field model has better effects for small cracks, which is what the other two models lack. Finally, the fitting constants of the new model and Thiele’s empirical formula are obtained uniquely based on test data with 3 mm and 15 mm cracks, and this crack combination is confirmed by the root-mean-square error (RMSE). The prediction effects and properties of the two models under this crack combination are discussed and compared. The developed modified stress field model is anticipated to facilitate the adoption of single-edge notched or uniaxial central tearing tests because it reduces the workload and maintains a certain accuracy in different crack ranges.
Tests
Before investigating the prediction effects and properties of different models, basic test data are required. Therefore, in this section, single-edge notched tests are conducted on several coated fabrics. The majority of this study consists of theoretical research; experimental tests are performed to serve the theoretical assumptions. Therefore, the tearing strength is the main parameter displayed and discussed, which can be a basis for the subsequent analysis and discussions on different models.
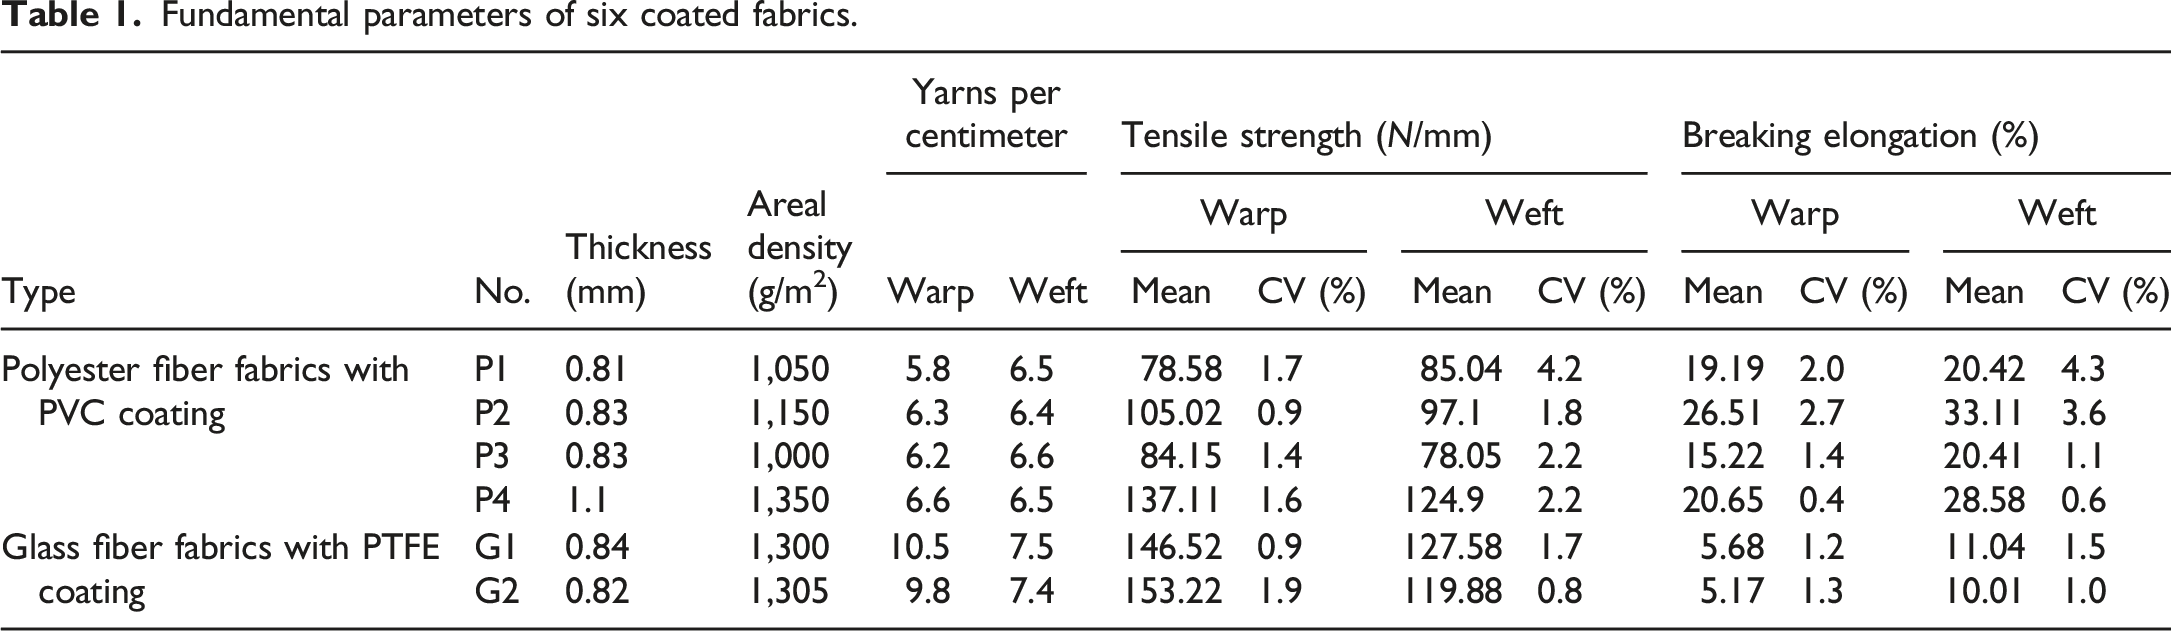
Materials
Fundamental parameters of six coated fabrics.
Experimental program
The dimensions of the single-edge notched samples are shown in Figure 2(a). The width and length are 50 mm and 300 mm, respectively. Referring to FAA-P-8110-2-1995,
9
a measuring length of 76.2 mm is adopted. Crack “a” is at the center of the edge. Crack sizes of 3, 5, 10, 15, and 20 mm are included for all materials. In order to cover more crack sizes and display the tearing properties of various coated fabrics, crack sizes of 8 mm or 25 mm are adopted for different materials. Three samples are prepared for each crack. In this study, critical tearing strength is important. Therefore, it was necessary to ensure the integrity of the first yarn at the crack tip, and intact yarns whose total lengths are closest to the crack sizes are cut. The final adopted crack sizes and numbers of cut yarns are listed in Table 2, where the symbol “×” indicates exclusion. However, for convenience of presentation and comparison, the results are still distinguished by the crack sizes. Test specimens (unit: mm) in the (a) single-edge notched and (b) uniaxial central tearing tests. Adopted crack sizes and numbers of cut yarns in the single-edge notched tests.

As described in Section 4, the prediction effects of the different models are compared, and additional single-edge notched tests with one yarn and half-yarn cut of material P3 in warp are conducted. For the former, the same dimensions in Figure 2(a) are adopted, and the crack size is a yarn spacing. For the latter, single-edge notched tests with a half-yarn cut are very difficult to perform and uniaxial central tearing tests with a yarn cut are conducted to approximate the results. The sizes of the uniaxial central tearing samples were the same as those of the single-edge notched samples; only the crack location is different, which is at the center, as shown in Figure 2(b). The central crack size “2a” corresponds to a yarn spacing. Based on previous studies,19,28,32 because the critical tearing stress per unit length is needed rather than the critical tearing load and only one yarn is cut, the residual yarns are plentiful and the approximation is feasible. Careful and delicate operation is required to ensure the integrity of the first yarn at the crack tip and that the cracks are very small. The two additional tests are only used to examine the prediction effects of different models in a small crack range. Three samples are prepared for each crack.
As shown in Figure 3, all tests are conducted using the universal testing machine CMT4204 where the clamping fixture is adopted, and the maximum load is 20 kN so that it can meet the requirements of all tests. Furthermore, the reliable clamping and alignment of samples need a careful operation to ensure the test results. To reduce the dynamic effects, a low constant loading rate of 3 mm/min is implemented, and an initial tensile force of 5 N is set. All tests are conducted at a temperature of 20 ± 2°C and a relative humidity of 65 ± 3%. Test setup in the (a) universal testing machine, and (b) general situation.
Experimental results and discussion

Critical tearing strength of P1 (N/mm).

Critical tearing strength of P2 (N/mm).

Critical tearing strength of P3 (N/mm).

Critical tearing strength of P4 (N/mm).

Critical tearing strength of G1 (N/mm).

Critical tearing strength of G2 (N/mm).

To display the reduction in the tensile strength σu, due to the existence of cracks intuitively, diagrams presenting the ratio σ
c
/σ
u
versus the ratio of the crack size to the sample width L are shown in Figure 4, which also includes the net-section residual strength. It is evident that σ
c
is much lower than σ
u
and the net-section residual strength. Thus, the existence of cracks not only directly reduces the cross-section but also induces a stress concentration that further reduces the material strength. As the crack sizes increase, σ
c
decreases, but the decreasing trend gradually slows. Comparing the σ
c
/σ
u
values of different coated fabrics in warp and weft, it is shown that the weft ratio is close to that of the warp. This indicates that most materials have similar strength utilization in both directions with different crack sizes. However, in Tables 3–8, the absolute value of σ
c
in the warp is larger. σ
c
/σ
u
-a/L diagrams for (a) P1, (b) P2, (c) P3, (d) P4, (e) G1, and (f) G2.
Critical tearing strength prediction models
A modified stress field model is proposed based on the traditional stress field model and by considering the various stress reduction degrees in the crack section when crack sizes are different. This section discusses the comparison of two commonly used models (Thiele’s empirical formula and stress field model) and the proposed model. All three models can be used in architectural coated fabrics, and the plane stress state is typically required. The single-edge notched tests on six coated fabrics can meet these conditions. According to the test results, fitting constants of the three models are obtained. Their prediction effects and basic properties are displayed and analyzed. Furthermore, the rationality of the stress distribution assumption in the modified stress field model is checked.
Thiele’s empirical formula
Thiele’s empirical formula is a classical empirical model that has been widely used. It is based on inflatable cylinder tests and can accurately predict the tearing strength of airship envelope materials.22,34 The original form is
The single-edge notched test is an in-plane tearing method, where the curvature radius of specimens is positive and infinitely large. Thus, the value of r is close to positive infinity, and the formula can be simplified as
Stress field model
The stress field model assumes that the stress in the crack section is exponentially distributed.
16
At the onset of tearing, the stress is distributed as shown in Figure 5(a) and follows: Stress distribution at the onset of tearing in the (a) stress field model and (b) modified stress field model.

According to the stress equilibrium, the relationship between σ
c
and the crack size a in the single-edge notched tests can be proposed:
Constant B is obtained by fitting the test results.
From the assumption and derivation of the traditional stress field model, equations (4) and (5) and Figure 5(a) demonstrate that B has physical significance, which represents the degree of stress reduction in the crack section. In fact, σ u and B are the factors determining the tearing strength in this model. σ u determines the timing of tearing, and B determines how the stress in the crack section decreases. The larger σ u , the later the failure at the crack tip occurs. The smaller B, the more gradually the stress decreases. Both result in larger σ c . This model identifies samples with different cracks that share the same degree of stress reduction because of the consistent B value. However, as demonstrated by the results in Section 3.4, this assumption deviates from the actual situation.
Modified stress field model
In contrast to the consistent B value adopted in the traditional stress field model, a modified stress field model is proposed and takes B as a power function of the crack size, with reference to Thiele’s empirical formula. The stress distribution of the crack section at the onset of tearing is shown in Figure 5(b) and follows:
The stress equilibrium is also considered. The stress in the crack section should be balanced with remote tensile stress. Because of the stress concentration caused by cracks, the concentrated stress around the crack tip should be balanced with the transferred stress:
By simplification, the relationship between the critical tearing strength and crack size can be obtained as follows:

Results
Constants C k , n, B, k, and m.


Prediction effects of P1 in (a) warp and (b) weft.

Prediction effects of P2 in (a) warp and (b) weft.

Prediction effects of P3 in (a) warp and (b) weft.
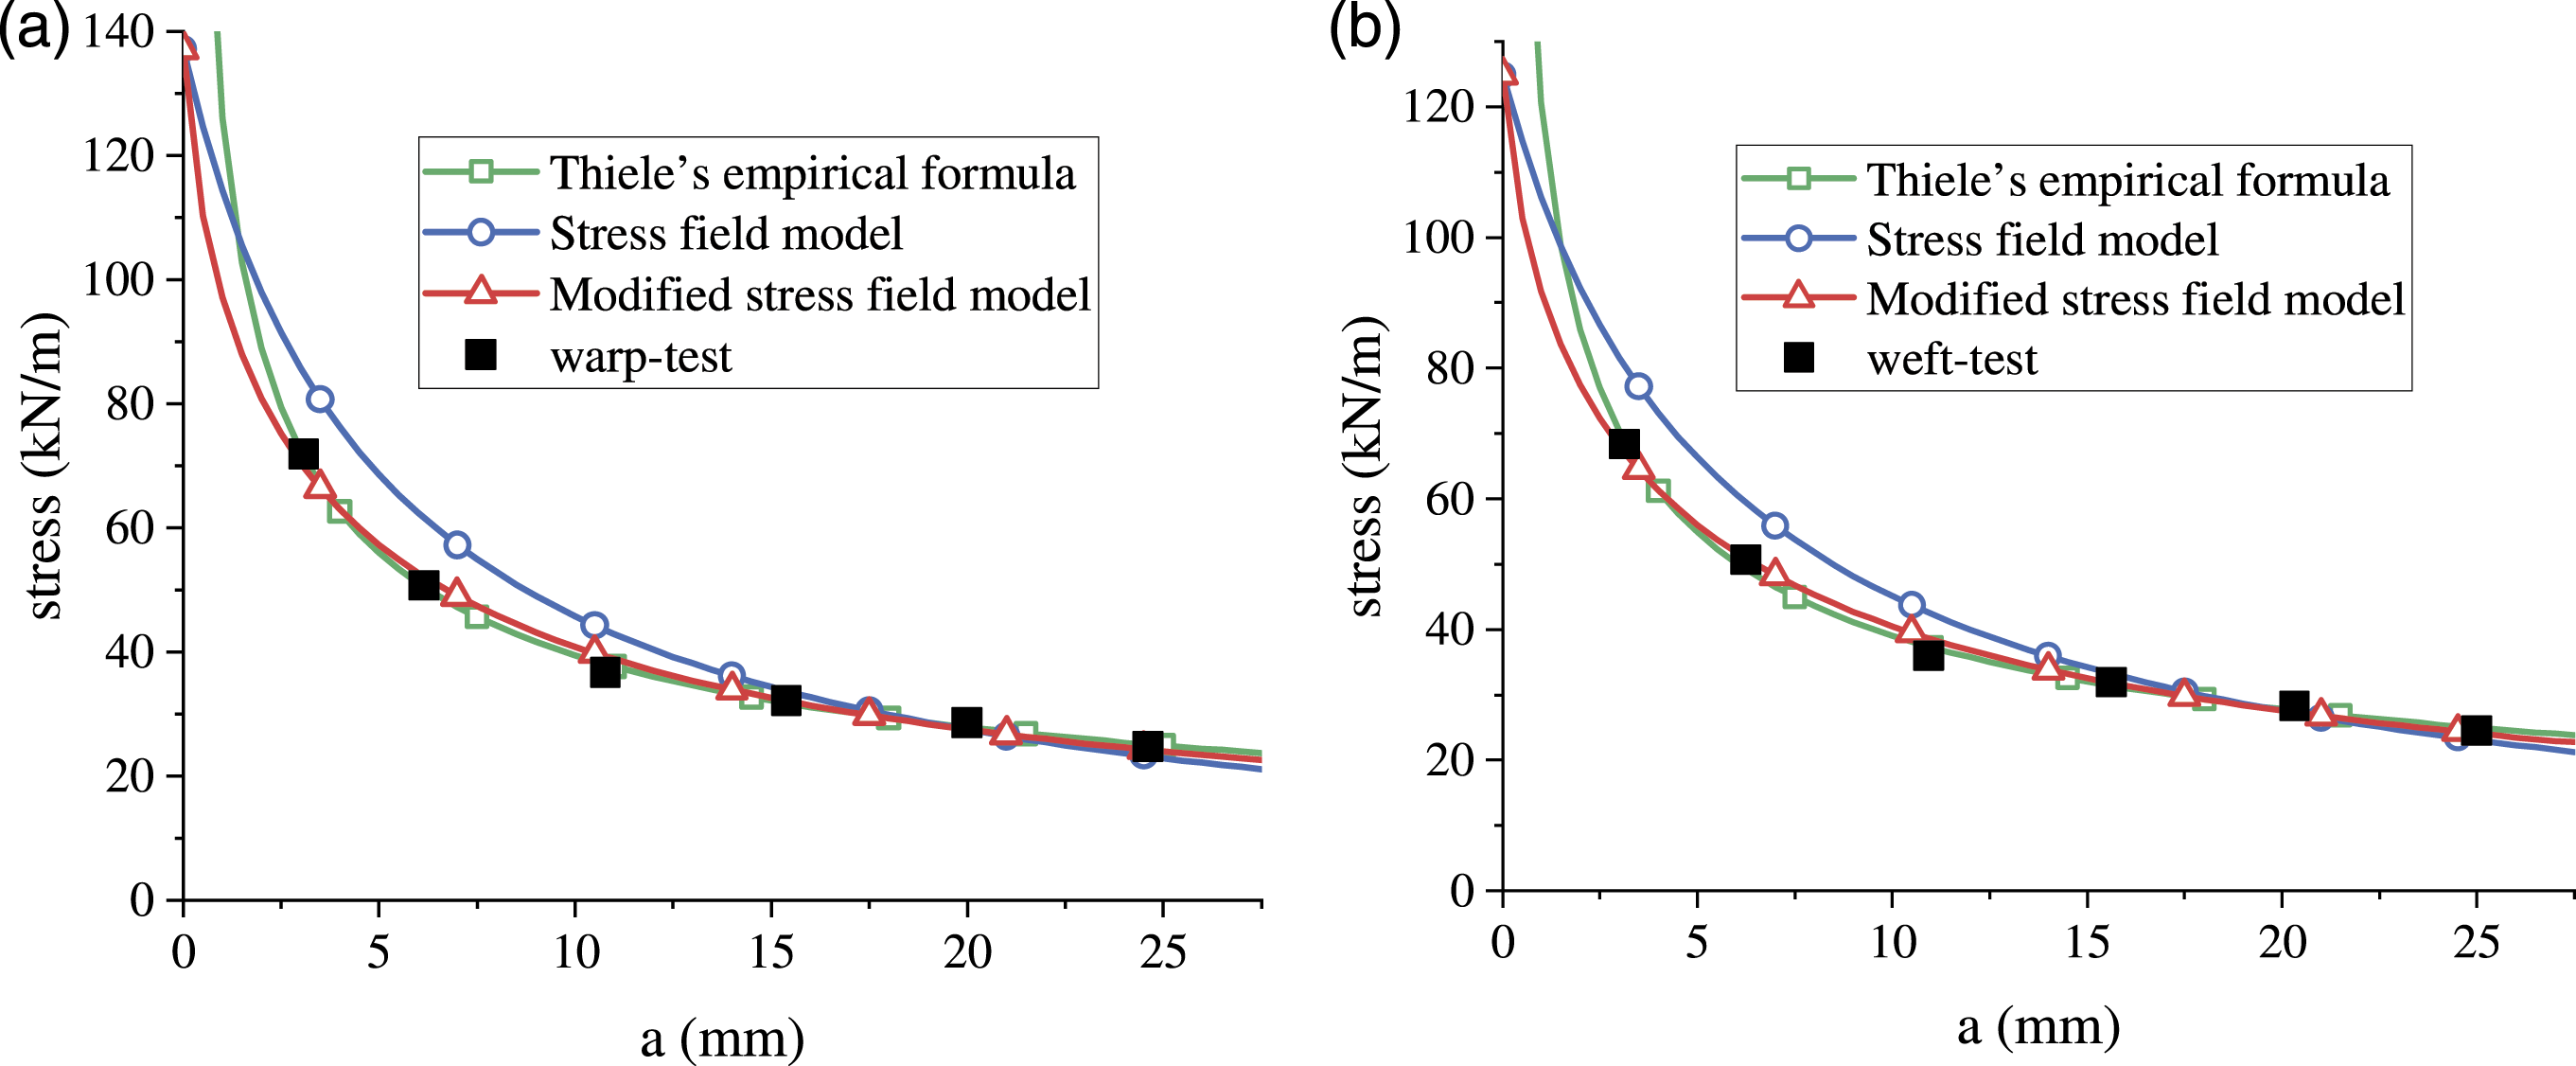
Prediction effects of P4 in (a) warp and (b) weft.

Prediction effects of G1 in (a) warp and (b) weft.

Prediction effects of G2 in (a) warp and (b) weft.
It is evident that Thiele’s empirical formula achieves good prediction effects in the tested crack range, which is similar to the results of previous studies.16,19,24,28,32 However, owing to its inversely proportional form, deviations will arise when extrapolating the critical tearing strength for smaller cracks, specifically for cracks close to 0 mm. In most cases, poor predicted results of the traditional stress field model are obtained until the cracks that are larger than 15 mm. However, the prediction effects of the modified stress field model are comparable to those of Thiele’s empirical formula in the tested crack range and better than those of the stress field model. Furthermore, for samples without cracks, σ c should be equal to σ u . The modified model can meet this requirement, which is not the case for Thiele’s empirical formula.
Discussion
From the aforementioned results, both Thiele’s empirical formula and the modified stress field model offer a good prediction. However, the fitting constants of the Thiele’s empirical formula lack physical significance.
In contrast, although the stress field model has physical significance, its prediction effects are poor. This can be attributed to the requirement that samples with different crack sizes need to share the same degree of stress reduction due to the consistent B value. However, a special situation is that for samples without cracks (corresponding to uniaxial tensile state), there should be no stress reduction degree. By equation (5), the individual B values for every crack size in all materials are calculated and shown in Figures 12–17. It is evident that B is different when the crack size is different, and generally, B decreases with the increase of crack sizes. Therefore, it is inappropriate to adopt a constant B value, and a decreasing trend of B should be considered when better prediction effects are needed. B of P1 in (a) warp and (b) weft. B of P2 in (a) warp and (b) weft. B of P3 in (a) warp, and (b) weft. B of P4 in (a) warp and (b) weft. B of G1 in (a) warp and (b) weft. B of G2 in (a) warp and (b) weft.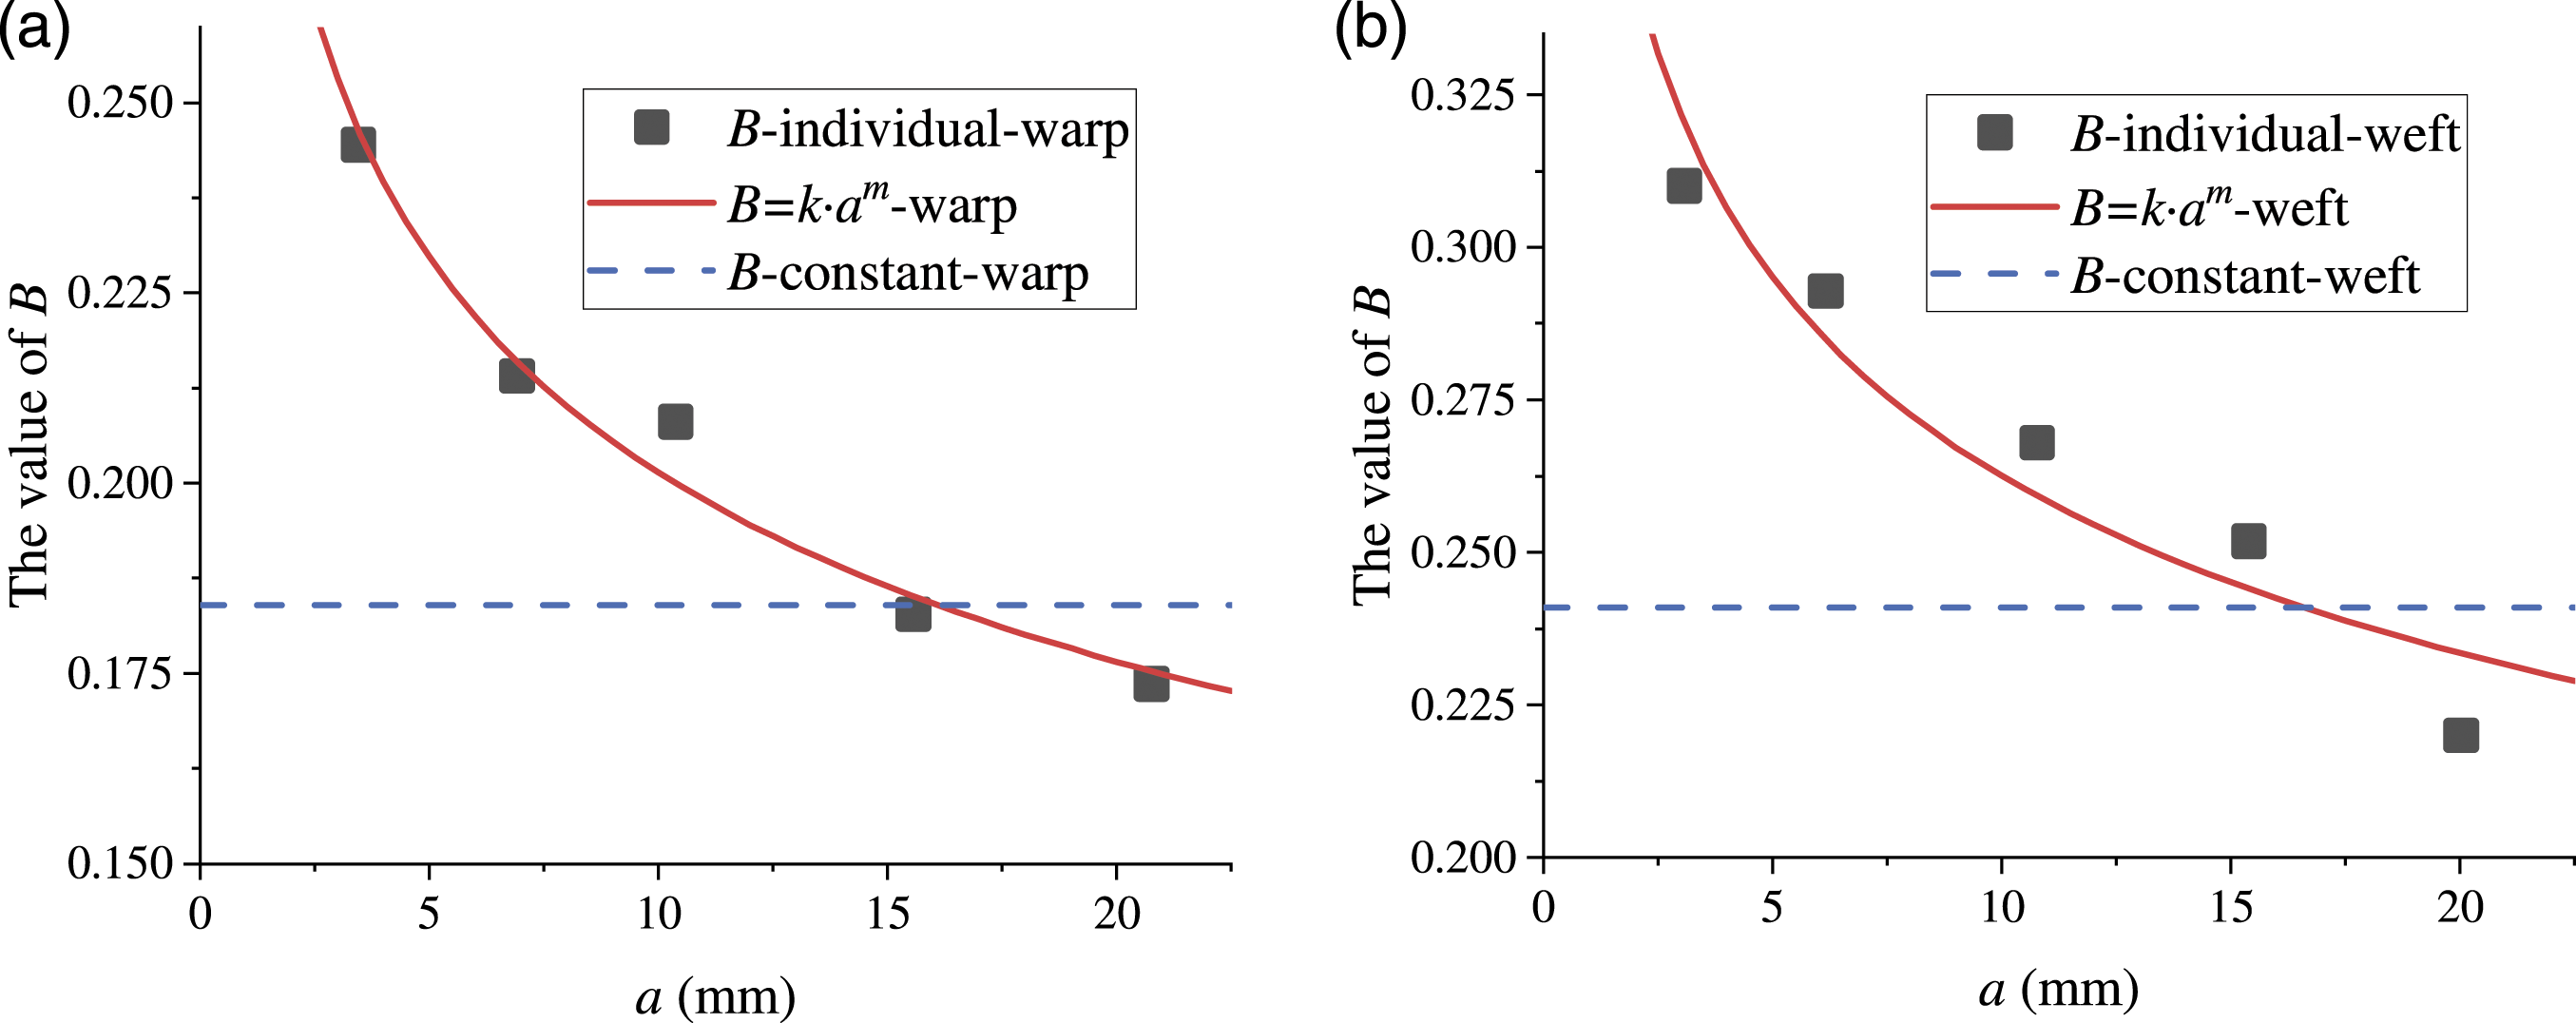
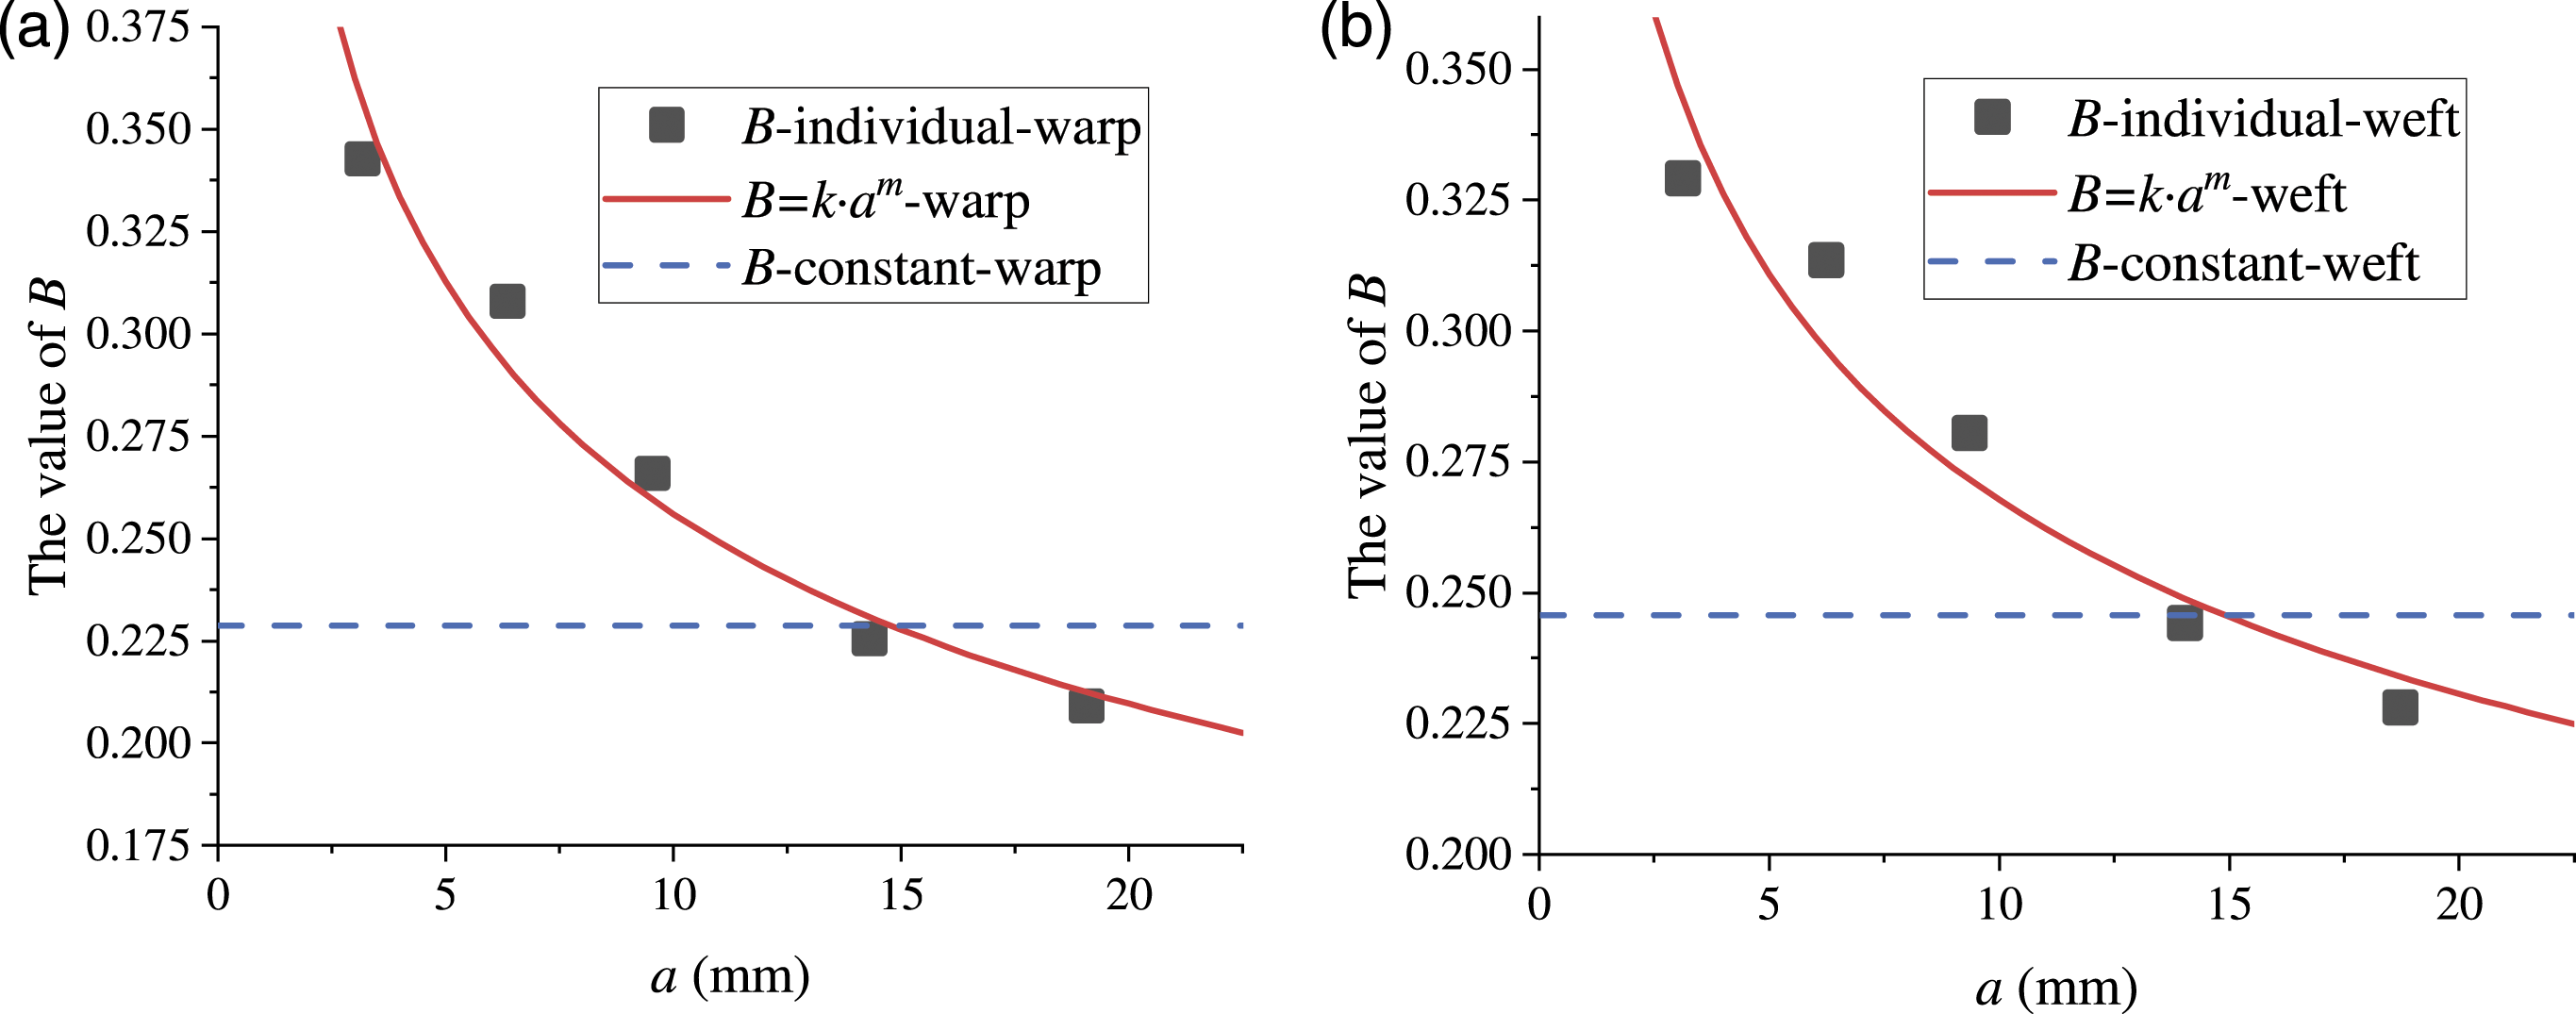


In addition, the modified stress field model can reflect the different degrees of stress reduction for different cracks. According to its assumption, by substituting k and m in Table 9 into equation (9), all the different B values can be calculated, as shown in Figures 12–17. For uniaxial tensile state, equation (9) results in B equal to 0, which can reflect the actual situation. The figures depict that the modified model exhibits a decreasing trend of B with the increase in crack sizes, which is why the modified model offers better prediction effects than the stress field model.
The rationality of the stress distribution assumption in the modified stress field model is explained using the work of Bao.
30
By employing the DIC equipment, Bao obtained the stress distribution in the crack section of material P2 in uniaxial central tearing tests with different central cracks, as shown in Figure 18. By substituting k, m, and B of P2 in Table 9 and the different crack sizes into equations (4)–(6), and (8), the predicted stress distribution in the crack section can be obtained using the traditional and modified stress field models, as shown in Figure 18. It is clear that the results of the modified model are similar to the test results, whereas some deviations occur in the stress field model. Therefore, the stress distribution assumption of the modified stress field model is more reasonable than that of the traditional model. Stress distribution in the crack section of P2 in (a) warp-3.18, (b) weft-3.9, (c) warp-4.77, (d) weft-5.46, (e) warp-9.54, and (f) weft-10.14.
From the above results, the basic properties of the three models can be assessed: (i) Thiele’s empirical formula offers good prediction results but is an empirical model; (ii) the traditional stress field model has poor prediction because it requires all notched samples to share the same stress reduction degree; (ii) the prediction effects of the modified stress field model are good and similar to those of Thiele’s empirical formula, with the advantage that the fitting constants of the new model can reflect the different stress reduction degrees for various cracks.
Prediction effects of three models in different crack ranges
Background and test results in small crack range
In this study, the minimum crack size is 3 mm. For cracks less than 3 mm, because the integrity of the first yarn at the crack tip must be guaranteed and the cracks are small, the test operation is often difficult. However, for engineering needs, σ c in different ranges is important. Therefore, a theoretical method to acquire predicted σ c for small cracks instead of performing testing is worth considering, which leads to the need for model extrapolation and accuracy in the small crack range. Based on the above results, both Thiele’s empirical formula and the modified stress field model have good prediction effects in the tested crack range. Observing the forms of the three models, it is evident that the σ c values predicted by Thiele’s empirical formula gradually approach infinity with the decrease of crack sizes. Although this situation does not appear in the other models, the prediction effects of the traditional stress field model are not good. Therefore, this section compares the predicted σ c values of the three models in different ranges, particularly in the small crack range. Accordingly, the properties of the three models can be discussed and inspected in more detail.
Critical tearing strength of P3 with half and one yarn cut in warp (N/mm).

Comparison of prediction effects in different crack ranges
Data employed in different cases.
C k , n, B, k, and m in both cases.


Prediction effects of three models for P3 in warp in (a) Case 1, (b) local enlarged view of Case 1, (c) Case 2, and (d) local enlarged view of Case 2.
For cracks smaller than 5 mm, Figure 19(b) and (d) indicate that the deviations of the stress field model are large. However, as B values in Table 12 are approximately the same, the two σ c -a curves appear similar. In this crack range, the prediction effects of Thiele’s empirical formula are not accurate enough. In Case 1, the test data in Table 10 are not involved in the fitting. Because of the inversely proportional form of Thiele’s empirical formula, the deviations are large for tests with only one yarn and half-yarn cut when extrapolating. However, for the remaining cracks, the deviations are sufficiently small. In Case 2, the test data in Table 10 are included. By utilizing these data, the predicted σ c values are adjusted for tests with the minimum crack and one or two subsequent cracks in Thiele’s empirical formula, as shown in Figure 19(d). Therefore, the predicted σ c values deviate slightly. However, as shown in Figure 19(b) and (d), regardless of the test data in Table 10 are involved in fitting or not, the deviation caused by extrapolation or adjustment in Thiele’s empirical formula does not appear in the modified stress field model. The prediction effects of the modified model are good, except for a slight deviation for the minimum crack in Case 1.
For cracks larger than 5 mm but smaller than 15 mm, in both cases (as shown in Figure 19(a) and (c)) the prediction effects of Thiele’s empirical formula and the modified stress field model closely approach and fit well the test data. However, in this crack range, the deviations of the stress field model remain large.
For cracks larger than 15 mm, the prediction effects of the three models are similar, and the results are all close to the test data (see Figure 19(a) and (c)), which is why the stress field model showed good prediction effects when it was first proposed. 16 In that study, the minimum crack size was 10 mm (corresponding to 5 mm in the single-edge notched tests), and the other adopted cracks were larger. Therefore, the deviations of Thiele’s empirical formula and the stress field model were both small in that work.
Discussion
According to the comparison results, the properties of the three models in different crack ranges are clear. The prediction effects of Thiele’s empirical formula in the small crack range may not be accurate because of extrapolation or adjustment, but as the crack size increases, this formula becomes more accurate, particularly in the tested crack range. The prediction effects of the stress field model are not good, but in the large crack range, the deviations become smaller. The modified stress field model can offer good prediction effects in different crack ranges, the inaccuracy caused by extrapolation or adjustment in Thiele’s empirical formula does not appear, and the predicted results for small cracks can remain undistorted even when extrapolating. These properties of the modified model, specifically in the small crack range, are what the two commonly used models lack and can be regarded as supplements and improvements to them.
Prediction effects based on only two cracks
Currently, the trapezoidal tearing test is widely adopted in many specifications. Usually, the crack size of its samples is fixed, and the number of tests is between three and five. This can offer a stable tearing strength. However, the tearing strength is determined by the size of the tearing del-zone and the stress state deviates from that of the membrane structure. Therefore, the trapezoidal tearing strength is simply adopted as a material parameter in the present study.
The failure modes and stress states of the single-edge notched and uniaxial central tearing tests are close to those of the membrane structures. However, they are not widely adopted in different specifications, partly because the number of tests is often large. To obtain the comprehensive single-edge notched or uniaxial central tearing properties, the critical tearing strengths at different crack sizes are required, which is the σ c -a curve. The currently adopted operation involves conducting tests with several cracks and obtaining a series of test data, which are some points on the σ c -a curve. Then, using different models, a continuous σ c -a curve can be obtained. Based on the curve, the design and calculations can be conducted, such as the determination of the allowable crack size.19,24,30,32
Therefore, if a model can employ fewer test data to obtain an effective σ c -a curve, it will reduce the amount of test work and facilitate the use of single-edge notched or uniaxial central tearing tests. Both the modified stress field model and Thiele’s empirical formula have two fitting constants and their σ c -a curves can, in theory, be obtained based on only two test data. Therefore, in this section, we examine the prediction effects of these two models based on only two crack sizes in order to acquire the most suitable crack combination. The properties of the two models are, as well, further discussed. Although the stress field model has only one fitting constant, its σ c -a curve deviates significantly. Therefore, no further consideration is given to it.
Acquisition of k and m based on only two cracks
Crack combinations.

Thus, the RMSEs of all crack combinations for the six coated fabrics in the two directions are calculated and shown in Figure 20(a). According to the figure, the maximum RMSE is less than 10. A large crack and a small one can induce reasonable fitting results, whereas adjacent cracks, specifically adjacent large cracks, exhibit certain deviations. Small RMSEs with sufficient data occur for Combination 4, which includes crack sizes of 3 mm and 15 mm. In this combination, all RMSE values are less than 2. Although Combinations 6 and 14 also have small RMSEs, they lack sufficient data and thus are not investigated. Obtained RMSE distributions using the (a) modified stress field model and (b) Thiele’s empirical formula.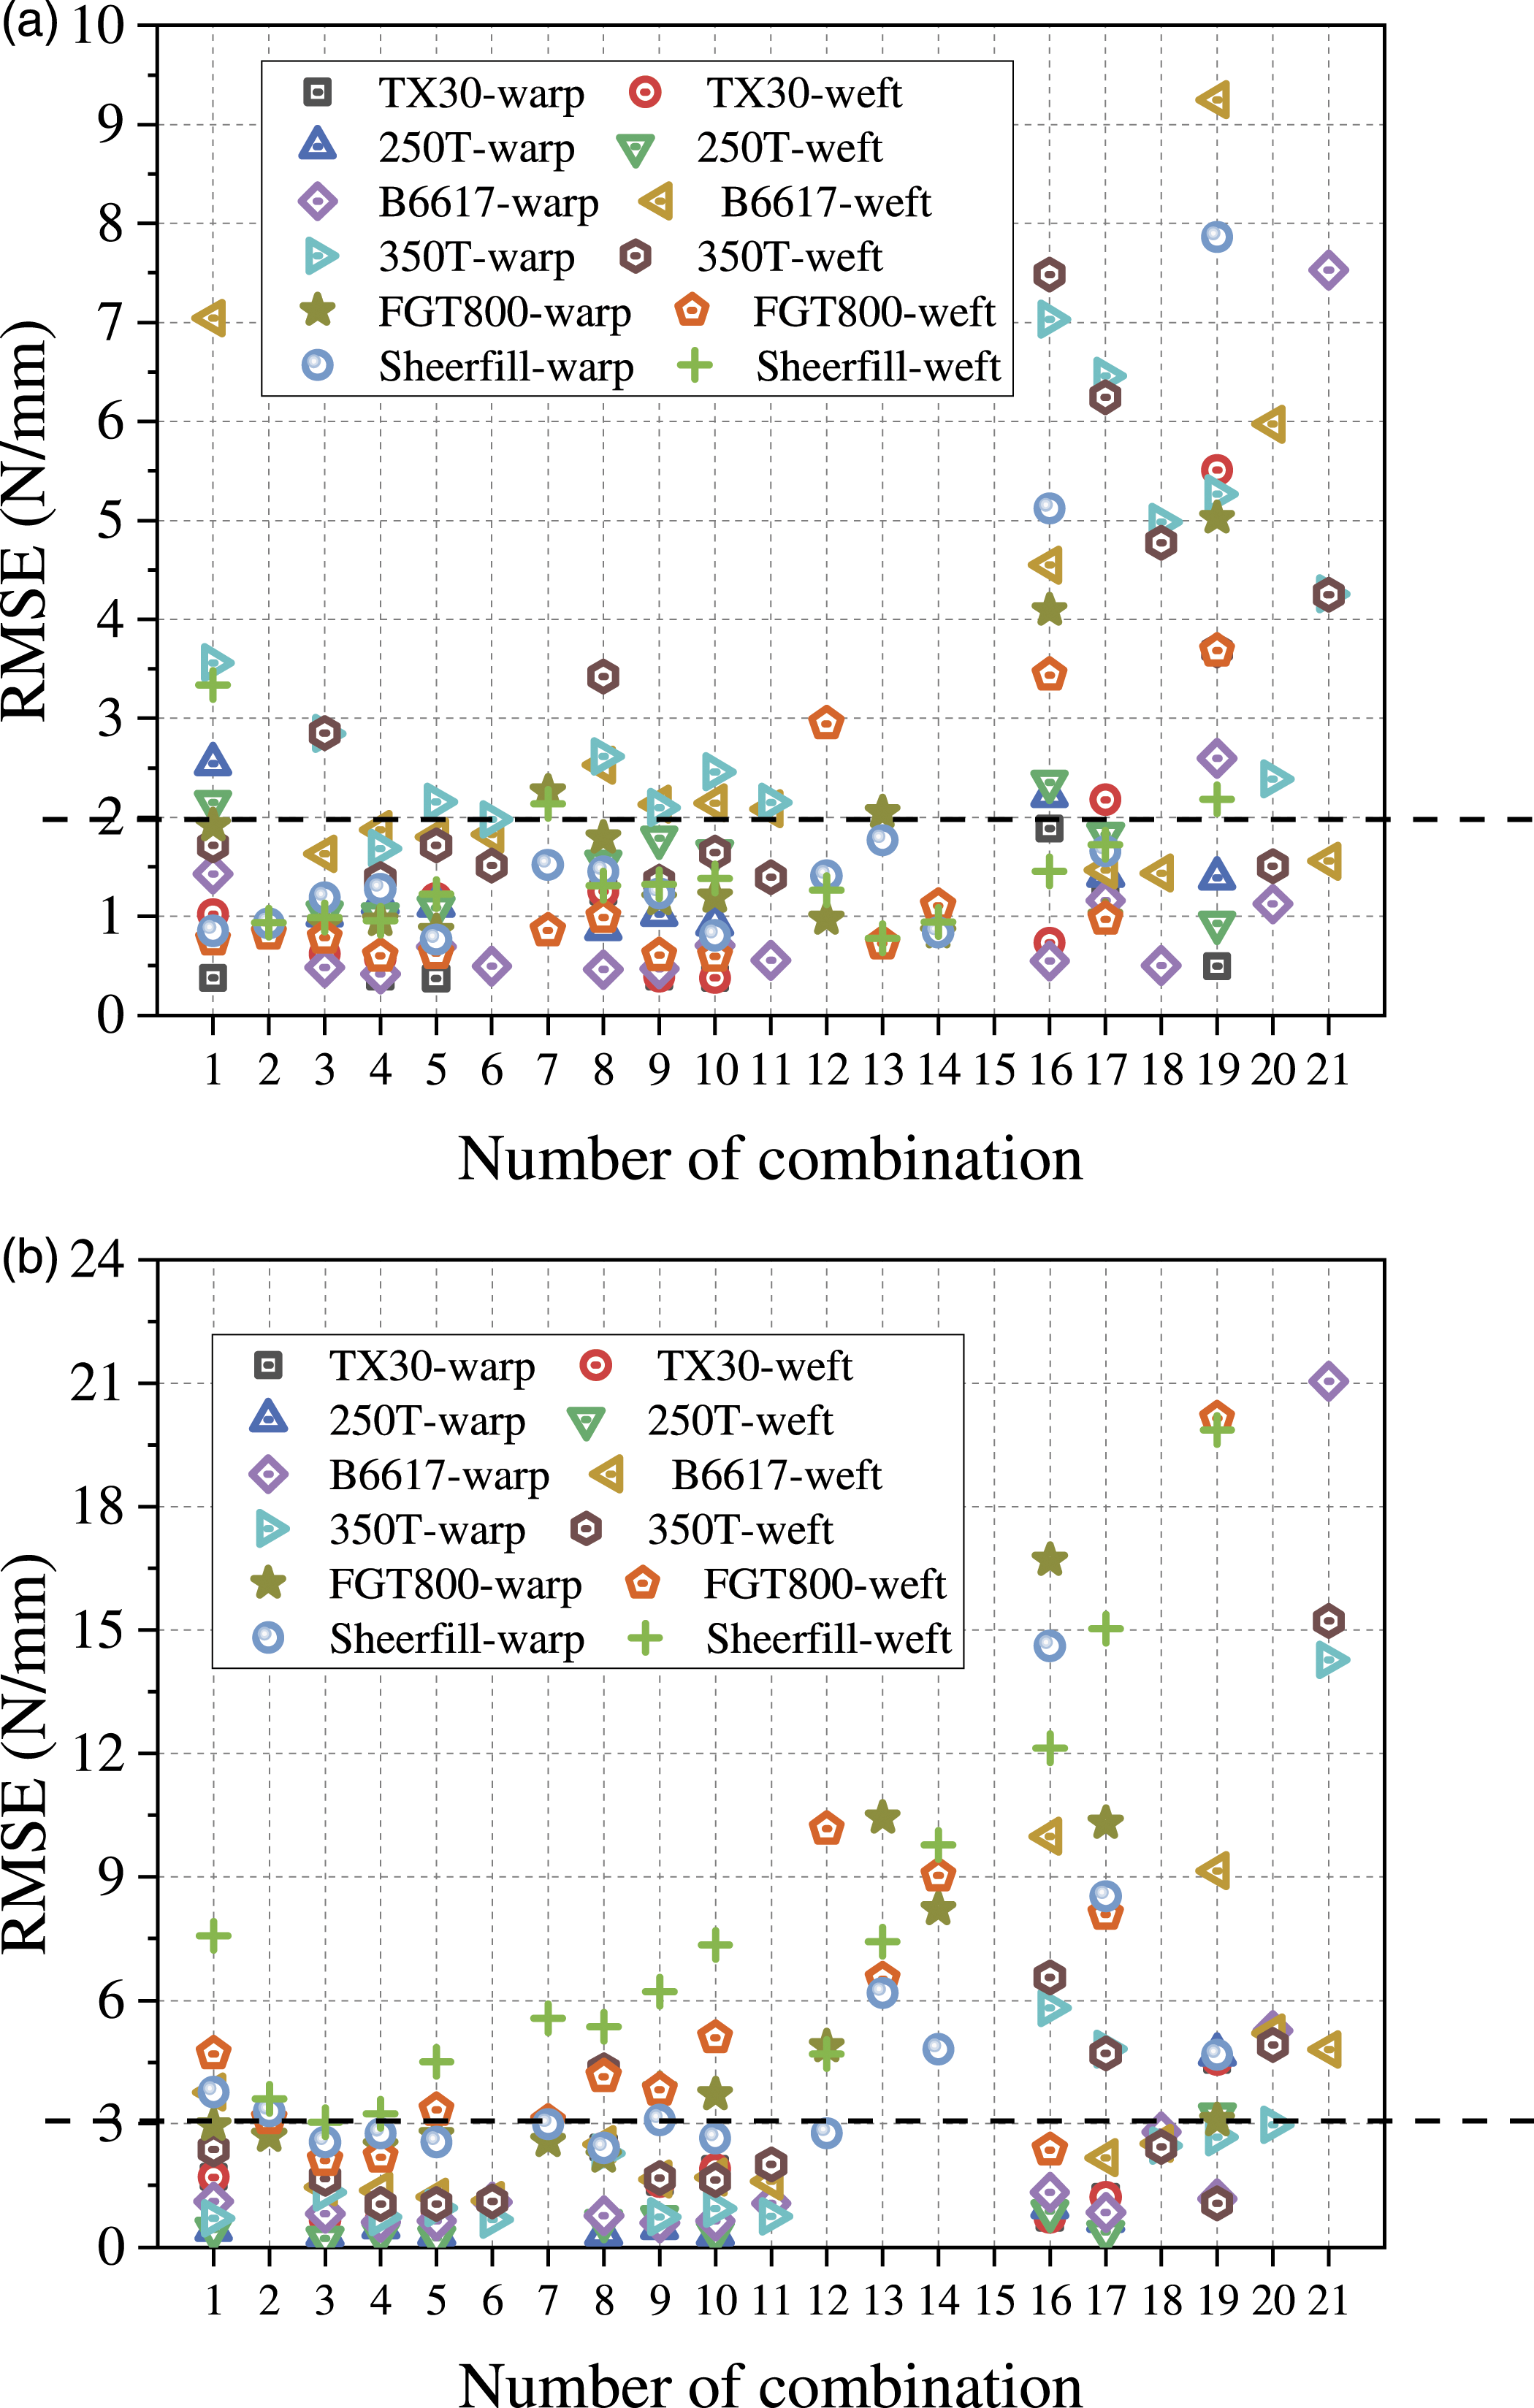
C k , n, k, and m values only based on Combination 4.


Prediction effects based on Combination 4 of P1 in (a) warp and (b) weft.

Prediction effects based on Combination 4 of P2 in (a) warp and (b) weft.

Prediction effects based on Combination 4 of P3 in (a) warp and (b) weft.

Prediction effects based on Combination 4 of P4 in (a) warp and (b) weft.

Prediction effects based on Combination 4 of G1 in (a) warp and (b) weft.

Prediction effects based on Combination 4 of G2 in (a) warp and (b) weft.
Acquisition of C k and n based on only two cracks
The acquisition of the σ c -a curve using Thiele’s empirical formula based on only two test data is similar to the process described above. The RMSEs of all combinations in Table 13 for the six coated fabrics based on Thiele’s empirical formula are calculated and shown in Figure 20(b). It is also evident that a reasonable crack combination should include a small crack and a large one. Combination 3 (3 mm + 10 mm) and Combination 4 (3 mm + 15 mm) have small RMSEs with sufficient data. In the two combinations, the maximum RMSE is slightly greater than 3. For the modified model, the maximum RMSE for Combination 4 is slightly less than 2. Therefore, both models offer good prediction effects based on Combination 4. This finding also indicates that the recommended crack combination is similar, although the model adopted is different.
The fitting constants C k and n acquired based on Combination 4, are listed in Table 14. Then, the σ c -a curves are obtained and shown as dashed lines in Figures 21–26. For most PVC-coated fabrics, the prediction effects of the modified stress field model and Thiele’s empirical formula are similar. However, in the remaining cases, particularly for the PTFE-coated fabrics, the modified model provides better prediction effects. The deviations of Thiele’s empirical formula are also caused by adjustments when the test data corresponding to smaller cracks are involved in the fitting. As shown in Figures 25 and 26, the deviations are mainly located in the subsequent two or three tests whose cracks are adjacent to 3 mm, and as the crack size increases, the deviations gradually decrease. This adjustment method is the same as discussed in Section 4.2 (Case 2 in Table 11). However, because only two test data are adopted to obtain the fitting constants, the weight of the test data with a 3 mm crack is increased, the predicted σ c being adjusted is greater, and the deviations increase accordingly.
Discussion
The discussion on RMSE indicates that a crack combination of 3 mm + 15 mm is preferable. This combination can induce reasonable predicted results in the modified stress field model, and the results are close to those obtained by fitting involving all data, which means that the number of tests can be greatly reduced. However, under this condition, Thiele’s empirical formula may deviate in certain cases because of its adjustment.
In addition, the extrapolated prediction effects of the two models for small cracks based on the crack combination of 3 mm + 15 mm are compared. The comparison is also conducted according to the data in Tables 5 and 10, and the results are presented in Figure 27. The large deviations of Thiele’s empirical formula are evident in Figure 27(b). However, the modified model still achieves good prediction effects, even when extrapolation is needed. Therefore, even if only two test data are employed for small cracks, the prediction effects of the modified model remain undistorted. Prediction effects of two models based on Combination 4 for P3 in warp in (a) overall σ
c
-a curve, and (b) local enlarged view.
Conclusion
In this study, a modified stress field is proposed by combining the characteristics of two commonly used models: Thiele’s empirical formula and the stress field model. Based on the single-edge notched test results of six coated fabrics, the prediction effects and properties of the three models are discussed and compared. The conclusions are as follows: (1). Single-edge notched tests of four PVC-coated and two PTFE-coated fabrics are conducted. The results show that the existence of cracks significantly reduces the tearing strength. Specifically, the critical tearing strength σ
c
is much lower than the uniaxial tensile strength σ
u
and net-section residual strength, and σ
c
in the weft is less than that in the warp. However, the strength utilization in both directions is similar. (2). Using the test results, the prediction effects and basic properties of two commonly used models are obtained. Thiele’s empirical formula offers better prediction but lacks physical significance. Fitting constant B of the stress field model represents the degree of stress reduction in the crack section. This model requires samples with different cracks to share the same stress reduction degree, which does not accurately represent a realistic situation. Thus, its predicted results are often poor. (3). A modified stress field model is proposed by assuming that B is a power function of the crack size, which refers to Thiele’s empirical formula. In the tested crack range, its good prediction effects are similar to those of Thiele’s empirical formula. Furthermore, the new model can display the decreasing stress reduction degree as crack sizes increase. (4). The predicted results and properties of the three models in different crack ranges are further discussed and compared, particularly in the small crack range. Because of the form of Thiele’s empirical formula, its prediction effects in the small crack range may deviate because of extrapolation or adjustment; outside this range, its predicted results are good. The prediction effects of the stress field model are not good until the crack size is large. The modified stress field model can provide accurate predictions in different crack ranges even when extrapolating for small cracks, an aspect that lacks in the other two models. (5). To reduce the number of tests and facilitate the application of single-edge notched or uniaxial central tearing tests, a crack combination of 3 mm + 15 mm is recommended, which is further confirmed using the RMSE index. A comparison between Thiele’s empirical formula and the new model is conducted using this combination. Although only two test data are involved, the modified model can still achieve good prediction, which is close to that obtained using all the test data involved in fitting. In addition, when extrapolation is needed for smaller cracks, its results remain undistorted. Under such condition, Thiele’s empirical formula deviates in certain cases because of its adjustment and inaccurate extrapolation.
Abbreviations
digital image correlation
polytetrafluoroethylene
polyvinylchloride
root-mean-square error
Footnotes
Declaration of conflicting interests
The author(s) declared no potential conflicts of interest with respect to the research, authorship, and/or publication of this article.
Funding
The author(s) disclosed receipt of the following financial support for the research, authorship, and/or publication of this article: This work was supported by the National Natural Science Foundation of China through research project No. 51778458.