
Abstract
Glass reinforced epoxy composite tubes filled with 1, 2, 3, and 4 wt. % of HNC, MC, Al2O3, SiO2, and SiC nanofillers were fabricated using wet-wrapping process by hand lay-up and tested under quasi-static axial loadings. Crashworthiness parameters and failure modes were recorded. Results indicated that EAC and the specimens’ failure modes are dominated by the type and wt. % of the embedded nanofillers. As compared to pristine glass/epoxy tubes, an enhancement of 230.42, 243.30, 286.43, and 336.12% in the absorbed energy (U) was attained by the addition of 1, 2, 3, and 4 wt. % of HNC, respectively. An improvement of 21.93, 87.35, 225.99, and 318.07% in U was achieved by the inclusion of 1, 2, 3, and 4 wt. % of MC, respectively. An enhancement of 17.66, 51.63, and 71.94% in U was reported by the integration of 1, 2, and 3% of nano-Al2O3. Whilst a reduction of 31.16% was noticed for 4 wt. % of nano-Al2O3. The incorporation of nano-SiO2 and nano-SiC exhibits a reduction in U of the fabricated tubes. Composites filled with 4 wt. % of HNC has the highest load carrying capacity and EAC of 32.75 kN and 1110.84 J, respectively. So, they seem to be the best appropriate choice for energy absorbing elements. Glass/epoxy composite tubes filled with HNC, MC, and Al2O3 show outstanding energy absorption characteristics. However, specimens filled with SiO2 and SiC nanofillers are ineffective in the crashworthiness applications.
Keywords
Introduction
Crashworthy structure is designed such that in the event of a crash, it absorbs the impact energy in a controlled manner before the energy gets transmitted to the passenger. 1 Thin-walled structures are commonly used in automotive industries as energy absorbing components because of their lightweight and high energy absorption capacity. Many research efforts have been carried out to examine the crashworthiness performance of thin-walled structures in the literature.2–10
Traditionally metals such as aluminum and steel have been applied for crashworthy structures. Contrary to metals, especially in compression, most composites are generally characterized by a brittle rather than ductile response to load. While metal structures collapse under crush or impact by buckling and/or folding in accordion type fashion involving extensive plastic deformation, composites fail through a sequence of fracture mechanisms involving fiber fracture, matrix cracking, fiber-matrix debonding, delamination, and interply separation. The actual mechanisms and sequence of damage of composites are highly dependent on the geometry of the structure, lamina orientation, type of trigger, and crush speed, all of which can be suitably designed to develop high energy absorbing mechanisms.11,12 According to Carruthers, 13 composite materials do not exhibit the ductile failure processes associated with metals and most thermoplastics (although there are exceptions). Instead, the brittle nature of most fibers and thermosets tends to generate a brittle mode of failure. This is the fundamental difference which gives rise to the very distinct energy absorption characteristics of composite materials. If polymer composites are properly designed, they can absorb high amounts of impact energy by progressive crashing and delamination.11,14 The performance of composite (the degree of ductility or brittleness) is primarily driven by the behavior of its constituent materials. Several factors influencing the mechanical properties of polymer composites, such as fiber loadings, fiber length, fiber architecture, fiber and matrix type, chemical treatments, and hybridization by incorporating different natural/synthetic fiber/fillers. 15 The combination of ductile fiber with ductile thermoplastic matrices, leads to ductile composites. 16 Since the composites’ response depends on its microstructure design, comprehensive efforts are continuously being done in the direction of new composites.
Recently, researchers have focused on nanoscale reinforcements such as carbon nanotubes (CNTs),17,18 SiO2,19,20 MC,21–23 graphene, 24 Al2O3,25,26 SiC, 27 and HNC28,29 to fabricate multiscale composites. Nanoscale reinforcements have positively improved the mechanical, physical, chemical, and thermal properties of composites. It is evident in the literature that composites with nanoscale reinforcements can attain substantial enhancements in fracture toughness and energy absorption which could be significant in designing vehicle structures.17,30
Summary of some research works on nanocomposite structures for crashworthiness application in the last 10 years.

It is clear from the above literature that nanofillers have the prospective to be employed as a secondary strengthening agent in composite structures used as energy dissipating elements. Nanofillers play an important role in improving EAC as well as the mechanical characteristics of traditional composites. It is worth noting that inexhaustive research works have studied the quasi-static axial crushing characteristics of polymer composite tubes filled with nanofillers. To the best knowledge of the authors, no attention has been devoted to polymer composites containing HNC, MC, Al2O3, SiO2, and SiC nanofillers to be used as energy dissipating elements. So, the main objective of the present study is to experimentally investigate the potentiality of different nanofillers (HNC, MC, Al2O3, SiO2, and SiC) at five different loadings (0, 1, 2, 3, and 4 wt. %) on the crashworthiness performance of glass/epoxy composite tubes. Nanofilled composite tubes were fabricated using wet-wrapping process by hand lay-up and tested under quasi-static axial loading. In this study, the authors try to attain newly designed nanocomposite materials to be applied as energy dissipating elements in modern vehicles to deliver occupant safety during accidents. The proposed nanofilled composite tubes are suggested to be used as energy absorbers in the front of train structure or automobile structure, that is, anti-impact rods. These composites can also be applied as crash box in the front of the automobile and energy absorption tubes in aircraft fuselage. The proposed composites can be designed and utilized for a particular type of load into the various major structures for high-performance applications and safety equipment in major transportation industries such as aerospace, automotive, and marine industry.
Methodology
Uniaxial quasi-static compression tests with crosshead speed of 10 mm/min were performed to examine the crushing behavior of glass fiber/epoxy circular composite tubes filled with different nanofillers. The effect of wt. % of the used nanofillers on the crushing characteristics and the specimens’ failure mechanisms has been studied.
Materials
Plain weave E-glass fabric with GSM of 200 g/m2 and yarn diameter of fiber is about 16 μm was selected as a reinforcement. E-glass fabric was supplied by Hebei Yuniu Fiber Glass Manufacturing Co Ltd China, Mainland. Kemapoxy 150RGL provided by Chemicals for Modern Buildings Co Ltd Egypt was chosen as a matrix material due to its good adhesive properties, superior mechanical properties, reduced degradation from water ingress, improved resistance to fatigue and micro cracking, and increased resistance to osmosis. 51 It is characterized by the high resistance against mechanical stresses and chemical effects. 6 Kemapoxy 150 RGL has been effectively used by many authors in their work.52–61 HNC, MC, Al2O3, SiO2, and SiC nanofillers were selected for this study due to the availability, good mechanical properties, and being successfully used for reinforcing polymers. In the literature, there is a little work on using the selected nanofillers in crashworthiness applications. HNC, MC, Al2O3, SiO2, and SiC nanofillers were provided by Sigma-Aldrich Co Ltd United Kingdom. The specifications of the used nanofillers are as follows: HNC with diameter × length = 30–70 nm × 1–3 μm and surface area of 22.1–81.6 m2/g, MC with particle size ≤20 μm and surface area of 220–270 m2/g, Al2O3 with particle size, SiO2 with particle size <50 nm and surface area of 175–225 m2/g, and SiC with particle size <100 nm and surface area of 175–225 m2/g.
Dispersion of nanofillers into epoxy resin
Nanofillers were separately added to the epoxy. The mixture was manually stirred up for about 5 min, Figure 1(a). Then the mixture was sonicated, for 3 h, using high intensity ultrasonic processor (type: Hielscher UP200S, 200 watts, 24 kHz, and amplitude of 70%), Figure 1(b). Referring to Megahed et al.,20,26,62,63 the chosen sonication parameters ensure the good uniform dispersion of nanofillers in epoxy and break up any aggregation thus the compatibility of nanofillers with epoxy resin could be enhanced. So, improved mechanical properties could be obtained. As sonication occurs, the mixture was placed in an ice-water bath to decrease the released temperature.
61
Later, the hardener was mixed with epoxy and nanofillers with a wt. ratio of 1:2 as supplier recommendation. Then, the mixture was manually stirred up for about 5 min to be ready for usage, Figure 1(c). Steps of fabricating glass/epoxy circular composite tubes filled with nanofillers. All the steps were carried out at room temperature (25°C). (a) Adding nanofillers to the epoxy. The mixture was manually stirred up for about 5 min [71]; (b) The mixture was sonicated, for 3 hours [52, 53, 62]; (c) The hardener was mixed with the epoxy and nanofillers. The mixture was manually stirred up for 5 min [6]; (d) The mixture was spread upon glass fabric [72]; (e) Impregnation of the fabric with matrix using a roller [6]; (f) Impregnation of the fabric with matrix using a brush [6]; (g) Wrapping the impregnated fabric around a circular aluminum mandrel [6]; (h) Final products were left to be cured for 7 days [71].
Fabrication of nanofilled composite specimens
In this study, wet-wrapping process by hand lay-up was used to fabricate glass/epoxy circular composite tubes filled with HNC, MC, Al2O3, SiO2, or SiC nanofillers. Hand lay-up is the most basic fabrication method for thermoset composites.
64
Due to the simplicity, low-cost option, and minimal infrastructural requirements of hand lay-up fabrication process,
65
it has been used by several researchers.6,66–69 Hand lay-up process also allows creating simple and complex shapes.
70
The steps of the fabrication process are summarized as follows: ⁃ The epoxy-hardener-nanofiller mixture was uniformly spread upon the glass fabric, Figure 1(d). ⁃ The glass fabric was impregnated using a roller and a brush, Figure 1(e) and (f). ⁃ The impregnated glass fabric was wrapped around a circular aluminum mandrel with 33 mm outer diameter. Each composite tube was made of 12 glass plies, Figure 1(g). ⁃ The primarily constructed tubes needed 7 days at room temperature for complete curing. ⁃ After complete curing of fabricated tubes, the aluminum mandrel was removed and the fabricated tubes were visually inspected for geometrical irregularities or material imperfections, Figure 1(h). ⁃ The consolidated tubes were cut into 60 mm length. Description, and the measured geometrical parameters of the fabricated composite tubes are shown in Table 2. Description, and the measured geometrical parameters of nanofilled glass/epoxy composite tubes.

Quasi-static compression test
Quasi-static axial compression tests were carried out to determine the crashworthiness parameters of the fabricated composite tubes using a universal testing machine with a capacity of 100 kN (Type: Jinan WDW, China (Mainland)) at a crosshead speed of 10 mm/min. The advantages of quasi-static axial compression tests over the impact tests are as follows:
12
1. Quasi-static tests are simple, easy to control, and available in low cost. 2. Impact tests require very expensive equipment to follow the crushing process because the whole crushing takes place in a split second. Hence, quasi-static tests are used to study the failure mechanisms in composites, by selection of appropriate crush speeds.
Two flat steel plates were set parallel to each other prior to the start of the test. The performance of crashworthy composite tubes can be quantitatively evaluated via the obtained load–displacement curves by estimating some key parameters such as the initial crushing failure load • Initial crushing failure load • Average crushing load ( • Crushing force efficiency (CFE) is defined as the ratio of • Absorbed energy (U) represents the energy dissipated during the crushing process, which can be calculated by the work done by the crushing force • Specific energy absorption (SEA) is the energy absorbed per unit mass of the energy absorber
74
• Spring back (SB), which reflects the capability of the structure to retain its original shape after being crushed. Zero spring back of the configuration indicates that it was destroyed during crushing with no possibility of springing back.
75
Schematic view for identifying the crashworthiness parameters.
64


Results and discussion
The effect of the addition of different nanofillers (HNC, MC, Al2O3, SiO2, and SiC) at five different loadings (0,1,2,3, and 4 wt. %) on the crashworthiness performance of glass/epoxy composite tubes was investigated. Three samples were tested for each case and the average was selected. Referring to,76–82 The most beneficial effect is in general attained with a small wt. % of nanofillers, that is, less than 5 wt. % in which mechanical properties are generally improved. So, the authors decided to study the effect of adding 0–4 wt. % of nanofillers.
Crushing response and deformation histories
Load–displacement curves, energy absorption, and the deformation histories obtained from quasi-static axial compression tests for unfilled and nanofilled glass/epoxy composite tubes are shown in Figures 3–12. The results, presented in Figures 3–12, are for the most representative sample for each composite type. Generally, it was noted from Figures 3(a), 5(a), 7(a), 9(a), and 11(a) that the behaviors of all composite tubes are nearly linear till they come up to the first peak load then a load drop can be recorded. The magnitudes of the first peak load and load drop are governed by the type of the incorporated nanofiller and its wt. %. A load fluctuation around the average crushing load in the post-crushing stage was noticed for all tested composites. Then an increase in the load was noticed as the compaction zone was reached. (a) Load–displacement and (b) energy absorption-displacement curves of glass/epoxy composite tubes filled with HNC. Deformation histories of glass/epoxy composite tubes filled with HNC under quasi-static axial loadings. (a) Load–displacement and (b) energy absorption-displacement curves of glass/epoxy composite tubes filled with MC. Deformation histories of glass/epoxy composite tubes filled with MC under quasi-static axial loadings. (a) Load–displacement and (b) energy absorption-displacement curves of glass/epoxy composite tubes filled with Al2O3. Deformation histories of glass/epoxy composite tubes filled with Al2O3 under quasi-static axial loadings. (a) Load–displacement and (b) energy absorption-displacement curves of glass/epoxy composite tubes filled with SiO2. Deformation histories of glass/epoxy composite tubes filled with SiO2 under quasi-static axial loadings. (a) Load–displacement and (b) energy absorption-displacement curves of glass/epoxy composite tubes filled with SiC. Deformation histories of glass/epoxy composite tubes filled with SiC under quasi-static axial loadings.


For more illustration, the variations of the energy absorption with the displacement of the tested composite specimens are showed in Figures 3(b), 5(b), 7(b), 9(b), and 11(b). Generally, the energy absorption increases with the displacement. The type of the nanofiller and its wt. % have significant effects on the variants of the energy absorption against displacement, mainly after the initial peak load. Each load–displacement curve is correlated with the representative specimen deformation histories for convenience in viewing the failure progress as shown in Figures 4, 6, 8, 10, and 12.
It is clear from Figure 3(a) that the specimens with no nanofillers behave linear till approach the first peak value of 21.46 kN at about 3.16 mm. As shown in Figure 4(a), matrix fretting and interlaminar cracks start to occur at the top and bottom of the tube due to the local stress concentration and a sudden sharp load drop to 13.21 kN at 5.19 mm can be noticed. With increasing the crushing displacement, specimens with no nanofillers gradually deform plastically and yield load–displacement profiles with low oscillations’ amplitudes, that is, smooth curve in post crashing zone. At (6.21 kN, 40 mm), specimens go into compaction zone and the axial load increases rapidly. Bending, wrinkling, and global buckling of the tube walls can be noted due to the buckling of the fiber. Figure 3(b) shows that the energy absorption increases nonlinearly with the displacement.
Tubes filled with HNC
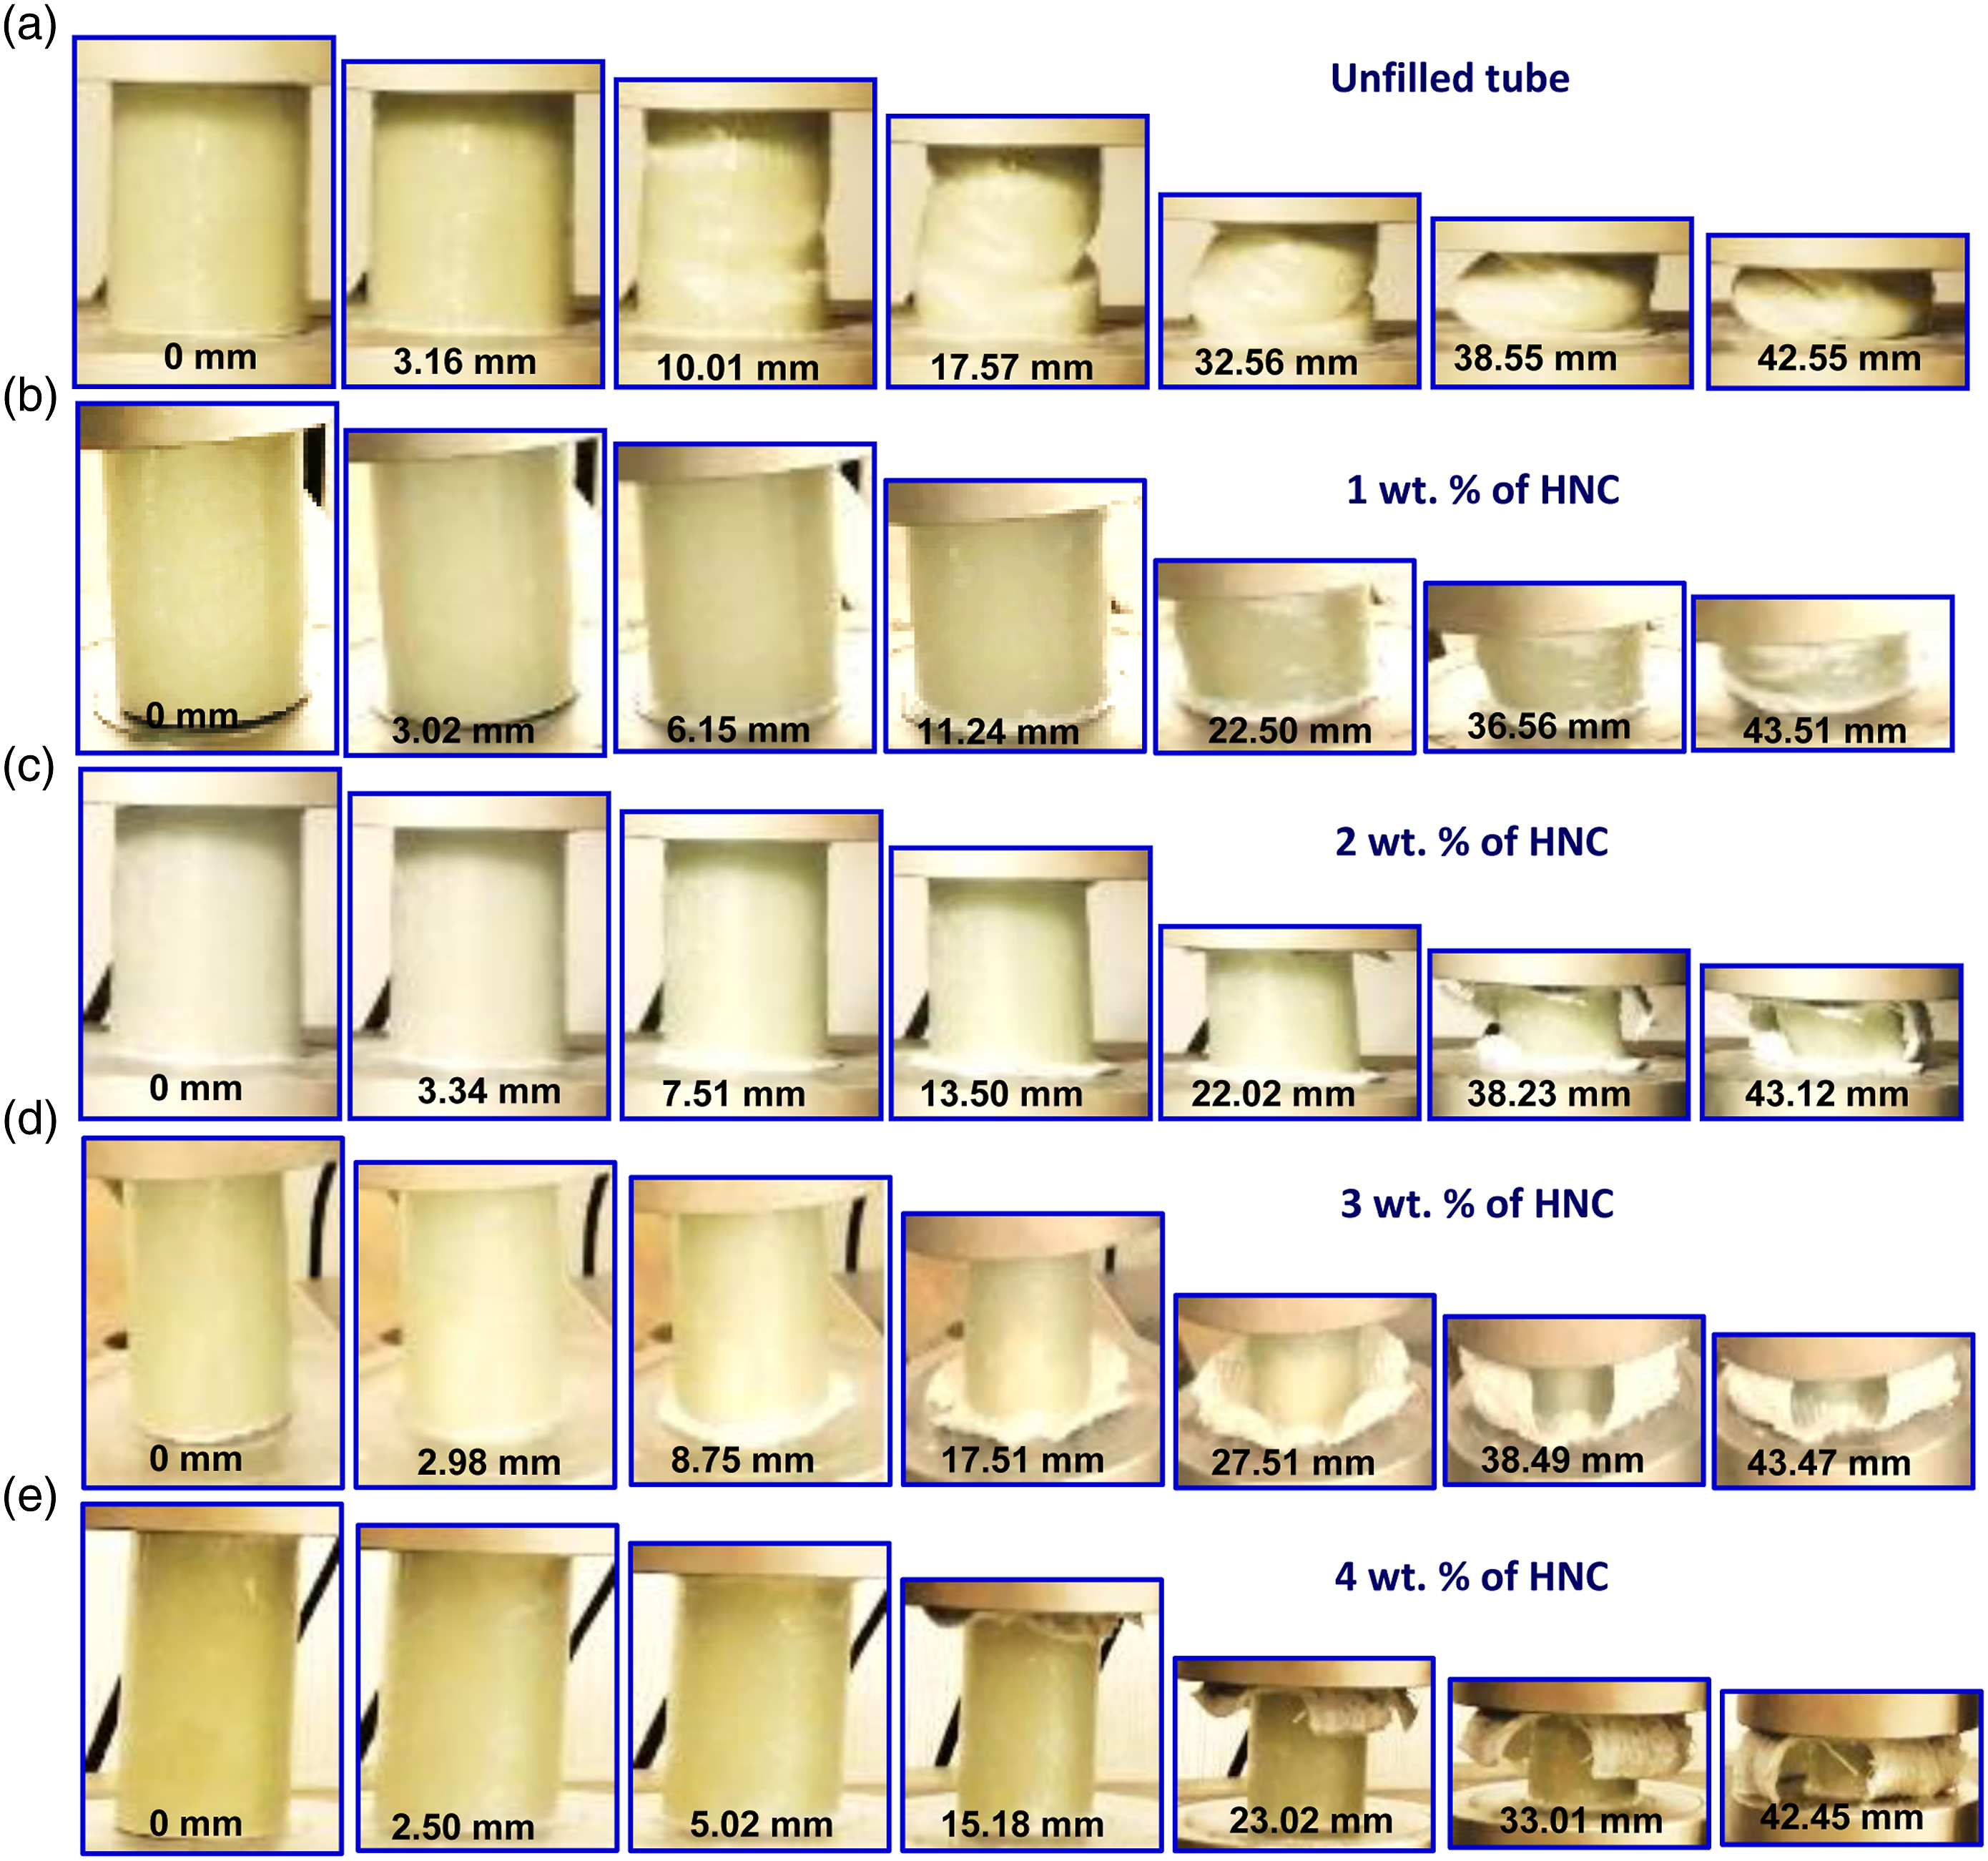
As shown in Figure 3(a), specimens filled with 1,2,3, and 4 wt. % of HNC behave nearly linear till they approach the first peak value of (22.37 kN at 3.02 mm), (26.67 kN at 3.34 mm), (29.58 kN at 2.98 mm), and (32.75 kN at 2.5 mm), respectively. As shown in Figure 4, micro-fragmentation damage appears at the upper and/or lower ends of the tubes and then the load drops to (17.92 kN at 5.07 mm), (21.72 kN at 5.78 mm), (25.50 kN at 5.43 mm), and (25.68 kN at 4.61 mm), respectively. In the post crashing zone, the fluctuations of load-displacement curve are quite significant. Matrix fretting and interlaminar cracks occurred at the top and/or bottom of the tube accompanied with matrix cracking. The cracks propagate along the longitudinal axis of the tubes. Further propagation of these cracks leads to lamina bending and splaying accompanied with the formation of internal and external folds. The compaction stage for specimens filled with 1,2,3, and 4wt. % of HNC starts at (17.77 kN and 50.10 mm), (20.69 kN and 46.69 mm), (23.67 kN and 47.86 mm), and (23.00 kN and 49.92 mm), respectively, and the axial load rapidly increases.
For specimens filled with different wt. % of HNC, the energy absorption increases linearly with the displacement as shown in Figure 3(b). As wt. % of HNC increases, the energy absorption capacity increases. This is because the low concentration of HNC up to 4 wt. % leads to a better dispersion of HNC in the epoxy and a reasonable wettability of glass fiber with the nanomodified epoxy. This result agrees with that reported by Zhang et al. 83 HNC is considered as an ideal modifier for polymer modification due to its excellent mechanical properties and large aspect ratio. 61
Tubes filled with MC
Figure 5(a) shows that specimens filled with 1,2,3, and 4 wt. % of MC behave linear till they reach the first peak of (21.67 kN at 2.01 mm), (24.14 kN at 3.43 mm), (28.41 kN at 3.44 mm), and (31.74 kN at 2.31 mm), respectively. After the peak, a sharp load decrease to (8.82 kN at 4.38 mm), (17.52 kN at 6.17 mm), (14.78 kN at 6.88 mm), and (24.83 kN at 4.91 mm) was noticed. Low oscillations in the post-crushing zone of load–displacement curves were noticed for 1 and 2 wt. % of MC. Whilst obvious oscillations were recorded for 3 and 4 wt. % of MC. For 1 wt. % of MC, transverse shear crack growth in the circumferential direction of the tube was recorded. Also, matrix fretting and interlaminar cracks started to occur at the top and bottom of the tube due to the local stress concentration. Progressive buckling with repeated folding of the tube wall is the dominant failure mode, Figure 6(a). Matrix fretting and delamination at the top and bottom of the specimen followed by splaying and fragmentation of the tube skin and bending of the fronds were noticed for 2,3, and 4 wt. % of MC, Figure 6(b)–(d). The compaction stage starts at (14.81 kN and 40.00 mm), (14.51 kN and 40.61 mm), (16.15 kN, 47.29 mm), and (24.84 kN, 47.68 mm) for specimens filled with 1,2,3, and 4 wt. % of MC, respectively.
The energy absorption increases nonlinearly with the displacement for specimens filled with 1 and 2 wt. % of MC. On contrary, it increases linearly for specimens filled with 3 and 4 wt. % of MC, Figure 5(b). Glass/epoxy composite tubes filled with 4 wt. % MC showed the highest absorbed energy as compared to 0, 1,2, and 3 wt. %. This was attributed to exfoliated dispersion of 4 wt. % MC in the epoxy matrix. 84 The addition of C30B nanoclay improved the impact strength as they formed a tortuous path, but this was found to be good only for clay loadings lower than 5 wt. %. Higher clay loadings deteriorated the properties which was again attributed to nanoparticle agglomeration. 79
Tubes filled with nano-Al2O3
Figure 7(a) shows that specimens filled with 1, 2, 3, and 4 wt. % of nano-Al2O3 have similar trend. They behave linear till the first peak value of 22.53 kN at 3.98 mm, 26.275 kN at 3.15 mm, 27.11 kN at 2.73 mm, and 14.70 kN at 3.72 mm for specimens filled with 1, 2, 3, and 4 wt. % of nano-Al2O3, respectively. This trend is followed by load drops to 8.03 kN at 8.18 mm, 15.66 kN at 6.66 mm, 14.38 kN at 6.28 mm, and 6.41 kN at 7.79 mm for specimens filled with 1, 2, 3, and 4 wt. % of nano-Al2O3, respectively. In the post-crushing zone, low oscillations around the average loads can be noticed for specimens filled with 1, 2, and 3 wt. % of nano-Al2O3. Whilst no oscillations were recorded for specimens filled with 4 wt. % of nano-Al2O3. The curves start to enter the compaction zone at (12.63 kN, 40.64 mm), (11.78 kN, 41.00 mm), (17.00 kN, 42.00 mm), and (5.08 kN, 37.00 mm) for specimens filled with 1, 2, 3, and 4 wt. % of nano-Al2O3, respectively. During the compression of the tubes, interlaminar shear cracks and delamination at the top and bottom of the tubes accompanied with fiber fracture can be observed, Figure 8. As shown in Figure 7(b), the energy absorption increases nonlinearly with the displacement for all tubes filled with nano-Al2O3. Nano-Al2O3 agglomeration in samples with 4 wt. % loading contributed toward limiting the improvement in energy resistance. Similar result was recorded by Rafiq et al. 79 for glass/epoxy filled with 3 wt. % of I.30E nanoclay. Nayak et al. 85 reported that alumina increases the impact energy of epoxy-based composite compared to other SiO2 and TiO2 modifiers.
Tubes filled with nano-SiO2
It was noted from Figure 9(a) that all specimens behave linear till the first peak values of 6.83 kN at 2.50 mm, 10.15 kN at 2.52 mm, 11.89 kN at 4.70 mm, and 11.27 kN at 4.62 mm for tubes filled with 1, 2, 3 and 4% of nano-SiO2, respectively. After the peak loads, load drops for all tested tubes were recorded. The levels of load drops were 3.67 kN at 5.97 mm, 5.26 kN at 5.44 mm, 5.86 kN at 6.52 mm, and 5.98 kN at 6.90 mm for tubes filled with 1, 2, 3, and 4% of nano-SiO2, respectively. This may be attributed to nano-SiO2 agglomeration which acted as stress concentrators. Also, this may be due to the bigger particle size than the abovementioned three nanofillers, that is, HNC, MC, and Al2O3. This result is consistent with that obtained by Nayak et al. 85
Slight fluctuations around the average load values in the post-crushing zone was recorded for all cases. For 1 and 2% of nano-SiO2, transverse shear crack growth in the circumferential direction of the tube center was reported accompanied with progressive compression of the composite tubes, Figures 10(a) and (b). For 3 and 4% of nano-SiO2, the dominant failure mechanism is the tube global buckling, Figure 10(c) and (d). The starting points of the compaction stages for tubes filled with 1, 2, 3, and 4% of nano-SiO2 are (4.68 kN, 39.00 mm), (4.29 kN, 35.81 mm), (3.81 kN, 34.14 mm), and (3.11 kN, 38.18 mm), respectively. Nonlinear trend was noticed for the energy absorption-displacement curves of all specimens filled with SiO2.
Tubes filled with nano-SiC
Figure 11(a) shows that all specimens filled with 1,2,3, and 4 wt. % of nano-SiC behave linear till approach the first peak of 8.91 kN at 3.97 mm, 11.98 kN at 4.34 mm, 11.98 kN at 4.06 mm, and 11.72 kN at 4.60 mm, respectively. Sharp load drops after the peaks were noticed for all specimens. Stable and smooth behavior in the post-crush zones were recorded. The dominant failure mechanism is global buckling, Figure 12.
Nonlinear trend was recorded for the energy-displacement curves of all specimens filled with nano-SiC. The agglomerates and associated cracking may be responsible for decreasing the energy absorption. This result is consistent with that recorded by Landowski et al. 86
It is clear from Figures 3, 5, 7, 9, and 11 that the load increases rapidly at higher displacement. The region after the post-crushing zone is known as the compaction region. At this stage, the load value increased nonlinearly and rapidly due to debris accumulation and the mass of the tube has been fully compressed. The major energy absorption was contributed from matrix fracture and fragmentation. As a result, the energy absorbed by the structure was minimal. At the compaction zone, the load increased drastically indicating material densification. 87 In axial crushing, load increased at higher displacement, that is, at the beginning of compaction zone. The specimen enters the compaction zone when it is fully damaged and cannot resist more load. At this moment, the machine table supports the specimen, carries, and resists the load, so the load increases. This is consistent with that obtained by Abdewi et al. 88
Crashworthiness parameters
Peak and average crushing loads (
)
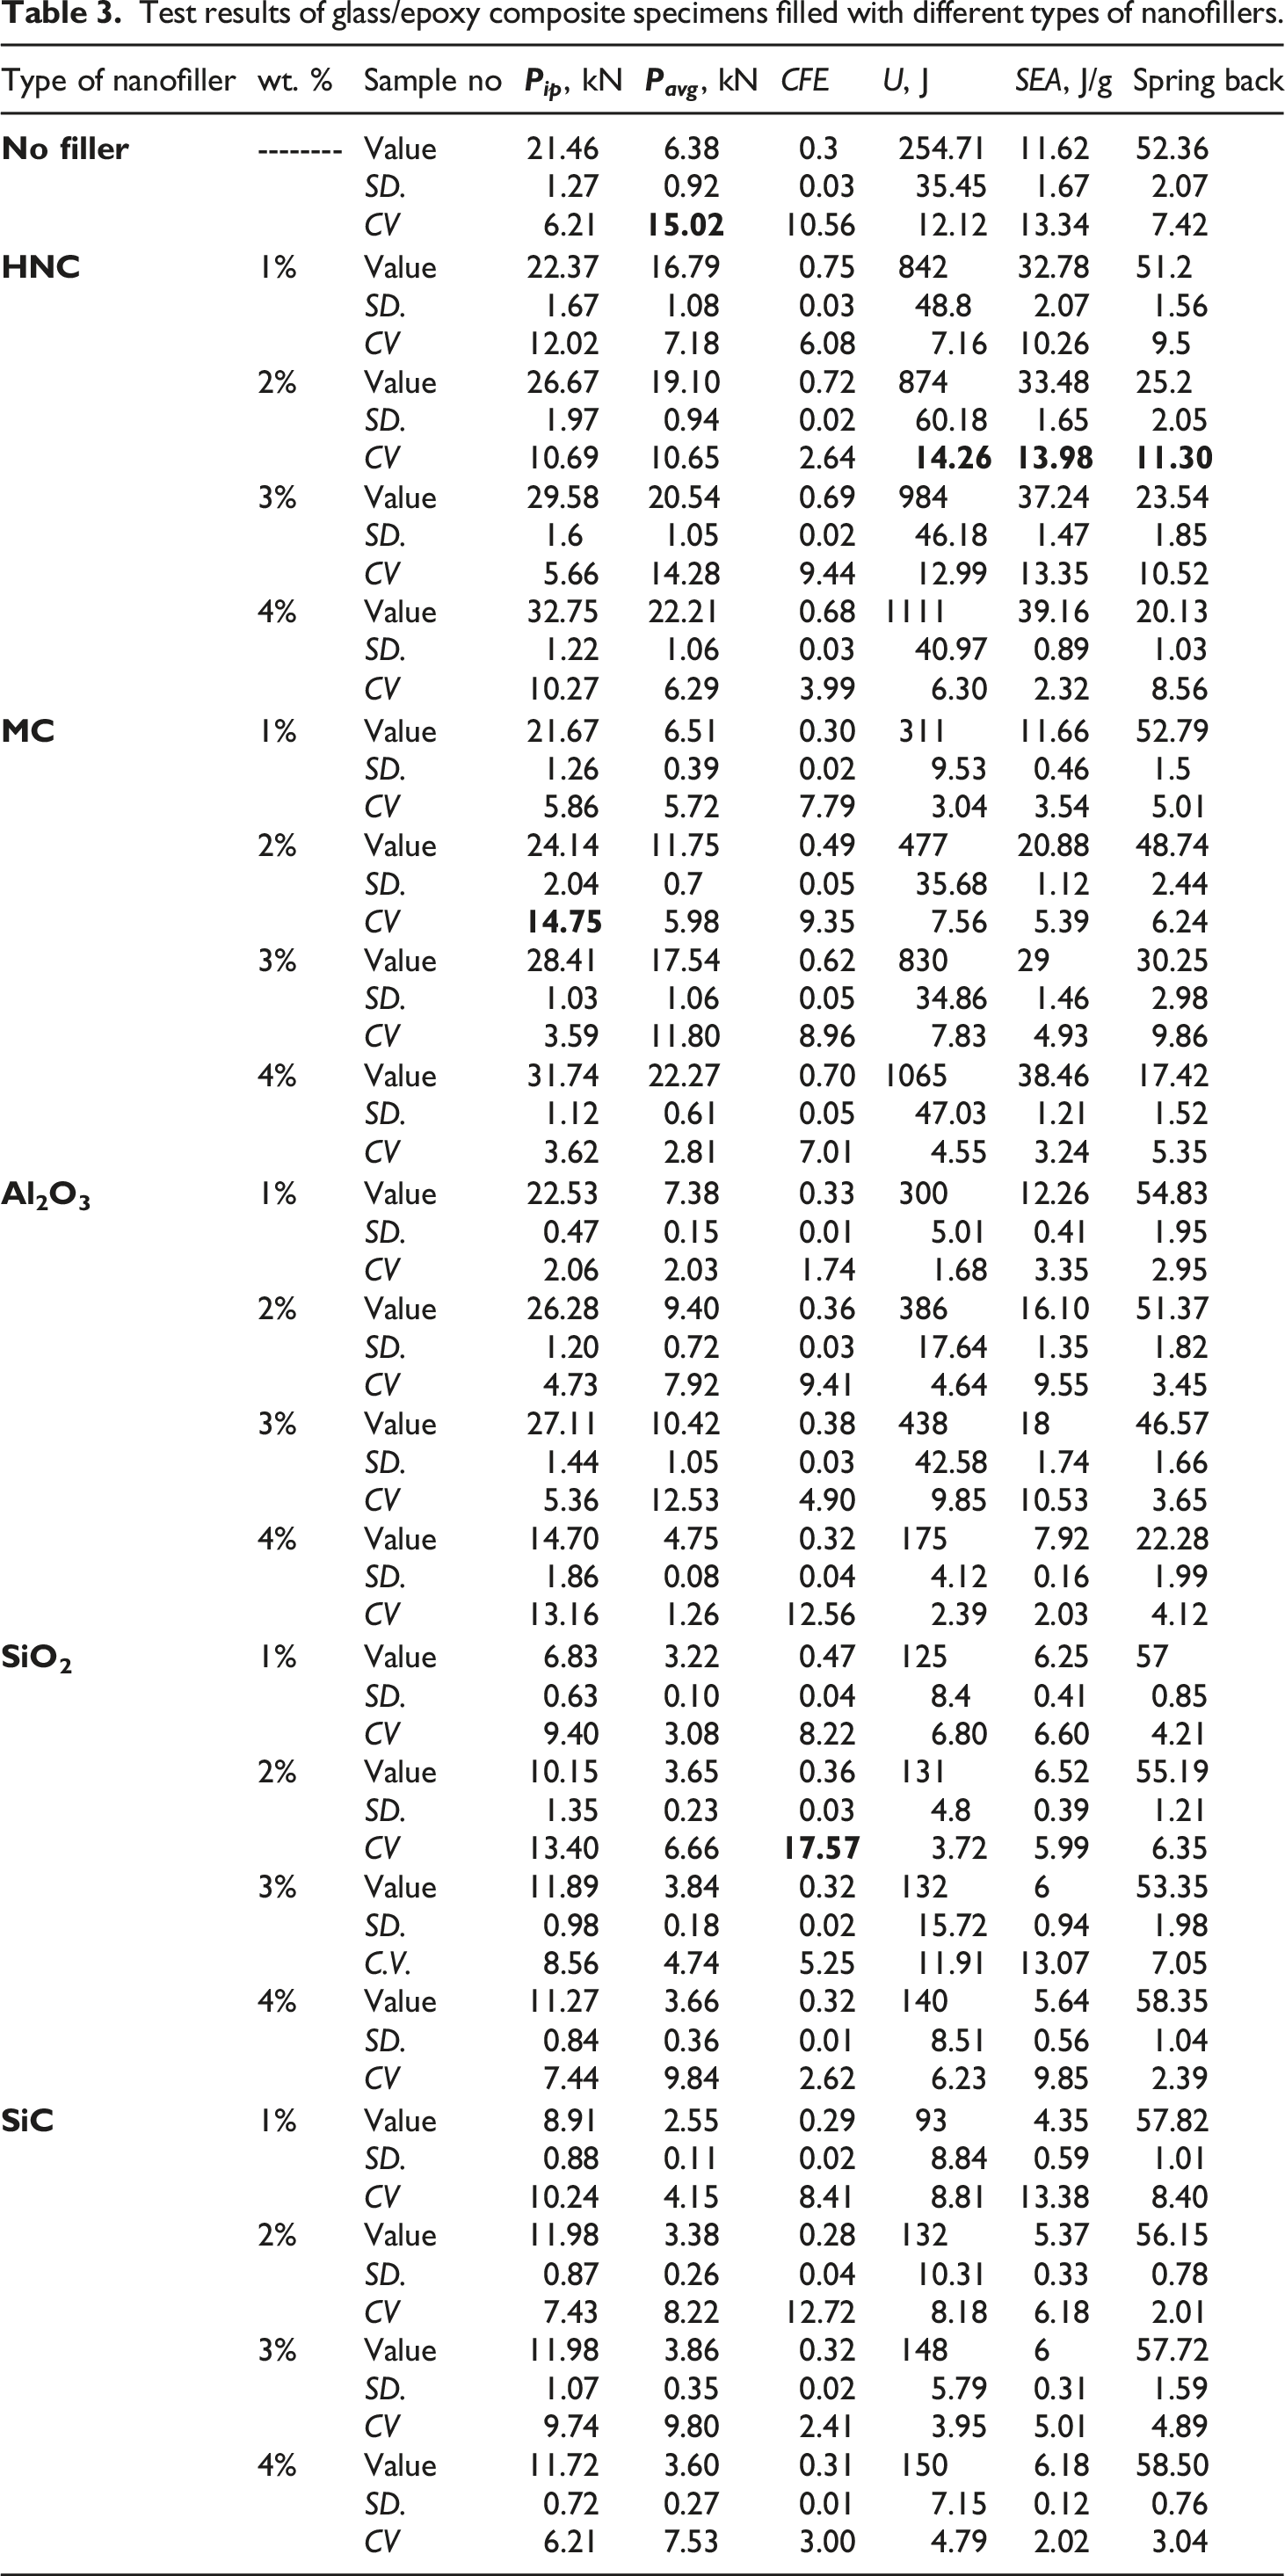
Peak load ( Average load ( Test results of glass/epoxy composite specimens filled with different types of nanofillers.

The inclusion of 1, 2, 3, and 4 wt. % of HNC to glass/epoxy composite tubes exhibits an enhancement of 4.24, 24.31, 37.85, and 52.65% in
The addition of 1, 2, 3, and 4 wt. % of MC exhibits an enhancement of 1.00, 12.51, 32.39, and 47.91%, respectively, in
An improvement of 5.01, 22.47, and 26.33% in
The incorporation of SiO2 and SiC nanoparticles adversely affect the crashworthiness characteristics of glass/epoxy composite tubes. The incorporation of 1, 2, 3, and 4 wt. % of nano-SiO2 causes a reduction in
Crush force efficiency
Crush force efficiency (CFE) is another significant measure of crushing performance.
95
As the value of CFE moves toward the unity, the improved is the performance of the energy absorbing structure as the absorber is crushed at a value close to Crush force efficiency (CFE) of axially compressed glass/epoxy composite tubes filled with different nanofillers.
Absorbed energy (U)
It is clear from Figure 16 and Table 3 that the type of nanofiller and its wt. % significantly affect the values of U. For unfilled composite tubes, U is 254.71 J. An enhancement of 230.42, 243.30, 286.43, and 336.12% in U was attained by the addition of 1, 2, 3, and 4 wt. % of HNC to glass/epoxy composite tubes, respectively. This improved performance is attributed to the toughening mechanism of HNC such as crack deflection, crack front pinning, and crack bridging. Because of HNC bridging, the micro-cracks were stabilized and stopped developing into large and harmful cracks. This observation also suggests that the adhesion between the HNC and the matrix was quite strong. Some bridging HNC broke when the crack opening force exceeded their fracture strength. The behavior of HNC is similar to that of multi-walled carbon nanotubes (MWCNTs).97,98 The proposed toughening mechanism of epoxy/HNC nanocomposites was related to several phenomena, including the formation of micro-cracks, nanotubes bridging, pull-out and breaking, crack deflection, and clusters resisting the advance of cracks.98,99 Similar mechanisms were recorded by Choe et al.
100
and Mirjalili and Hubert
101
for different nano reinforcements. Figure 17 Schematic description of HNC toughening mechanisms. Absorbed energy (U) of axially compressed glass/epoxy composite tubes filled with different nanofillers. Schematic description of HNC toughening mechanisms.
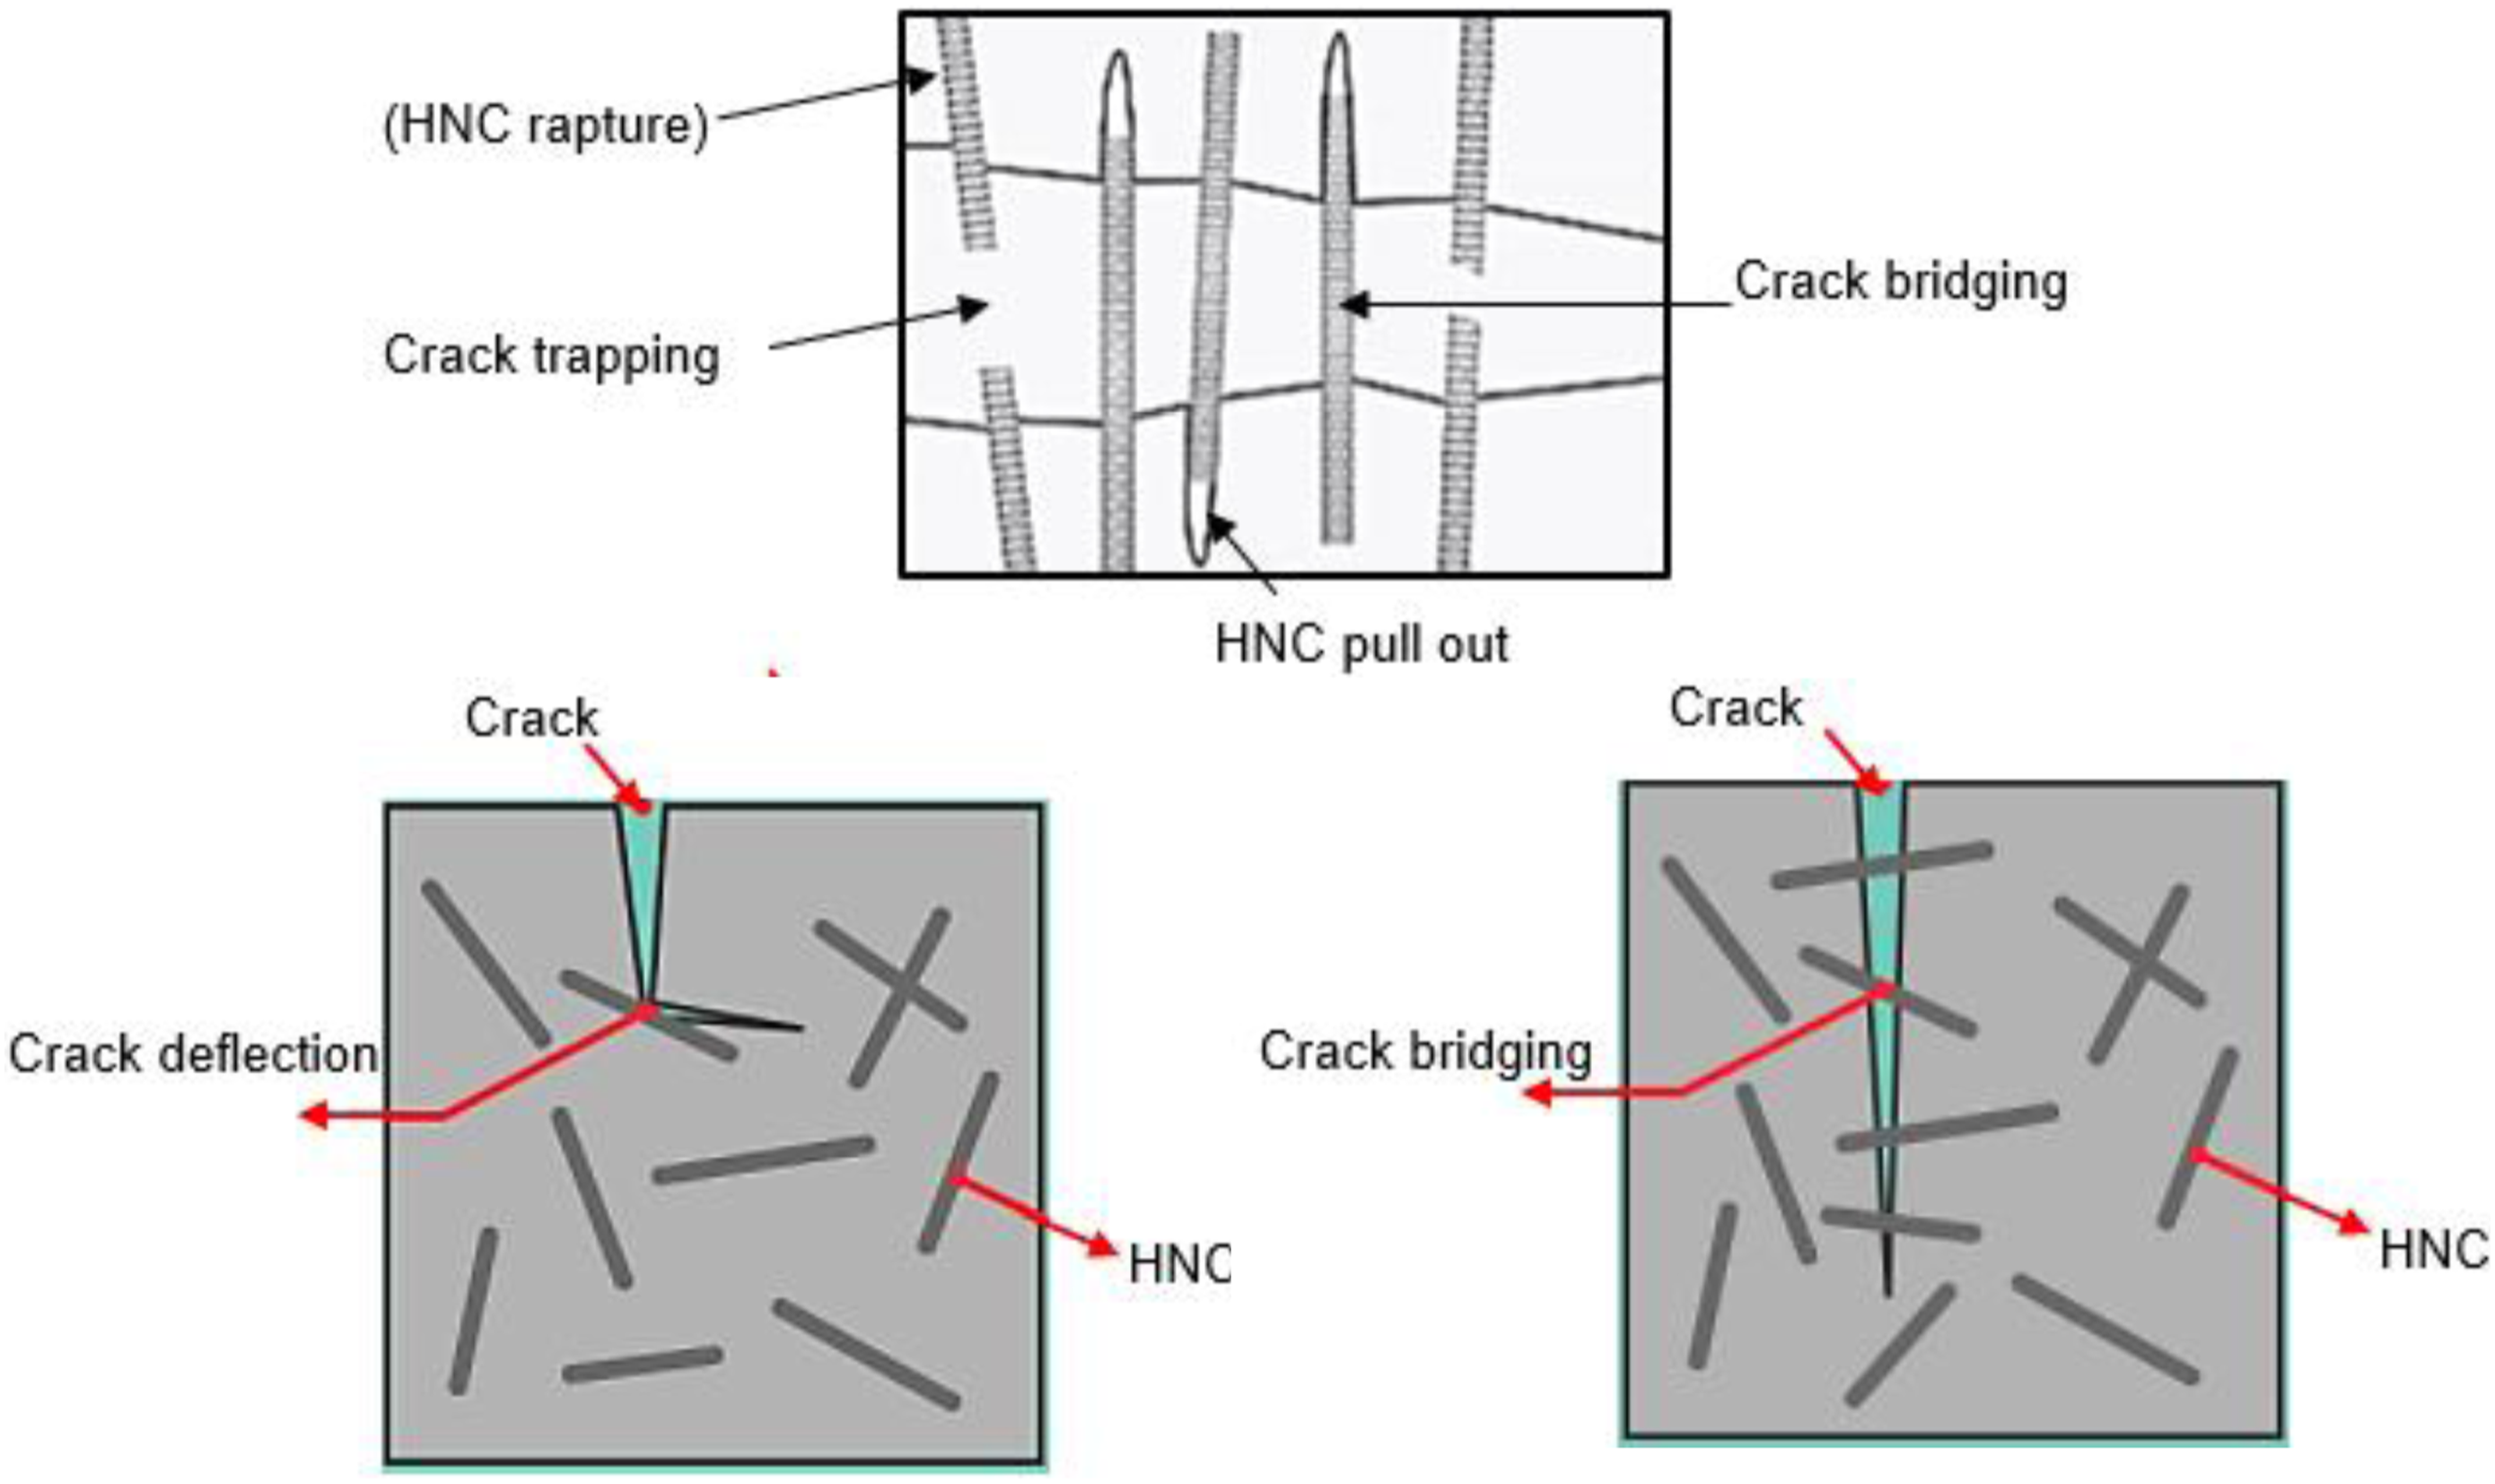
Moreover, it has been demonstrated that HNC improves the adhesion between the fiber/matrix interface. 102 Also, when the micro-cracks due to the quasi-static axial load were met with HNC, they might be stabilized by crack bridging of HNC. This result is consistent with that obtained by Ye et al. 103 for HNC nanofilled carbon/epoxy. Also, there is an improvement of 21.93, 87.35, 225.99, and 318.07% in U was attained by the addition of 1, 2, 3, and 4 wt. % of MC, respectively. Two different toughening mechanisms were observed. First, due to the increase in elongation to brake. Second, due to the increase in the material impact strength and stiffness. 37 The previous studies on various composite materials, tested in the similar experiments,104–106 show that the materials which fail with extensive delamination and fragmentation can absorb much higher energies than those which tend to fail in a brittle manner. That is why it can be concluded that the ability of a composite structure to dissipate the impact energy is highly dependent on the mode of fracture.
The improvement in U could be directly related to the matrix properties which were influenced by the dispersion of MC. It is obvious from Figure 16 that the addition of nano-Al2O3 up to 3 wt. % shows a positive effect on U of glass/epoxy composite tubes. An improvement of 17.66, 51.63, and 71.94% in U was attained by the integration of 1, 2, and 3% of nano-Al2O3, respectively, as compared to neat glass tube. Whilst a reduction of 31.16% was noticed for glass/epoxy composite tubes filled with 4 wt. % of nano-Al2O3. The increasing trend of the absorbed energy could be explained by the strengthening effect of the matrix, and fiber/matrix interface, but the deterioration effect resulting from the agglomeration of nano-Al2O3 and poor wetting behavior due to the high viscosity of epoxy. This result agrees with that obtained by Zhai et al. 94
The incorporation of 1, 2, 3, and 4 wt. % of nano-SiO2 exhibits a reduction of, 50.79, 48.71, 48.03, and 45.22% in U of the fabricated tubes, respectively. Also, the incorporation of 1, 2, 3, and 4 wt. % of nano-SiC attains a reduction in U by 63.41, 48.18, 41.97, and 41.13%, respectively. Silva et al. 37 recorded that adding SiO2, glass-spheres (GS), and MMT into glass reinforced polyamide 6 (PA6) conical structures reduces the EAC of the material. Results showed that by changing the secondary filler material, it is possible to change the micro-mechanism of the crash and therefore control the energy absorption characteristics of the composite. The transition from ductile to brittle fracture mode due to adding SiO2 and SiC nanoparticles was clearly demonstrated as a main reason for the reduced EAC.
Specific absorbed energy
The use of SEA concept is essential when comparing the energy absorption capabilities of energy absorbers fabricated from different materials.
75
Commonly, the larger the value of SEA, the more efficient is the energy absorber.
74
Figure 18 displays SEA of the tested composite tubes. It was noticed that unfilled tube has SEA of 11.62 J/g. The addition of 1, 2, 3, and 4 wt. % of HNC exhibits an enhancement of 182.15, 188.19, 220.53, and 237.05% in SEA of glass/epoxy composite tubes, respectively. Specific absorbed energy (SAE) of axially compressed glass/epoxy composite tubes filled with different nanofillers.
The addition of 1, 2, 3, and 4 wt. % of MC displays an enhancement of 0.36, 79.74, 149.67, and 231.01% in SEA of neat glass, respectively. The incorporation of 1, 2, and 3 wt. % of nano-Al2O3 attains an improvement of 5.57, 38.56, and 51.40% in SEA of glass/epoxy composite tubes, respectively. Whilst the incorporation of 4 wt. % of nano-Al2O3 gives a reduction of 31.80% in SEA value. The incorporation of 1, 2, 3, and 4 wt. % of nano-SiO2 attains a reduction of 46.23, 43.84, 44.70, and 51.43%, in SEA value, respectively. Also, a reduction of 62.54, 53.75, 45.67, and 46.84% in SEA was obtained by the addition of 1, 2, 3, and 4 wt. % of nano-SiC, respectively.
Spring-back
It is obvious from Figure 19 that SB value decreases with increasing wt. % of HNC. That is because SB is associated with the mode of failure. SB of specimens which progressively fail is lower than that of specimens which fail in buckling mode. The same trend for SB values were noticed for glass/epoxy composite tubes filled with MC and Al2O3. For glass/epoxy tubes filled with SiO2 or SiC nanoparticles, there is no obvious trend. SB values of glass/epoxy composite tubes filled with SiO2 or SiC nanoparticles are higher than those of glass/epoxy composite tubes filled with HNC, MC, and Al2O3. Spring back (SB) of axially compressed glass/epoxy composite tubes filled with different nanofillers.
Silva et al. 37 reported that a significant improvement can be obtained at nanofiller’s content of 0.5–5 %. The unique properties of nanocomposites come from the large number of interfacial effects, existing due to the high surface-area-to-volume ratio of nanofillers. In this perspective 107 reported that the crashworthiness and energy absorption properties of composites could be enhanced by reinforcing the polymer matrix system with active nanoparticulate fillers. Incorporation of nanofillers with proper filler dispersion in the matrix can enhance the interlaminar strength and the energy absorption capacity of the composite. 108
Scatter in test results
Many factors can affect test results, such as specimen manufacturing, preparation, handling, storage, test rig design, and experimental technique. The statistical scatter, that is, coefficient of variation (CV), in the experimental test results, has been obtained as presented in Table 3. The maximum CV for
Visual inspection of damage
The ability of a composite structure to absorb energy was found to be highly dependent on the mode of fracture. Materials which fail in a progressive manner, with extensive delamination and fragmentation, can absorb much higher energies than those which tend to fail in a brittle manner.
37
Five failure modes were noticed during the quasi-static compression test of nanofilled glass/epoxy composite specimens. Figure 20 represents the photos of the top views of the crushed specimens. These failure modes can be categorized and identified as follows: Top views of the final crushed specimens.
Mode I: The axial crushing mechanism of the tubes is dominated by pure normal macro fragmentation progressive mode, followed by extensive matrix deformation, starting from the lower end of the tube. The crushed materials act like a debris wedge forcing the axial material to both of inside and outside of the tube. The crushing process consists of sliding of the inward and outward fronds, splaying and fragmentation of the tube skin, longitudinal cracks, bending of the fronds and the crushed matrix with destroyed fibers. 109 This failure mode was observed for composite tubes filled with 3 wt. % of HNC.
Mode II: This mode is very similar to Mode I. The only difference between Modes I and II is where the initial fracturing occurs; in Mode I, it happens at the bottom of the tube, while in Mode II, it happens at the top. Because of the contributions of friction between fiber layers and bending, Modes I and II had higher energy absorption capacity than Mode V. 110 Since the apparatus is symmetric, it is important to note that Modes I and II are mechanically identical. However, it was discovered that the failure of some specimens began at the top end, while the failure of other specimens began at the bottom end. So, they were categorized as Mode I and Mode II 74 registered a similar classification. This failure mode was observed for composite tubes filled with 4 wt. % of HNC and composite tubes filled with 3 and 4 wt. % of MC.
Mode III: Matrix fretting and delamination at the top and bottom of the specimen followed by splaying and fragmentation of the tube skin and bending of the fronds were noticed. It can be said that mode III is a combination of mode I and mode II. This combined failure mode was observed for composite tubes filled with 1 wt. % of HNC and composite tubes filled with 2 wt. % of MC.
Mode IV: Transverse shear cracks develop in the circumferential direction of the tube, followed by axial shear cracks, fiber deboning, splaying at the top and/or bottom of the tube, laminar bundle fracture, and compression of the composite tube in this mode. This failure mode can be noticed for composite tubes filled with 2 wt. % of HNC and composite tubes filled with 1 wt. % of MC.
Mode V: It has a plastic hinge-like formation and progressive buckling with repeated folding. This is like thin-walled metals and plastic tubes being crushed. This mode was noticed for all other composite tubes.
Scanning electron microscopy
Figure 21 shows SEM of axially crushed nanofilled glass/epoxy composite tubes. The common failure signs are fiber breakage, matrix cracking, fiber/matrix debonding, and delamination. Glass/epoxy composite tubes filled with HNC shows a perfect bond between fiber/matrix with low matrix cracking and low fiber pullout as shown in Figure 21. This ensures that the incorporation of HNC to epoxy leads to a better resistance of glass/epoxy composite to crushing loads. Glass fibers are closely bonded with each other and effectively covered by nanofilled matrix. SEM of axially crushed nanofilled glass/epoxy composite specimens.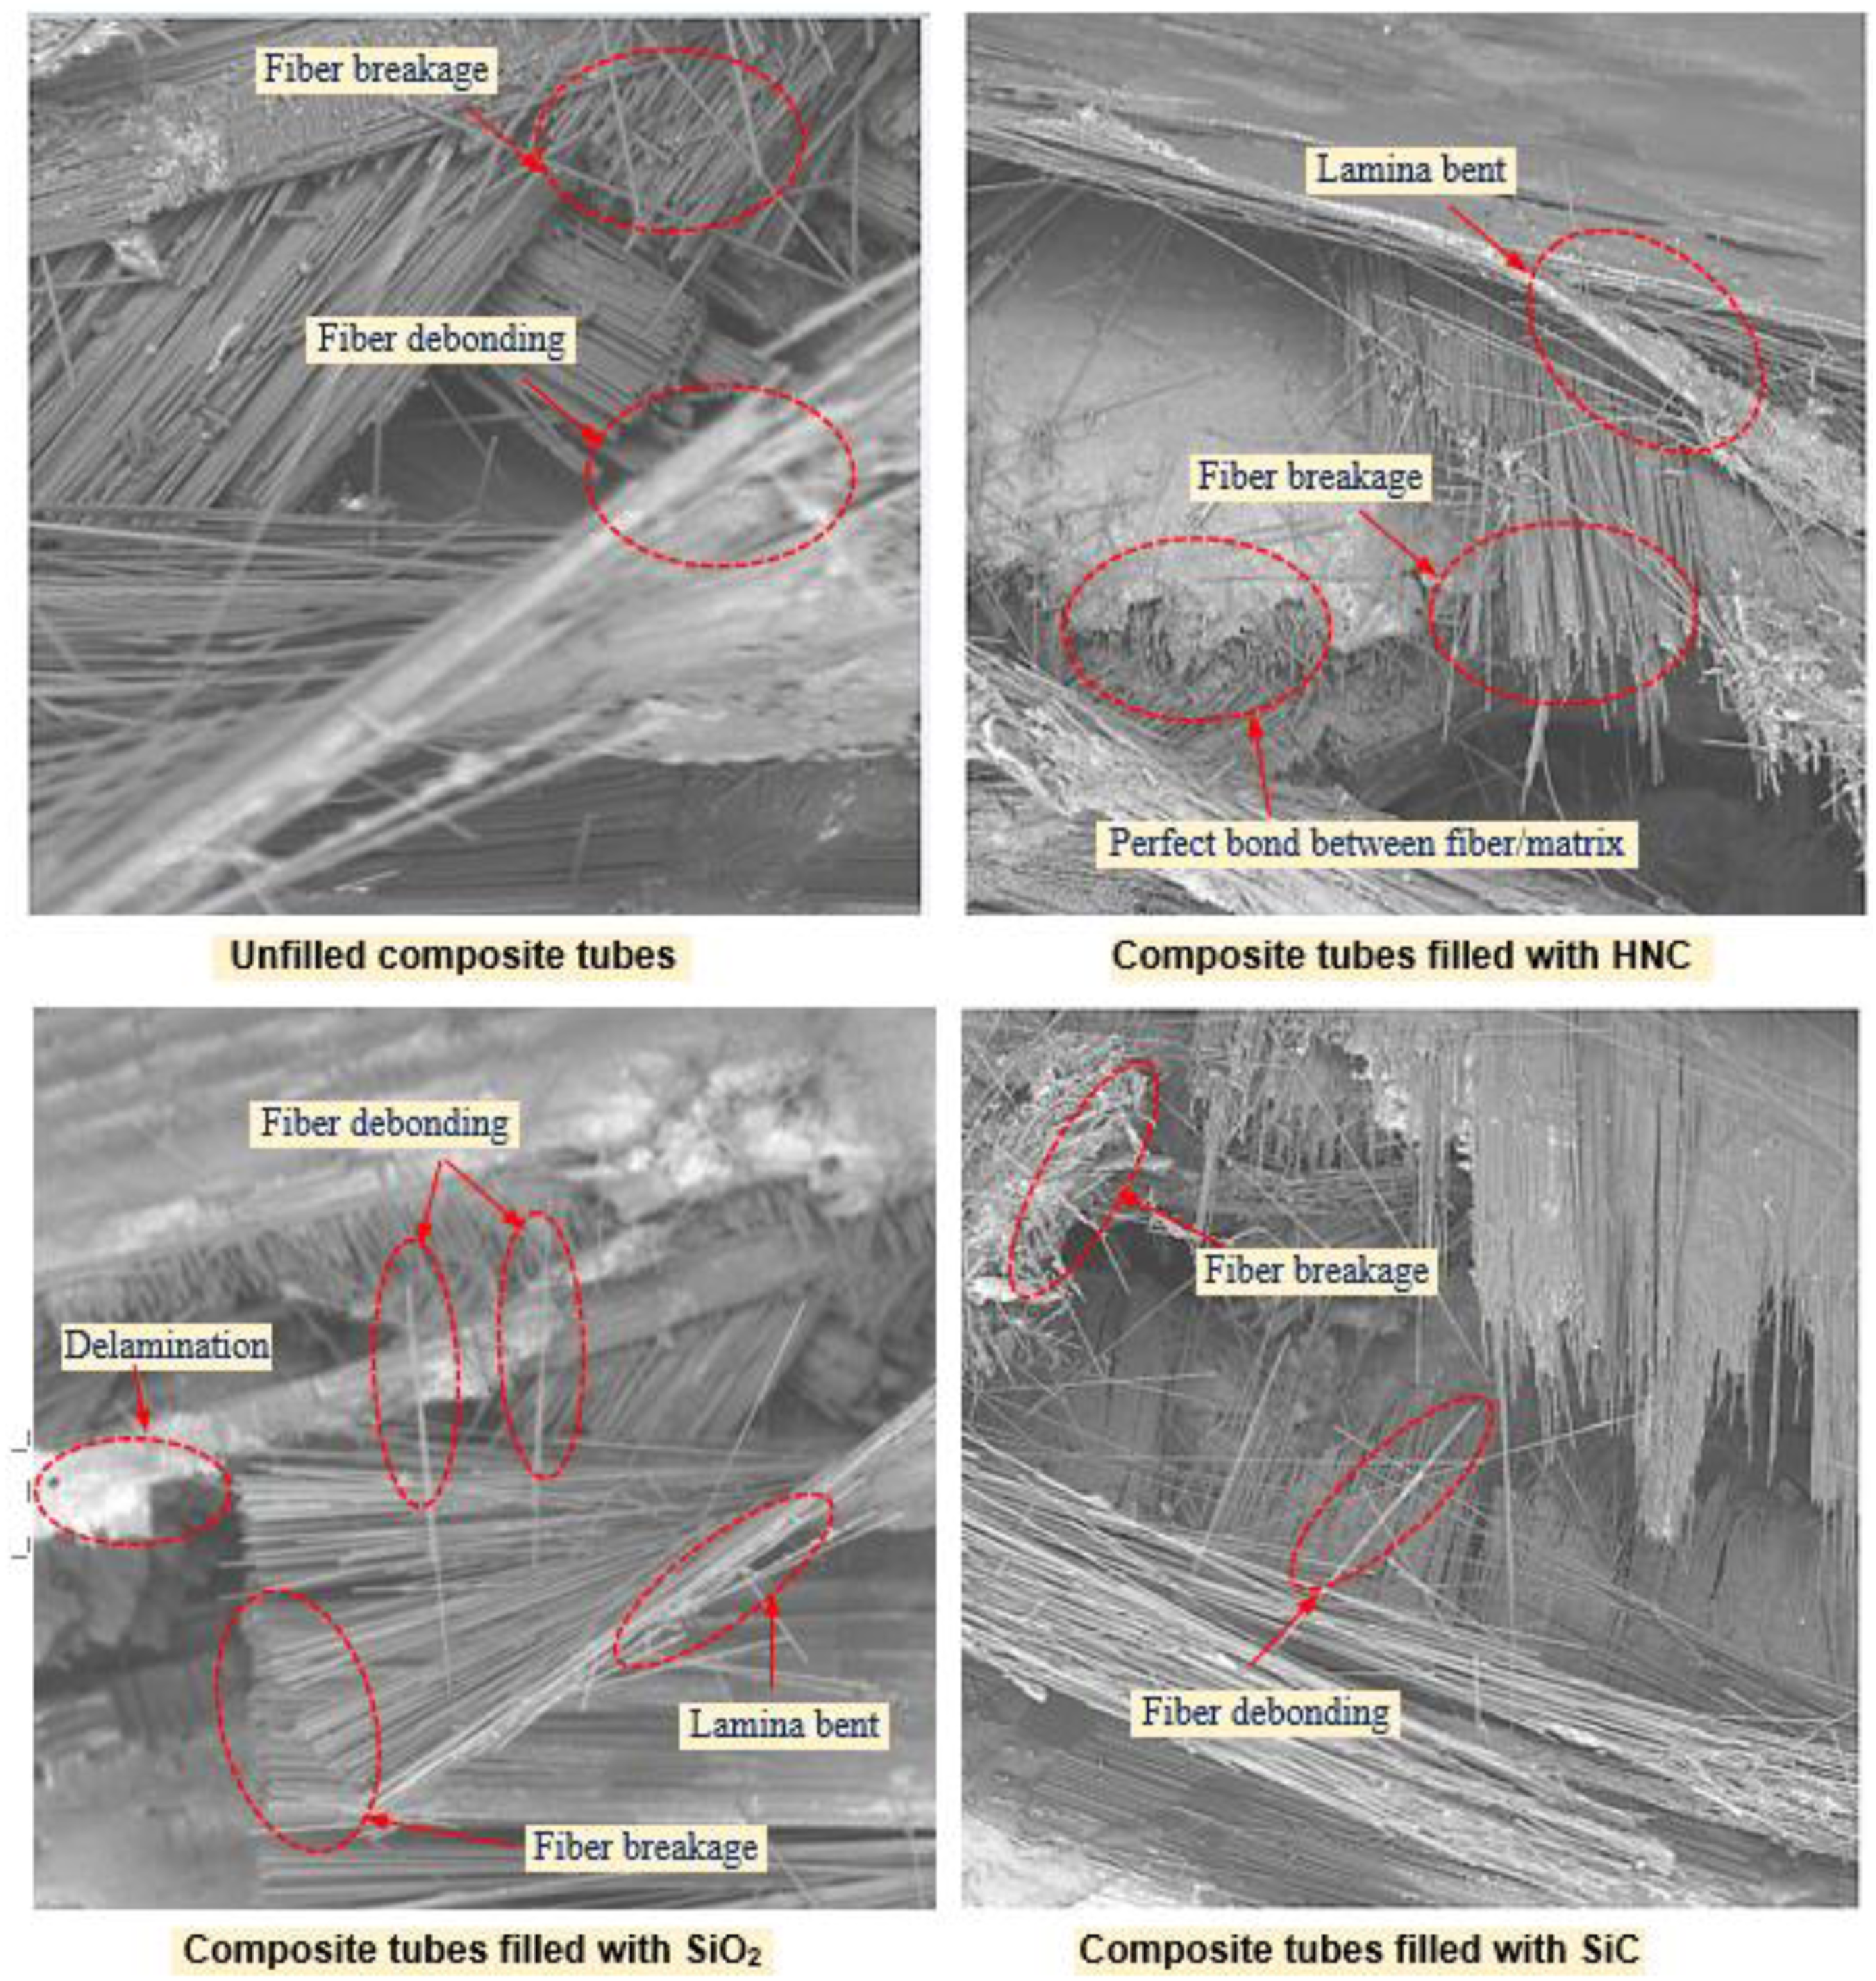
For composite tubes filled with SiO2 and SiC, extensive cavities occurred between the adjacent layers. This cavity reflects the weak fiber/matrix bonding. The low crushing resistance of glass/epoxy composites filled with nano-SiO2 and nano-SiC may be attributed to the agglomeration of nano-SiO2 and nano-SiC. Since agglomeration in the interfacial region weakens the fiber/matrix interface and permits an easy path for a crack to propagate. 52
Applications
The proposed nanofilled composite tubes are suggested to be used as energy absorbers in the front of train structure or automobile structure, that is, anti-impact rods. These composites can also be applied as crash box in the front of the automobile and energy absorption tubes in aircraft fuselage. Nanofilled composites into energy absorption tube or crash box can be utilized and designed for a particular type of load into the various major structure for high-performance application and safety equipment in major transportation industries such as aerospace, automotive, and marine industry, Figures 22 and 23.

State-of-the-art
State-of-the-art studies of the crushing of composite tubes reveal different factors affecting their crashworthiness. Of those factors, the constituent materials of the composite are of great interest. In the current study, glass/epoxy composite tubes reinforced with five types of nanofillers, that is, halloysite nanoclay (HNC), montmorillonite clay (MC), alumina (Al2O3), silica (SiO2), and silicon carbide (SiC) were tested under a quasi-static crushing scenario to investigate the best composite in terms of the crushing load and the energy-absorption capacities (EAC). This article provides a state-of-the-art of industrial applications. A state-of-the-art review on EAC of nanofilled polymer composites is introduced.
Future directions
Polymer composites are sensitive to the environment such as temperature and moisture, which are known to influence stiffness, failure modes, and strength properties. For the design of nanofilled crashworthy composite structures, which will work in a wide range of environmental conditions, it is important to understand what influence environmental effects might have on crush failure modes and SEA. Different nanofillers may be used. Different loading conditions may be applied, that is, dynamic (drop weight impact) and quasi-static (lateral or oblique) loadings. This should be supported by numerical simulation to reduce cost and to expedite the understanding of the structure’s response.
Conclusions
Light weight comes to be a significant issue for energy efficiency in automotive. It arises needing for developing innovative materials that combine both weight reduction and safety issues. Throughout this work, the applicability of different nanofillers to polymer composite materials is discussed regards to the fulfillment of these requirements. An experimental study was performed to investigate the crashworthiness and failure mechanisms of glass fiber reinforced polymer composite tubes filled with different nanofillers and different wt. % of these nanofillers. Nanofilled tubes were fabricated using wet wrapping by hand lay-up process and tested under quasi-static axial loading conditions. From the experimental tests performed in this study, the main conclusions are as follows: • The addition of nanofillers have a significant effect on EAC of glass fiber reinforced epoxy composite tubes. Changing the type and wt. % of the nanofiller can change the failure micro-mechanism, and therefore, control the energy absorption characteristics of the composite. • The incorporation of 1, 2, 3, and 4 wt. % of HNC leads to an improvement of 230.42, 243.30, 286.43, and 336.12% in U of glass/epoxy composite, respectively. The inclusion of 1, 2, 3, and 4 wt. % of MC leads to an improvement of 21.93, 87.35, 225.99, and 318.07% in U of pristine glass/epoxy tubes, respectively. The effect of HNC is obviously greater than that of MC. • Compared to pure glass/epoxy composite tubes, an enhancement of 17.66, 51.63, and 71.94% in U was recorded by the inclusion of 1, 2, and 3 wt. % of nano-Al2O3, respectively. On contrary, the incorporation of 4 wt. % of nano-Al2O3 reduces U by 31.16%. • The addition of SiO2 and SiC nanofillers has a negative effect on U of glass/epoxy composite tubes. A reduction of 50.79, 48.71, 48.03, and 45.22% was recorded by the addition of 1, 2, 3, and 4 wt. % of nano-SiO2 and a decrease of 63.41, 48.18, 41.97, and 41.13% was found by the inclusion of 1, 2, 3, and 4 wt. % of nano-SiC, respectively. • It is essential to replace energy absorbers of vehicles by novel nanocomposite materials to deliver occupant safety during accidents. The proposed nanofilled composite tubes are suggested to be used as energy absorbers in the front of train structure or automobile structure, that is, anti-impact rods. These composites can also be applied as crash box in the front of the automobile and energy absorption tubes in aircraft fuselage. • Overall results indicate that glass/epoxy composite tubes filled with 4 wt. % of HNC or filled with 4 wt. % of MC are appropriate to be employed as energy dissipating elements in vehicles due to their remarkable energy absorbing abilities. On contrary, glass/epoxy composite tubes filled with nano-SiO2 or nano-SiC are not recommended to be used as energy dissipating elements.
Footnotes
Declaration of conflicting interests
The author(s) declared no potential conflicts of interest with respect to the research, authorship, and/or publication of this article.
Funding
The author(s) received no financial support for the research, authorship, and/or publication of this article.