
Abstract
In this study, detailed uniaxial in-plane tearing tests including uniaxial central, single-edge notched, and trapezoidal tearing tests of a type of polyvinylchloride (PVC)-coated polyester fiber fabric were conducted. Two types of tearing failure modes, brutal and progressive, were examined. In addition to differences in the descending sections of the stress–displacement curves and the membrane surface morphology near the crack, it was found that the uniaxial central tearing test could be replaced by the corresponding single-edge notched tearing test to minimize the usage of test materials. The configuration of the single-edge notched specimen, including the gauge length and width, was investigated to determine the conditions under which the tearing resistance of the practically nearly infinite membrane surface can be studied with finite-size specimens. To obtain the fracture toughness GIC, which characterizes the ability of materials to prevent crack growth, a theoretical method and two test methods were introduced. After comparing the methods, the test method based on the area of the parallelogram obtained from the zigzag wave in the descending section of the load–displacement curves was proved to be superior. The value of GIC obtained with this simple test method was relatively stable, and it could be used to evaluate the tearing resistance and calculate the tearing strength of the coated fabrics.
Keywords
Introduction
In recent years, modern membrane structures, as a new form of long-span spatial structures, have been used worldwide in building transportation facilities, stadiums, shopping centers, exhibition centers, and so on, owing to their excellent material properties such as light weight and aesthetic form. There are two types of commonly used building membrane materials: coated fabrics and thermoplastic compounds. The microstructure of a coated fabric, which comprises a top coat, coating, and substrate, is shown in Figure 1. The substrate is made of warp and weft yarns according to certain knitting methods, and it characterizes the mechanical properties of the coated fabric because it bears most of the external load. The coating can be bonded to the surface of the substrate via coating or laminating, and its function is to improve the durability of the substrate by protecting it from rain and other contaminants. To further improve the service life, a top coat is often applied on the surface of membrane materials [1].

Microstructure of coated fabric.
However, with their extensive application, the accidental damage of membrane structures composed of coated fabrics has been reported from time to time. Relevant investigations have indicated that tearing damage is the main cause of such destruction [2–4]. Specifically, in the process of production, installation, and use of membrane material, various defects such as visible broken wires, cracks, creases, and damage caused by external flying objects are produced. These defects are easily compounded under strong wind or heavy snow and often cause the overall damage of membrane structures, which poses a significant threat to human health and economic development. Therefore, an increasing number of scholars have focused on the tearing behavior of membrane materials. In order to evaluate the tearing resistance of these materials, several different test methods have been proposed, such as out-of-plane tearing, in-plane tearing, and structural tearing tests. Out-of-plane tests mainly include single tongue and double tongue tearing tests, and in-plane tests mainly include trapezoidal, single-edge notched, uniaxial, and biaxial central tearing tests. Some of these test methods have been adopted by relevant codes [5–8].
The application of out-of-plane testing methods is mainly concentrated in the garment industry. Krook and Fox [9] studied the failure mechanism of single tongue tearing and hypothesized that a del-shaped opening forms, in which there are no longitudinal yarns during the tearing process. Chu and Chen [10] proposed two mathematical models to predict the tearing strength of trapezoidal and single-rip specimens and adopted five standard methods to test the tearing behaviors of sixteen fabrics, thereby concluding that the theoretical methods are in good agreement with the experimental results. Scelzo et al. [11,12] formulated a spring model to describe tongue tearing, which accounted for the effects of yarn pull-out, jamming, and stretching, and evaluated the model with experimental results. Using this method, the contributions of yarn properties and weave geometry to the tearing resistance of fabrics were analyzed. Witkowska and Frydrych [13] conducted a series of standard uniaxial tearing tests for a group of protective textiles and found coherence among them. However, the applied tearing test methods mainly included the trouser-shaped method, and a comparison of in-plane tearing tests, such as trapezoidal tests, was not involved.
On the contrary, in-plane testing methods are widely used in the fields of architecture and aviation. Hedgepeth [14] presented a discrete yarn model to simulate a damaged filamentary structure, in which fibers carry axial loads, and the matrix is assumed to carry only shear. Consequently, a formula for the stress concentration coefficient at the crack tip was obtained. A useful formula based on Hedgepeth’s yarn model and Griffith’s energy balance approach was proposed by Minami [15] to calculate the fracture toughness GIC, and the applicability of the formula was proved by performing tearing tests on several coated fabrics. Bigaud et al. [16] studied the tearing behavior of a type of PVC-coated fabric using uniaxial and biaxial central tearing tests. It was observed that the specimens may exhibit progressive and brutal failures, depending on various factors such as the initial crack length and orientation, coating, and loading ratio applied in the warp and weft directions. In addition, two linear elastic fracture mechanics theories, the stress localization method and the crack opening displacement method, were used to calculate the fracture toughness KIC of this fabric. Triki et al. [17] performed tongue tear and tensile central crack tear tests on plain and twill woven fabrics made of cotton, polyester/cotton blend, and polyester. A criterion was developed to obtain the fracture toughness GIC based on the tearing energy, which was then used to study the influence of linear density, yarn density, and weave on the tearing performance of these fabrics. Chen et al. [18,19] and Wang et al. [20,21] systematically studied the tearing behaviors of airship envelope fabric materials using uniaxial and biaxial central tearing tests. Their research focused on the influence of the initial crack length, crack angle, off-axis angle, stress ratio in the warp and weft directions, and tensile speed on tearing. Several theoretical methods were investigated to fit the test results, and a new strength theory was introduced to predict the strength of specimens with inclined cracks based on the off-axis elastic constants theory for composites and Hedgepeth’s model. Xu and Waas [22] adopted several methods to obtain the fracture toughness of a woven textile composite with single-edge notched tearing tests. Meng et al. [23] proposed a theoretical model of the envelope material considering the interaction between warp and weft yarns to predict the tearing strength of specimens with high precision. Zhang et al. [24] conducted uniaxial tearing tests with different initial crack shapes, crack sizes, specimen sizes, and loading rates on PVC-coated fabrics and proposed a theoretical tearing model to predict the tearing strength of the specimens; the model exhibited good agreement with test results. He et al. [25] conducted uniaxial tearing tests on PTFE-coated fabric and obtained the fracture toughness GIC, which can be treated as an intrinsic material parameter to evaluate the tearing resistance through a numerical method, the virtual crack closure technique. The influence of the boundary condition and shear modulus were examined. Chen et al. [26] proposed a new theoretical method to calculate the tearing strength of an airship envelope fabric, and the validity of the model was verified using uniaxial tearing tests.
Occasionally, membrane structure tearing tests have been carried out to investigate the crack development in curved and complex stress states. Maekawa et al. [27] conducted a biaxial central tearing test for a short slit and pressurized cylinder test, similar to the experiment conducted by Topping [28], for a moderately long slit to study the tearing properties of a lightweight envelope material, Zylon. Then, theoretical models, including Thiele’s formula, and the stress field were used to fit the test results, and the allowable slit length was finally estimated. In addition, some scholars [29–31] have discussed the fracture mechanism of composite materials with respect to the micro level. These studies investigated the fracture mode using fractured surface images obtained via scanning electron microscopy.
A review of the existing literature shows that previous studies have certain limitations. For example, in an actual membrane structure, the size of the membrane surface can be considered as infinite with respect to tiny defects. However, when conducting material tests in the laboratory, we must use finite-size specimens to simulate the infinite condition, owing to the limitation of the test equipment. Determining whether the simulation is reasonable is a crucial task, based on which the test results may or may not be considered reliable. At present, research on the effect of specimen configuration on tearing strength and mode is not systematic, and the internal mechanism is not fully understood. Therefore, the effects of specimen form, width, and length on the tearing performance of the coated fabric were investigated systematically in this study, and the deformation of the membrane surface in the tearing process was measured using digital image correlation (DIC). As a result, the influence of specimen configuration on the test results was explained in detail from the perspective of deformation energy, strain field, and the size of the del-zone for the first time.
In the studies mentioned above, many scholars attempted to find some inherent parameters such as KIC, GIC, the critical crack length, and the stress concentration coefficient to evaluate the tearing performance of membrane materials, and establish relevant theoretical methods that are applicable to the design of membrane structures. Specifically, the stress intensity factor KI (for Mode I crack) is a parameter controlling the elastic stress field at each point in front of the crack. The energy release rate GI (for Mode I crack) is defined as the energy released by the plate per unit thickness when the crack propagates one unit length forward from a certain point. When these two parameters in classical fracture mechanics reach their critical values KIC and GIC, respectively, tearing failure begins to occur. However, the above material parameters have limitations, which hinder their applicability in practical engineering. The stress concentration coefficient, KIC, and critical crack length are obtained based on the assumption that the material is completely linearly elastic or via a large number of experiments [14,18]. There are very few test methods for the measurement of fracture toughness GIC of coated fabrics [17], and the theoretical test methods are either too complex, such as the finite element method [25], or contain too many approximations [22]. Therefore, to overcome these limitations, a rapid and simple method to obtain the GIC value from the load–displacement curve of the single-edge notched and trapezoidal tearing tests is proposed in this paper. With the obtained GIC, it is expected that that the tearing resistances of different coated fabrics can be compared and that the tearing strength can be computed under different damage sizes.
Materials
In this study, a fabric made of PVC coating, polyester fibers, and a polyvinylidene fluoride (PVDF) top coat is tested. The fabric was produced by Zhejiang Huifeng New Materials Corp., Ltd. The specifications of the membrane material are listed in Table 1. Based on DG/TJ08-2019-2007 [25], uniaxial tensile specimens with dimensions of 300 mm × 50 mm in the warp and weft directions, respectively, were prepared and tested, and the stretching speed was set to 100 mm/min. The stress–logarithmic strain curves in the average sense were obtained (Figure 2), in which the average tensile strength is 102.95 N/mm in the warp direction and 93.41 N/mm in the weft direction, and the corresponding average elongation at break is 0.235 and 0.285, respectively. The properties of the coated fabrics are quite different in the warp and weft directions, but they all have strong nonlinearity.
Specifications of the testing membrane material.

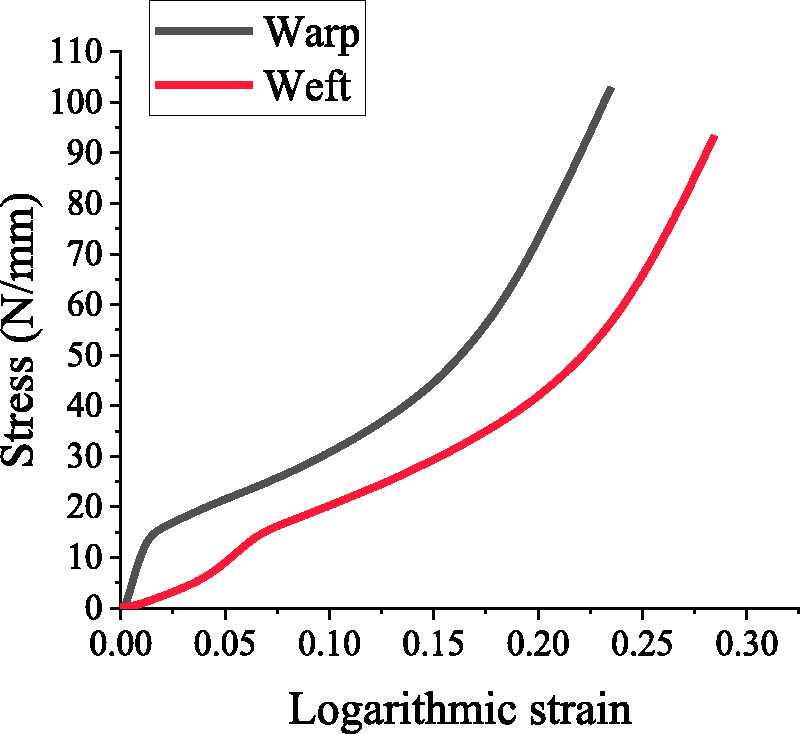
Stress–logarithmic strain curves of uniaxial tension.
Test set-up
This study focused on in-plane uniaxial tearing tests because they are widely used in the field of architecture. Referring to FAA-P-8110-2 [8] and DG/TJ08-2019-2007 [5], the dimensions of uniaxial central, single-edge notched, and trapezoidal tearing specimens are shown in Figure 3. Their specific dimensions were adjusted according to the test purpose. During the specimen preparation, the cut path and external load are parallel to the yarn direction. The cutting should be carried out along the center line between neighboring yarns to avoid loss of fibers. In the following section, the specimens in which the warp and weft yarns are parallel to the direction of the external load are defined as warp and weft specimens, respectively. The uniaxial tests were conducted using a universal testing machine CMT4204 (see Figure 4(a)). Unless otherwise specified, the tension speed was set to 2 mm/min to ensure static loading. The sensor installed near the clamp can record load and displacement data in real time.
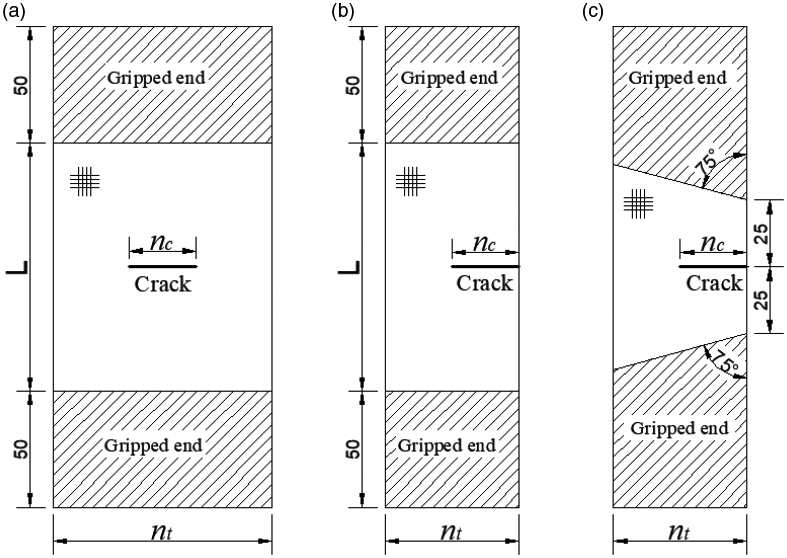
Tearing specimens: (a) uniaxial central tearing specimen; (b) single-edge notched tearing specimen; and (c) trapezoidal tearing specimen.
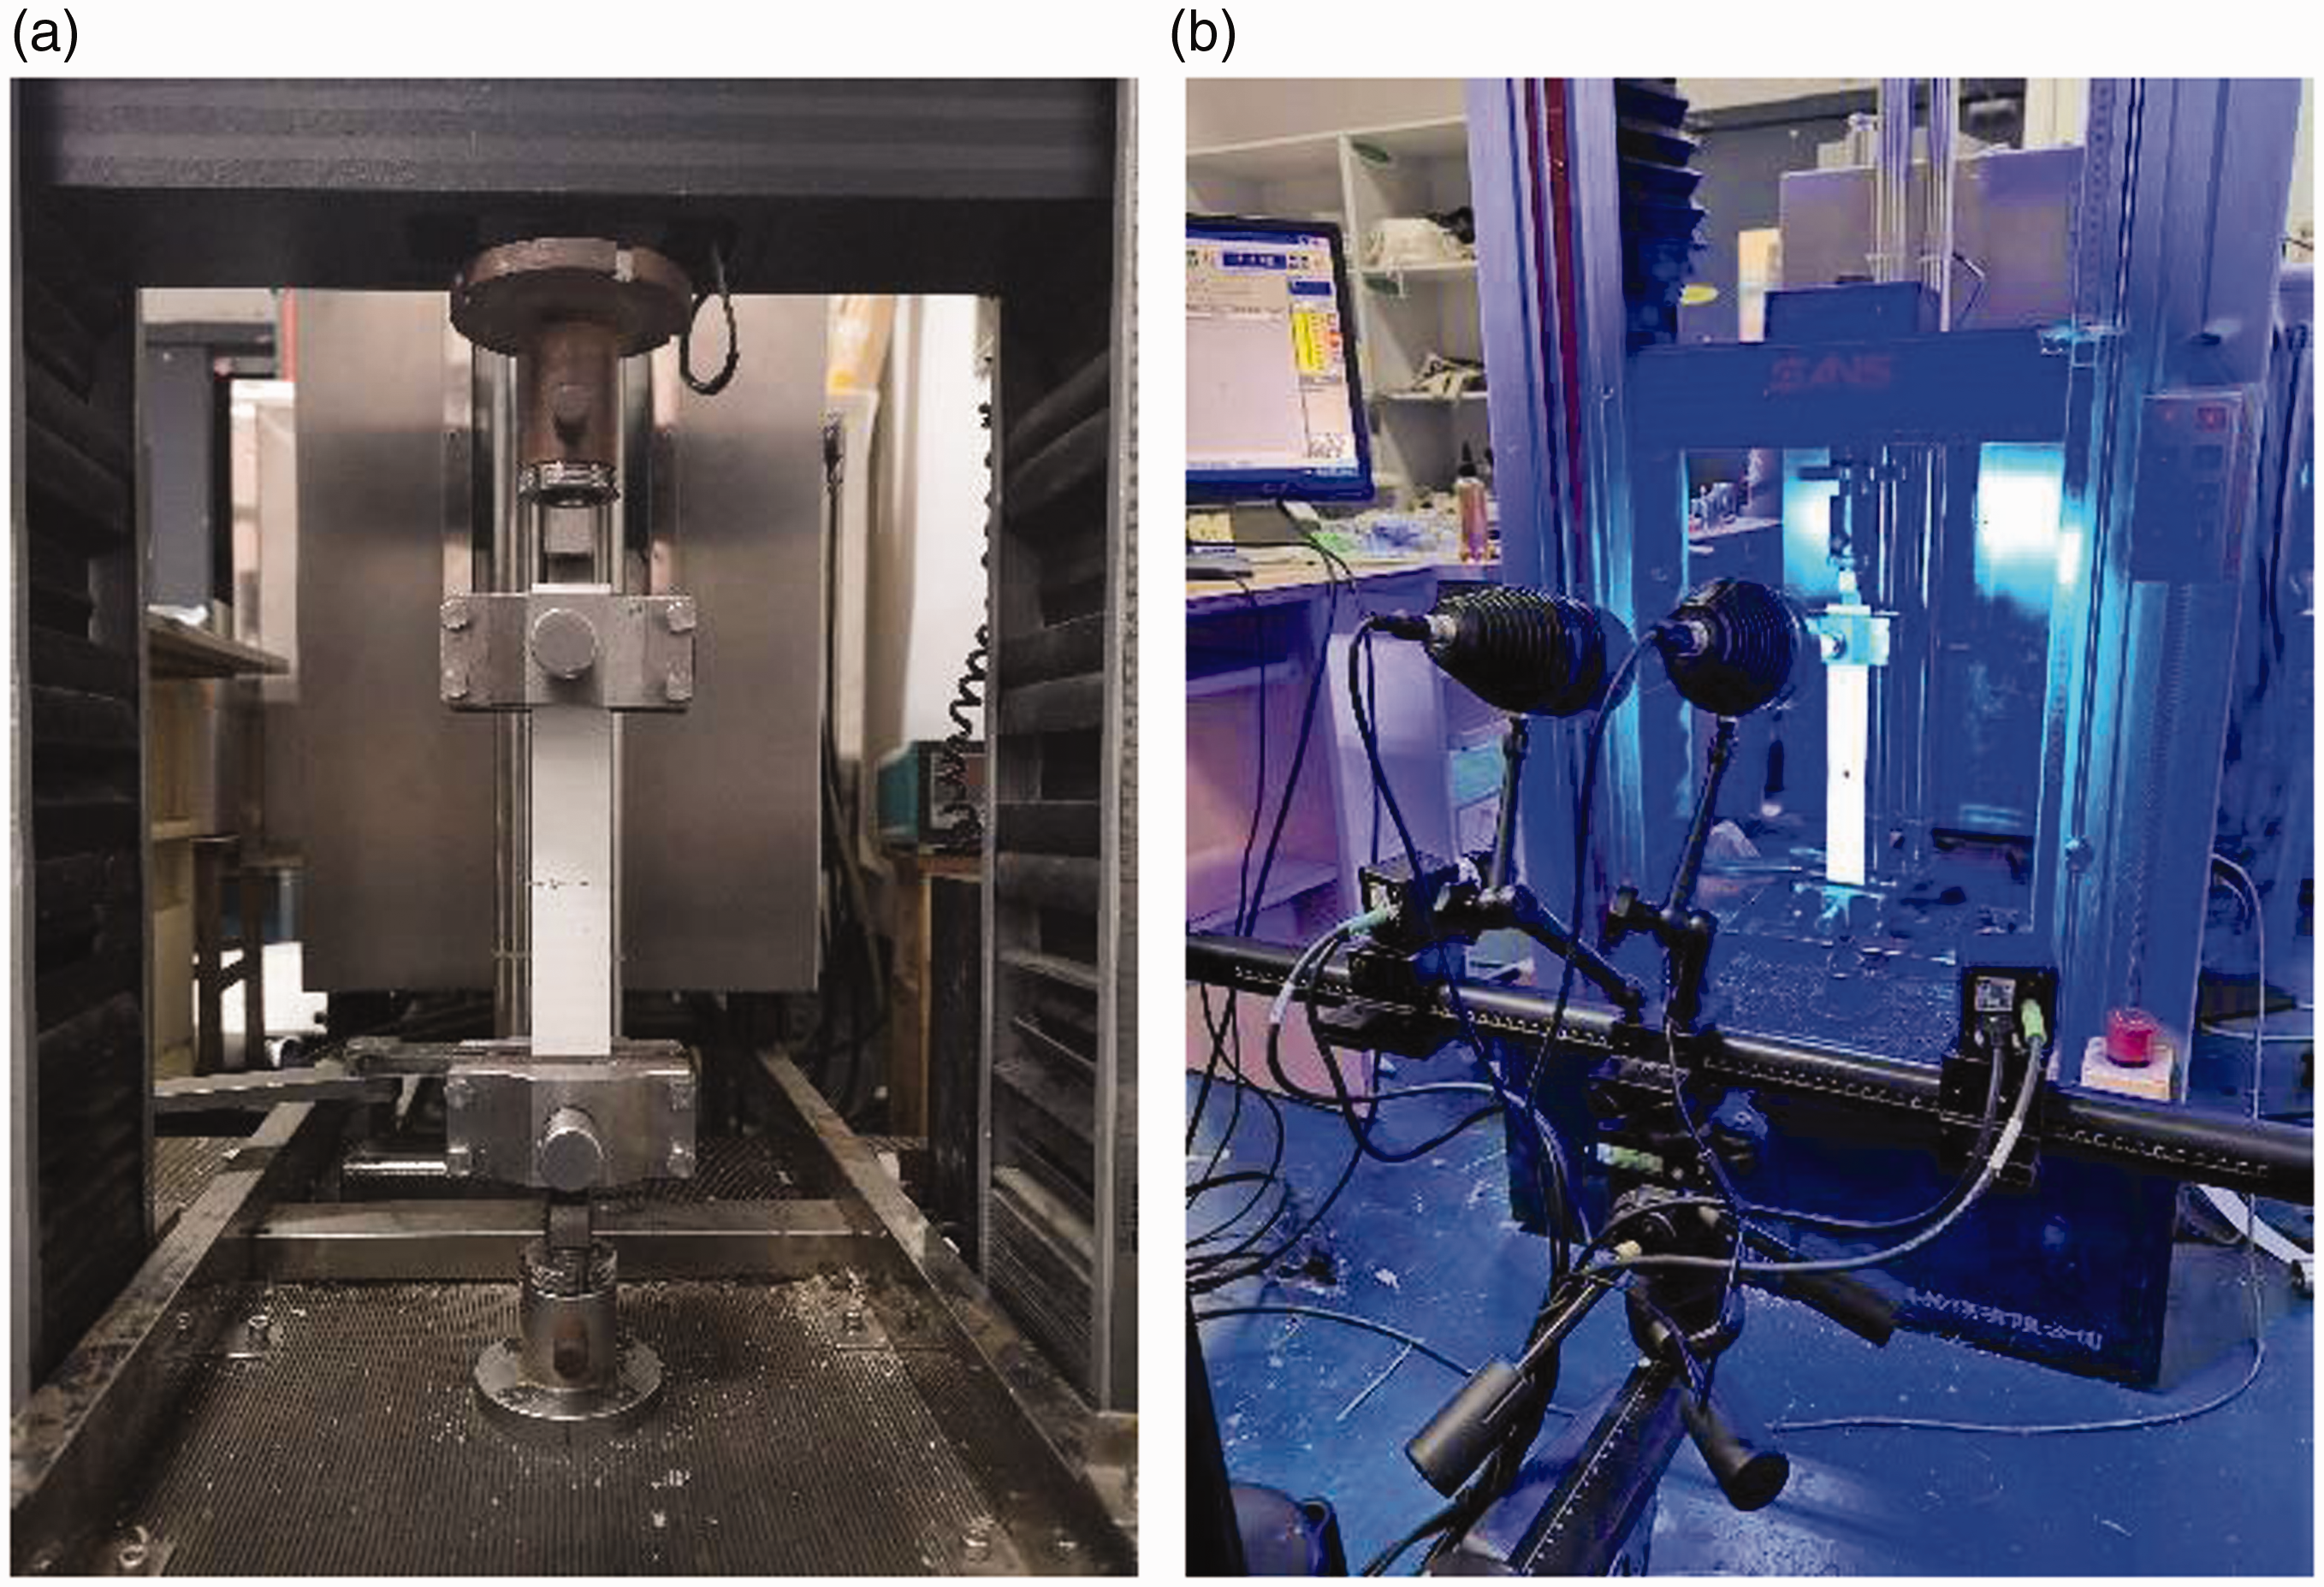
(a) Universal testing machine CMT4204 and (b) DIC equipment.
In the tearing tests, the number of yarns is used instead of the typical international unit length to avoid damage to the yarns during specimen preparation, as yarns bear most of the applied load. Therefore, the macro crack length 2a is replaced by nc, which represents the number of cutting-off yarns in the drawing direction. The total number of yarns in the width direction of the specimen is expressed as nt. The gauge length between the edges of the clamps is represented by L. For all specimens, the angle between the initial crack direction and the width direction is zero. The letters C, S, and T refer to uniaxial central, single-edge notched, and trapezoidal tearing tests, respectively. In this way, the warp specimens in the uniaxial central tearing tests can be expressed as C-Warp-nc-nt. The naming rules of the other specimens are analogous. The parameters of the tearing tests are shown in Table 2. Each test was repeated twice to increase the credibility of the test results.
Parameters of tearing tests.

In order to obtain the strain field distributions on the membrane surface during the entire tearing process, a three-dimensional digital speckle dynamic strain measurement and analysis system was used. It was set at a distance of 1.5 m from the specimen and aimed directly at the membrane surface (Figure 4(b)). The principle of the system is based on the DIC method combined with binocular stereo vision technology. Two high-speed cameras were used to acquire speckle images at each spatial 3 D deformation stage of the object in real time, based on which the full-field strain distributions can be obtained through calculation. The range of strain measurement for the DIC equipment used in the study was 0.005–2000%. All tests were conducted at a temperature of 20 ± 2.0 °C and a relative humidity of 65 ± 3.0%, according to DG/TJ08-2019-2007 [5].
Analysis of specimen configuration
Failure modes
For in-plane uniaxial tearing tests, including uniaxial central, single-edge notched, and trapezoidal tearing tests, the tearing process exhibits some common characteristics. Consider the uniaxial central tearing test as an example (Figure 5). The tearing process can be roughly divided into three stages:

Tearing process in (a) original stage, (b) initial loading stage, (c) del-zone formation stage, and (d) crack propagation and failure stage.
Initial loading stage: When specimens begin to bear external load, the yarns in the drawing direction begin to be stretched gradually from crimp to straight, and the shape of the crack changes from an initial closed state to an ellipse, as shown in Figure 5(a) and (b).
Del-zone formation stage: With an increase in load, the yarns near the crack tip are greatly deformed, stripped from the coating, and stretched to form an approximately triangular area, which can be called the del-zone, as shown in Figure 5(c). A further increase in the load would lead to more yarns participating in the del-zone.
Crack propagation and failure stage: Owing to the further increase in load, the crack starts to expand when the first yarn nearest to the crack tip in the del-zone reaches elongation at breakage. Subsequently, there are two main failure modes, i.e., brutal and progressive failure modes, represented by “B” and “P,” respectively, in this paper. In the brutal mode, the entire tearing process from tearing extension to the overall failure of the specimen can be completed suddenly, and there is almost no descending section in the corresponding stress–displacement curve, as shown in Figure 6. For the progressive mode, the yarns near the crack tip break one at a time and new del-zones form continuously as tearing progresses, resulting in a long descending section with zigzag fluctuations in the stress–displacement curve (see Figure 6). Stress–displacement curves of specimens with different gauge lengths.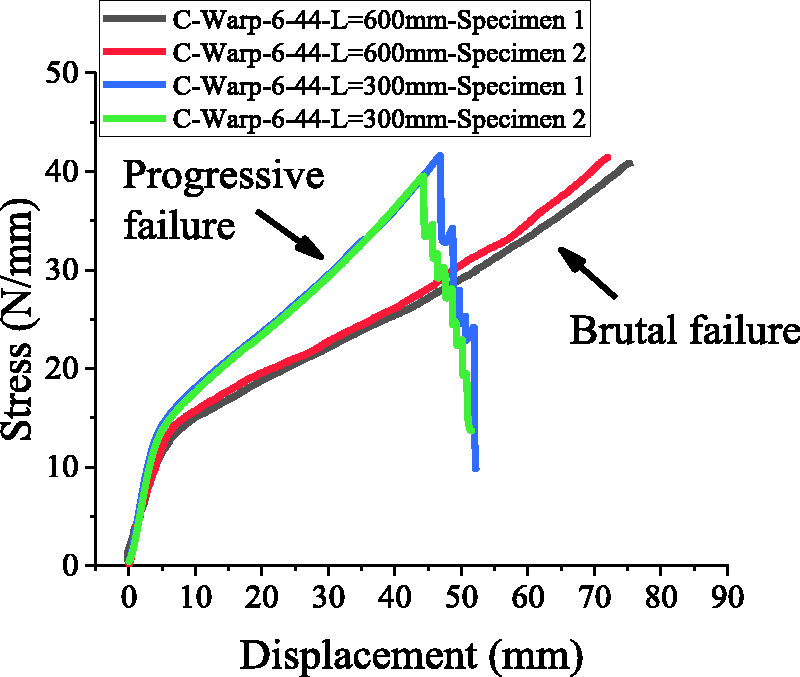
Figure 6 also indicates that when the crack begins to expand, the bearing capacity of the specimen also reaches its limit. The average value obtained by dividing the load by the total width of the specimen is defined as the stress during the tearing process and the critical peak stress is defined as the tearing strength in this study. The tearing process of the single-edge notched tearing test is very similar to that of the uniaxial central tearing test, whereas for the trapezoidal tearing test, the failure mode is typically only progressive failure.
The failure modes depend on the specimen configuration, including the number of cutting-off yarns nc, total number of yarns in the width direction nt, and gauge length L. The stress–displacement curves of the uniaxial central tearing specimens C-Warp-6-44 with different values of L are shown in Figure 6. Clearly, when L is shortened from 600 to 300 mm, the tearing failure mode changes from brutal to progressive. The relationships between the failure modes and crack length and specimen width are presented in Table 3 and Table 5, respectively.
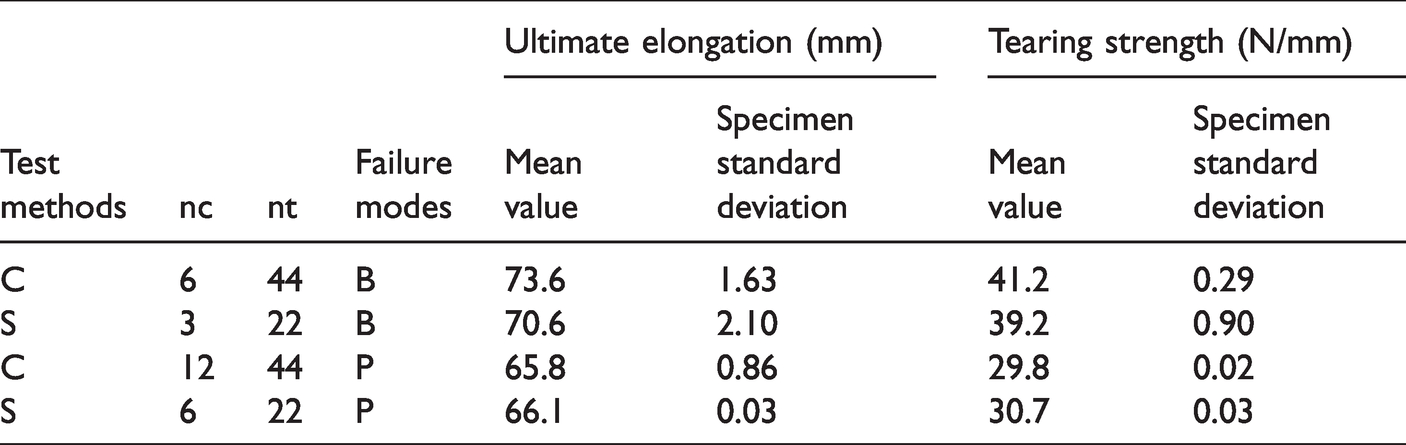
Test results of uniaxial central and single-edge notched tearing tests.
Test results of warp specimens when nc = 3 with different values of nt.

From the energy perspective, the influence of specimen configuration on the failure modes can be explained by both the deformation energy stored in the specimen at the moment of tearing propagation and the number of remaining intact yarns across the crack section, i.e., (nt−nc). Specifically, when L is long and (nt−nc) is small, a large amount of deformation energy accumulates in the specimen and a smaller new crack surface is formed. At this time, the specimen tends to show brutal failure. On the contrary, progressive failure occurs owing to less deformation energy and a greater number of remaining intact yarns. As shown in Figure 7(a) and Table 3, specimen S-Warp-6-22 has a progressive failure rather than S-Warp-3-22, although the former has fewer remaining intact yarns than the latter. This is because, compared to fewer intact yarns, S-Warp-6-22 has much lower stress levels when crack propagation occurs, i.e., lower deformation energy, owing to a greater number of more cutting-off yarns. However, because of the clamping mode of the trapezoidal specimen, its gauge length is relatively fixed, and the elongation deformation of the yarns is mainly concentrated in the del-zone near the crack tip and is not affected by the value of (nt−nc). Therefore, its failure mode is relatively straightforward, i.e., progressive failure in which the yarns break one at a time. The following investigations of specimen configuration are aimed at uniaxial central and single-edge notched tearing tests.
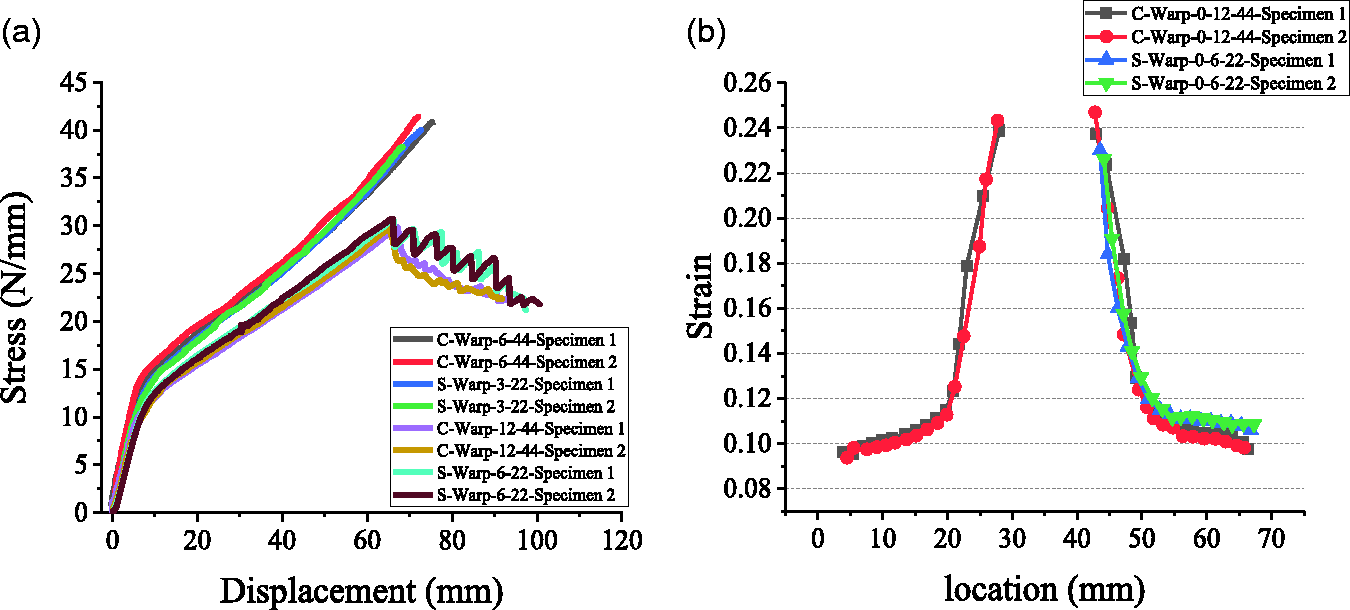
(a) Stress–displacement curves and (b) strain field distributions.
Comparison between uniaxial Central and single-edge notched tearing tests
In terms of specimen appearance and clamping mode, the trapezoidal test is quite different from the other two in-plane uniaxial tearing methods. Among them, uniaxial central tearing is closest to the actual tearing state of coated fabrics in actual membrane structures, and single-edge notched tearing can be regarded as a simplification of it. Therefore, in this section, we compare the uniaxial central and single-edge notched tearing tests in terms of tearing strength and failure mode. Taking the warp specimen as an example, the test results are shown in Figure 7 and Table 3, in which the values of nc and nt of the single-edge notched specimens are half those of the corresponding uniaxial central tearing specimens. The gauge length L of all specimens was set to 600 mm. The values of nc, nt, and L were selected based on the discussion in ‘Failure modes’ section, in order for both failure modes to occur.
The stress–displacement curves and strain field distributions obtained across the crack section at the moment of tearing propagation of the uniaxial central tearing specimens and the corresponding single-edge notched tearing specimens are shown in Figure 7. It is evident that the shapes of the curves and the strain field distributions are almost coincident, resulting in near identical tearing strength, elongation at break, and specimen stiffness represented by the slope of the curve between these two tearing methods (see Table 3). However, the differences between them are mainly reflected in two aspects: (1) as shown in the side view of the membrane surface in Figure 8, compared with the uniaxial central tearing specimen, the membrane surface near the crack in the single-edge notched tearing specimen has evident warpage due to lack of restraint; (2) for the descending section after crack propagation, the stress–displacement curve of the single-edge notched tearing specimen has clear and regular zigzag fluctuations. This is because the fracture of a single yarn in the del-zone causes instantaneous unloading, and with the formation of a new del-zone, the bearing capacity of the specimen can continue to develop. Therefore, this type of “zigzag” can be generated cyclically until the specimen is damaged overall. In the uniaxial central tearing specimen, the zigzag wave is denser and lacks regularity because the inevitable asymmetry produced in the specimen during the process of fabrication, installation, and tension causes the propagation of the two crack tips to affect each other.
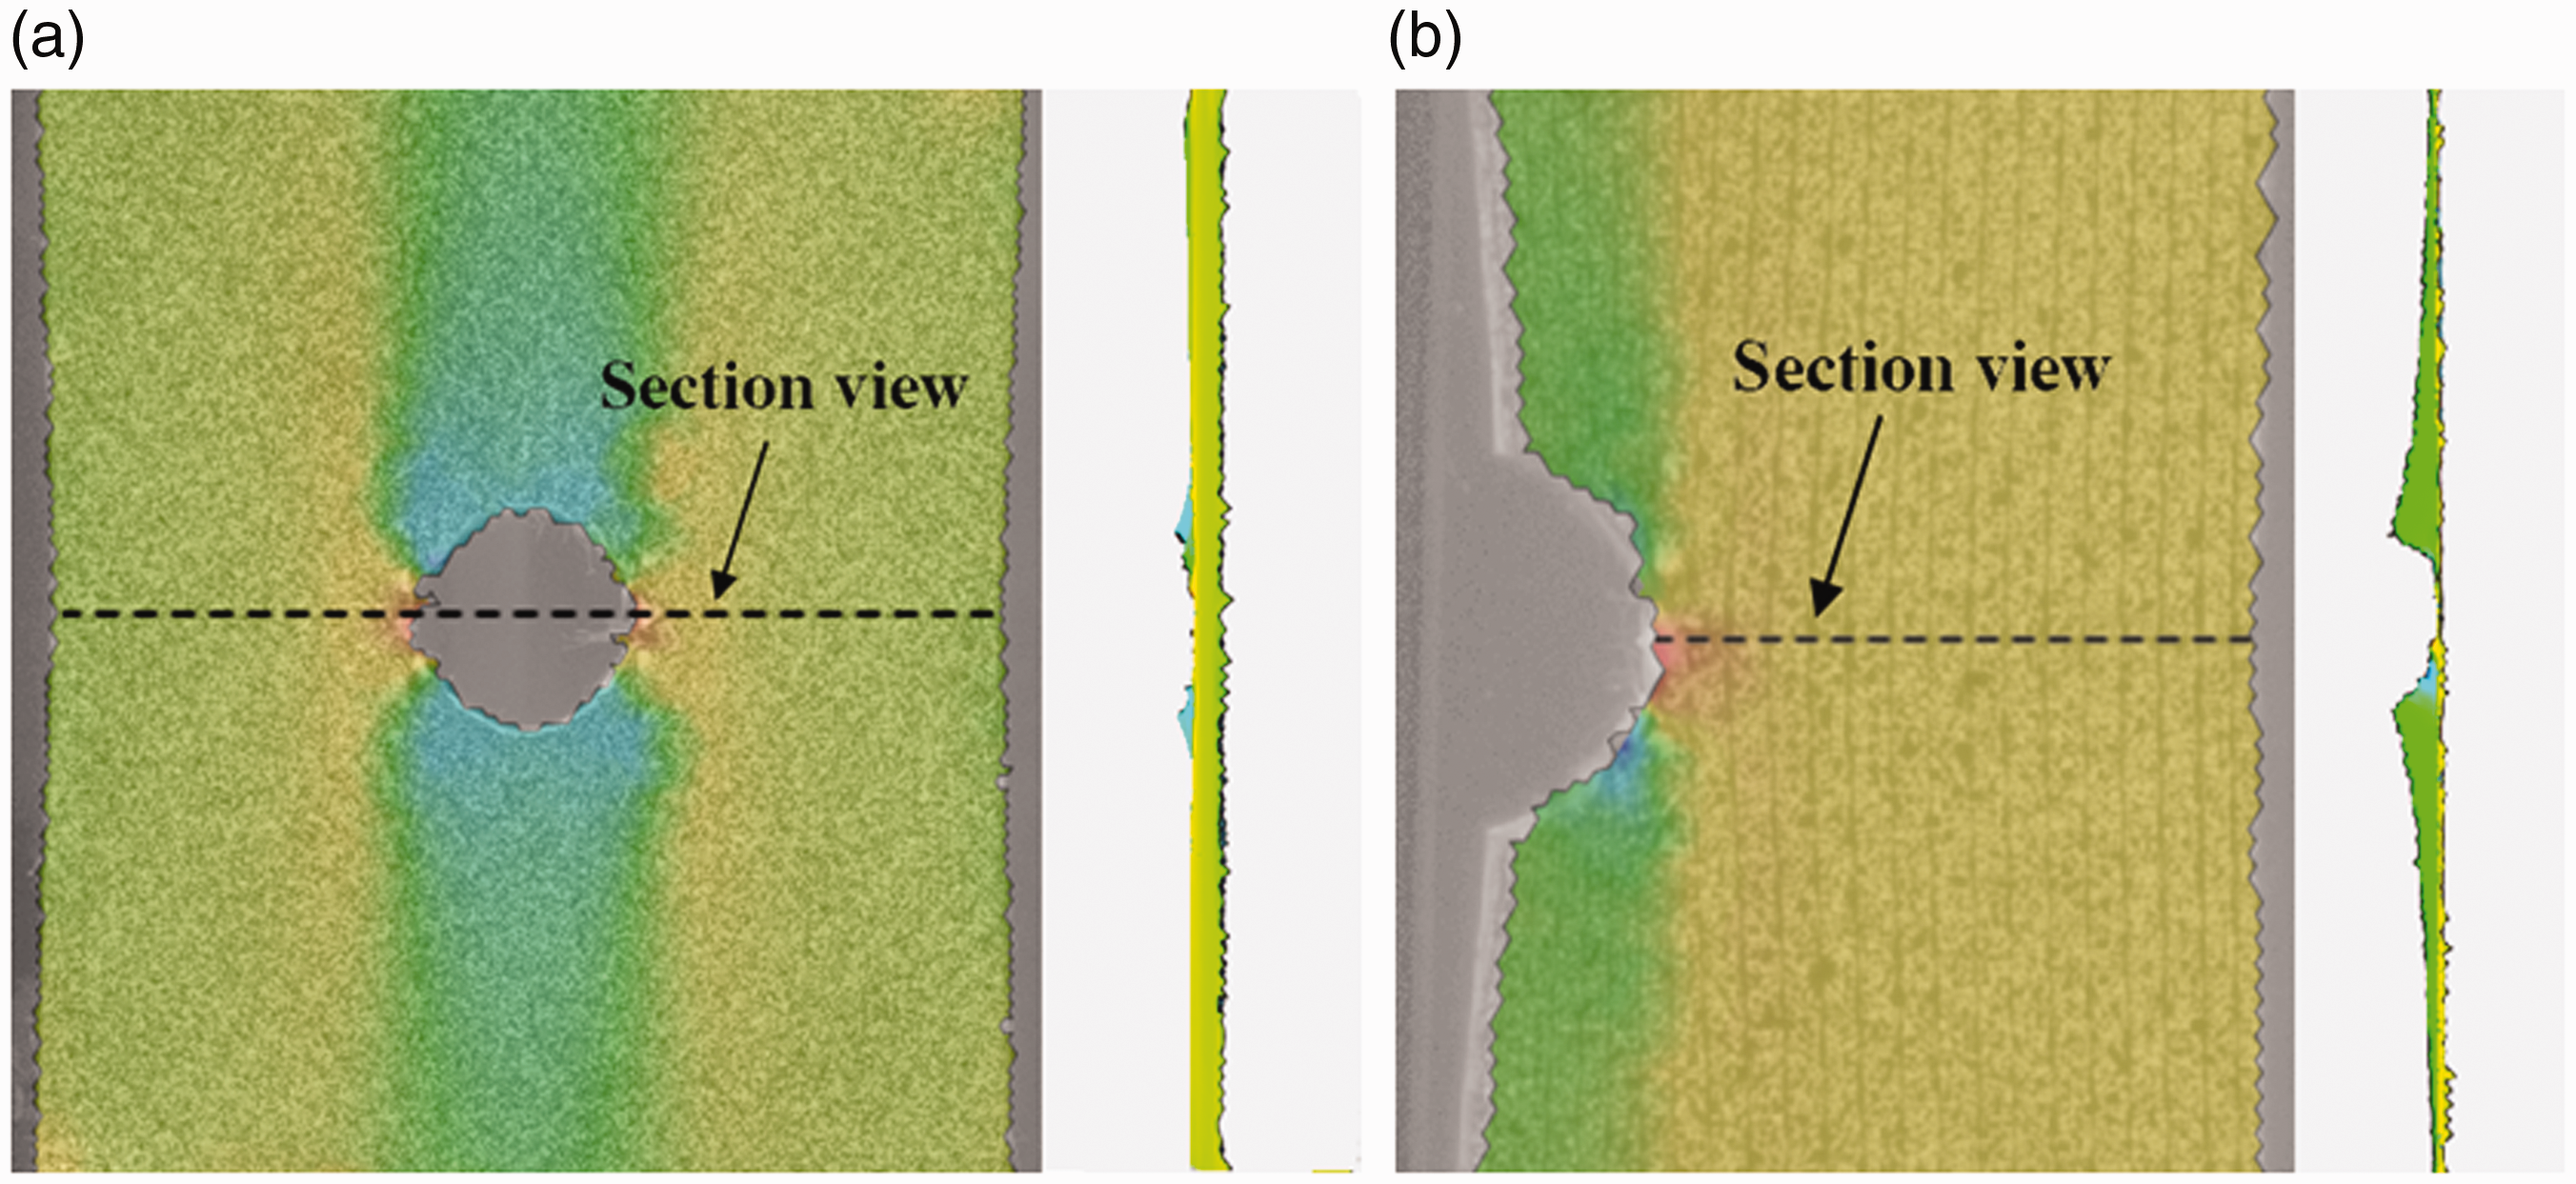
Strain field distributions and side view of the membrane surface at the moment of crack propagation in (a) uniaxial central tearing test and (b) single-edge notched tearing test.
In conclusion, before crack propagation, the single-edge notched tearing test can be used to replace the corresponding uniaxial central tearing test. Therefore, in the following sections, the uniaxial central tearing test is omitted to conserve material.
Effect of specimen gauge length
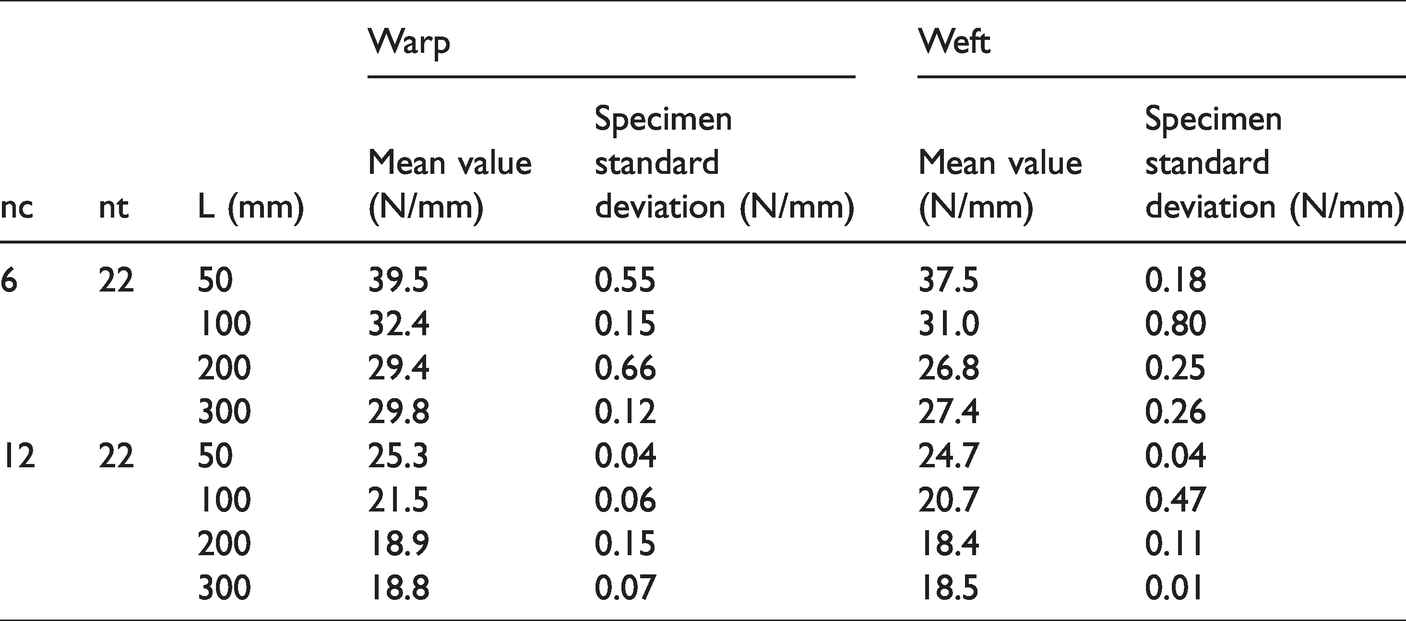
The gauge length L affects not only the failure modes, but also the tearing strength of the specimen. The relationship between the tearing strength and L when the cutting-off yarns are 6 and 12 in the single-edge notched tearing tests are shown in Table 4 and Figure 9. It is evident that when L ≥ 200 mm, the tearing strength of the specimen is independent of the value of L. However, when L < 200 mm, the tearing strength increases with the decrease in L. This is because when the specimen is shorter, it is increasingly difficult for the load at the crack to be transmitted to the crack tip through the shear action of the membrane surface. Therefore, the stress concentration at the tip is less clear, which implies that the strain field distribution, as shown in Figure 9(b), gradually becomes uniform, resulting in the improvement of the bearing capacity of the specimen. In the limit state, if L approaches 0 mm, the specimen should be close to the uniaxial tensile state and the failure is no longer caused by tearing. Therefore, to obtain a reliable tearing strength, the minimum gauge length L of a single-edge notched tearing specimen must be 200 mm.
Tearing strength of specimens with different gauge length L.
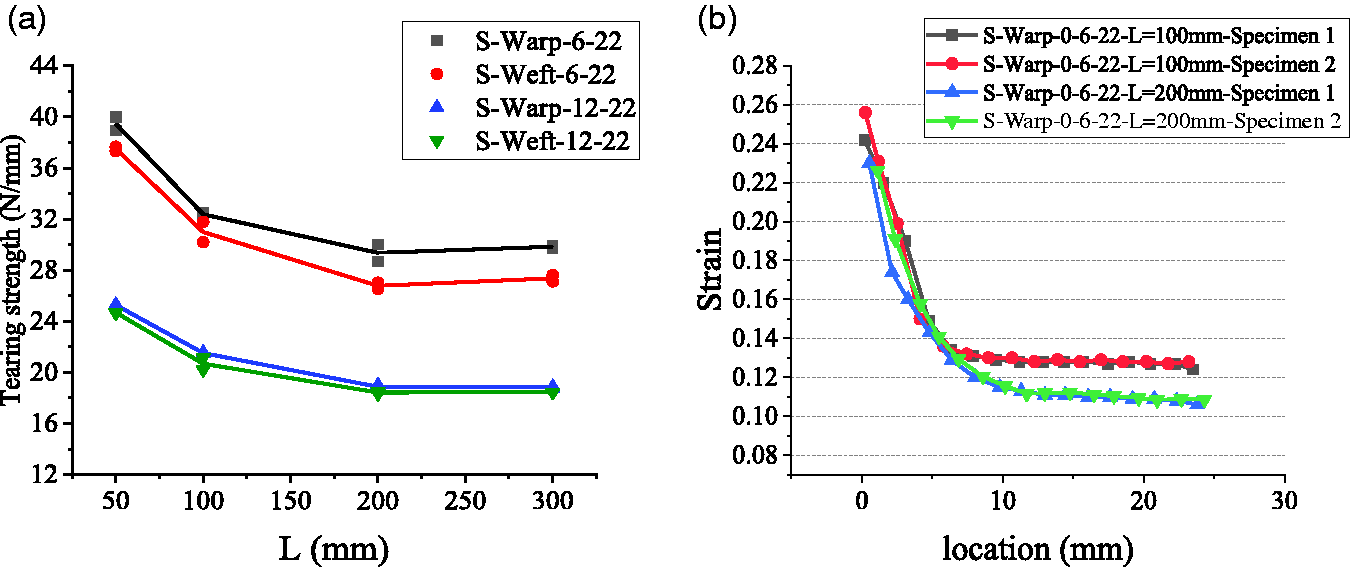
(a) Relationship between the tearing strength and the gauge length L and (b) strain field distributions of specimens with different L.
Effect of specimen width
In actual membrane structures, the membrane surface can be considered as infinite compared with the size of a general damage or crack. However, owing to the size of the test equipment and limited material supply, specimens with finite widths are used to simulate the practical quasi-infinite situation. Therefore, the reasonability of this simulation, i.e., the influence of specimen width represented by the total number of yarns in the width direction nt on the tearing performance of the fabric must be studied. The gauge length L of the single-edge notched specimen was set to 200 mm.
Figure 10(a) shows the typical stress–displacement curves and the strain field distributions across the crack section at the moment of tearing propagation of the single-edge notched specimens with different nt, while the number of the initial cutting-off yarns nc is 3. For clearer observation, the descending sections of the stress–displacement curves are deleted. The corresponding values are listed in Table 5. Figure 11 reveals the relationship between the value of (nt−nc) and the tearing strength when nc equals 3 and 6, in which (nt–nc) represents the number of initial remaining intact yarns across the crack section. From these figures, it can be seen that when (nt−nc)≥6, the stress–displacement curves of the specimens are nearly coincident, which means that their tearing strength and elongation at break are very close to each other. However, when (nt−nc)<6, the tearing resistance of the specimen decreases. Figure 10(b) further illustrates that the shape of the strain field distributions of yarns across the crack section is not affected by (nt−nc) when nc is the same. However, when the value of (nt−nc) is too small to form a full del-zone at the crack tip, the tearing strength and elongation at break of the specimen decreases. The number of yarns contained in a full del-zone at the critical moment of propagation can be defined as nΔ. Examining the load fields as shown in Figure 10(b) reveals that the strain of the yarns increases rapidly when approaching the crack tip, owing to the stress concentration. The starting point of the del-zone can be defined as the location where the strain value of two adjacent yarns changes by more than 5%. Thus, the value of nΔ can be determined. Clearly, nΔ equals 6 when nc is 3 or 6. To some extent, it can be said that the size of the del-zone represented by nΔ is not affected by nc. In conclusion, if an actual infinite membrane surface is to be simulated, the following formula must be satisfied

(a) Stress–displacement curves and (b) strain field distributions of specimens with different values of nt.

Relationship between the values of (nt−nc) and the tearing strength.
Methods of fracture toughness determination
As mentioned above, when the energy release rate G reaches the critical value, i.e., the fracture toughness GIC, tearing failure begins to occur. Here, GIC is an internal parameter of a material that can be used to evaluate its tearing resistance. Therefore, researchers have attempted to use various methods to measure or calculate this parameter. In this section, one theoretical method and two test methods are used to obtain the GIC value of this PVC-coated fabric.
Theoretical method based on minami model
Based on the model of Hedgepeth (Figure 12) [14], it is possible to obtain the released strain energy, which can be considered equal to the work done to attempt to close a crack and return to the original crackless state. As this released energy is assumed to form new crack surfaces, Minami proposed a theoretical formula to calculate the fracture toughness GIC as follows

Hedgepeth’s model.
Test method based on the area difference of load–displacement curves
Referring to the research of Triki et al. [17], the relationship between the strain energy release rate G, external force work W, and newly formed crack area A is as follows
Figure 13 reveals the typical load–displacement curves of single-edge notched tearing tests, from which W is obtained by calculating the area enclosed by the curve and the coordinate on the abscissa. When the specimen begins to bear an external load, the curve shows strong nonlinearity, rising from zero point to point A, and the critical point crack starts to propagate. During this process, all the external work is transformed into deformation energy and stored in the specimen. After point A, with the breakage of yarns at the crack tip, the specimen begins to unload. According to the test, each zigzag wave represents a broken yarn. When n yarns have broken and the corresponding new crack surface is formed, the curve decreases to point B. Then, the universal testing machine is controlled to unload and the grip begins to retract to the initial position. At the same time, the corresponding curve returns to the initial zero point, and all the elastic strain energy We in the specimen is released. In this way, the total external work W is converted into the plastic strain energy stored in the specimen and the energy consumed to form the new crack area A. A can be obtained by multiplying the number of broken yarns by the corresponding yarn spacing. When A is small, the following approximation can be made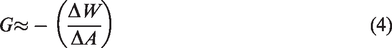

Schematic diagrams of the calculation method of (a) W and We and (b) ΔW.
ΔW and ΔA are calculated as follows

Test method based on the area of the parallelogram
In view of the disadvantages of the test method based on the area difference of the load–displacement curves, a more reasonable and convenient test method to obtain GIC is proposed below.
For trapezoidal tearing specimens and single-edge notched tearing specimens with proper configurations, the descending sections of the load–displacement curves have clear and regular zigzag fluctuations, as shown in Figure 14. This is a typical characteristic of tearing of fabric materials, which is different from that of other common materials, such as steel and concrete. With the yarns breaking one at a time, the tearing propagation of the fabric has a strong regularity.
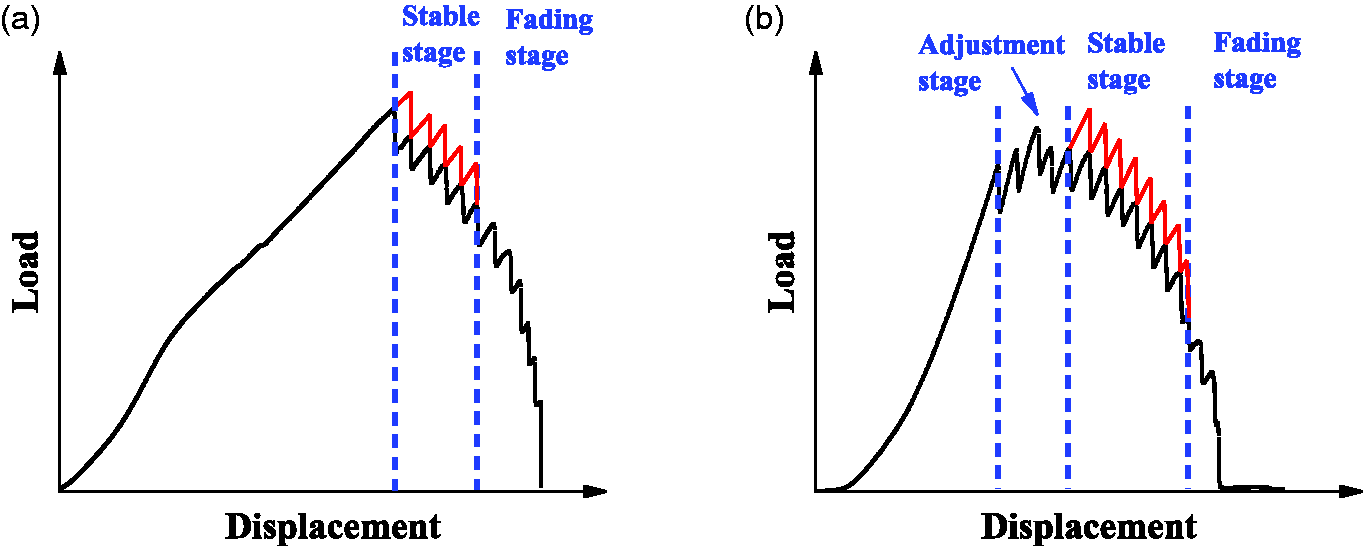
Typical load–displacement curves of (a) single-edge notched and (b) trapezoidal tearing tests.
Figure 15 presents a local image of a representative zigzag wave, in which the curve can be replaced with straight line segments without introducing significant errors. The process of crack propagation is described in ‘Failure modes’ section. When the external load rises to point A, the first yarn in the del-zone at the edge of the crack reaches the ultimate elongation and breaks. Then, the crack begins to propagate with instantaneous unloading, and the corresponding load–displacement curve drops to point B. Subsequently, as the remaining yarns continue to bear an external load, a new del-zone forms and the curve rises to point C. In such a process, a zigzag path P1 is formed: I→A→B→C→J. On the contrary, it can be assumed that the yarn can continue to be stretched without breakage after point A. Correspondingly, the load–displacement curve continues to rise to point D along the extended path of I→A. Then, when the specimen is forced to unload, the curve drops to point J through point C, thus forming a hypothetical path P2: I→A→D→C→J. Clearly, the difference between paths P1 and P2 is mainly due to the breakage of the yarn. From the perspective of energy, the area enclosed by the load–displacement curve and the abscissa is the strain energy stored in the specimen. Therefore, it can be assumed that the energy represented by the approximate parallelogram area ΔS is released owing to the fracture of a single yarn and used to form a new crack surface in the yarn. Undoubtedly, this assumption is approximate because ΔS inevitably involves a certain amount of plastic deformation energy and kinetic energy, which ae neglected in this study. Thus, the value of ΔS divided by the newly formed crack surface represented by yarn spacing is equal to the fracture toughness GIC.

Analysis schematic of the hypothetical parallelogram.
Results and discussion
Theoretical method based on minami model
Owing to the fact that the Minami formula is derived on the yarn level, it is believed that this model can reflect the tearing properties of the coated fabric more practically and comprehensively. This formula is based on the assumption that the material is treated as linearly elastic, which means Ey and Gxy are regarded as constant values during the entire derivation process. Certain methods are needed to obtain these assumed linear material properties. It should be noted that the value of the shear modulus Gxy is extremely small compared to Ey. Here, Gxy is assumed as a constant value and is set to 34.2 N/mm2, as obtained from the corresponding shear test referring to DG/TJ08-2019-2007 [5]. To obtain the elastic modulus Ey, four linearization methods are used as follows, and the results are shown in Table 6:
Results of Ey and Gxy.

Considering that the membrane surface near the crack tip is in a biaxial stress state during the tearing process, the biaxial tensile modulus E1 is obtained through the least-squares method based on DG/TJ08-2019-2007 [5].
According to the method used by Minami, a straight line is drawn to connect the start point and the end point of the stress–logarithmic strain curve of the uniaxial tensile specimen shown in Figure 2. The slope of this straight line is taken as the approximate value of modulus E2.
The tangent modulus at the end of the stress–logarithmic strain curve of the uniaxial tensile specimen is taken as the approximate modulus E3.
The uniaxial tensile specimen undergoes three stretching cycles before uniaxial tension to eliminate the extra pseudo strain due to the initial crimp of the yarns. Then, the method of estimating the modulus E4 is the same as that in method 2.
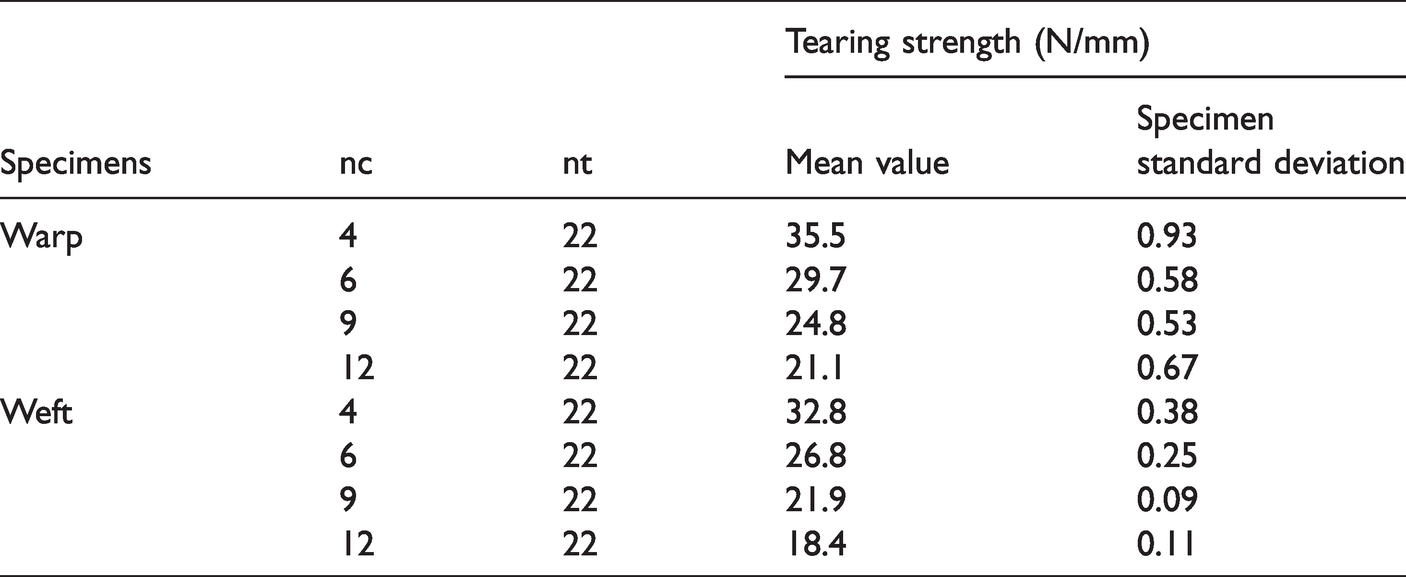
Single-edge notched tearing tests with different nc were conducted to obtain the tearing strength, in which the nt and L values of specimens are set to 22 and 200 mm, respectively, based on the discussion in ‘Analysis of specimen configuration’ section. The test results are shown in Table 7, and the obtained GIC values with different nc and Ey are shown in Figure 16. It is found that in warp or weft specimens, the GIC calculated using the Minami formula hardly changes with nc. Among the four methods mentioned above, the GIC calculated based on E3 is the smallest, and the results of the other three cases are similar to each other.
Test results of single-edge notched tearing tests.

GIC calculated with different nc and linear modulus.
Test method based on the area difference of load–displacement curves
Based on the method mentioned above, single-edge notched tearing tests were conducted on specimen S-Weft-6 with different numbers of yarns in the width direction nt and gauge length L. In spite of the conclusion in ‘Effect of specimen gauge length’ section, that the minimum gauge length of the specimen for obtaining a stable tearing strength should be 200 mm, the gauge length in this section is set to 100 and 50 mm for two reasons: (1) GIC is an inherent property of the material that does not affect the test form; (2) when the gauge length L is set to 200 mm, more deformation energy will be accumulated in the material at the moment of propagation and brutal failure will occur, which means that the load–displacement curve will have no descending section. In addition, nt is set to 10 and 15. The test results are shown in Figures 17 and 18.

Load–displacement curves of S-Weft-6 when (a) L = 50 mm and (b) L = 100 mm.

Relation curves of external work W and new crack area A.
Based on the load–displacement curves in Figure 17, the value of W corresponding to the new crack area A can be obtained and is shown in Figure 18. For different specimens, the data of W can be fitted with different straight lines. The slope of the line can be used as an approximation of GIC as reported by Triki et al. [17]. For this PVC-coated fabric, it is found that the slope of the lines that represent GIC is significantly affected by the width and length of the specimen. In other words, the obtained GIC is positively correlated with nt and L, because the greater the values of nt and L, the larger the amount of plastic deformation energy contained in ΔW. Only when nt and L are close to 0 can we obtain the true fracture toughness, which is not realistic. In summary, the test method based on the area difference of the load–displacement curves is closely related to the specimen configuration. Therefore, it is difficult to obtain the GIC value of coated fabrics using this method, and it is necessary to develop new test methods to achieve this goal.
Test method based on the area of the parallelogram
Single-edge notched tearing test
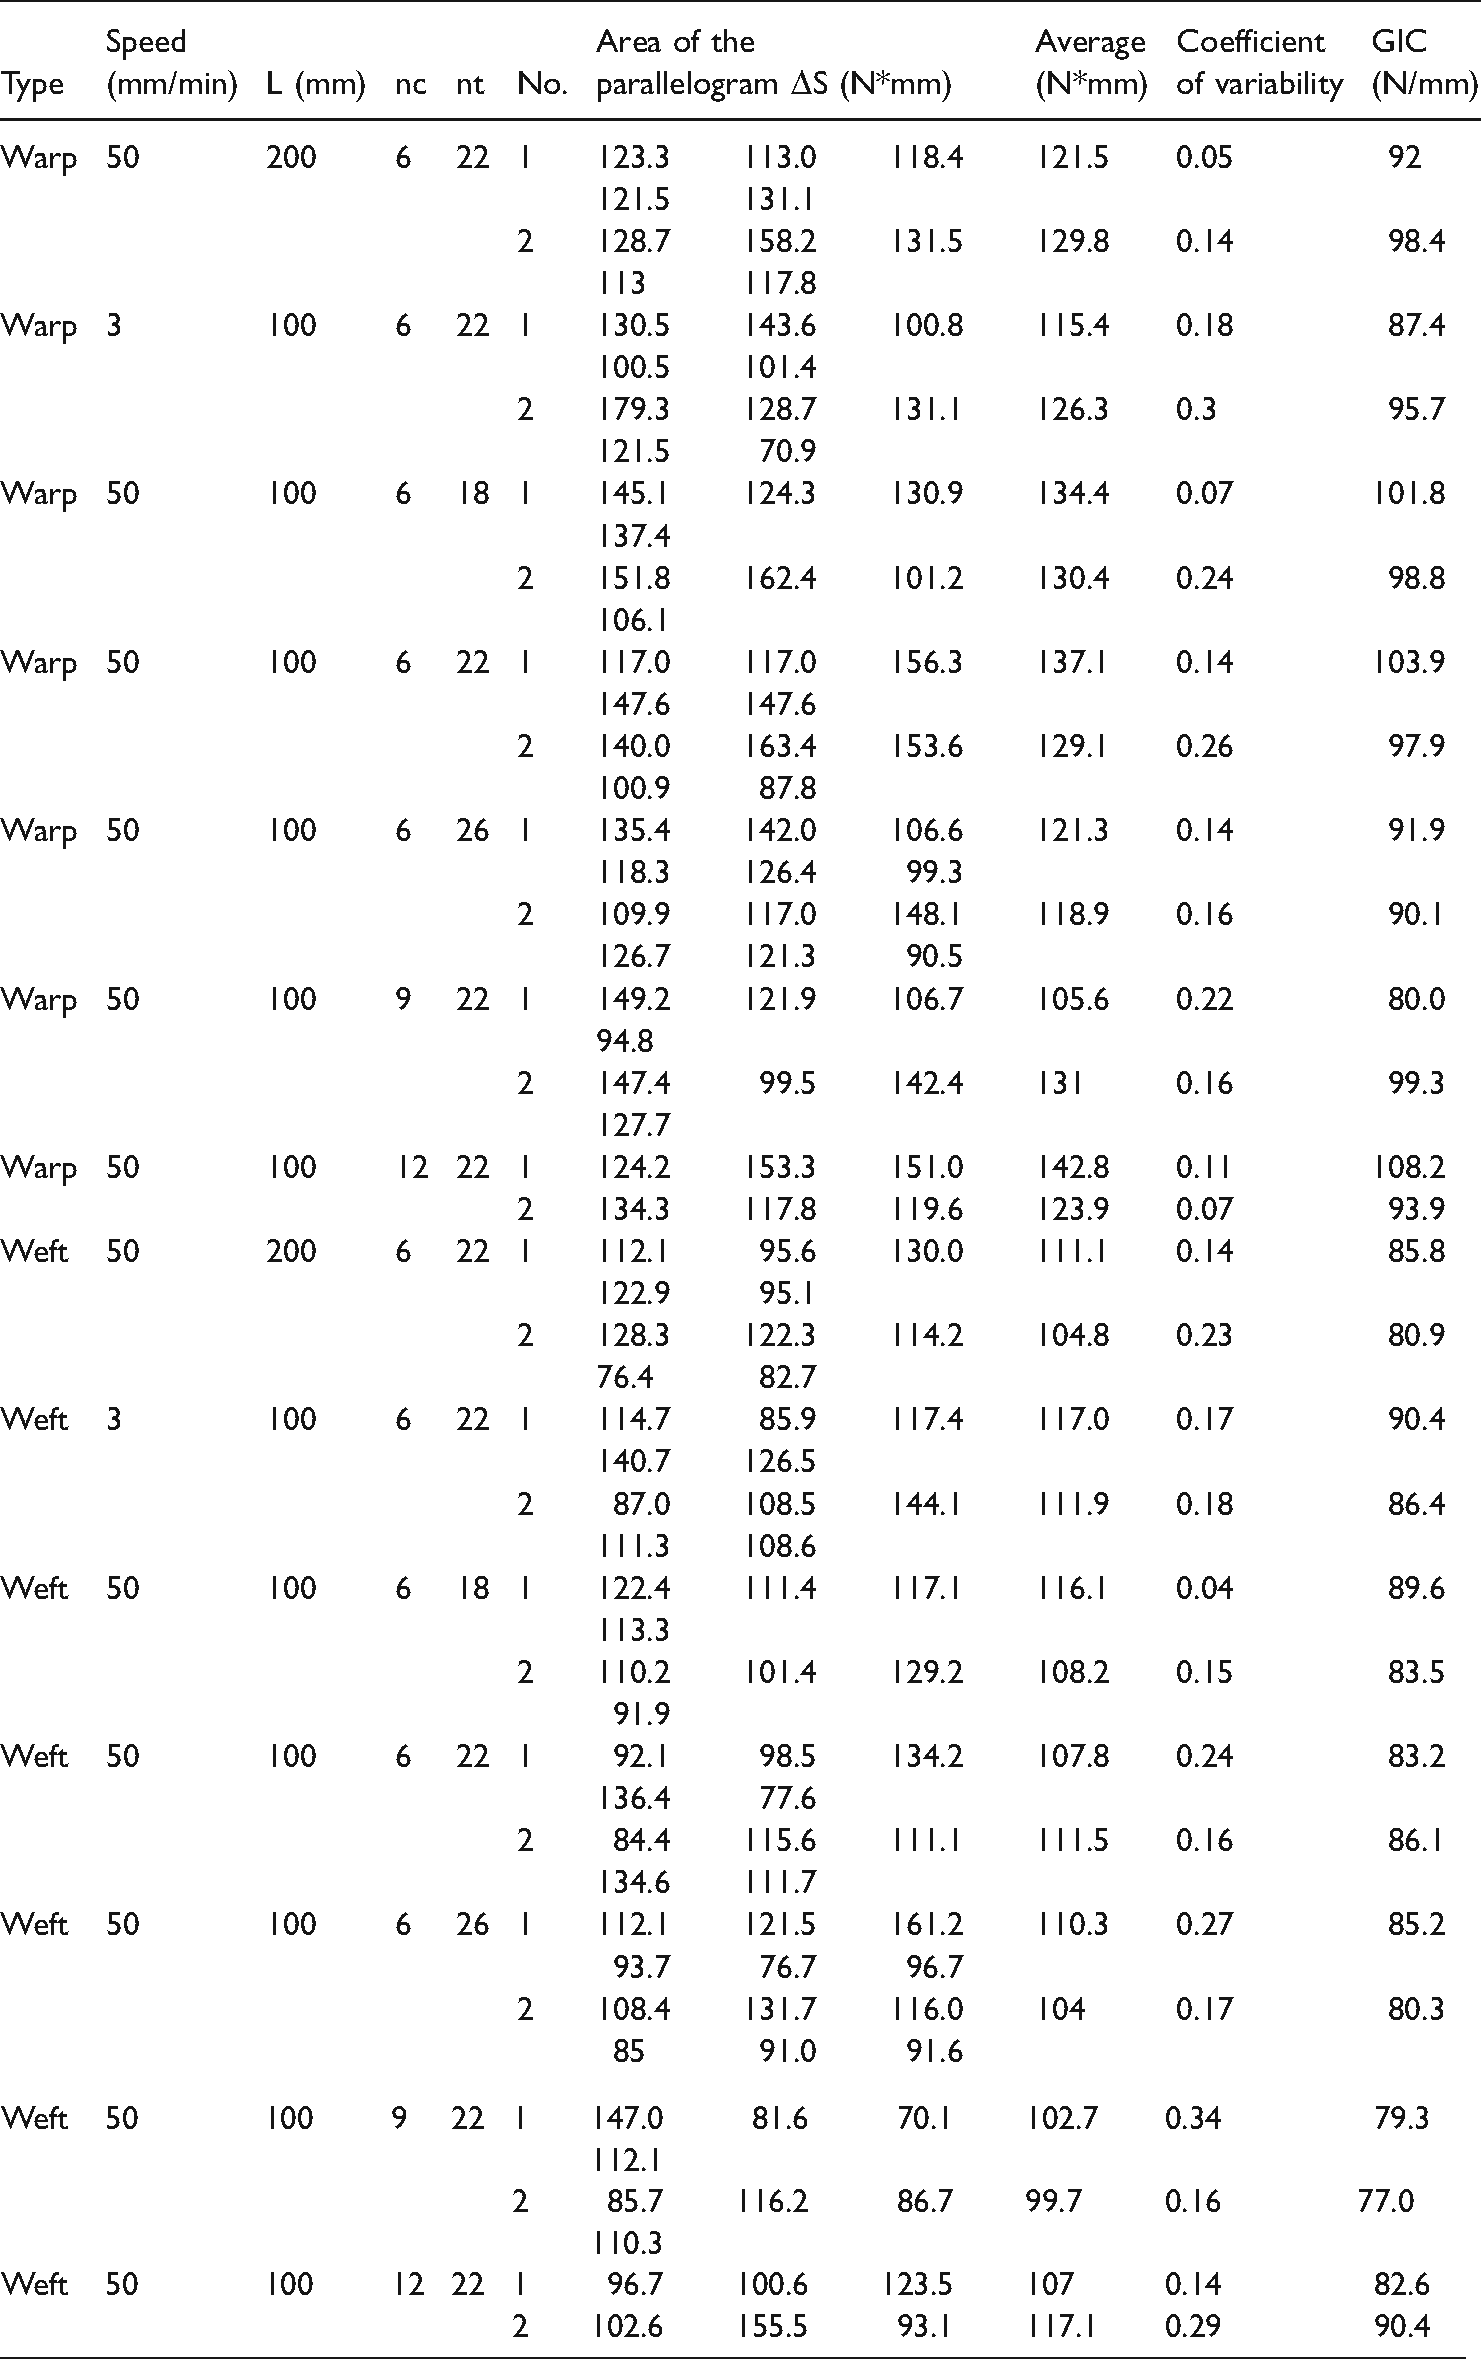
It can be seen from the load–displacement curve of the single-edge notched tearing test that the zigzag waves in the descending section remain stable at the beginning, which means the area of parallelogram also remains nearly constant (see Figure 14(a)). Then, as the crack continues to expand, when the number of remaining intact yarns is not sufficient to form a complete del-zone, the shape of zigzag waves begins to change, leading to a decline in the area of the parallelogram. These two stages can be defined as the stable and fading stages, respectively. In the fading stage, although there is little change in the unloading amount from point A to point B, the increase in the reloading capacity from point B to point C becomes increasingly smaller, resulting in a decrease in ΔS until the occurrence of overall damage. Therefore, in order to eliminate the influence of the fading stage, one-third of the intact yarn number across the crack section is taken as the standard, i.e., (nt−nc)/3, to determine the span of the stable stage. Finally, all the parallelogram areas are averaged and then divided by the yarn spacing and membrane thickness to obtain the fracture toughness GIC.
Based on the above method, single-edge notched tearing tests were conducted, in which the stability of GIC was investigated by changing the specimen gauge length L, tensile speed v, number of initial cutting-off yarns nc, and total number of yarns in the width direction nt. For the same reasons as in ‘Test method based on the area difference of load–displacement curves’ section, the gauge length of the specimen was set to 100 mm. The test results are shown in Table 8 and Figure 19. In Figure 19, the combination of variables and data points correspond one by one through a serial number. It can be concluded that the deformation and kinetic energy contained in the obtained GIC is relatively small, because the variables L and nt related to the deformation energy and v related to kinetic energy have no evident influence on GIC. More importantly, GIC does not change with the initial crack length represented by nc, which is a significant feature of the constant fracture parameter for the coated fabric. To summarize, the value of GIC obtained from the single-edge notched tearing tests is stable at approximately 95.7 and 84.3 N/mm in the warp and weft directions, respectively, and can be considered as a relatively good index to evaluate the tearing resistance of this membrane material.
Results of the parallelogram area of single-edge notched tearing tests.

Relationship between GIC obtained from the area of the parallelogram and the variables in single-edge notched tearing test.
Trapezoidal tearing test
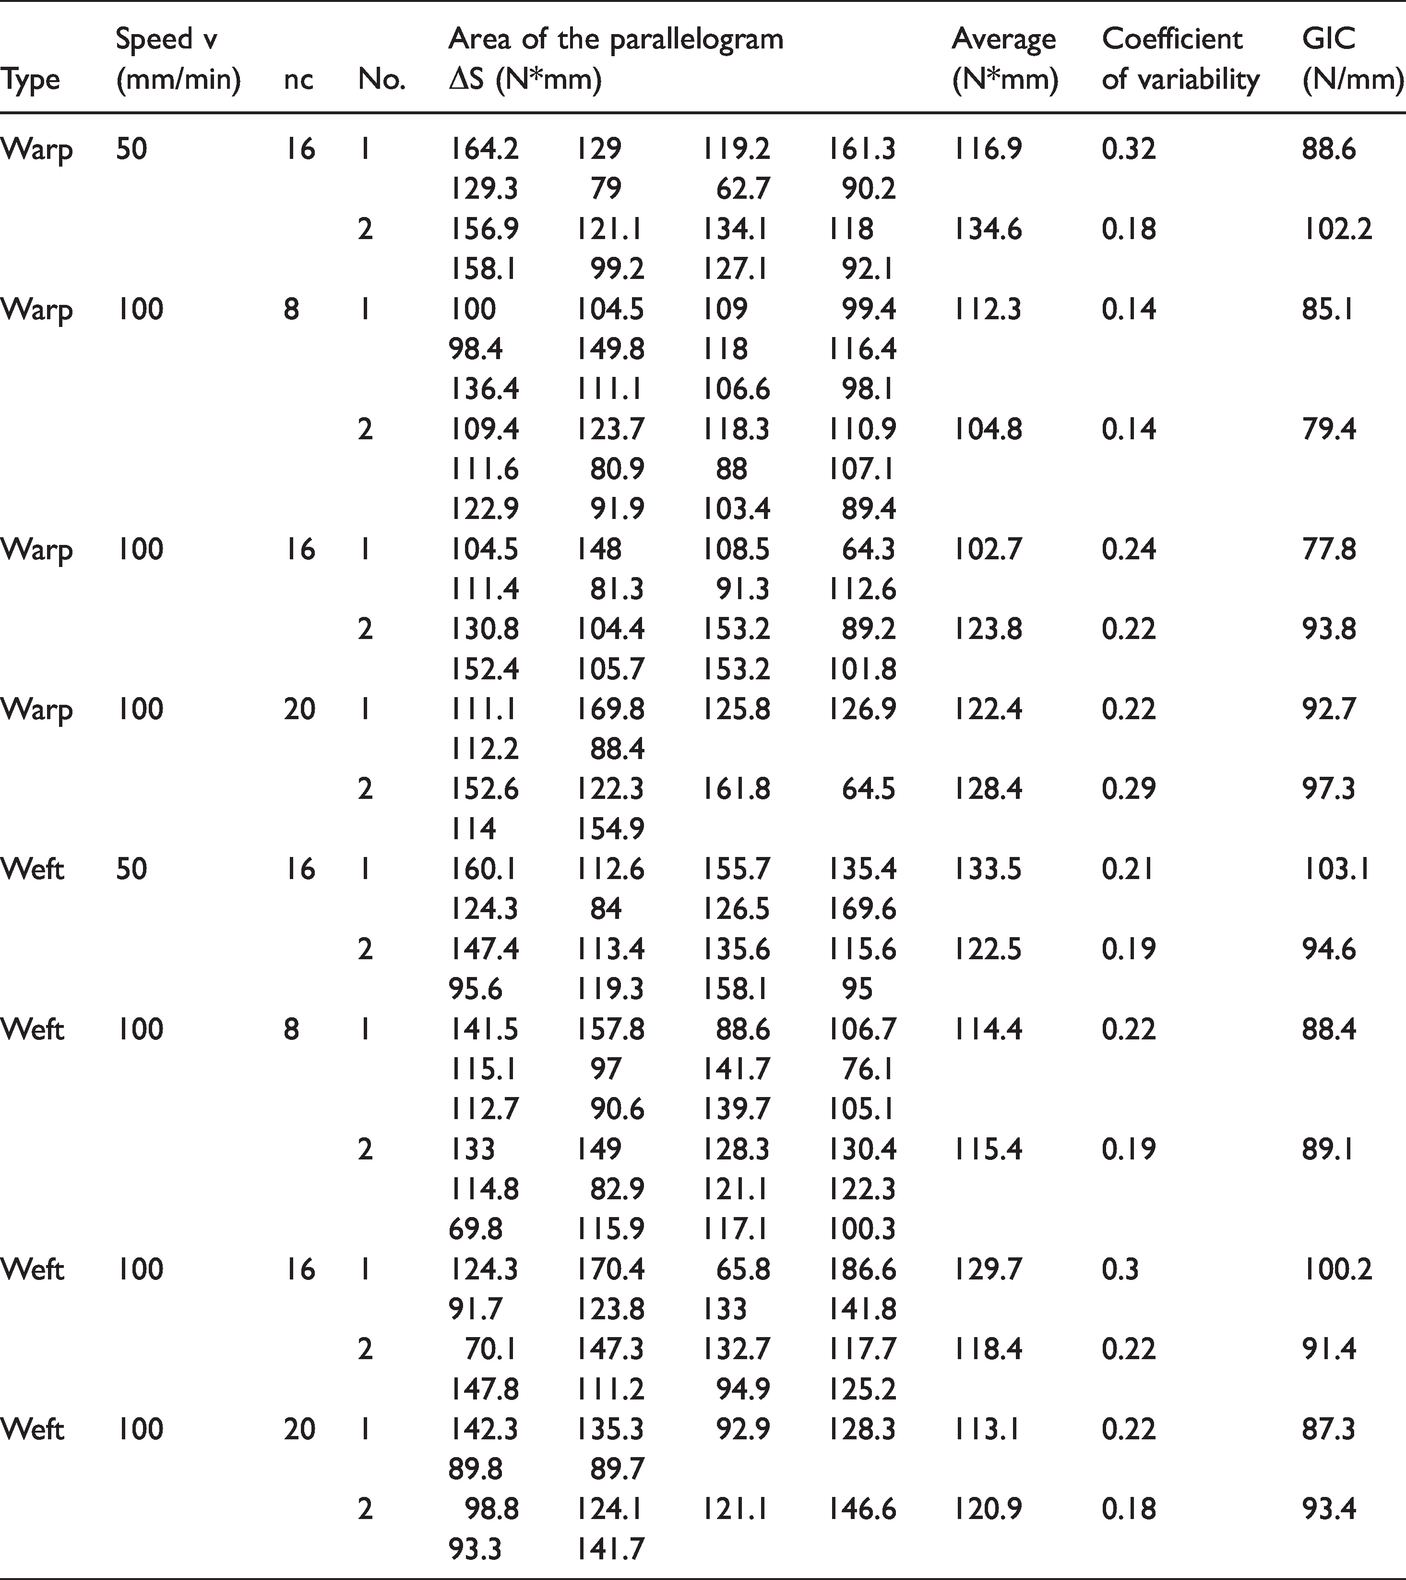
The trapezoidal tearing test is a process of stretching the specimen from the initial fold state to the near flat state. Correspondingly, at the beginning of the test, a process of shape adjustment and stress redistribution occurs in the specimen, resulting in some instability of the zigzag waves in the load–displacement curve (Figure 14(b)). This initial section is defined as the adjustment stage. Then, a stable stage occurs. For the same reason as explained in ‘Single-edge notched tearing test’ section, the shape of the curve can still be divided into the stable and fading stages until the specimen loses its bearing capacity. It is considered that the number of parallelograms in the stable stage is equal to the number of intact yarns crossing the crack section in the width direction divided by 2, i.e., (nt−nc)/2. The number of parallelograms in the adjustment and fading stages is half of that in the stable stage. Therefore, the GIC value can be calculated through the same process mentioned in ‘Single-edge notched tearing test’ section.
The results of the trapezoidal tearing test are listed in Table 9 and shown in Figure 20, in which the tension speed v and the number of initial cutting-off yarns nc are considered as variables. The total number of yarns nt in the width direction was 32 in both the warp and weft specimens. It can be concluded that v and nc have little influence on GIC. The values of GIC obtained from trapezoidal tearing warp and weft specimens are stable at approximately 86.4 and 93.4 N/mm, respectively.
Results of the areas of the parallelogram.

Relationship between GIC obtained from the area of the parallelogram and the variables in trapezoidal tearing test.
In conclusion, the fracture toughness GIC of the coated fabric obtained from the Minami theory is highly dependent on the approximation of the modulus, i.e., the elastic and shear modulus, owing to the assumption that the material is fully linearly elastic. Furthermore, calculating GIC via area difference is not recommended, because it is greatly influenced by the specimen configuration, resulting from the large amount of plastic deformation energy involved in the area difference.
For the test method of calculating GIC via the parallelogram area, the fracture toughness value obtained from warp specimens is slightly higher than that from weft ones in the single-edge notched tearing test. However, the GIC obtained from the warp and weft specimens is more similar in the trapezoidal tearing test. On the whole, although there are considerable differences between these two tearing tests in terms of the specimen preparation and test methods, the GIC values obtained are all concentrated around 90 N/mm. This phenomenon further reveals that the fracture toughness calculated based on the area of the parallelogram has high stability and weak correlation with external factors such as the specimen configuration and test method, and it mainly reflects the internal tearing properties of the fabric. Therefore, this test method is recommended and the resulting GIC value could be treated as a good approximation of the true value of fracture toughness used to evaluate the tearing resistance of this fabric. Owing to the simplicity of the specimen preparation and test process, the trapezoidal tearing test is more practical. Undoubtedly, the GIC value obtained by this test method is inevitably influenced by some other factors, such as deformation energy, kinetic energy, friction energy consumption between warp and weft yarns, and heat energy. However, as the area of parallelogram is relatively stable and is not be affected by specimen configuration, speed, test method, and other factors, it can be considered that the impurity energy mentioned above has little influence on the GIC value, and the aforementioned factors will be quantitatively analyzed in future research.
Considering the GIC value obtained from the parallelogram area of the trapezoidal tearing test shown in Figure 16, it can be found that when the elastic modulus values of the warp and weft specimens are set to E1 and E2, respectively, the GIC value calculated by the Minami formula is closest to the test results. Therefore, combining the fracture toughness obtained from the parallelogram area and the Minami theoretical model, the tearing strength corresponding to any initial crack length can be calculated directly, which provides a new practical method to consider the tearing resistance of fabrics in the design of membrane structures.
Conclusions
In this research, a type of PVC-coated polyester fiber fabric is studied through uniaxial in-plane tearing tests including uniaxial central, single-edge notched, and trapezoidal tearing tests. The specimen configuration and test methods that affect the tearing behavior of the fabric are studied. A theoretical method and two test methods for calculating the fracture toughness GIC of this membrane material are analyzed. The following conclusions can be drawn: The failure modes, i.e., brutal failure and progressive failure, are essentially related to the deformation energy stored in the specimen at the moment of tearing propagation and the number of initial intact yarns across the crack section. High deformation energy and fewer intact yarns tend to cause brutal failure. Although, compared with the uniaxial central tearing test, the single-edge notched tearing test has regular zigzag fluctuations in the descending section of the stress–displacement curve and a more evident warpage of the membrane surface near the crack, they are interchangeable prior to crack propagation. To simulate a nearly infinite membrane surface in an actual membrane structure with finite-size specimens, a reasonable tearing strength can be obtained only when the gauge length and width of the specimen are greater than the minimum limits. Specifically, when the gauge length is too short, it is increasingly difficult for the load at the crack to be transmitted to the crack tip through the shear action, resulting in a less clear stress concentration and more uniform strain field distribution. On the contrary, when the specimen is too narrow to form a full del-zone at the crack tip, the tearing strength and elongation at break of the specimen decrease. In addition, the size of the del-zone is not affected by the number of cutting-off yarns. To obtain the value of GIC, the test method based on the area of the parallelogram is superior to the test method based on the area difference of load–displacement curves and the theoretical formula based on the Minami model, because it is straightforward and has relatively stable test results that are not significantly affected by specimen configurations, test conditions, and test types. The test method based on the area difference proved to be complex and cumbersome and is greatly affected by the plastic deformation energy stored in the specimen. In the Minami model, the fabric is assumed to be a fully elastic material without considering its nonlinear characteristics, which results in errors and the problem of selecting appropriate constant modulus parameters.
In future research, it must be examined whether the test method for calculating GIC based on the area of a parallelogram is suitable for other membrane materials, including other types of PVC and PTFE. Methods of using the obtained GIC to compare the tearing resistance, predict the tearing strength of coated fabric, and guide the design of the membrane structure will also be investigated.
Footnotes
Declaration of conflicting interests
The author(s) declared no potential conflicts of interest with respect to the research, authorship, and/or publication of this article.
Funding
The author(s) disclosed receipt of the following financial support for the research, authorship, and/or publication of this article: This work was funded by the National Science Foundation of China through research project No. 51778458. The authors thank Zhejiang Huifeng New Materials Corp., Ltd for providing membrane materials.