
Abstract
This paper introduces a novel composite from discarded pulled wool fibers as a sustainable alternative to commercial particleboard and medium density fiberboard (MDF). The investigation aims at designing composites with prominent properties in terms of thermal insulation, water absorption, flexural strength, and dynamic properties. Composites specimens are synthesized from recycled pulled wool fibers at three different densities namely 500, 800, and 1000 kg/m3, with and without fabric skin (core-only and sandwich specimens). Thermal conductivity test shows that core-only specimens with the lowest density (500 kg/m3) has lower thermal conductivity than particleboard and MDF by 30% and 50%, respectively. The sandwich specimens demonstrate 30%, 40%, and 70% less water absorption than MDF and particleboard. The results reveal high potential of pulled wool fibers to produce economic composites with appropriate thermal and physical properties that can be utilized for green buildings envelops. Dynamic tests show that the proposed composites exhibit higher damping values (70% higher in case of core-only specimens) as compared to particleboard and MDF. A main contribution of this work is presenting novel sustainable composites with high damping capacities, which promote their use as light weight structure components in critical applications such as aerospace panels subjected to high dynamic loading conditions.
Introduction
In the past years, an increasing awareness of the negative impact of petroleum-based fiber reinforced polymer (FRP) composites on the environment has raised the urge to provide alternative industrial solutions that are more ecological friendly. 1 Although FRP composites are widely used in industrial applications 2 including automotive industry, aerospace, chemical plants, marine transportation, and wind turbines due to their high durability, excellent physical, and mechanical properties; however, polyester and epoxy composites reinforced with glass or carbon fibers are difficult to be recycled or discard in the surrounding environment as they are not biodegradable materials, which raise serious environmental hazards.3,4 Thus, many researchers considered replacing synthetic polymeric composites with green composites with natural fibers as reinforcements in industrial sectors.5,6
This ever-growing trend of using natural fibers in the fabrication of eco-composites is mainly due to their easy processing, sustainability, biodegradability, and low cost.7,8 Moreover, natural fibers have proven to show distinguished properties such as high specific strength, minimum solidity, and recyclability when compared to many synthetic fibers.9–11 On the other hand, variation in the mechanical properties may be expected due to possible alterations in fibers properties and fiber defects. 12 Proper selection of the suitable matrix material, beside quality control of fiber homogeneity, evenness, and soundness are factors that improve the resulting structure and properties the composite material.
Natural fibers are broadly classified according to their sources into plant-based, mineral-based, and animal-based fibers. A review of natural fibers identified the types of plant fibers as bast fibers (such as flax and jute), leaf fibers (such as abaca and sisal), seed fibers (such as coir, cotton, and kapok), straw fibers (such as corn, rice, and wheat), grass fibers, and wood fibers. 13
Reinforced polymers with longer-natural cellulose fibers, like flax, hemp, and sisal are used in fabrication of high stiffness light weight structure components of automotive industry, which seeks the production of low polluting and fuel-efficient vehicles. 14 Also, plant fibers enabled the development of polymer composite panels of acceptable physical and thermal properties for green buildings and constructions. 15 Combined with biodegradable resins, vegetal fibers provide lightweight green composites of high mechanical properties that can be degraded into the soil after it serves its intended lifetime. They present a sustainable solution for economic products such as olive tree leaves and low-density polyethylene, which increases the flexural modulus by 200%. 16 On the same track, investigations compared different Mediterranean lignocellulosic fibers from the residues of olive trees, lemons, loquats, and palms for more economic and sustainable bioproducts in packaging, furniture, and insulation industries. 17 Recent efforts utilized other sustainable composites from lignocellulosic grape fiber waste with polyethylene matrix. 18
However, plant fibers properties are strongly influenced by many factors such as the cultivated land, type of processing and treatment, and their application to composites. Besides, random or individual selection of fiber type, size, and shape will lead in many cases to a degree of uncertainty regarding the target properties to be obtained. 19 This issue was addressed in 20 by developing a hierarchy model using Analytical Hierarchy Process (AHP) that support the design of the optimum bioproduct. With the aid of this decision-making model, a systematic selection of best bio-ingredients is achieved using weight and mechanical properties criteria to develop utilized economic green composites for more sustainable societies.
Animal fibers represent another valuable natural resource for bio-composite reinforcements such as silk and wool. A recent investigation showed that silk obtained from several insects such as dragline silk fiber are found to have higher tensile strength, good ductility, and resistance to chemicals than jute plant fibers. 21 However, their high cost and limited availability places a large burden to their application in industry. Wool fibers, on the other hand, are obtained from sheep, goats, camels, and rabbits. They have excellent heat retention, low modulus, high elongation, and other properties that make them preferable for various applications. 22 Simple hot pressed sheep wool without using binders recently proved to have better sound absorption characteristic as that of mineral wool, which is one of the most widely used sound‐absorbing fibrous materials. 23 Besides, excellent acoustic sandwich panels based on sheep wool revealed high thermal insulation properties with reasonable mechanical strength. 24 Composite panels based on sheep wool provides equivalent thermal insulation characteristics with traditional materials, and even better in specific applications. 25
One drawback that limits the commercialization of wool fibers in industry is their high cost. Exploiting wool fibers waste is recently introduced by researchers to replace the virgin wool fibers due to its economic and environmental advantages. It is increasingly used to fabricate green composites for green building materials for their outstanding sound absorption. 26 Guna et al. 27 conducted a comparative study between bio-composites from wool fiber waste and commercial gypsum board for green building. Not only wool—polypropylene (wool—pp) composites displayed higher noise reduction coefficient of 0.86 at interesting frequency range but also they showed four times lower amount of water absorption. The thermal conductivity of the wool-PP composites was found meeting the standards for insulating materials and showed comparable results of 0.058 to 0.083 W/m.K. Furthermore, the composites demonstrated good thermal stability up to 250°C losing only about 1% of their weight.
Another attempt was made by Rubino et al. 28 to recycle composites from 100% wool waste fibers and bound by means of either a chitosan solution or a gum solution. The resulting structure showed thermal conductivity ranging between 0.049 and 0.060 W/(m.K), which is comparable to commonly used building materials. Acoustic absorption coefficient values were found more than 0.5 at frequency ranges higher than 500 Hz.
Although pulled wool fibers waste is a biproduct during tanning processes in many countries with extremely large quantities, its potential application in industry as products has not been considered yet. Moreover, exploiting pulled wool fibers is even more challengeable as the fiber’s length is too short to be re-used in textile processes. Inappropriate disposable for such waste leads to serious environmental problems. To the best of the authors knowledge, no research efforts focused on utilizing pulled wool fibers in terms of densities, size, and additives to obtain bio-composite products for structure applications. The literature lacks sufficient investigation regarding important dynamic properties such as damping capacities of waste wool composites, which supports critical application subjected to impacts and high dynamic loading conditions. 29 This paper introduces the manufacturing and characterization of novel composite material from Egyptian pulled wool fibers waste as a sustainable alternative to commercial particleboard and medium density fiberboard MDF. In this work, the pulled wool waste is collected from local leather tanneries in Alexandria, Egypt. Then, composites specimens are developed from recycled pulled wool fibers with three different densities namely 500, 800, and 1000 kg/m3, with and without fabric skin (core-only and sandwich specimens). Thermal conductivity test, water absorption and dimensional stability test, 4-point bending test, and experimental model analysis are conducted to test specimens from the developed composites along with commercial particleboard, medium density fiberboard MDF. For highlighting the potential of the developed composite material, the results are discussed and compared to other bio-composites and commercial polymeric materials in literature.
Materials and methods
The pulled wool waste is first collected from local leather tanneries in Alexandria, Egypt, then, pre-processed in a woolen spinning system for mechanical opening and cleaning to get rid of large contaminants, dusts, and trashes stuck on the raw wool fibers. The processed fibers are then cut into even size to facilitates the processing of the fibers into layers on the cotton carding machine.
Description of the proposed composite specimens and the type of applied testing.

The mass of each specimen is determined depending on the density and the dimensions of the mold used in containing the wool fibers and UF resin. The mold size is 350 × 250 mm2 and the target thickness of the specimens after hot pressing is 10 mm. The resulting masses of the three specimens are 437 gm, 700 gm, and 875 gm. These masses consist of the mass of pulled wool fibers and UF with a ratio of 70: 30%, respectively.
The used industrial Urea Formaldehyde resin contains 60% solid contents. This is taken into consideration while calculating the mass of the UF resin. The amount of the prepared UF resin contains 10% of a hardener and the mixture was well stirred. A spray gun driven by highly compressed air is used to apply the UF resin to the pulled wool fibers, while the pulled wool fibers were manually opened to guarantee the efficient resin coherency within the wool fibers. During laying-up step, fibers are carefully interlaced to enhance delamination resistance between layers when specimens are exposed to stresses during the mechanical testing. The fiber mats are placed in a wooden mold with the pre-mentioned dimensions and the mold is be placed on hot press plate. Two Teflon sheets of 0.5 mm thickness are placed on both sides of the molded fiber mats to prevent the fibers from being in direct contact with the hot press plates, as shown in Figure 1(a). Then, the mold is compressed to the targeted thickness (10 mm) by the hot press (Figure 1(b)) at a temperature of 180oC for a duration of 10 min. The pressure acting on all test specimens is around 10 bar. An example of core-only specimens consisting of pulled wool fibers wastes is shown in Figure 2(a). (a) wool fibers layers between Teflon Sheets before pressing, (b) hot Pressing Machine. (a) An example of core-only specimen, (b) applying the polyester resin to the specimen, (c) sandwich specimen (with fabric skin).

The second category of specimens is obtained by further processing of the hot-pressed specimens through adding 100 gm of polyester resin with a 1.5–2% hardener to both surface layers of the specimens, as shown in Figure 2(b). Then, the two surfaces of the core are then covered with layers of skin fabric forming a sandwich composite. Wool fiber length is 40 mm while the used skin fabrics construction specifications are Weave design: Twill 3/1 and 1/3 CHICKS, Ends/cm: 9.2, Picks/cm: 9.6, Warp count (Tex): 58, Weft count (Tex): 410, and Areal density (g/m2): 400. Dead weights are placed on the specimens in the room temperature for a week to assure that the polyester resin has been completely cured. Figure 2(c) shows an example of the obtained sandwich specimens.
Characterization of the proposed composite specimens
Thermal conductivity
Thermal conductivity test is conducted on both categories of specimens, that is, core-only and sandwich specimens, using Lasercomp thermal conductivity device according to ASTM C518. 30 The thermal conductivity k is calculated for test specimens of 150 × 150 mm2, and thickness of 10 mm for the core-only specimens and 15 mm for the sandwich specimens. The specimens are placed between two plates, one of them is a flat electrical heating plate and the other one is flat electrical cooling plate.
The test takes six to eight hours until it reaches the steady state condition for measurement. Through the time of testing, the software records the temperature of the hot plate, the temperature of the cooled plate, and the heat flux through the samples. At steady state condition, the thermal conductivity k of the specimens is calculated based on the equation (1)
Water absorption and dimensional stability
Water absorption and dimensional stability tests is conducted on five samples from each test specimen to study their ability to absorb water and how their dimensions are to be changed. Water absorption (WA), and Thickness swelling (TS) of the bio-composite specimens are determined according to the standards ISO 9427:2003, 31 ISO 16979:2003, 32 BS EN 317:1993, 33 and ASTM D1037 (2006). 34
All test samples are cut off into dimensions of 30 × 30 mm2, weighed, and measured to determine the initial mass and thickness. The samples are immersed in water at room temperature of 20°C ±1 for 72 h before being weighed and measured again at three different time increments: 2 h, 24 h, and 72 h. Water absorption % and thickness swelling % are calculated for each sample at each time increment with respect to original mass and thickness values where W1 is the dry mass of the sample, W2 the wet mass of the sample, T1 is the dry thickness of the sample, and T2 is the wet thickness of the sample.
Bending test
A four-point bending test setup is used for conducting the flexural strength test of the specimens using Mecmesin testing machine model (Multitest 5-xt 5 kN) according to ASTM D790,
35
as shown in Figure 3. The span-to-thickness ratio is 16:1 and specimen’s width-to-thickness ratio was 4:1. The loading span is half the support span to guarantee an equal stress distribution to be applied along the specimen span. Four-Point bending test device.
Test samples are cut off from the specimens to dimensions 200 mm length x 40 mm width, and 10 mm thickness. The sandwich specimen samples are cut-off in the warp direction, because the ends in warp direction can stand higher stresses than threads in weft direction. For each specimen, five samples are tested, and the maximum breaking force is recorded for each sample. Equation (2) is applied to get the average value of the flexural stress σ
Experimental modal analysis
Modal testing technique in the form of impact excitation is used according to ISO 7626-5:2019 36 to evaluate the dynamic characteristics of the test specimens in terms of eigen frequencies (fn), damping ratios (ξ), and frequency response function (FRF) amplitudes. The main purpose of this test is to evaluate the behavior of the fabricated specimens under dynamic loading conditions.
The modal test setup of the composite specimens is shown in Figure 4. An impact excitation hammer (B&K type 8200) is used to generate moderate impacts up to 5 kN for 0.2 ms long in the test specimen. The impulse force signal is measured using a force transducer built into the impact hammer. The corresponding response is measured using a uniaxial piezoelectric accelerometer (PE) type B&K 3404 attached by wax to the lower surface of the tested specimen.
37
The accelerometer measures vibrations in a range from 0.01 to 10000 m/s2. A four-channel signal analyzer (B&K Type 3022) connected with Acquisition Front-End (B&K Type 2825) is used for force and response signals acquisition and processing. Experimental modal analysis of sandwich specimens (with fabric skin).
The test procedure starts by hanging the tested specimen from a rigid support using elastic rubber bands. Four repeated light impacts are implied to the upper surface of the specimen using an impact hammer. The vibration response to each impact is measured using an attached accelerometer. The weight of the accelerometer is selected to be less than 10% of the specimen weight. The location of the measurement, excitation, and fixation points was the same for all tested specimens.
The vibration modes of the rigid support were ignored, and only the first flexible vibration mode of the specimen is considered for analysis. The impact force and the measured vibration response are conducted and measured in the lateral direction of the test specimens. This is essential to obtain the bending modes of the composite material. Both impulse and response signals are processed using the signal analyzer equipped with acquisition front-end. The analyzer calculates the arithmetic average of the results of four impacts to obtain the frequency response function (FRF) plots. Transient and exponential windowing functions are selected for excitation and response signals, respectively. Only resonant modes with almost unity coherence values were considered for the analysis.
The excitation and response signals are recorded in both time waveform (Time domain) and auto spectrum (Frequency domain), as shown in Figure 4. The frequency range of interest for all tested specimens was found to be within 0–900 Hz. Modal parameters (natural frequency, damping ratio, and FRF magnitude) are extracted from the first mode of vibration (Mode of concern) for each specimen. A special consideration is given to the modal damping as it plays an increasingly important role in improving the dynamic response of structure while reducing airborne noise.
Results and discussion
Thermal conductivity
The bar chart in Figure 5 presents the thermal conductivity k results of the specimens from the tested specimen groups, commercial particleboard, and MDF wood specimens. Thermal conductivity values of the test specimens are compared to those from similar wool waste composites from literature.27,38,39 It can be observed that the test specimens within each specimen group show an increase in the values of thermal conductivity with the increase of density, for example, specimen C shows higher thermal conductivity by 22% as compared to specimen A. This is due to the fact that thermal insulation depends mainly on the density of materials, that is, the lower the density of the material is, the higher the thermal insulation will be. Thermal conductivity (k) values of the test specimens.
Specimens D, E, and F demonstrate higher thermal conductivity as compared to specimens A, B, and C. For example, specimen F has 27% higher thermal conductivity than specimen C. The addition of fabric skin by adhesion it to the surface layer leads to a corresponding increase in the density of the material and hence raises the thermal conductivity as compared to core-only specimens.
In comparison with particleboard and MDF, core-only specimens show better thermal insulation behavior. For example, specimen A has lower thermal conductivity by 33% and 50% than particleboard and MDF, respectively. These differences decrease in case of specimens B and C, which possess higher densities. The results obtained for core-only specimens demonstrate similar thermal conductivity values to wool specimens (80% wool - 20% polypropylene) and (85% wool - 15% polypropylene), 27 and lower by 50% than cork–gypsum 38 and Flax–polypropylene material in Ref. 39. In accordance, the thermal conductivity k values of the test specimens are compared with that from commercial polystyrene foam of a density equals 32 kg/m3 and a thermal conductivity of 0.037 (W/m.K), which is commonly used in building envelops. For example, Specimen A has a higher k value by 50% when compared to polystyrene foam. Although all test specimens show higher thermal conductivity values in comparison with polystyrene foam, their values are still higher than that of other construction materials such as brick (4.81 W/(m.K)), 40 gypsum board (0.21 W/(m.K)), 41 and concrete board (0.35 W/(m.K)). 41 Also, they possess higher densities that reflects positively on other physical and mechanical properties, which are described in the next sections.
Water absorption and dimensional stability
Water absorption
Figure 6 shows the results of water absorption percentage for the test specimens at three different time increments, that is, after 2 h, 24 h and 72 h. Five samples of each specimen are tested, and the average water absorption % and the standard deviation for each test specimen is recorded. In case of core-only composites, it is observed that specimens A and B demonstrate higher water absorption by around 40% when compared to specimen C. This is due to the low densities they possess in comparison. Sandwich specimens D, E, and F show the lowest water absorption percentages when compared to core-only specimens. This is attributed to presence of both the fabric skin on the specimen surface and the subsurface solidified polyester resin, which largely reduces the water absorption by the wool fibers in the core material. For example, specimen D shows lower water absorption than specimen A by around 65%, 63%, and 60% at 2 h, 24 h, and 72 h, respectively. Water absorption % of test specimens from proposed composites, particleboard, and MDF over the test time.
Particleboard specimens and MDF specimens stand in middle between the core-only specimens and the sandwich specimens showing a moderate water absorption percentage. After 2 h immersion in water, MDF specimens demonstrates 26%, 39%, and 69% higher water absorption than the sandwich specimens D, E, and F, respectively. In case of particleboard, these percentages reach 32%, 43%, and 71%, respectively.
In comparison with similar work from literature, it is observed that specimen D have similar values of water absorption to Gypsum board in Ref. 27 after 24 h. The results in Ref. 27 are from specimens of wool-polypropylene which are more hydrophobic due to the presence of polypropylene and therefore they show much lower water absorption values and similar to specimen F in the current work and also the results of Flax–polypropylene in Ref. 39.
Thickness swelling
Figure 7 illustrates the rate of increase in thickness swelling for the test specimens over the time they are submerged in the water, that is, after 2 h, 24 h and 72 h. Five samples of each specimen are tested, and the average thickness swelling % and the standard deviation for each test specimen is recorded. In case of core-only specimens, thickness swelling percentage decreases with the increase of the specimen density. The increase in specimen density significantly reduces the gaps between fibers to absorb water during submerging experiment. For example, specimen C has less thickness swelling than specimens A and B by 44% and 40% after 2 h and by 41% and 25% after 24 h, respectively. Thickness swelling % of test specimens from proposed composites, particleboard, and MDF over the test time.
When compared to core-only specimens, the presence of fabric skin surface layer and the polyester resin in the sandwich specimens prohibits to a larger extent the water from being absorbed. The core-only specimen C and the sandwich specimen F are both having the same material density (1000 kg/m3); however, specimen F has a significantly lower thickness swelling by around 60% than specimen C after 2 h, 24 h, and 48 h. These percentages are higher in case of comparing specimen A and specimen D, which are having the same densities.
Particleboard and MDF have similar values of thickness swelling percentages (between 20% and 40%) at the tested time increments. In comparison, specimens E and F exhibit thickness swelling lower than commercial particleboard and MDF by 59%, 47%, and 47% after 2 h, 24 h, and 48 h, respectively. The obtained results of water absorption and thickness swelling indicates a high potential of the sandwich specimens to be exploited in the outdoors applications exposed to humid environments as a compared to commercial particleboard and MDF.
Bending test results
The results of the bending test for the test specimens, particleboard, and MDF are shown in Figure 8. All specimens have a span length of 160 mm, and a width of 20 mm. Five samples of each specimen are tested, and the average flexural strength and the standard deviation for each test specimen is recorded. It is evident from the results that sandwich specimens possess higher flexural bending strength than core-only specimens. Furthermore, specimens F shows similar flexural strength to MDF and higher by more than 60% than particleboard results. Flexural stress values of test specimens from proposed composites, particleboard, and MDF over the test time.
This is justified by the fact that the sandwich structure specimens behave as I-beam structures, in which the skin fabric layers act as the I-beam flanges during bending and carry the compression and tension loads, whereas the core acts as a web in the I-beam and carries the shear stress; thus, flexural strength of sandwich specimens is found higher than core-only specimens. It is worth noting that all bending specimens test have been cut and tested in the weft direction, which is the main yarn in the fabric. Specimen C demonstrates similar bending strength as particleboard as it has higher density than specimens A and B, that is, it has higher volume of fibers that increases the internal friction forces between fibers. Another factor that contributes to the enhanced flexural strength is the scales on the wool fiber’s surface, which improves the coherence between fibers. This indicates the potential of sandwich specimens to replace particleboard and MDF in applications where the panels are subjected to high bending stresses.
In comparison with results from literature work, sandwich specimens possess higher flexural strength by 43%, 64%, and 74% than gypsum board flexural strength, 27 which is only 7.16 MPa and is comparable to core-only specimens results. Furthermore, specimens A and B are similar to cork–gypsum 38 with values of 1.8 MPa.
It worth mentioning that the required values of flexure stress or modulus of rupture standardized by American National Standard A 208.1 (ANSI) for high-density exterior industrial-grade particleboards (above 0.8 g/cm3) are 23.5 MPa while the required values according to EN312:2010 42 for heavy-duty load-bearing boards for use in dry conditions are 20 MPa. These values have obviously been exceeded by the current proposed structures, especially the sandwich specimens.
Experimental modal analysis results
Figure 9 shows an example of modal testing results for specimen C in the form of vibrational response in time domain and in frequency domain, impulse force in time domain and in frequency domain, and frequency response function (FRF). The frequency range of interest for the test specimens, particleboard, and MDF is found to be between 0–900 Hz, where the fundamental modes of vibration falls. The first fundamental resonant mode is considered for discussion and analysis and the damping ratio (ξ) is calculated to determine the damping capacity of each specimen. An example of experimental modal analysis results of specimen C (core-only specimen) (a) time waveform and spectrum of response signal, (b) time waveform and spectrum of force signal, and (c) Frequency response function.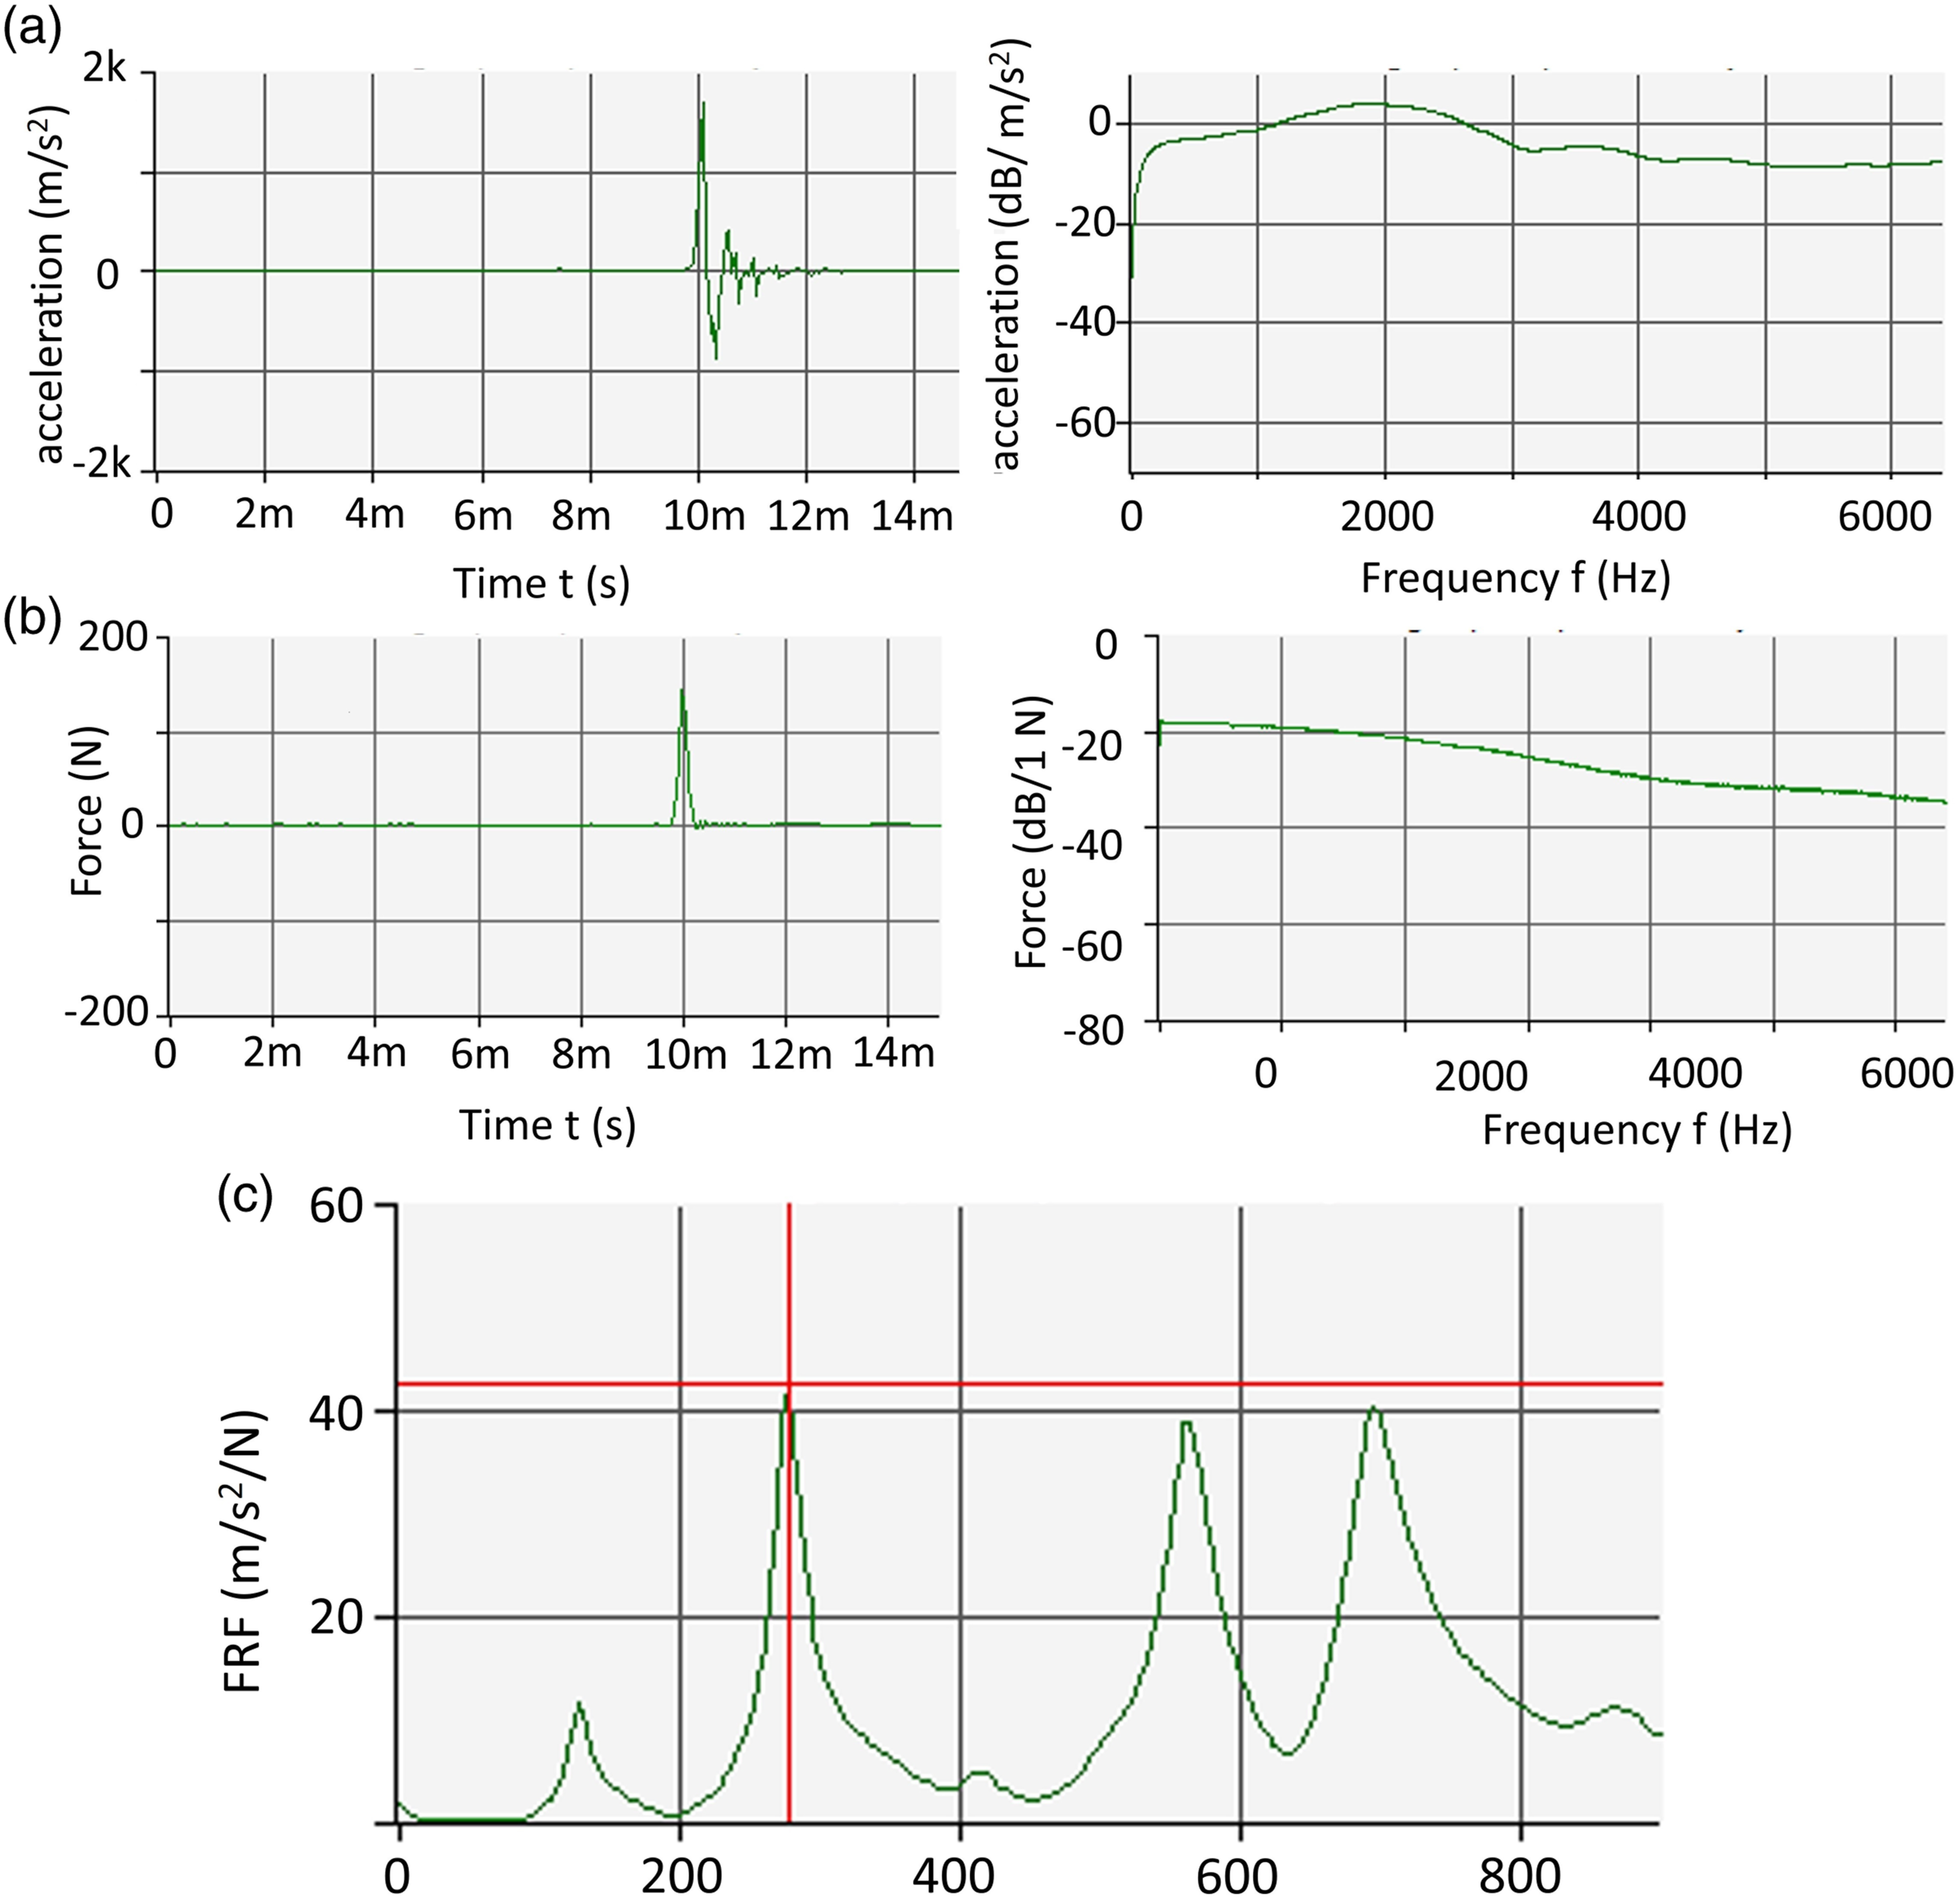
Figure 10 illustrates the natural frequency results of the first fundamental mode for the test specimens from core-only specimens, sandwich specimens, commercial particleboard, and MDF. It is evident from the bar chart that the core-only specimens have similar natural frequency values as particleboard material, which makes them suitable to function under the same dynamic loading conditions. The differences in natural frequencies between specimens in each group can be attributed to the density factor. The increase in coherence between fibers and the increase of the amount of Urea Formaldehyde in the manufactured specimen leads to increasing the stiffness of the specimens and hence the natural frequency values. Similarly, sandwich specimens have higher natural frequencies than core-only specimens. This is because the effect of attaching stiff skin to the surface of the specimen with the aid of polyester resin. They also have similar natural frequency values as MDF material, which makes them a good alternative for the same application. Natural frequencies (fn) values of test specimens, particleboard, and MDF.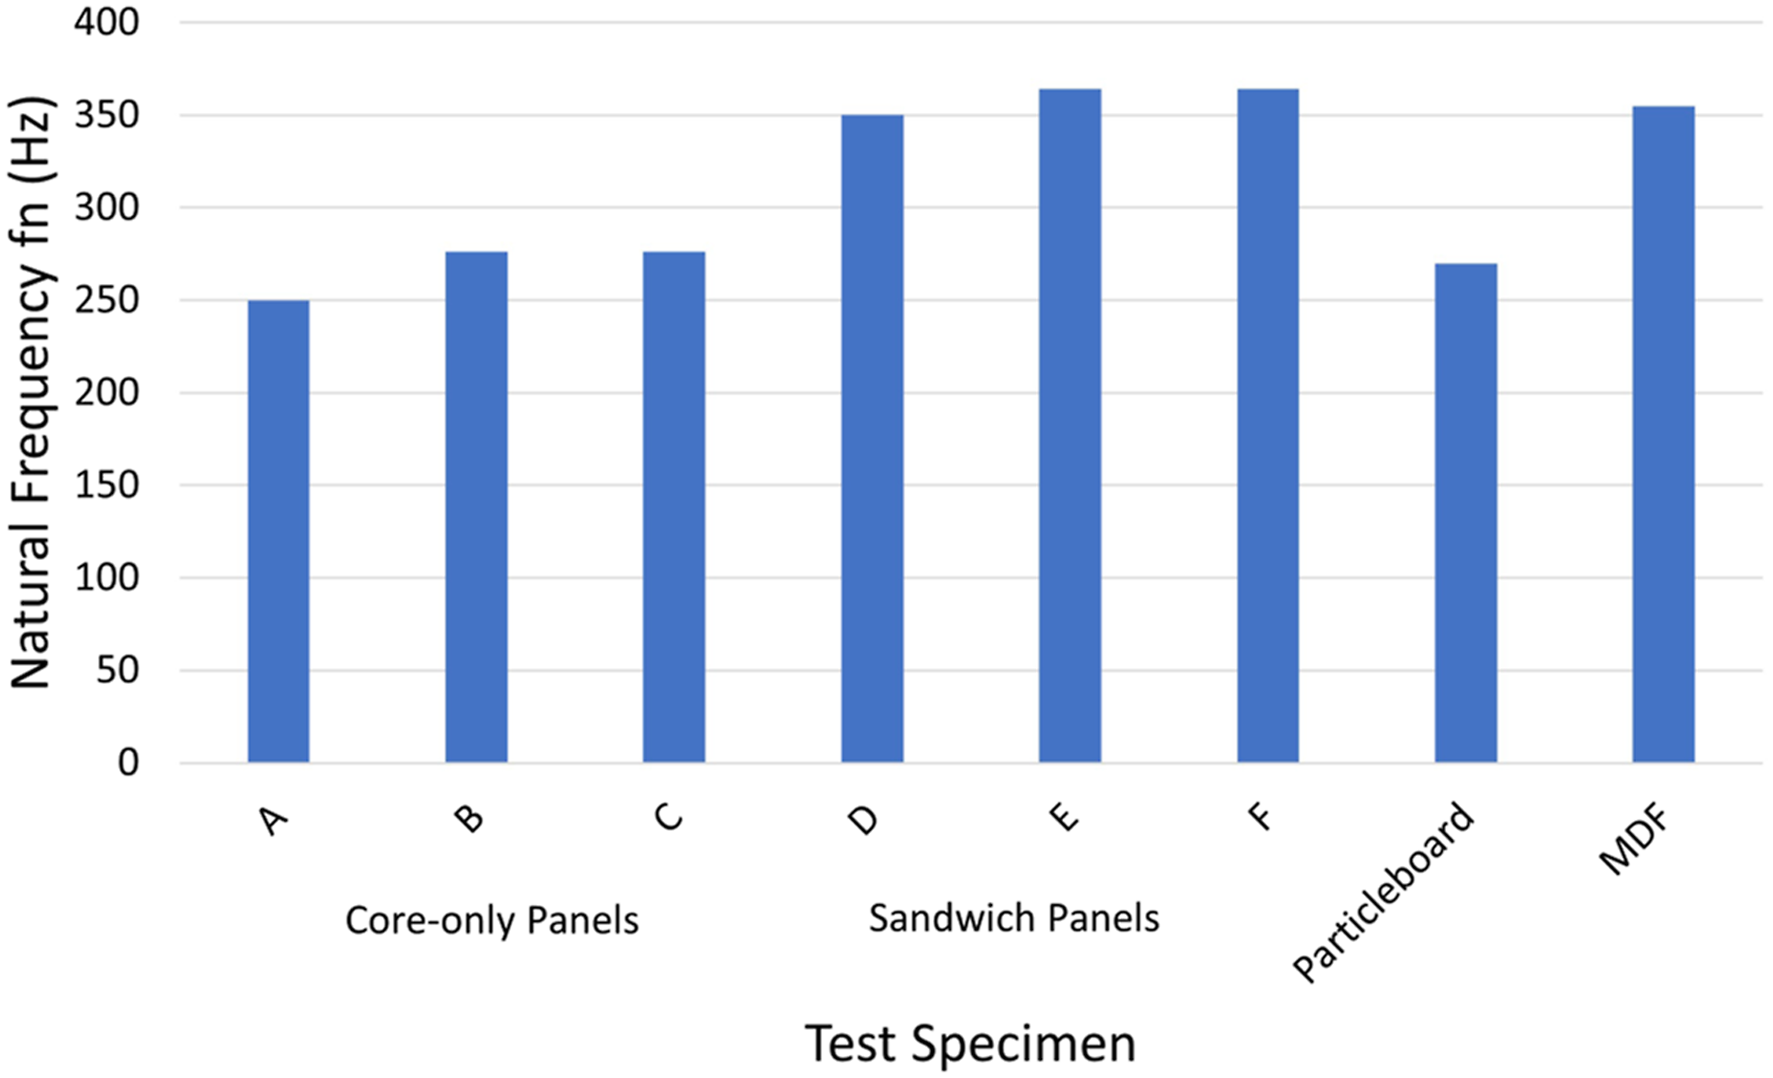
Figure 11 shows the results of damping capacity of the test specimens, particleboard, and MDF. In general, the values of damping ratio of test specimens are found decreasing with the increase of density. Material damping in viscoelastic materials describes best the loss modulus of a material under relatively small oscillatory stress. In other words, it measures the ability of a material to dissipate energy when a stress wave in the linear viscoelastic region of a material is induced and transferred within the specimen material. Since the density generally indicates more improved bonding between fibers and less air gaps, it implies a better fiber–matrix structure and a lower energy loss during a material response to impact excitation. From the results, core-only specimens confirm to be excellent candidates as vibration and noise dampers in building constructions and automotive industry. In comparison, they possess higher damping ratios by around 75% than that of MDF and particleboard materials. Furthermore, sandwich specimens show lower damping ratios than core-only specimens due to the presence of stiff surface skins with high densities. Damping ratio (ξ) values of the dynamic test specimens.
Conclusions
A recent worldwide trend is moving toward the development of eco-friendly building and automotive designs using green composites from natural fibers waste. This work introduces a novel composite material using discarded pulled wool fibers waste from local leather tanneries as an economic and environmentally friendly alternative to commercial particleboard and MDF. Two types of specimen groups, namely, core-only and sandwich specimens at three different densities were developed by blending them in hot pressed molds with Industrial Urea Formaldehyde resin (UF) as a matrix. The test specimens from the developed composites were characterized in this work to obtain their thermal insulation, water absorption and dimensional stability, flexural strength, and dynamic properties.
Thermal conductivity test revealed superior thermal insulation behavior of core-only specimens by 30 to 50% compared to commercial particleboard, MDF, and cork–gypsum. When compared to other materials in literature, all test specimens showed significantly lower thermal conductivity than construction materials such brick (4.81 W/(m.K)), gypsum board (0.21 W/(m.K)), and concrete board (0.35 W/(m.K)). On the other hand, sandwich specimens show the lowest water absorption behavior in comparison with gypsum board, MDF, and particleboard. For example, MDF experiences 70% higher water absorption than sandwich specimen F, after 2 hours immersion in water. Thermal and physical properties of both core-only and sandwich composites in this work promotes them to be used as construction materials in thermal insulation and water absorption resistance for green building envelops.
Core-only specimens A and B possess low flexural strength of around 1.8 MPa, which is comparable to commercial building materials such as cork–gypsum. With the increase of density (specimen C), flexural strength increases to be comparable to particleboard. Sandwich specimens with high densities (specimen F) show similar flexural strength to MDF but higher than that of particleboard and gypsum board by 60% and 74%, respectively. This promotes them as competitive materials to replace wood-based composites in construction applications. Of a considerable interest, all composite specimens exhibit higher damping capacity than both commercial particleboard and MDF (70% higher in case of core-only specimens). It is concluded from the results that the developed composites are promising materials as lightweight structure components in applications subjected to high impact dynamic loading conditions.
Future work focuses on using carded web in laying-up the fibers to guarantee more evenness in mass distribution all over the composite. Also, different resin materials rather than UF will be tested to enhance the mechanical and dynamic characteristics of the developed composites.
Footnotes
Declaration of conflicting interests
The author(s) declared no potential conflicts of interest with respect to the research, authorship, and/or publication of this article.
Funding
The author(s) received no financial support for the research, authorship, and/or publication of this article.