
Abstract
A selective miRNA detection is an important factor for the early-stage diagnosis of the diseases and determination of an appropriate treatment method. In this regard, hemoglobin assisted carbon nanofibers (CNFs) were prepared via electrospinning of the precursor polyacrylonitrile/hemoglobin (PAN/Hb) hybrid nanofibers and the following heat treatment process. Addition of low ratio Hb in the precursor PAN nanofibers caused a catalytic effect on the reaction taken place during the stabilization process that helps the formation of more graphitic structure during the carbonization process. But, increasing Hb ratio in the PAN/Hb nanofibers caused an inhibiting effect on the related reactions. Guanine oxidation signals of miRNA molecules were determined via differential pulse voltammetry (DPV) measurement. In this regard, the attachment of anti-miRNA molecules on the CNFs immobilized screen-printed electrodes (SPEs) and a following hybridization of the attached anti-miRNA with miRNA molecules were carried out. Three different miRNA molecules including the target (miRNA), single-base mismatched (SM.miRNA), and non-complementary (NC.miRNA) were hybridized with the previously attached anti-miRNA molecules on the Hb-CNFs immobilized SPEs. The enhancement of the guanine oxidation signal level was observed by using Hb-CNFs instead of using CNFs. That could be attributed to the increase of the graphitic level with low Hb addition to the precursor PAN/Hb nanofibers that causes a catalytic effect on carbonization process. The prepared biosensory system could be used for the selective detection of miRNA molecules.
Introduction
Aging, unhealthy living conditions, stress, unhealthy diet, and environmental pollution are thought to increase morbidity and mortality rates due to the diseases in the coming years. Diagnosis of diseases in the early stages and beginning the necessary treatments earlier play an important role in reducing mortality rates. The diseases related to genetic molecules have led scientists to improve the existing techniques and develop new methods for the detection and analysis of these molecules. Some of the diseases are directly related to human genome such as hemophilia A, 1 breast cancer, 2 cystic fibrosis, 3 hemochromatosis, etc. Some diseases such as covid-19 4 and influenza 5 cause the external structures as viruses that are infecting the human when they entered inside a human body.
For example, Covid-19, which is the current pandemic and affects all the world, infects human when the coronavirus entered the human body and reproducing itself in the related human cells. When a person reported to a hospital with symptoms such as fever, cough, taste disorder, myalgia, and weaknesses in order to determine whether the person carry covid-19 virus, 6 one of the methods is to take sample from the nose by using a nasal swab for the following analysis.7,8 Then, the RNA molecules were extracted from the viruses and amplified via polymerase chain reactions (PCR) and analyzed.7,8 If the relevant RNA molecules were detected, the person whose sample was taken is considered covid-19 patient.
In order to detect and analyze genetic molecules including DNA, RNA, and miRNA, there are some methods such as QRT-PCR, 9 northern blotting, 10 and microarrays. 11 The implementation challenges, the requirements of qualified personnel, being expensive, and time consuming have been brought up the issue of the developments of new alternative methods. Electrochemical methods are considered as promising methods in the analysis of genetic molecules due to the ease of sample preparation and implementation, being cheap, requires less consumables, and also suitability for kit development.
MicroRNA (miRNA) are small molecules and play an important role in gene expression regulation. 12 miRNA molecules could be found in some part of body fluid including blood, saliva, and urine, 13 and are promising biomarkers for early stage diagnosis of many cancers.14–16 So, it has been attempted to determine and optimize suitable methods and devices to detect and analyze miRNA molecules. Various carbon-based electrodes systems including screen printed electrodes, 17 paste electrodes, 18 glassy carbon electrodes, 19 and pencil graphite electrodes 20 have been used for electrochemical miRNA biosensor analysis systems. A sensitive nitrogen doped porous graphene was produced via laser induced method by using polyimide and used for miRNA detection at femtomolar level. 21 Carbon nanofibers were also used to modified screen printed electrodes for an indicator-free electrochemical miRNA detection. 17 Pencil graphite electrode was used for miRNA analysis by modification with various carbon materials including carbon black, multi-walled carbon nanotubes, and graphene oxide, and the developed samples show good detection of miRNA/125a in serum. 20
Hemoglobin is a natural material and have been electrospun into fibrous mat structure.22,23 Carbon nanofibers have been produced via carbonization of electrospun neat hemoglobin after a proper carbonization process. 24 The existence of iron in hemoglobin structure could further catalyze the carbonization of the nanofibers. Barnes et al. 22 studied the effect of solution concentration on the electrospinning of hemoglobin by dissolving hemoglobin in 2,2,2-Trifluoroethanol and observed that by increasing solution concentration, void spaces among the fibers increases as a result of decrease in the number of smaller fibers. Electrospinning of Hb onto glassy carbon electrode as an electrochemical sensing platform has been reported by Ding et al. 25 for a sensitive detection of hydrogen peroxide and nitrite, and observed that electrospun Hb enhanced the electrochemical performance. In another study, Ding et al. studied the carbonization of Hb nanofiber. They observed that carbonized nanofibers contain Fe2O3 because Hb has Fe(III) porphyrin and decompose during the carbonization process and form Fe2O3 particles in/on nanofibers. 24 Lee et al. 23 dissolved Hemoglobin obtained from bovine blood in 2,2,2-trifluoroethanol and electrospun into fibrous structures, and after the proper heat treatment processes, iron/carbon fibrous structures were obtained.
Polyacrylonitrile based carbon nanofibers are the most commonly prepared carbon nanofibers that have been applied in diverse area including biosensors, 26 environmental applications, 27 and energy storage. 28 A precursor PAN solution was prepared first and electrospun into nanofiber structures. Then, as-spun precursor nanofibers were heat treated in a proper atmosphere for stabilization and following carbonization of the nanofibers.29,30 Inorganic materials including iron, 31 cobalt, 32 nickel, 33 and zinc 34 have been added into precursor PAN nanofibers in order to catalyze the carbonization and produce activated carbon nanofibers structures. Since hemoglobin contain iron atoms and could be appropriately carbonized, the investigation of the carbonization of PAN nanofibers with addition of Hb has been brought to agenda.
The miR-451 gene that is appeared in the human genome and considered as a biomarker for the detection of the several cancer types including urinary, digestive and female reproductive systems cancers, endocrine, breast, and lung cancers.35,36 Early diagnosis of the cancers can play an important role in order to apply a proper treatment process. There have been reported different methods in the literature for the sensitive detection of miRNA molecules such as real-time PCR, 37 in-situ hybridization, 38 northern blot, 39 and micro-array 40 methods. Electrochemical methods are the sensitive methods for miRNA biosensing and have been studied frequently in recent years.41,42 In this study, the sensitive detection of miR-451 via bare and hemoglobin enriched CNFs immobilized SPE systems have been studied.
Nanofibers are the materials which have extremely high volume to diameter ratio that provide very high specific surface area. In order to combine both graphitic and high specific surface area properties, carbon nanofibers could have promising future in miRNA biosensor applications. In this regard, PAN based electrospun nanofibers were prepared with addition of hemoglobin into as-spun precursor nanofibers. As-spun, stabilized, and carbonized nanofibers were morphologically analyzed with scanning electron microscopy (SEM). Chemical analysis of as-spun PAN/Hb nanofibers was conducted with attenuated total reflection fourier transform infrared spectroscopy (ATR-FTIR), thermal analysis was performed with differential scanning calorimeter (DSC) and thermogravimetric analyser (TGA) measurements. Effect of Hb addition to nanofibers on microstructures of carbonized nanofibers were investigated via X-Ray diffraction and Raman Spectroscopy analysis. Carbonized nanofibers were used as working electron for the detection of miRNA by focusing on guanine oxidation signal of the genetic molecules at DPV measurements. So, the electrochemical measurements were carried out by the attachment of the anti-miRNA molecules on the carbon nanofibers immobilized SPEs and used these electrodes to detect the targeted miRNA molecules.
Materials and method
Chemicals and the preparation of electrospun precursor PAN/Hb nanofibers
Polyacrylonitrile (average Mw 150000, Sigma Aldrich), N,N-Dimethylformamide (analytical-grade, Carlo Erba), and Bovine Hemoglobin (Hb, Sigma Aldrich). All the chemicals were used without further purification. As it was schematically illustrated in Figures 1 and 8 wt. % of PAN solution was prepared by dissolving PAN in N,N-Dimethylformamide (DMF) via magnetic stirring at the ambient condition. Appropriate amounts of the prepared solution were transferred into the empty vials, and Hb powders were added into these vials, then the mixtures were stirred again at the ambient condition for 24 h to get the solution ready for electrospinning process. 0.5, 1, 3, 5, 15, and 30 wt.% of Hb respect to PAN were added into PAN/DMF solutions and labeled as H0.5, H1, H3, H5, H15, and H30. Subscript “x” at Hx is to referred the amount of Hb added in the solution as the wt. % of PAN in the final solution. The final solutions were transferred into the plastic syringes and adjusted on a micro pump feeding system (New Era, NE-300). A grounded conductive metal collector was placed in front of the needle by adjusting the tip of the needle to collector distance as 10 cm. The solution was feet from the syringe with 0.5 mL/hours feeding rate. 12 kV voltage was applied (Gamma High Voltage Research power supplier) to the metal needle (with a metal blunt needle, gauge number 21) of the syringe. Preparation of PAN nanofiber via conventional electrospinning was reported previously in the literature.43,44 All the SEM samples were taken from the collector surface for morphology and diameter analysis. Schematic illustration of the electrospinning of PAN/Hb hybrid nanofibers and their carbonization into Hb-CNFs via heat treatment processes. SEM images of carbonized PAN/Hb nanofibers and their diameter distribution charts: (A1–3) pure CNF, (B1–3) CNF/H0.5, (C1–3) CNF/H1, (D1–3) CNF/H3, (E1–3) CNF/H5, (F1–3) CNF/H15, and (G1–3) CNF/H30.

Stabilization and carbonization of the precursor PAN/Hb nanofibers
Heat treatment of as-spun PAN/Hb nanofibers were applied to convert the precursor nanofibers into Hb-CNFs as it was introduced schematically in Figure 1. As-spun PAN/Hb precursor nanofibers were stabilized in air environment at 280oC (heating rate 10 oC/min) for 1 h in a tube furnace system (Protherm, STF 12/60/300 model, PC442T temperature control unit, 60 cm diameter ceramic tube). Then the samples were cooled to the room temperature and heated again with the same heating rate by feeding nitrogen gas into the furnace for carbonization of the stabilized nanofibers. Nanofibers were carbonized at 800 oC for 2 h. Similar heat treatment processes were reported in the literature.45,46
Characterizations of precursor PAN/Hb and CNF
Electrospinning solution parameters were determined by measuring viscosity, surface tension, and conductivity of PAN/Hb/DMF solutions. Viscosity analysis was performed with Brookfield DV-II+Pro (100 r/min by using thermosel spindle), surface tension measurements were conducted with Attension Theta Tensiometer, and conductivity measurements were carried out with a Hach-HQ40d portable digital multimeter. Scanning electron microscopy (SEM, ZEISS EVO 40) analysis was performed for morphological analysis of as-spun, stabilized and carbonized nanofibers. Nanofibers were conductive coated with gold–palladium (60/40) for 60 s by using Baltec Sputter Coater for better SEM imaging. Hundred nanofibers were selected, and their diameters were measured by using ImageJ program (The National Institutes of Health, USA) for average fiber diameter determination and diameter distribution chart preparation. As-spun PAN/Hb nanofibers were chemically analyzed with Fourier transform infrared spectroscopy (Perkin Elmer, Spectrum 100 model, USA), thermally analyzed with Differential Scanning Calorimetry Analyzer (DSC) (TA Instruments/Discovery DSC251, New Castle, USA), and thermal gravimetric (TGA) (TA/SDT650) methods. Nitrogen gas was fed into measurement chamber during both DSC and TGA measurements, and the temperatures were increased with 10 °C/min of heating rate. Microstructural analysis of the carbonized nanofibers was performed via X-Ray diffraction (XRD) method (Bruker/D8 Advance X-ray diffractometer). Raman spectra measurements were carried out with Renishaw inVIA by using the laser line at 532 nm.
Electrochemical miRNA biosensor measurement with Hb-CNFs immobilized SPEs
Phosphate (PBS) and acetate (ABS) buffer solutions were prepared for the oligonucleotide solution preparations and used in the electrochemical measurements. DNase and RNase free ultra-pure water was used in all electrochemical sample preparations and the measurements. The prepared solutions were stored at +4 oC until they are used.
Preparation of 0.05 M phosphate buffer solution (PBS)
1.36 gr (0.01 mol) KH2PO4 and 6.96 gr (0.04 mol) HK2O4P were dissolved in 1 lt ultra-pure water by magnetic stirring to obtain 0.05 M PBS solution. 0.1 N NaOH and/or 0.1N HCl was gradually added in the prepared solution to set the pH 7.4. Then, 1.168 gr NaCl was added into the final solution to set the NaCl as 0.02 M in the solution.
Preparation of 0.5 M acetate buffer solution
ABS solution was prepared by setting 0.5 M glacial acetic acid in 500 mL ultra-pure water. 0.1 N NaOH and/or 0.1 N HCl was gradually included to the solution to set the pH 4.8. Finally, 0.584 gr NaCl was added into the prepared solution to adjust the NaCl as 0.02 M in the solution.
Preparation of miRNA and anti-miRNA solutions
Sequences of the miRNA and anti-miRNA molecules used in this study.

SM: Single-base mismatched and NC: Non-complementary of the miRNA. PolyT(G) and PolyT(I) are anti-miRNA molecules with and without guanine base.
Apparatuses and testing system for the electrochemical miRNA biosensor system
Electrochemical measurements were conducted with Potentiostat - AUTOLAB AUT204 (Eco Chemie, Nederland) by using NOVA 1.11 software. Metrohm DropSens - Screen-printed Carbon electrodes (SPE) with DS 110 (working electrode (w) and auxiliary electrodes (aux) are carbon, and reference electrode (ref) is silver) product code were used at all the measurements. Photograph image of the SPE and SEM images of the CNFs immobilized on the working electrode part of the SPE were given in Figure 2. Schematic illustration of the surface activation (1), CNFs immobilization (2), anti-miRNA attachment (3), and the hybridization of attached anti-miRNA with miRNA molecules (4) on the CNFs immobilized SPE surfaces were demonstrated in Figure 2. All the electrodes were electrochemically cleaned and activated with ABS. 100 μl of ABS was dropped on the electrodes and differential pulse voltammetry method (DPV) was applied with 1.4 V deposition potential (60 s duration) by getting 600 estimated number of the points, and a continuous measurement was conducted between 0.7–1.4 V with 10 mV/s scanning rate without taking the ABS from the SPE surface. Then, the SPEs surfaces were washed with 300 μl PBS via a gentle dropping of the PBS on the SPE surfaces by using a micropipette. The activated SPEs were dried and stored until they are used. All the DPV measurements were carried out between 0.75–1.3 V with 10 mV/s scanning rate by dropping 100 μl ABS on the electrode CNFs immobilized and miRNA attached SPE surfaces. Photograph image of the SPE used in the study, SEM image of the shortened CNFs on the SPE, and schematic illustration of the SPE surface activation, CNF immobilization, anti-miRNA, and miRNA attachment on CNFs immobilized SPE surfaces.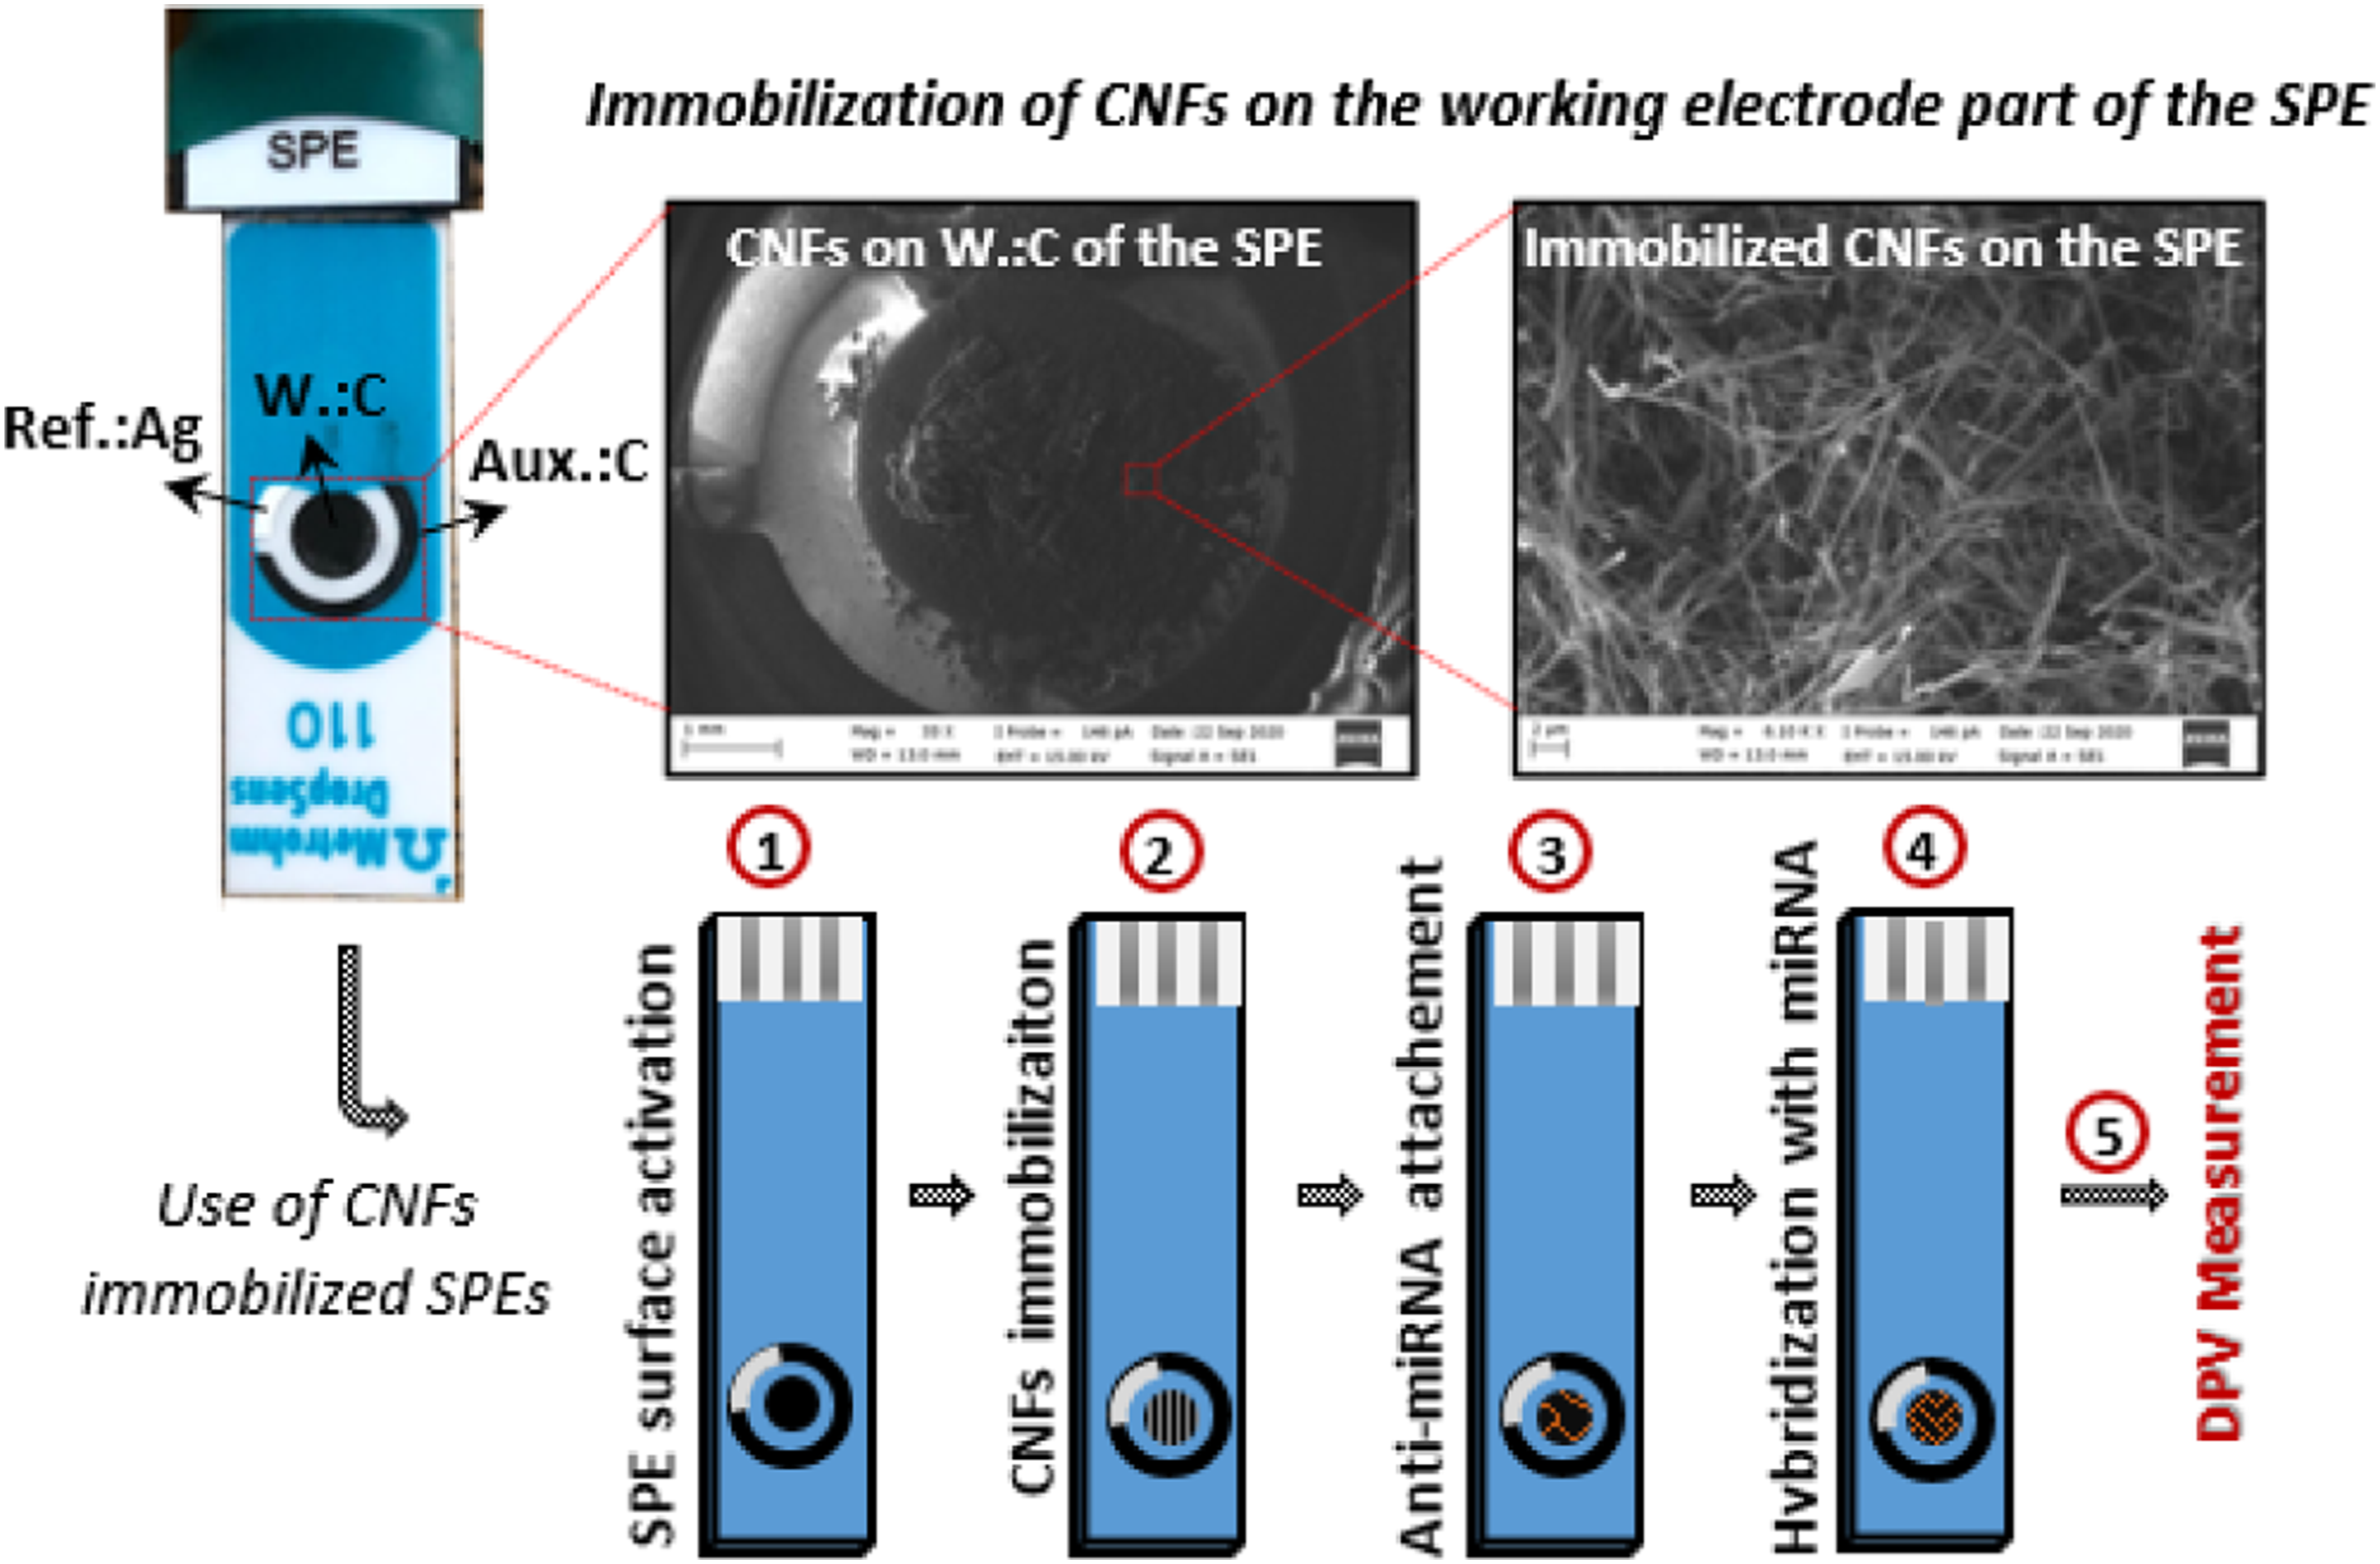
CNFs were still in the continuous form after the heat treatment process, and the fibers were mechanically broken into short fibers to be able to immobilize on the SPEs. In this regard, continuous CNFs were put into the glass vials with a magnetic stirrer and magnetically stirred with a following application of the vortex mixer until obtaining short CNF powders. Then, these shortened CNFs were immobilized on SPEs both directly and after the chemical modification of the SPEs with N-hydroxysuccinimide/1-ethyl-3-(3-dimethylaminopropyl)-carbodiimide (NHS/EDC) solution. For the direct CNFs immobilization, the CNF powders were suspended in ethanol and the suspensions were dropped on the working electrode parts of the SPEs, dried, and directly used without applying any washing with PBS. On the other hand, NHS/EDC modified and CNF immobilized SPE samples were washed with 300 μl PBS and dried before the use. For the NHS/EDC solution preparation, 9.21 mg NHS (8 mM) and 9.59 mg EDC (5 mM) were put in 10 mL PBS and magnetically stirred in ambient temperature until obtaining a homogeneous solution. For the surface modification, 10 μl of the NHS/EDC solutions were dropped on the SPEs and waited for 1 hour in the ambient condition. 1 gr of the CNF powders were put into the PCR tubes with 100 μl dimethyl sulfoxide (DMSO) and mixed at 1500 r/min for 30 s by using a vortex mixer. The prepared CNF suspensions were hold in laboratory condition for 1 hour and then immobilized on the SPEs. 5 μl of the CNF suspensions were dropped on the working electrode parts of the SPEs and kept 6 h for an appropriate immobilization of the CNFs. The prepared SPEs were washed with 300 μl PBS and stayed in the ambient condition for drying (at least 1 h).
NH modified polyA molecules were attached on the NHS/EDC modified and CNF immobilized SPEs. PolyA molecules were not used on the sample which NHS/EDC modification was not applied and anti-miRNA molecules were directly attached on the samples without modification. For the polyA attachment, the prepared measurement solution was dropped on the CNFs immobilized SPEs, waited for 1 h, and then washed with 300 μl of PBS. The samples were dried at least 1 hour. Then, PolyT(G) or PolyT(I) molecules were attached on the electrode surfaces by dropping 10 μl of the prepared measurement solutions and waited for 1 h for a proper attachment of the anti-miRNA molecules, then the samples were washed with 300 μl PBS to remove unattached molecules and dried for 1 h before the hybridization of miRNA molecules. For the miRNA detection, 10 μl of miRNA, SM.miRNA, and NC.miRNA were dropped separately on the previously prepared anti-miRNA attached samples and stayed 1 h for a proper hybridization of anti-miRNA and miRNA molecules on the CNFs immobilized SPEs. In order to remove the unattached molecules before the measurement, all the samples were washed with 300 μl PBS and dried 1 hr.
Results and discussion
Morphological investigation of precursor PAN and PAN/Hb nanofibers
Morphological investigation of the precursor hemoglobin loaded PAN/Hb precursor nanofibers were carried out via SEM imaging as demonstrated in Figure 3. Pure PAN nanofibrous mat also included in the figure for the comparison. As seen from the figure, all precursor nanofibers exhibited 3D nanofibrous mat morphology, and continuous nanofibers were collected on top of each other as a layered form in the mat structure. As-spun PAN nanofibers were pretty smooth and uniform, and no defect structure was observed (Figure 3(a)). On the other hand, when hemoglobin was added into the electrospinning solutions and the solutions were spun into nanofibrous structure, beaded defect structures were observed in the mat as shown in Figure 3 (B1-G1). The diameters of these beads were bigger than the diameter of the fibers as seen in the low magnification images at the left in Figure 3. This could be related to the low solubility of Hb in PAN/DMF solutions. If Hb was perfectly dissolved in the solution, the defect level could be transferred to fibers more and the beaded defect could be seen on the fibers frequently as named bead-on-string morphology defect structure. The amount of these beads was not proportionally changed with Hb concentration as in the electrospinning solution. The measured average nanofibers diameters as given in Table 2 were 439 for pure PAN, and 480, 372, 485, 346, 286, and 483 nm respectively for PAN/Hb (H0.5, H1, H3, H5, H15, and H30) nanofiber samples. Average nanofiber diameters were not changed consistently with increasing Hb amount, standard deviations were increased, and nanofiber diameter distributions were much broader when Hb was added into PAN nanofibers comparing to pure PAN nanofibers as seen from the Table 2 and graphs in Figure 3 (A3-G3). Viscosity, surface tension, and conductivity of the electrospinning solution were measured to interpret nanofiber diameters. Solution viscosity was first decreased with the initial addition of Hb and increased again by increasing Hb content (amount) in the solution. Almost similar trend was observed in surface tension measurement as in the viscosity measurement results. On the contrary, solution conductivity decreased in a regular fashion by increasing Hb amount in the solutions. Even though solution conductivity decreased with increasing Hb content in the solution and could have expected to decrease the average nanofibers diameters regularly, irregular trends in viscosity and surface tension caused non-uniform change in average nanofiber diameters at PAN/Hb nanofibers. Since Hb was not perfectly dissolved in PAN/DMF solution, some Hb were remained as undissolved particular form in the solution. Even though some Hb did not dissolve in the solution, the solution viscosity increased as the amount of Hb increases in the solution. Consequently, the limited solubility of Hb in PAN/DMF solution at ambient condition did not allow to reflect all the solution properties to the nanofiber structures. SEM images of as-spun PAN/Hb nanofibers and their diameter distribution charts: (A1–3) pure PAN, (B1–3) PAN/H0.5, (C1–3) PAN/H1, (D1–3) PAN/H3, (E1–3) PAN/H5, (F1–3) PAN/H15, and (G1–3) PAN/H30. Characteristics of measured electrospinning solution parameters and diameters of electrospun PAN and PAN/Hb
a
nanofibers. aPrecursor Polyacrylonitrile/Hemoglobin (PAN/Hb) nanofibers. bDiameters of as spun PAN/Hb precursor nanofibers. cStabilized nanofibers of “b.” dDiameters of carbonized nanofiber of “c”. The values of nanofiber diameters were expressed as means ± standard deviations.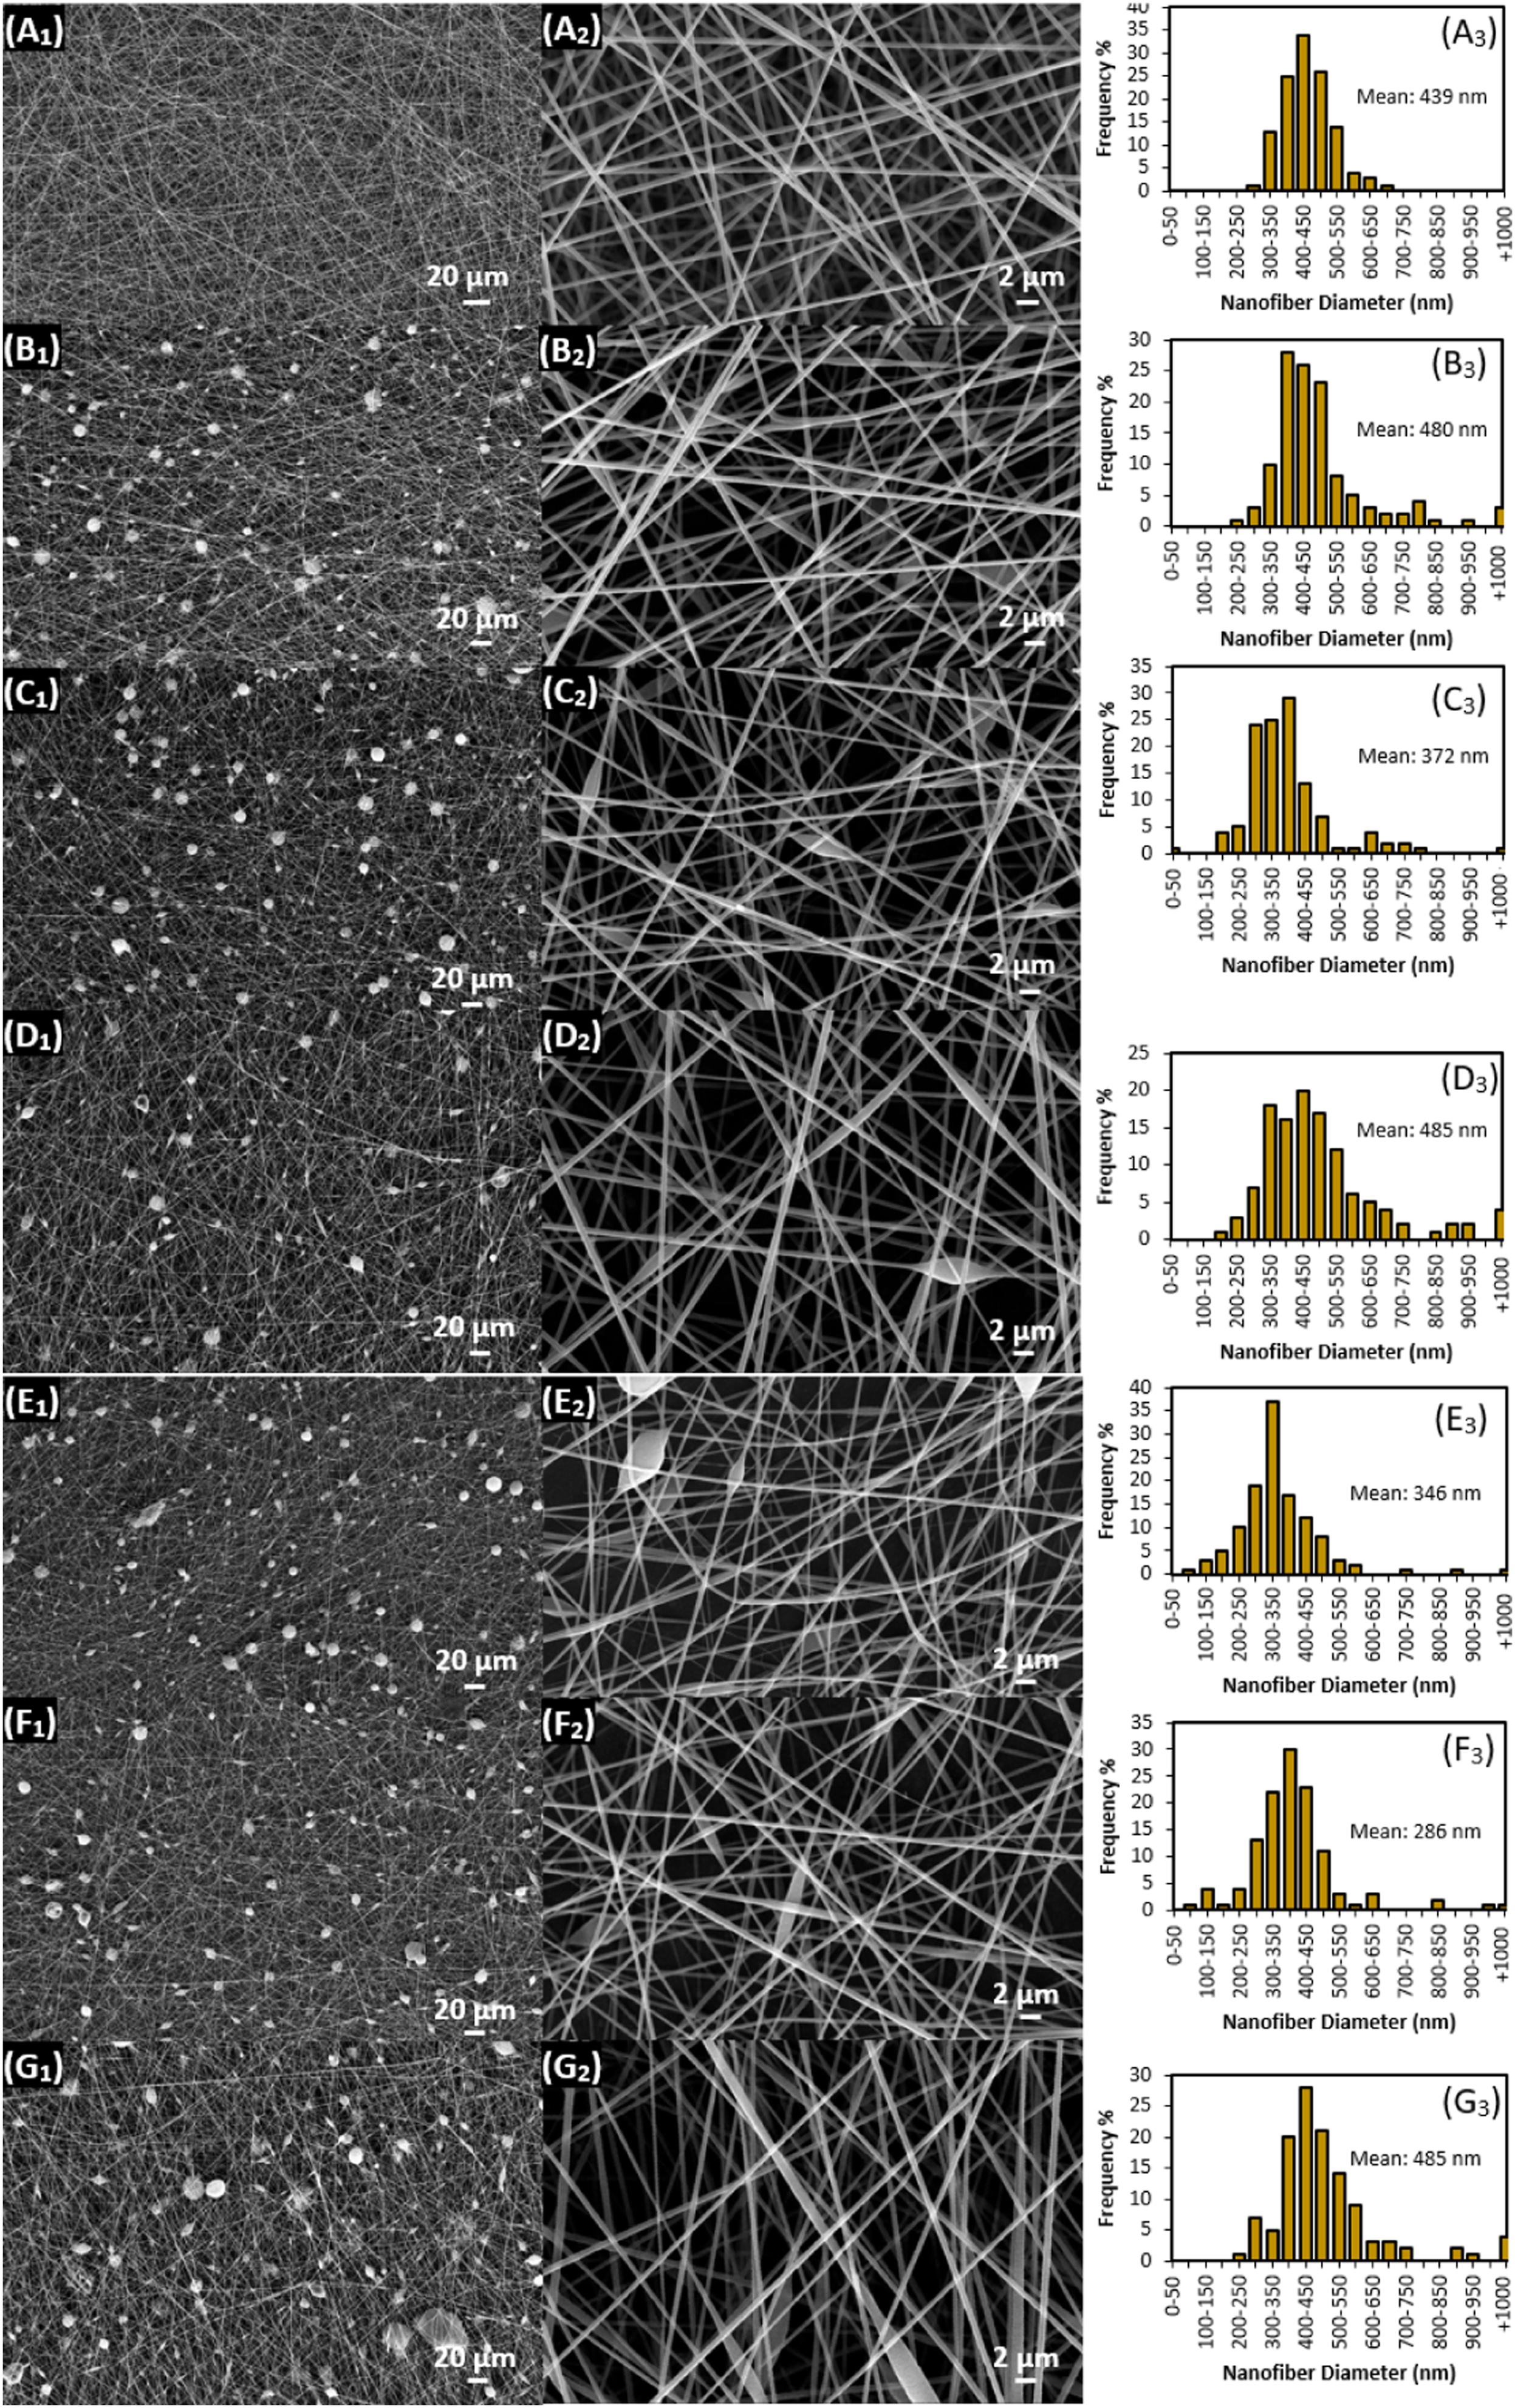

Chemical analysis of precursor PAN and PAN/Hb nanofibers
Chemical properties of pure Hb and electrospun PAN/Hb nanofibers with different Hb (amounts) contents were analyzed with ATR-FTIR method and the obtained plots were demonstrated in Figure 4. Prominent peaks for pure Hb were detected at 1539 and 1647 cm-1. These peaks were corresponded to Amide-II and Amide I in hemoglobin.47,48 Another peak at 1393 cm−1 attributed to C-N stretching vibration of aromatic amides.
47
In order to observe how the Hb addition affect the chemical properties of PAN nanofibers, FTIR spectra of pure PAN nanofibers also obtained for the comparison, and its plot was given in Figure 4(a). Prominent peaks of PAN was detected at 1357, 1452, 2244, and 2938 cm−1 correspond to C-H wagging of methyl groups,
49
bending vibrations in CH2 groups,
50
stretching vibration of C≡N groups,49,51 and stretching vibration at C-H was observed at 2938 cm−151 sequentially. A strong peak detected at 1665 cm−1 revelated to C=O stretching and related to the excess of DMF trapped by PAN nanofibers.
52
The peaks coming from PAN revealed that there was no prominent change in chemical properties of PAN. The peak seen as a shoulder around 1650 cm−1 corresponds to Hb confirmed the existence of Hb in PAN/Hb nanofibers. Decrease of the peak intensity at 1665 cm−1 with addition of Hb to PAN nanofibers mentioned that DMF molecules were less trapped by the nanofiber when Hb was present in the fibers. ATR-FTIR spectra of pure Hb powder and PAN/Hb nanofibers: (a) pure PAN, (b) PAN/H0.5, (c) PAN/H1, (d) PAN/H3, (e) PAN/H5, (f) PAN/H15, and (g) PAN/H30.
Morphological analysis of stabilized PAN and PAN/Hb nanofibers
Before the carbonization process was performed, as-spun precursor pure PAN and PAN/Hb nanofibers were properly stabilized for 1 h in air atmosphere at 280 oC for the necessary reactions (e.g., cyclization and dehydrogenation) to occur.53,
54
3D nanofibrous mat structure was not changed after stabilization of the precursor nanofibers (Figure 5). After stabilization process, average nanofiber diameter of pure PAN nanofibers increased, but Hb added precursor PAN/Hb nanofiber diameters tended to decrease. On the contrary, although standard deviation increased at pure PAN nanofibers after stabilization, it reduced when the precursor nanofibers were loaded with Hb (Table 2). Comparing the stabilized pure PAN nanofibers, average diameter of Hb loaded samples were lower at any of the samples after stabilization step. SEM images of stabilized PAN/Hb nanofibers and their diameter distribution charts: (A1–3) pure stb-PAN, (B1–3) stb-PAN/H0.5, (C1–3) stb-PAN/H1, (D1–3) stb-PAN/H3, (E1–3) stb-PAN/H5, (F1–3) stb-PAN/H15, and (G1–3) stb-PAN/H30.
DSC analysis of precursor PAN and PAN/Hb nanofibers
DSC measurements of Hb added as-spun PAN/Hb nanofibers were performed between 50–150 oC, and the plots were shown in Figure 6 as long range (Figure 6(a)) and peak focus (Figure 6(b)). A distinct and strong exothermic peak was observed at all the nanofibers samples around 293–301o C. Maximum peak point around 296.5, 296.6, 291.9, 293.3, 296.4, 301.4, and 298.5 oC, and onset peak point around 292.1, 293.1, 285, 290, 292.8, 295.6, and 295.3 oC were detected respectively for pure PAN and PAN/Hb (H0.5, H1, H3, H5, H15, and H30) nanofibers, sequentially. These peaks correspond to the reactions (i.e., dehydrogenation, cyclization, and crosslinking) taken place in PAN nanofibers.53,54 One of the predominant reaction in them is the cyclization reaction to form ring structure.
54
As seen from the results, the peak position shifted to higher temperature with Hb addition revealed that the existence of Hb in nanofibers cause an inhibiting effect on these reactions taken place during stabilization.
54
The decrease of intensity was another sign of the decrease of cyclization reaction. Contrarily, at the samples like H0.5 and H3, the intensity of this peak increased Hb addition to the nanofibers, which will cause to have more graphitic structure after carbonization of the nanofibers. At high content of Hb addition as in H15 and H30 samples, the peak was broadened and a new peak was present just above the main peak as a shoulder peak revealed that another crystalline structure exists in the fibers. DSC analysis of PAN/Hb nanofibers with different ratio: (a) pure PAN, (b) PAN/H0.5, (c) PAN/H1, (d) PAN/H3, (e) PAN/H5, (f) PAN/H15, and (g) PAN/H30.
TGA analysis of precursor PAN and PAN/Hb nanofibers
Thermogravimetric analysis of the precursor as-spun PAN/Hb nanofibers were investigated via TGA measurement under nitrogen atmosphere. TGA plots of as-spun PAN/Hb nanofibers were shown in Figure 7. First, weight loss around 100 oC corresponds to excess water loss from the fiber. Prominent weight loss was observed at three stages beginning from Point 1, 2, and 3. Weight loss at Point 1 were 284.8, 285.7, 285.1, 287.4, 285.7, 287.6, and 287.6 oC for a pure PAN, H0.5, H1, H3, H5, H15, and H30. PAN/Hb nanofiber samples revealed that thermal stability was reduced by Hb addition to the fibers. Sharp weight loss from the fibers by heating related to the removed volatiles as a result of the products of the complex chemical reaction (dehydrogenation, cyclization, and cross-linking) occurred.53,55 The residual of the samples when the temperature reached to 800 oC at Point 4 were 32.1, 31.4, 27.1, 26.7, 32.5, 32.6, and 33.5% respectively for pure PAN, H0.5, H1, H3, H5, H15, and H30 samples sequentially. Thermogravimetric analysis of PAN/Hb nanofibers (A and B) TGA: (a) pure PAN, (b) PAN/H0.5, (c) PAN/H1, (d) PAN/H3, (e) PAN/H5, (f) PAN/H15, and (g) PAN/H30.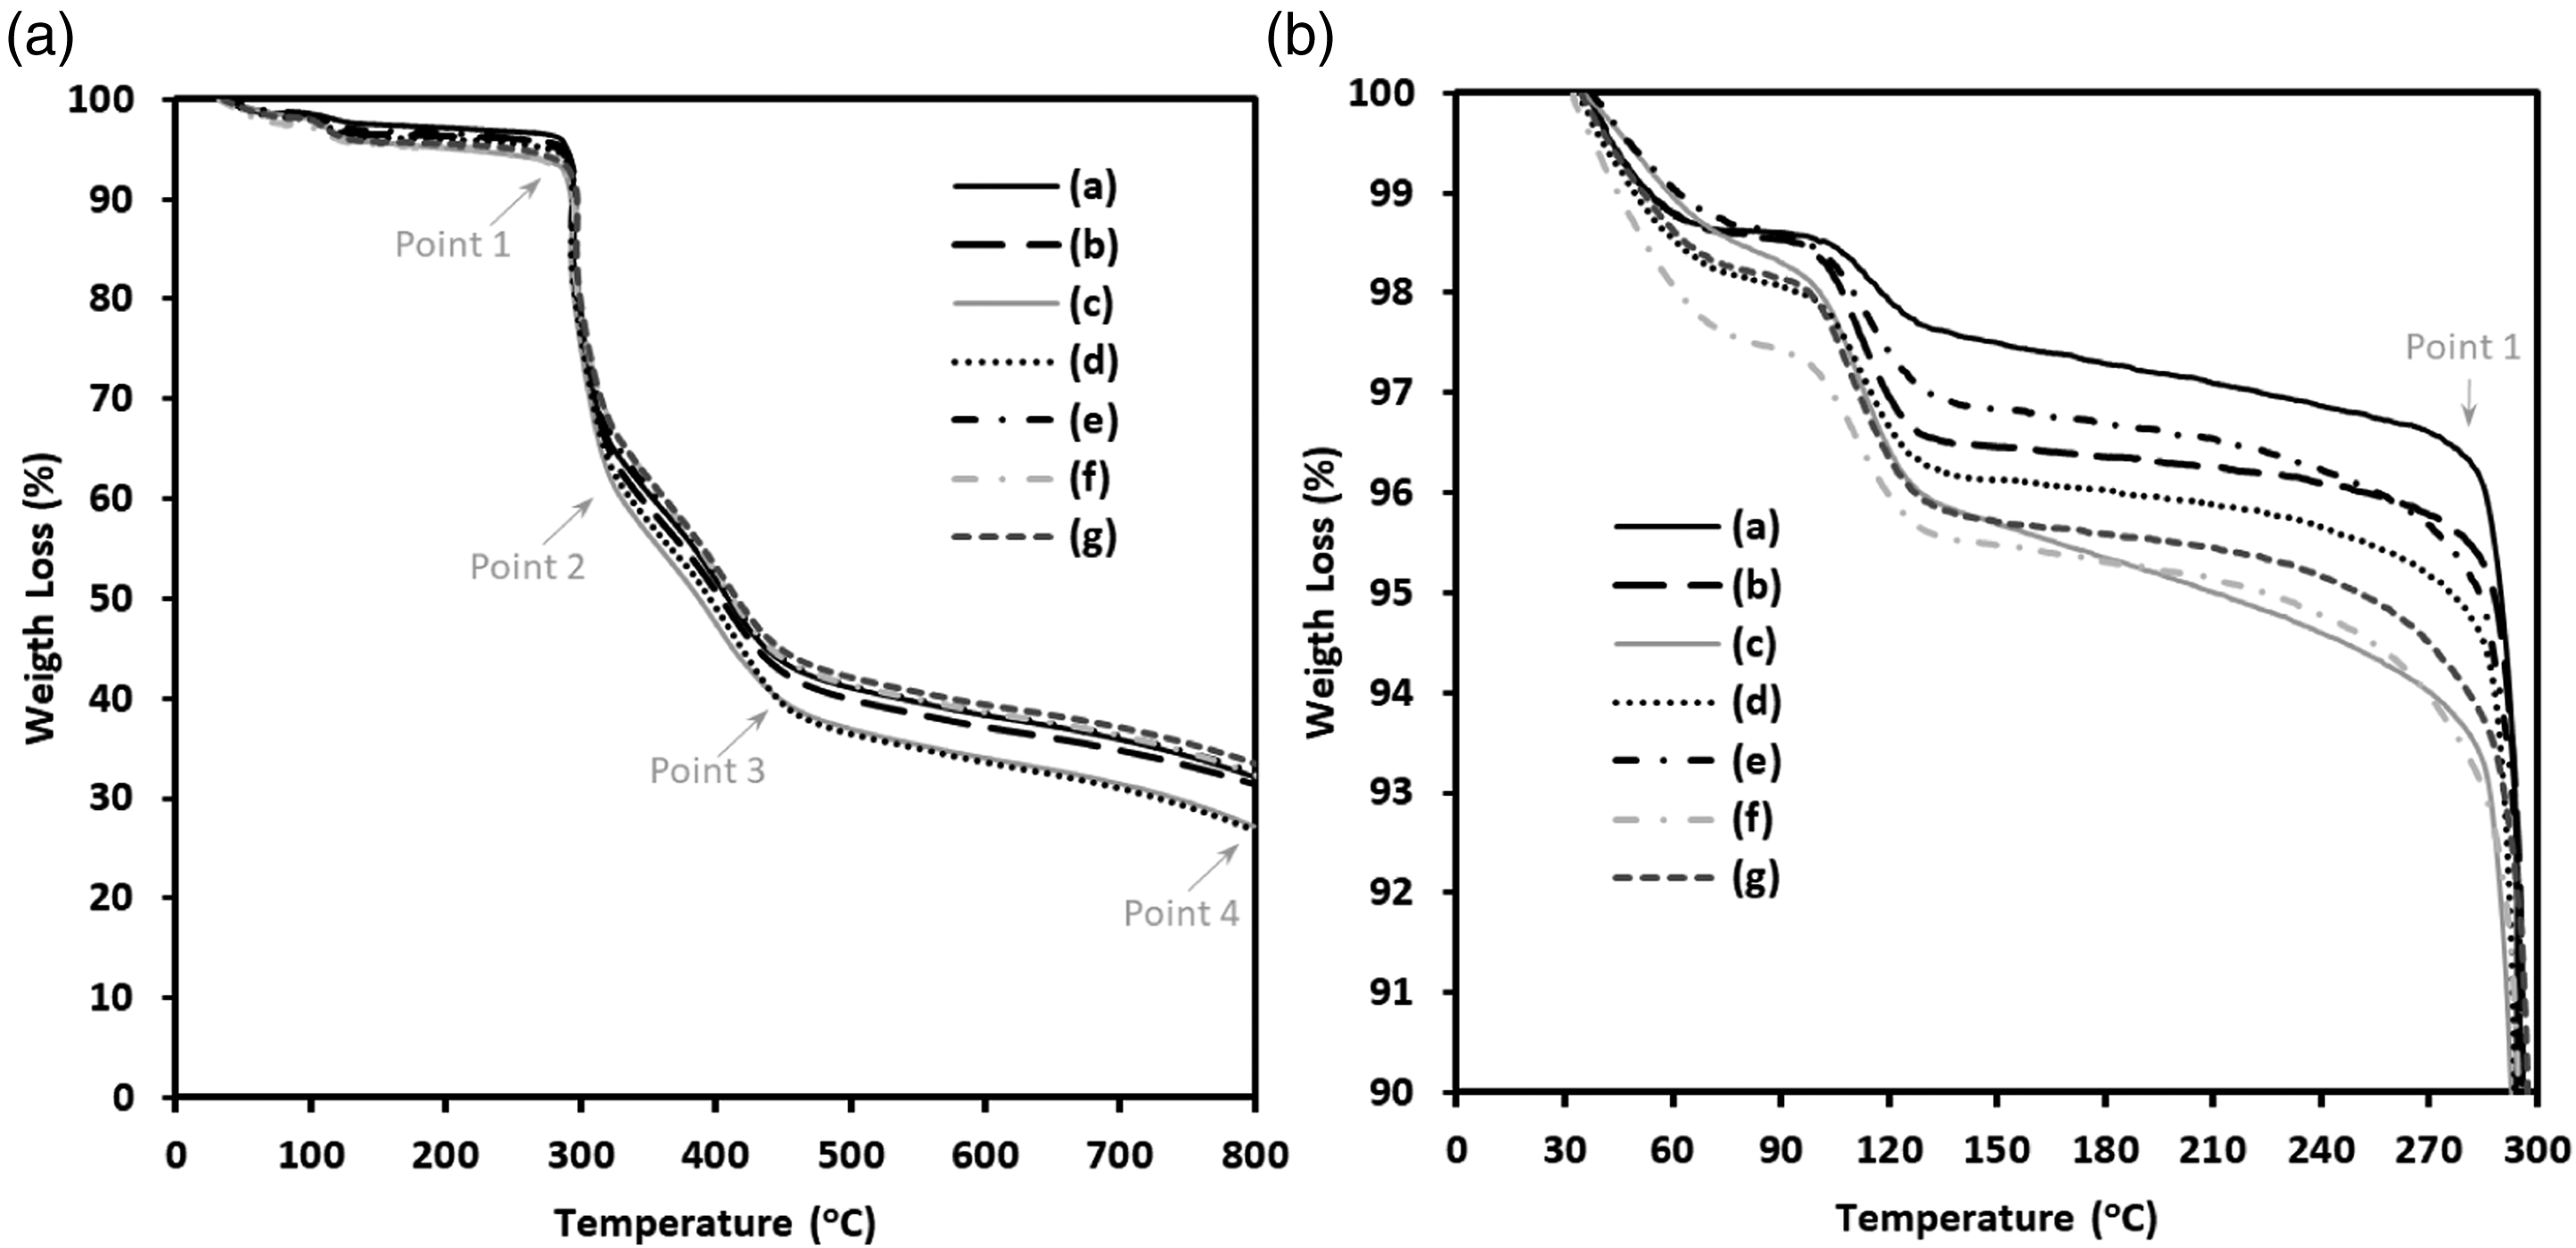
Morphological analysis of Hb enriched CNFs
The stabilized precursor pure PAN and PAN/Hb nanofibers were carbonized at 800 oC for 2 h in the nitrogen atmosphere. The morphologies of the nanofibers after carbonization process were also investigated via SEM imaging as demonstrated in Figure 8. Nanofibers kept their uniformity as in a 3D structure after carbonization process. As seen from both Figure 8 and Table 2, average nanofibers diameters were dramatically decreased after carbonization process, and standard deviation of carbonized nanofiber diameters reduced as well compared to both their precursor and stabilized nanofiber counterparts. Some pore formations were observed on the nanofibers Hb enhanced carbon nanofibers (Figure 8 (C2, E2, and F2) even though it was not seen in all the samples consistently. No nanofiber breakage was seen at the carbonized pure PAN NFs (Figure 8-A1), but nanofiber breakage could be clearly seen after carbonized PAN/Hb nanofibers (Figure 8B1-8G1). Since the existence of iron in the precursor fibers has effect on the formation of porous structure in the carbon nanofiber, 56 both pore formation and fiber breakage could be related to activation effect of iron atoms in hemoglobin for carbonization stage.
Raman spectra analysis of Hb enriched CNFs
Raman spectroscopy measurements of carbonized nanofibers were carried out to investigate the level of graphitic structure in the nanofibers. As seen from Figure 9, two distinct peaks around 1344–1359 cm−1 (D-band) related to disordered carbons and 1582–1594 cm−1 (G-band) related to ordered graphitic phase for the samples were detected. The intensity ratio of these peaks (R=ID/IG) for each sample determines the level of the structural order property,57,58 and the decrease of this ratio represents more graphitic structures in the nanofibers.
59
The calculated R values were 1, 0.91, 1, 0.96, 1, 0.98, and 1.01 for neat CNFs, CNF/H0.5, CNF/H1, CNF/H3, CNF/H5, CNF/H15, and CNF/H30 nanofiber samples. As it is seen, a low content of Hb in PAN nanofibers as in the sample H0.5 enhanced the graphitic level more at PAN derived nanofibers by following the procedure in the study. DSC results also support the results that as in the low hemoglobin concentration samples like H0.5 and H3, the intensity of the exothermic peak increased comparing to net PAN nanofibers due to more ring formation during stabilization process and leaded to form more graphitic structure after carbonization process. Raman Spectra of carbonized nanofiber: (a) CNF, (b) CNF/H0.5, (c) CNF/H1, (d) CNF/H3, (e) CNF/H5, (f) CNF/H15, and (g) CNF/H30.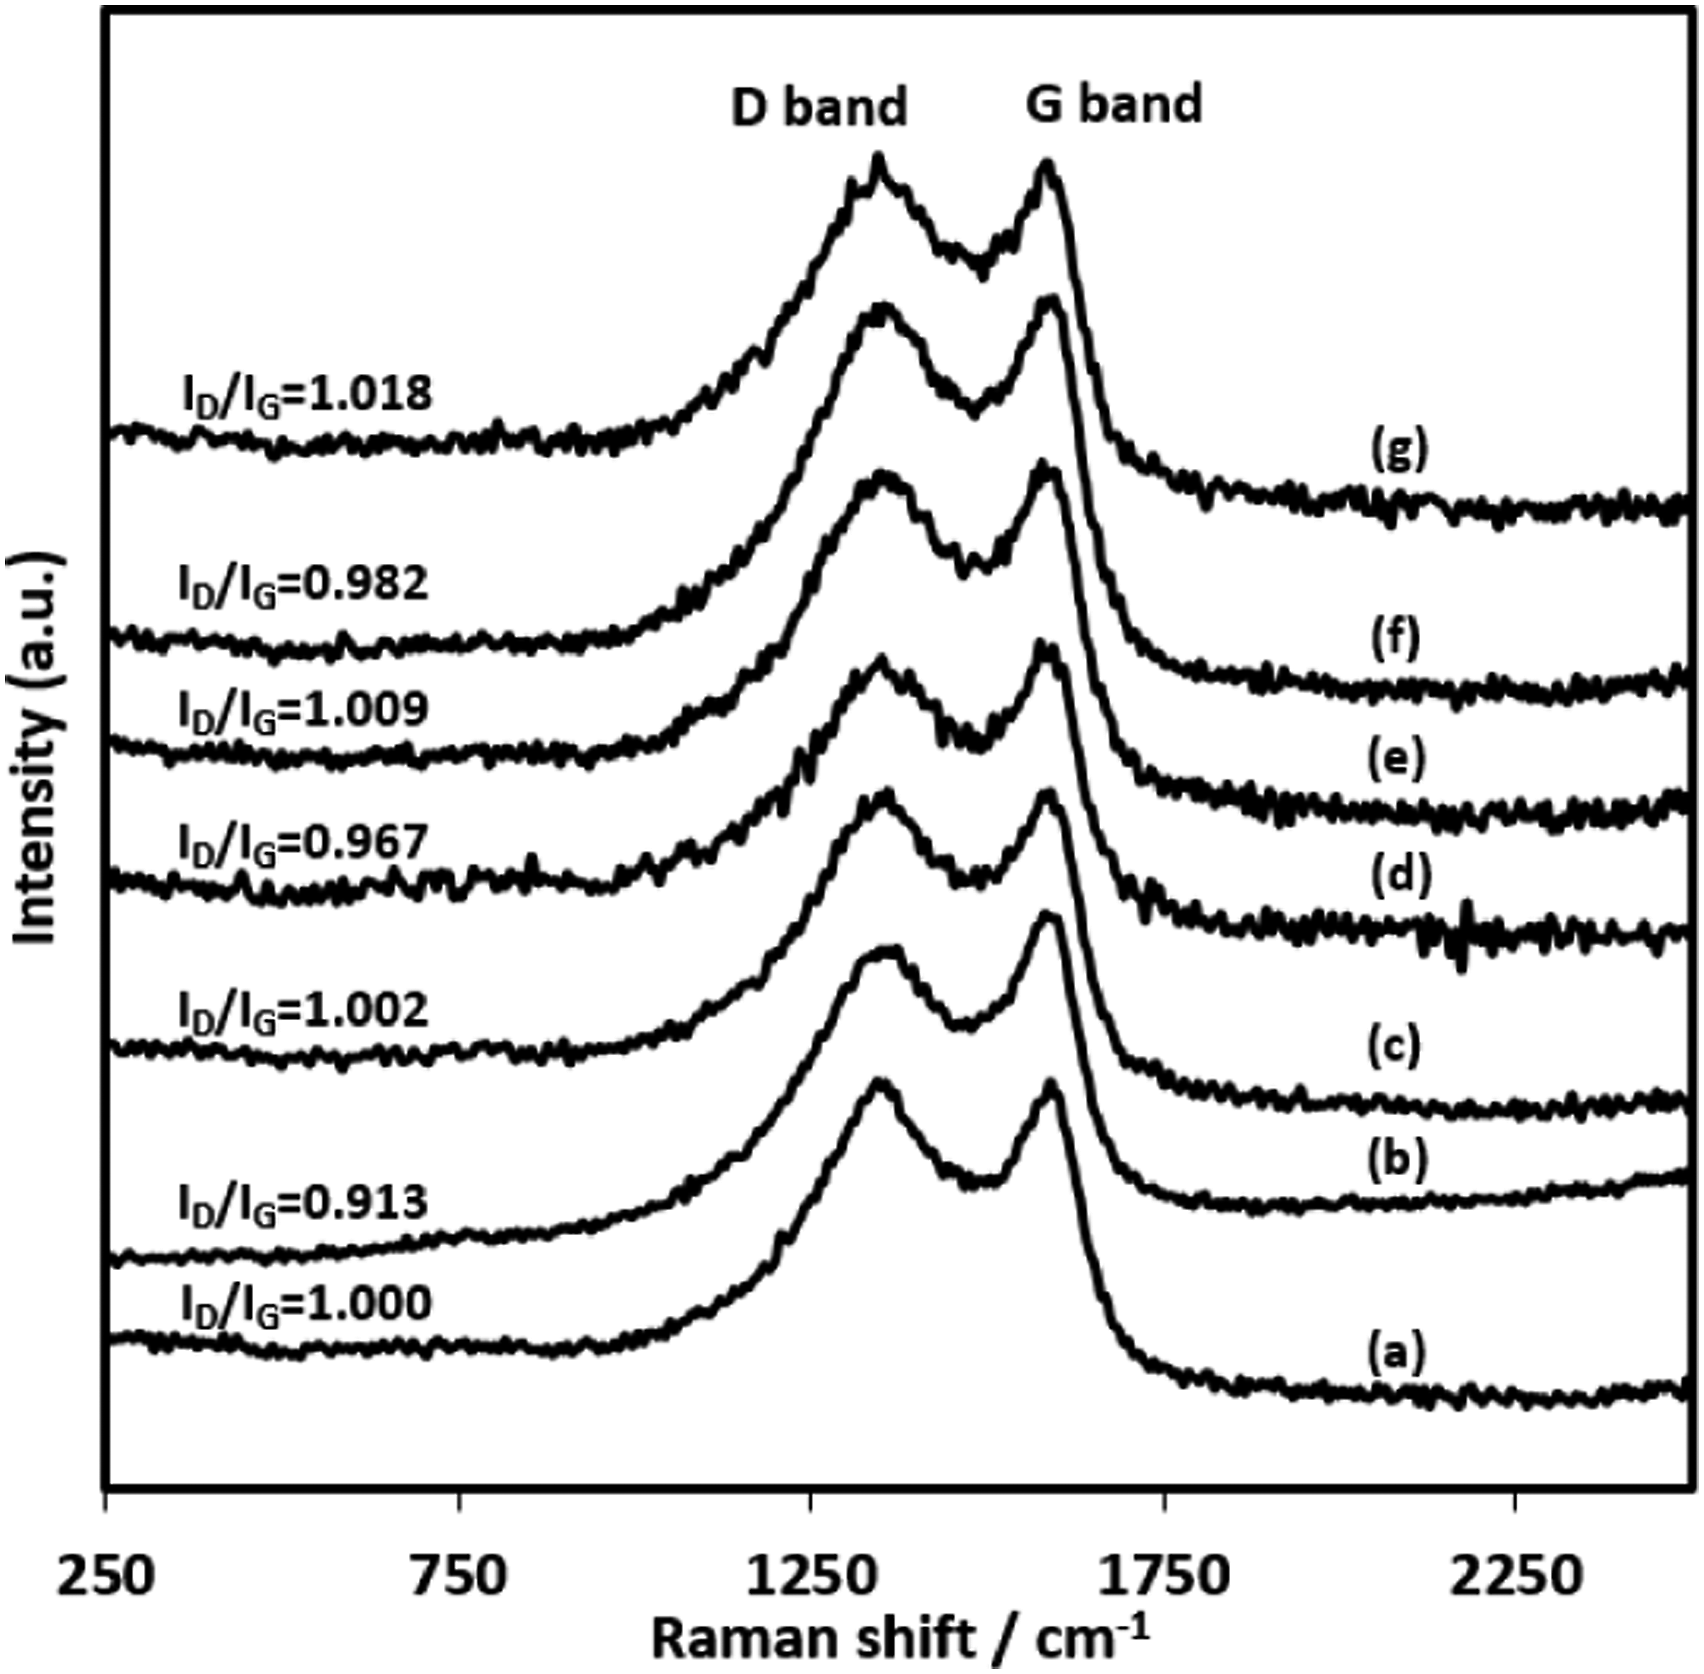
X-ray diffraction analysis of Hb enriched CNFs
X-Ray diffraction (XRD) analyses of carbonized precursor PAN/Hb nanofibers were acquired and shown in Figure 10 in order to observe microstructure of the nanofibers. The prominent diffraction peak around 2θ =23.5o correspond to (002) layers of graphite parts in the carbon nanofibers.57,58 The detected diffraction angles for the samples H1, H3, H5, H15, and H30 were 26.8, 24.9, 25.68, 24.34, and 24.56o. All the samples containing this peak imply that Hb enhanced samples also contain graphitic structures in the carbonized nanofibers, and this peak tended to shift higher degree with Hb enhancement, and highest shifts were seen at low law addition at sample H1. Interplanar spacing (d-spacing) of the graphene layers at the graphitic regions were calculated with Bragg’s Law equation (λ =2dSinθ, where “λ” is the wavelength of X-ray and it was 1.54 Å).
60
The calculated d-spacing d(002) of CNFs, H1, H3, H5, H15, and H30 were 3.73, 3.32, 3.57, 3.46, 3.65, and 3.62 Å, respectively. The reported d-spacing of d(200) plane for graphite was about 3.35 Å,58,61 so the results confirmed that better graphitic structure was seen at H1 sample compared to other samples since the closest d-spacing values was obtained for this sample. As seen, Raman spectra XRD results confirmed that low Hb addition into the precursor nanofibers leaded better graphitic structure in the carbonized nanofibers. X-Ray diffraction plots of carbonized nanofibers (a) CNF, (b) CNF/H1, (c) CNF/H3, (d) CNF/H5, (e) CNF/H15, and (f) CNF/H30.
Electrochemical analysis for the selective miRNA detection by using Hb enriched CNFs immobilized SPEs
Bare SPEs were first cleaned and activated by dropping ABS solution on the electrodes and applying potential as the procedure was given in the material and methods section. The activated SPEs were modified with NHS.EDC solutions, and Hb-CNFs were immobilized on the working electrode parts of the SPEs. PolyA molecules which contain NH groups were attached on the electrode surfaces before the attachment of anti-miRNA and hybridization with miRNA molecules. Then, anti-miRNA molecules which contains guanine base (PolyT(G)) and doesn't contain guanine base (PolyT(I)) were attached on the SPEs surfaces separately. A group of the anti-miRNA attached samples were directly used at the DPV measurement to investigate the guanine oxidation signal of these molecules, and the measurement results were shown in Figure 11(a) and (e). Other groups of the anti-miRNA attached samples were used to detect miRNA molecules by hybridization of anti-miRNA with the miRNA molecules on the electrode surface. As seen from the Figure 11(a), both guanine and adenine oxidation signals were clearly detected around 0.9–1.05 and 1,15–1,25 V when PolyT(G) attached samples were used on the CNFs immobilized SPEs.62,63 On the other hand, only adenine’s oxidation signal was detected at PolyT(I) attached samples (Figure 11(e)). Even though there was weak signal enhancement at CNF-H3, no significant signal enhancement was observed with using Hb enhanced CNFs at the measurements. Electrochemical miRNA biosensor measurements plots by using NHS/EDC modified and Hb-CNFs immobilized SPEs: (A) PolyT(G), (B) PolyT(G)-miRNA, (C) PolyT(G)-SM.miRNA, (D) PolyT(G)-NC.miRNA, (E) PolyT(I), (F) PolyT(I)-miRNA, (G) PolyT(I)-SM.miRNA, and (H) PolyT(I)-NC.miRNA.
In order to investigate the selectivity of the prepared biosensory systems, anti-miRNA (PolyT(G) and PolyT(I)) attached Hb-CNFs immobilized SPE surfaces were also separately interacted with target miRNA, single-base mismatched miRNA (SM.miRNA), and non-complementary miRNA (NC.miRNA) molecules and observed how the guanine oxidation signal is changing after hybridization of the anti-miRNA with miRNA molecules. Guanine oxidation signal was dramatically decreased with hybridization of PolyT(G) with miRNA and SM.mirRNA as seen in Figure 11(b) and (c). On the contrary, no significant change on the signal intensities was observed when PolyT(G) was interacted with NC.miRNA molecules (Figure 11(d)). On the other hand, even though guanine oxidation signal was not detected at PolyT(I) attached samples (Figure 11(e)), the guanine oxidation signal became apparent after the interaction of the PolyT(I) attached SPEs with each miRNA samples including target miRNA (Figure 11(f)), SM.miRNA (Figure 11(g)), and NC.miRNA (Figure 11(h)) molecules. The detected guanine signal intensities were lowest when PolyT(I) was interacted with NC.miRNA samples because no hybridization was occurred and the NC.miRNA molecules were removed from the electrode surfaces with PBS washing before the measurement.
CNFs were also immobilized on the SPE surfaces without carrying out NHS.EDC modification. In this regard, shortened CNFs were suspended in ethanol and immobilized by directly dropping on the working electrode part of the SPEs. PolyT(G) as anti-miRNA molecules were attached on the Hb-CNFs immobilized SPE surfaces via physical adsorption method and then interacted with target miRNA and non-complementary miRNA (NC.miRNA) separately for hybridization. Specifically, guanine oxidation intensity changes were observed before and after hybridization. As seen from Figure 12(a), guanine oxidation signal is clearly detected around 0.9–1.0562,63 at PolyT(G) attached samples, and a small enhancement was seen when Hb enrichment was applied to the CNFs. Guanine oxidation signal decreased when PolyT(G) attached electrodes were interacted with miRNA as a result of the proper hybridization. (Figure 12(b)). Guanine oxidation signal intensities were not decreased (Figure 12(c)) when the PolyT(G) attached electrodes were interacted with NC.miRNA because PolyT(G) and NC.miRNA molecules were not hybridized as a result of the mismatch of genetic codes. The little enhancement of the guanine oxidation signal with using Hb-CNFs instead of using CNFs could be attributed to little enhancement of the graphitic level with Hb addition to the precursor PAN/Hb and consequently catalytic effect on carbonization process. In order to enhance the detected signal intensity, more graphitized CNFs could be used. Electrochemical miRNA biosensor measurements plots by using just Hb-CNFs immobilized SPEs without NHS/EDC modification: A) PolyT (G), (B) PolyT (G)-miRNA, and (C) PolyT(G)-NC.miRNA.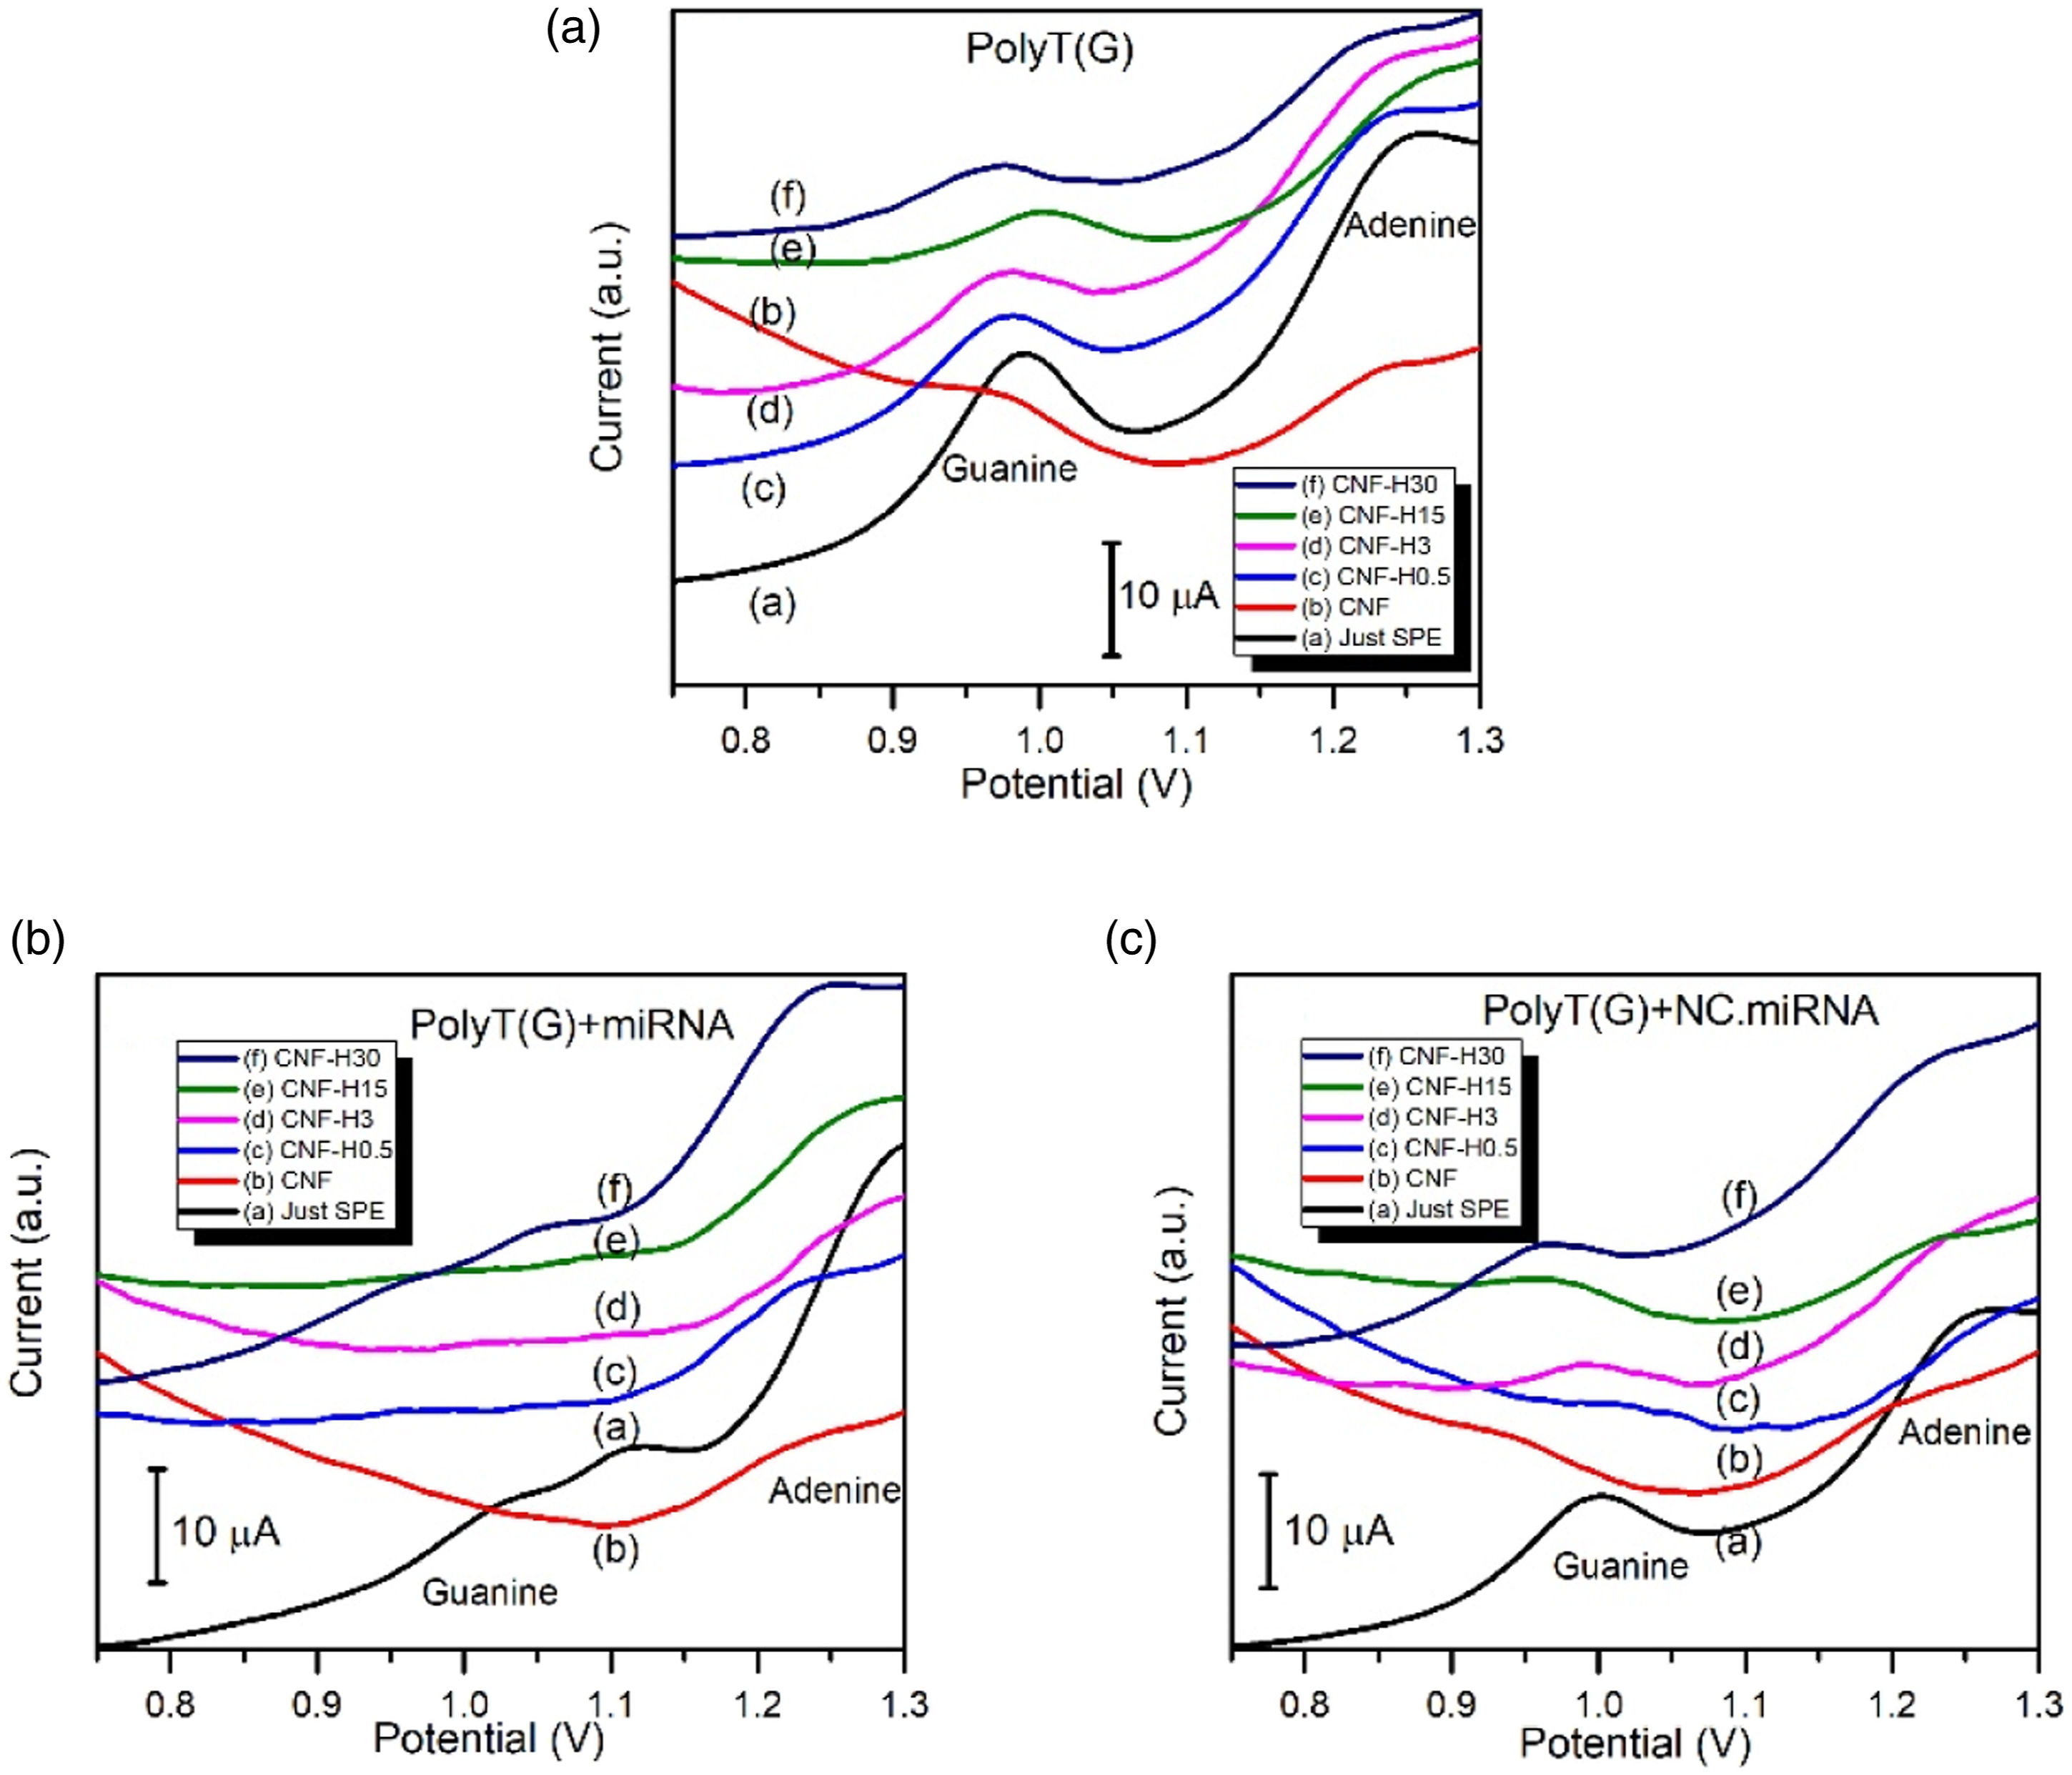
Conclusion
Polyacrylonitrile/hemoglobin hybrid nanofibers were produced with different ratios via electrospinning method. As-spun nanofibers were properly stabilized and carbonized in air and nitrogen atmospheres. Addition of Hemoglobin into nanofibers caused the formation of beaded defect in the nanofibrous mat, but nanofiber uniformity was not lost and kept their continuous fashion. Nanofiber diameters were dramatically decreased after carbonization process. Raman spectra and X-Ray diffraction measurements showed that low addition of Hb into the precursor PAN nanofibers results better graphitic structure after carbonization process. DSC analysis also confirm that generally low additions of Hb caused greater exothermic peak revealed more cyclization reaction occurred and more ring structures were formed. This leaded to form more graphitic structure after carbonization of the nanofibers. So, it could be concluded that much Hb addition is not necessary to obtain the best graphitic structures in the carbonized nanofiber. Produced carbon nanofibers were also immobilized on screen printed electrodes and used for the selective miRNA detection by focusing on guanine oxidation signal. Anti-miRNA were attached on the electrode surfaces, hybridized with miRNA molecules, and DPV measurements were conducted to observe guanine oxidation signal intensity changes. Comparing to neat and hemoglobin assisted carbon nanofibers usage in the measurement, the signal intensities were not significantly changed, but low addition of hemoglobin into the precursor nanofibers caused a catalytic effect during the heat treatment processes and enhanced the graphitic structures of the carbon nanofibers that leaded to increase the signal intensity a little bit efficiently.
Footnotes
Declaration of conflicting interests
The author(s) declared no potential conflicts of interest with respect to the research, authorship, and/or publication of this article.
Funding
The author(s) disclosed receipt of the following financial support for the research, authorship, and/or publication of this article: The present study was part of a research project funded by The Scientific and Technological Research Council of Turkey (TUBITAK, Project no. 118M231). The study is a part of Karima Sahtani’s PhD thesis work in the Graduate School of Natural and Applied Sciences at Bursa Uludag University.