
Abstract
Surface enhanced Raman scattering (SERS) has proven to be increasingly valuable as an analytical tool since this phenomenon was first observed in 1973. However, challenges still exist to ensure their ability to access targeted analytes and adequate levels of sensitivity to them on irregular surfaces. Herein, silver (Ag) nanoparticles are deposited onto cotton fabric through magnetron sputtering to develop a flexible and ultrasensitive SERS-active substrate. To obtain a better enhancement effect, Ag nanoparticles of different sizes are produced by controlling the argon flow rate and the sputtering time. The finite-difference time-domain (FDTD) method and Raman mapping are used to explain the process behind Raman signal enhancement. The cotton fabric sample with Ag nanoparticles deposited at an argon flow rate of 200 sccm (labelled as AC-200) shows a high enhancement factor (EF) of 104 with a Methylene blue (MB) solution of 10−3 M, stability with a related standard deviation (RSD) of 1.03%, excellent reproducibility with an RSD of 1.92% and high sensitivity with 10−9 M of MB solution. Therefore, AC-200 demonstrates exceptional SERS signal reproducibility and stability for different types of chemical analytes and has the potential to be used in future practical applications.
Introduction
Surface enhanced Raman scattering (SERS) is currently a promising technique due to its ability to rapidly detect single molecules. SERS has been widely used to determine food safety [1], detect environmental pollutants [2], and in analytical applications [3]. The conventional Raman methods used to detect analytes are usually lacking in sensitivity, unstable and time-consuming, thus advancements in SERS have significantly improved the efficiency of detecting analytes. SERS can be enhanced mainly through electromagnetic enhancement (EM), which is derived from the excitation of localized surface plasmon resonance (LSPR). LSPR is the collective oscillation of conduction band electrons, which takes place as a result of the interaction between electromagnetic waves with noble metal nanoparticles on the surface of substrates [4]. Conventionally, noble metals such as gold (Au) and silver (Ag) have played a dominant role as enhancement materials in SERS applications, mainly due to the contribution of LSPR to signal enhancement [5–9]. Zhang et al. [3] reported that EM is almost uniform across the smooth surface of a metal-nanoparticle thin film, which makes noble metals potential materials in SERS applications. Semiconductor materials such as iron III oxide (Fe2O3) [4,10], titanium oxide (TiO2) [11,12], and copper (I) oxide (Cu2O) [13,14] are also becoming more subjects of interest in research work related to SERS-active substrates. Compared to noble metals, these chemical compounds which are used as semiconductor materials have the advantages of chemical stability, higher band gap and better resistance to degradation [11]. However, their signal enhancement is mainly attributed to the charge-transfer principle, thus enhancing signals only 10 to 100 times, which is far lower than the enhancement of the noble metals which ranges from 4 to 11 orders of magnitude [15]. Thus, the use of chemical compounds has been limited. Other SERS-active materials such as graphene [3,16] and hybrid nanocomposites, including Au-Ag nanospheres [7], Ag-Cu2O/reduced graphene oxide nanocomposites [13], and Fe3O4@Ag magnetic nanoparticles [17] have also been investigated to obtain ideal SERS performance.
Conventionally, the base of SERS substrates is rigid and flat in shape, such as silicon wafers and glass slides, which are usually non-portable, expensive, and inappropriate for collecting and detecting target analytes on an irregular surface. Recently, emerging soft and flexible materials have been introduced as SERS substrates [3,18] such as paper, cotton, and polymer materials, which significantly contribute to practical applications. Xu et al. [19] fabricated silver/hematite/silicon dioxide (Ag/α-Fe2O3/SiO2) fibers into a flexible SERS-active substrate with an enhancement factor (EF) of 4.71 × 10⁵ and sensitivity of 10−15 M. The substrate also demonstrated exceptional flexibility when collecting thiram, a fungicide used on vegetables. Chen et al. [20] deposited Ag nanoparticles onto cellulose nanofibers (CNFs) to detect flusilazole residues (a pesticide) in Oolong tea, and the resultant substrate has a detection limit of 0.5 mg/kg. Compared to conventional rigid SERS substrates, flexible textile-based substrates provide more advantages in practical applications.
The fabrication of SERS-active substrates is also an important part of SERS studies, since they could contribute to substantial enhancements in signal intensity, stability and uniformity. To date, various methods have been investigated to fabricate uniform and stable SERS substrates, such as electrochemical deposition [21], chemical vapor deposition [22], lithography [23] and colloidal solution methods [24]. Recently, magnetron sputtering has been widely used in fabricating high-quality thin films [25–28]. Compared to conventional methods, magnetron sputtering facilitates excellent adhesion between metal nanoparticles and the base substrate, which results in excellent stability and reusability of metal-coated substrates [4]. Besides, this technique is easier to carry out and more environmentally friendly. Therefore, magnetron sputtering is an ideal method to fabricate SERS-active substrates. In this study, Ag is used as the enhancement material and deposited onto cotton fabric samples through magnetron sputtering to fabricate SERS active substrates. The argon flow rate is controlled to obtain Ag-coated cotton substrates with different sizes of Ag nanoparticles. The fabricated substrate offers not only good EF and limit of detection (LoD), but also excellent stability, reproducibility and universal applicability.
Experimental
Materials
Commercial grade Ag (purity: 99.99%) which was used as the target was purchased from Zhongnuo Advanced Material Technology Co., Ltd. (China). Plain woven cotton was used as the samples (40 s × 40 s, 100 × 70 pick/inch). Ethanol (CH3CH2OH) was purchased from Shanghai Titan Scientific Co., Ltd. Methylene blue (MB, C16H18ClN3S), Malachite green (MG, C23H25N2), Rhodamine 6G (R6G; C28H31N2O3Cl), Rhodamine B (RhB; C28H31ClN2O3) and thiram (C6H12N2S4) were purchased from Shanghai Aladdin Biochemical Polytron Technologies Inc.
Fabrication of Ag-coated cotton
The cotton fabric samples were immersed into an ultrasonic bath with ethanol for 45 min, and then rinsed 5 times with distilled water. Then they were dried in an oven at 60 °C for 12 h. One of the dried cotton fabric samples was left untreated and labeled UC (untreated cotton) as the contrast sample, and was not sputtered with Ag nanoparticles.
After the pretreatment process, the cotton samples were magnetron sputtered with the Ag target. Different argon flow rates were set to acquire different Ag grain sizes, and the sputtering time was controlled to obtain Ag films with the same thickness of 100 nm [29,30]. To do so, Ag was initially deposited onto the cotton samples with the glass slides together at different argon flow rates for 5 min, and then three selected areas on each glass slide were measured to determine the thickness of the Ag film by using a Bruker DektakXT surface profiler. The deposition rate was determined by dividing the film thickness by the deposition time, i.e., 5 min, at argon flow rates of 80 sccm, 120 sccm, 160 sccm, 200 sccm, and 240 sccm. As such, the deposition rates were calculated to be 10.75 nm, 6.95 nm, 5.70 nm, 4.75 nm and 3.35 nm per minute, respectively. Accordingly, the deposition time for the corresponding samples was set to be 9 min and 18 s, 14 min and 24 s, 17 min and 30 s, 21 min and 6 s, and 42 min and 36 s, to obtain Ag films with a thickness of 100 nm. Then the Ag-coated cotton samples were labeled as AC-80, AC-120, AC-160, AC-200, and AC-240 to denote corresponding argon flow rates of 80 sccm, 120 sccm, 160 sccm, 200 sccm, and 240 sccm, respectively. Figure 1 shows the schematic diagram of the deposition process for the Ag-coated cotton fabric samples. The Ag target was sputtered by using a VERG-500 radio frequency power supply. The cylindrical sputtering chamber used has a diameter of 350 mm and height of 400 mm. The vacuum molecular pump (F-250/1500, KYKY TECHNOLOGY CO., LTD.) has a rotation speed of 21,000 r/min. The base pressure was monitored by using a vacuum gauge (ZDF-X-LED, Cheng Du Zheng Hua Co., Ltd.). The other deposition parameters are listed in ESM Table S1.

Schematic diagram of the deposition process and Raman signal detection.
Characterization
The surface of the prepared Ag-coated cotton samples was observed by using a field emission scanning electron microscope (FESEM, TESCAN MAIA3) in the secondary electron image mode with an acceleration voltage of 5 kV. The crystallinity of the samples was examined with an X-ray diffractometer (XRD, Rigaku Smart Lab). The process was conducted with the X’celerator in the normal mode with Cu Kα radiation (λ = 0.154 nm) (45 kV at 200 mA). Details of the crystal structure were collected at a 2θ angle that ranges from 10° to 70° with a scanning step of 0.02° and a scanning rate of 10°/min. The diameter of the particles was measured by using Nano Measurer, a commonly used size statistics software at the micro-nano scale. The Raman scattering experiments were carried out by using a NomadicTM Raman 3-in-1 microscope with excitation lasers of 532 nm and 785 nm. The laser beams were operated at power levels of 50 mW and 200 mW, respectively, and focused onto a region with a diameter of 2.6 μm to excite the samples through 10× objective lens (OLYMPUS MPlanFLN). The acquisition time under a 532 nm laser was 2 seconds and under a 785 nm laser was 4 seconds during the Raman measurement.
Results and discussion
Characterization of Ag-coated cotton fabric
Optical microscope (OM) and scanning electron microscope (SEM) imaging of the UC and Ag-coated cotton fabric samples were carried out to observe their morphological changes. In Figure 2, Row (1) denotes the SEM images magnified 30.0 kx, Row (2) the SEM images magnified 3.0 kx, and Row (3) the optical images. Therefore, Figure 2(a1) to (a3) are the UC images, and Figure 2(b1) to (b3), (c1) to (c3), (d1) to (d3), (e1) to (e3), and (f1) to (f3) are the AC-80, AC-120, AC-160, AC-200 and AC-240 images, respectively. Row (1) shows the deposition of the nanoparticles onto the surface of the cotton fibers at the different argon flow rates as shown in Figure 2(b1) to (f1). The nanoparticles deposited on the surface of AC-200 and AC-240 are more obvious, pointing to Ag with a larger grain size, which may result from the increase in energetic ion bombardment [31]. In Row (2), there are some narrow grooves on the surface of the UC fibers, and the corners of these fibers is sharp in shape. However, the surface of the UC fibers becomes smoother with a constantly increasing sputtering time, and their corners and edges become relatively blunt, which is because a film of Ag is now covered on the surface, see Figure 2(a1) to (f2). Finally, the optical images in Row (3) or Figure 2(a3) to (f3) show that the color of the samples change from white to metallic grey after the sputtering process, which corresponds to the color of Ag.

OM and SEM images: (a1)–(a3): UC, (b1)–(b3): AC-80, (c1)–(c3): AC-120, (d1)–(d3): AC-160, (e1)–(e3): AC-200, and (f1)–(f3): AC-240.

XRD spectra of untreated cotton and Ag-coated cotton fabric samples.
To further prove that the nanoparticles are Ag, the crystal structure of the samples was examined and the results are shown in Figure 3. The diffraction peaks of the Ag-coated cotton fabric samples at 2θ of 14.9°, 16.7°, 22.8° and 34.6° correspond to the (1 0 1), (1 0 1), (0 0 2) and (0 4 0) lattice planes of cellulose I [30,32], which is the chemical compound of cotton, as shown in the UC’ XRD spectrum. Compared to UC, the diffraction peaks at 38.1°, 44.3° and 64.4° in the spectra of the Ag-coated cotton fabric correspond to (1 1 1), (2 0 0) and (2 2 0), which are Ag lattice planes in accordance with PDF#04-0783 respectively, thus indicating that the nanoparticles are Ag, and Ag has been successfully deposited onto the cotton fabric.
SERS performance of Ag-coated cotton substrates
After the Ag nanoparticles were successfully deposited onto the cotton fabric, the Raman signal intensity was tested and the MB dye was used as the probe molecules. The 10−3 M of MB solution of 5 μL was dripped onto the surface of the cotton fabric samples. A 532 nm laser beam was focused onto a specific area on the fabric surface, and then the Raman signals that emitted from this area were collected. As shown in Figure 4(a) to (c), the Raman signal intensity of 10−3 M of MB on the UC sample is very low, which is only 832.18 counts. Compared to the UC sample, the Raman signals of the Ag-coated cotton fabric samples are significantly enhanced. As the argon flow rate is increased, the signal intensity continues to increase, possibly due to the aggregation of the Ag nanoparticles on the surface of the samples. Then the Raman signal starts to decrease when the argon flow rate exceeds 200 sccm. With a signal intensity of 26,700.41 counts, AC-200 provides the highest SERS enhancement among all of the samples in this study. The Raman spectra of the untreated cotton and AC-200 are provided in ESM FS1 for comparison purposes.

Raman spectra of 10−3 M MB molecules deposited onto: (a) UC, (b) and (c) Ag-coated cotton fabric samples at different argon flow rates, (d) Enhancement factor of AC-80, AC-120, AC-160, AC-200 and AC-240, and (e) and (f) Raman intensity of 10−10 M to 10−3 M MB solution deposited onto AC-200.
To further evaluate the Raman enhancement effect of the Ag-coated samples, 10−3 M of MB solution was used as the molecule probe to estimate the EF, which is one of the most important indicators of SERS performance, and is calculated by using equation (1):


In addition to the EF, the LoD is another crucial indicator in evaluating SERS performance, which is usually used to denote the sensitivity of SERS substrates. AC-200 was again used to examine the detection sensitivity. Different concentrations of MB solution that ranged from 10−10 M to 10−3 M with a volume of 5 μL were deposited onto the surface of AC-200, and their Raman spectra were obtained. As shown in Figure 4, the signal intensity of the MB molecules on AC-200 is greatly enhanced. The Raman signal could be detectable with a signal intensity of 7007.46 counts even at a low concentration of 10−9 M, which proves that AC-200 has excellent detection sensitivity. As the concentration of the MB solution is decreased to 10−10 M, the characteristic signal peak of MB molecules at 1624 cm−1 cannot be detected, indicating that the LoD of AC-200 is 10−9 M.
Mechanism of Raman enhancement
SERS enhancement is mainly attributed to enhancements of the electric field, which originates from LSPRs. They are generally related to the localized collective oscillation of the conduction electrons, and take place when laser electromagnetic waves excite the nanoparticles. Zong et al. [15] reported that the resonance frequency mainly depends on the size, shape, and uniformity of SERS nanoparticles, which can directly affect the electric field distribution, thereby affecting the SERS enhancement of the probe molecules. Thus, five different Ag-coated fabric samples were obtained by controlling the argon flow rate and the sputtering time during magnetron sputtering. Highly magnified SEM images are shown in Figure 5(a) to (e), which show the overall size, shape and uniformity of the Ag nanoparticles. Figure 5(f) shows the mean size of the nanoparticles deposited with different argon flow rates, and details of the grain size distribution are provided in ESM FS2, which also reflect the uniformity. Uniformity in this study is defined as the diameter range of grain size, which can influence the roughness of the film surface, then further effect the SERS activity, as reported by Zong et al [15]. The smaller the diameter range, the less difference the nanoparticles’ size, and the size of the nanoparticles is more uniform. From ESM FS2, we can see that as the argon flow increases, the uniformity decreases correspondingly. The diameter range of grain size increases from 15 nm (35 minus 20) of AC-80 to 66 nm (87 minus 21) of AC-240. It can also be observed from Figure 5 that there is no obvious change in the shape of nanoparticle. Therefore, it could be concluded that as the argon flow rate is increased, the size of the Ag nanoparticles continues to increase, but the uniformity of the grain size is reduced at the same time. This could explain the Raman signal enhancement trend, which increases at first because of the increase in grain size, and then declines due to the reduced uniformity of the Ag nanoparticles, as the argon flow exceeds 200 sccm. With an average nanoparticle size of 45 nm, AC-200 again shows the optimal SERS performance among all Ag-coated cotton fabric samples.

SEM images of Ag nanoparticles: (a)–(e) AC-80, AC-120, AC-160, AC-200 and AC-240, and (f) mean size of Ag nanoparticles under different argon flow rates.
To better understand the SERS distribution on the surface of AC-200, Raman mappings were used to directly show the level of signal enhancement. The optical image of a locally amplified scanning area is shown in Figure 6(a). The blue to red color bar of the Raman spectra in Figure 6(b) and (c) represents the increase in signal enhancement, and shows that the SERS intensity ranges from 0 to 26,700.41 counts. Then the FDTD method is used with AC-200 to simulate the electric field between two nanoparticles, as shown in Figure 6(d). The blue to red color bar indicates the increase of the electric field. The high SERS intensity is caused by the increased electric field that is focused onto the surface of the nanoparticles, which leads to an overall enhancement of signal intensity on the surface of the Ag coated samples.

(a) Optical image of scanning area, (b) 2-dimension Raman mapping of AC-200, (c) 3-dimension Raman mapping of AC-200, and (d) simulated electric field distribution between two Ag nanoparticles in x-y planes.
SERS signal reproducibility and stability of AC-200
Stability and reproducibility are also important factors that are used to evaluate the SERS performance in practical applications. Therefore, 5 μL of MB solution with concentration of 10−3 M was dripped onto the surface of AC-200, and the Raman signal at 1624 cm−1 was collected 10 times at an interval of 1 min. Meanwhile, MB with a concentration of 10−9 M was also used to examine the stability of AC-200 when probe is in low concentration. From Figure 7(a), we could see that the SERS intensity slightly fluctuates from 26,001.77 to 26,890.59 counts. With a relative standard deviation (RSD) of 1.03%, the substrate demonstrates good stability when detecting MB probe with a concentration of 10−3 M. As the concentration of MB solution drops to 10−9 M, the signal intensity drops correspondingly as shown in Figure 7(b). At the same time, the RSD of stability decreases to 27.56%.

Stability and reproducibility of AC-200: (a) Raman signal intensity collected 10 times at intervals of 1 min with MB concentrations of 10−3 M, (b) Raman signal intensity collected 10 times at intervals of 1 min with MB concentrations of 10−9 M, (c) RSD of stability, (d) Raman signal intensity on 10 areas of samples with MB concentrations of 10−3 M, (e) Raman signal intensity on 10 areas of samples with MB concentrations of 10−9 M, and (f) RSD of reproducibility.
To assess the reproducibility of AC-200, 10 different areas of AC-200 were selected and deposited with 5 μm 10−3 M and 10−9 M of MB solution respectively. Then their Raman spectra were obtained and the results are shown in Figure 7(d) to (f). The SERS signal intensity with probe concentration 10−3 M ranges from 25,559.56 to 27,471.72 counts. AC-200 shows excellent reproducibility for MB solution of 10−3 M with an RSD of 1.92%. But the RSD of reproducibility is decreased to 13.65% when detecting MB probe with a concentration of 10−9 M.
Reusability
The reusability of substrates is also investigated in this study and AC-200 was used as a substrate. The sample has a dimension of 2 cm×2 cm. After evenly coated through immersion into 10−3 M of MB solution for 2 min, AC-200 was subjected to 25 coating and washing cycles. Then, the sample was rinsed with 500 mL of distilled water for 5 min, followed by washing in a 60% ethanol solution for 10 min to remove the residual MB molecules. AC-200 was rinsed with distilled water again and dried in oven at 60 °C for 10 min. This entire process is defined as one cycle.
The Raman signals of the washed AC-200 were tested (see ESM FS3), before it was coated with the MB solution, to ensure that the MB molecules were thoroughly washed off and would not affect the test results. The untreated cotton fabric sample and AC-200 were directly observed with an SEM without gold sputtering first, to determine whether there is any flaking of the Ag film on AC-200. SEM imaging at a magnification of 200 x was conducted after 0, 5, 10, 15, 20 and 25 washings. As shown in ESM FS4 (a), the bright fabric represents AC-200 coated with a thin layer of Ag film, and the dark fabric represents the untreated cotton fabric.
It can be observed in ESM FS4 (b)-(g) that the surface of AC-200 is coated with a thin film, and the film can be kept intact after 15 washing cycles. However, after more washing cycles, the Ag film gradually flakes off from the sample as shown in ESM FS4 (f) and (g). The Ag film slightly flakes off from AC-200 after 20 cycles of coating and washing, and AC-200 is severely damaged after 25 cycles of coating and washing. Based on these results, the Raman signals of the substrate were also collected after 0, 5, 10, 15, 20 and 25 washing cycles. Five random locations on AC-200 were selected each time, and the average intensities with error bars are shown in Figure 8(a). It can be observed that the Raman signals of AC-200 after 0, 5, and 10 washings are stable near 27,000 counts with slight fluctuations, which corresponds to the intact films shown in ESM FS4 (b) to (d). The signal intensity decreases to around 25,758.91 counts after 15 washing cycles. This might be attributed to the flaking of the Ag nanoparticles, which is not obvious to the naked eye in the SEM image in EMS FS4(e). After AC-200 was washed for 20 times, the Raman signal drops to around 24,500 counts, with a signal attenuation of 9.9%, which is still high and stable enough to detect the analytes. However, as the AC-200 substrate was washed for 25 times, the Ag films on the surface of the substrate was severely damaged as shown in EMS FS4(g), and the Raman signal was reduced to around 19,000 counts, with a high signal attenuation of 28%. Table 1 lists the results for five different Ag-coated SERS substrates reported by other researchers [32–36] along with AC-200 used in this study. Compared to the other Ag-coated substrates, AC-200 demonstrates a relatively high SERS detection sensitivity and exceptional reusability.
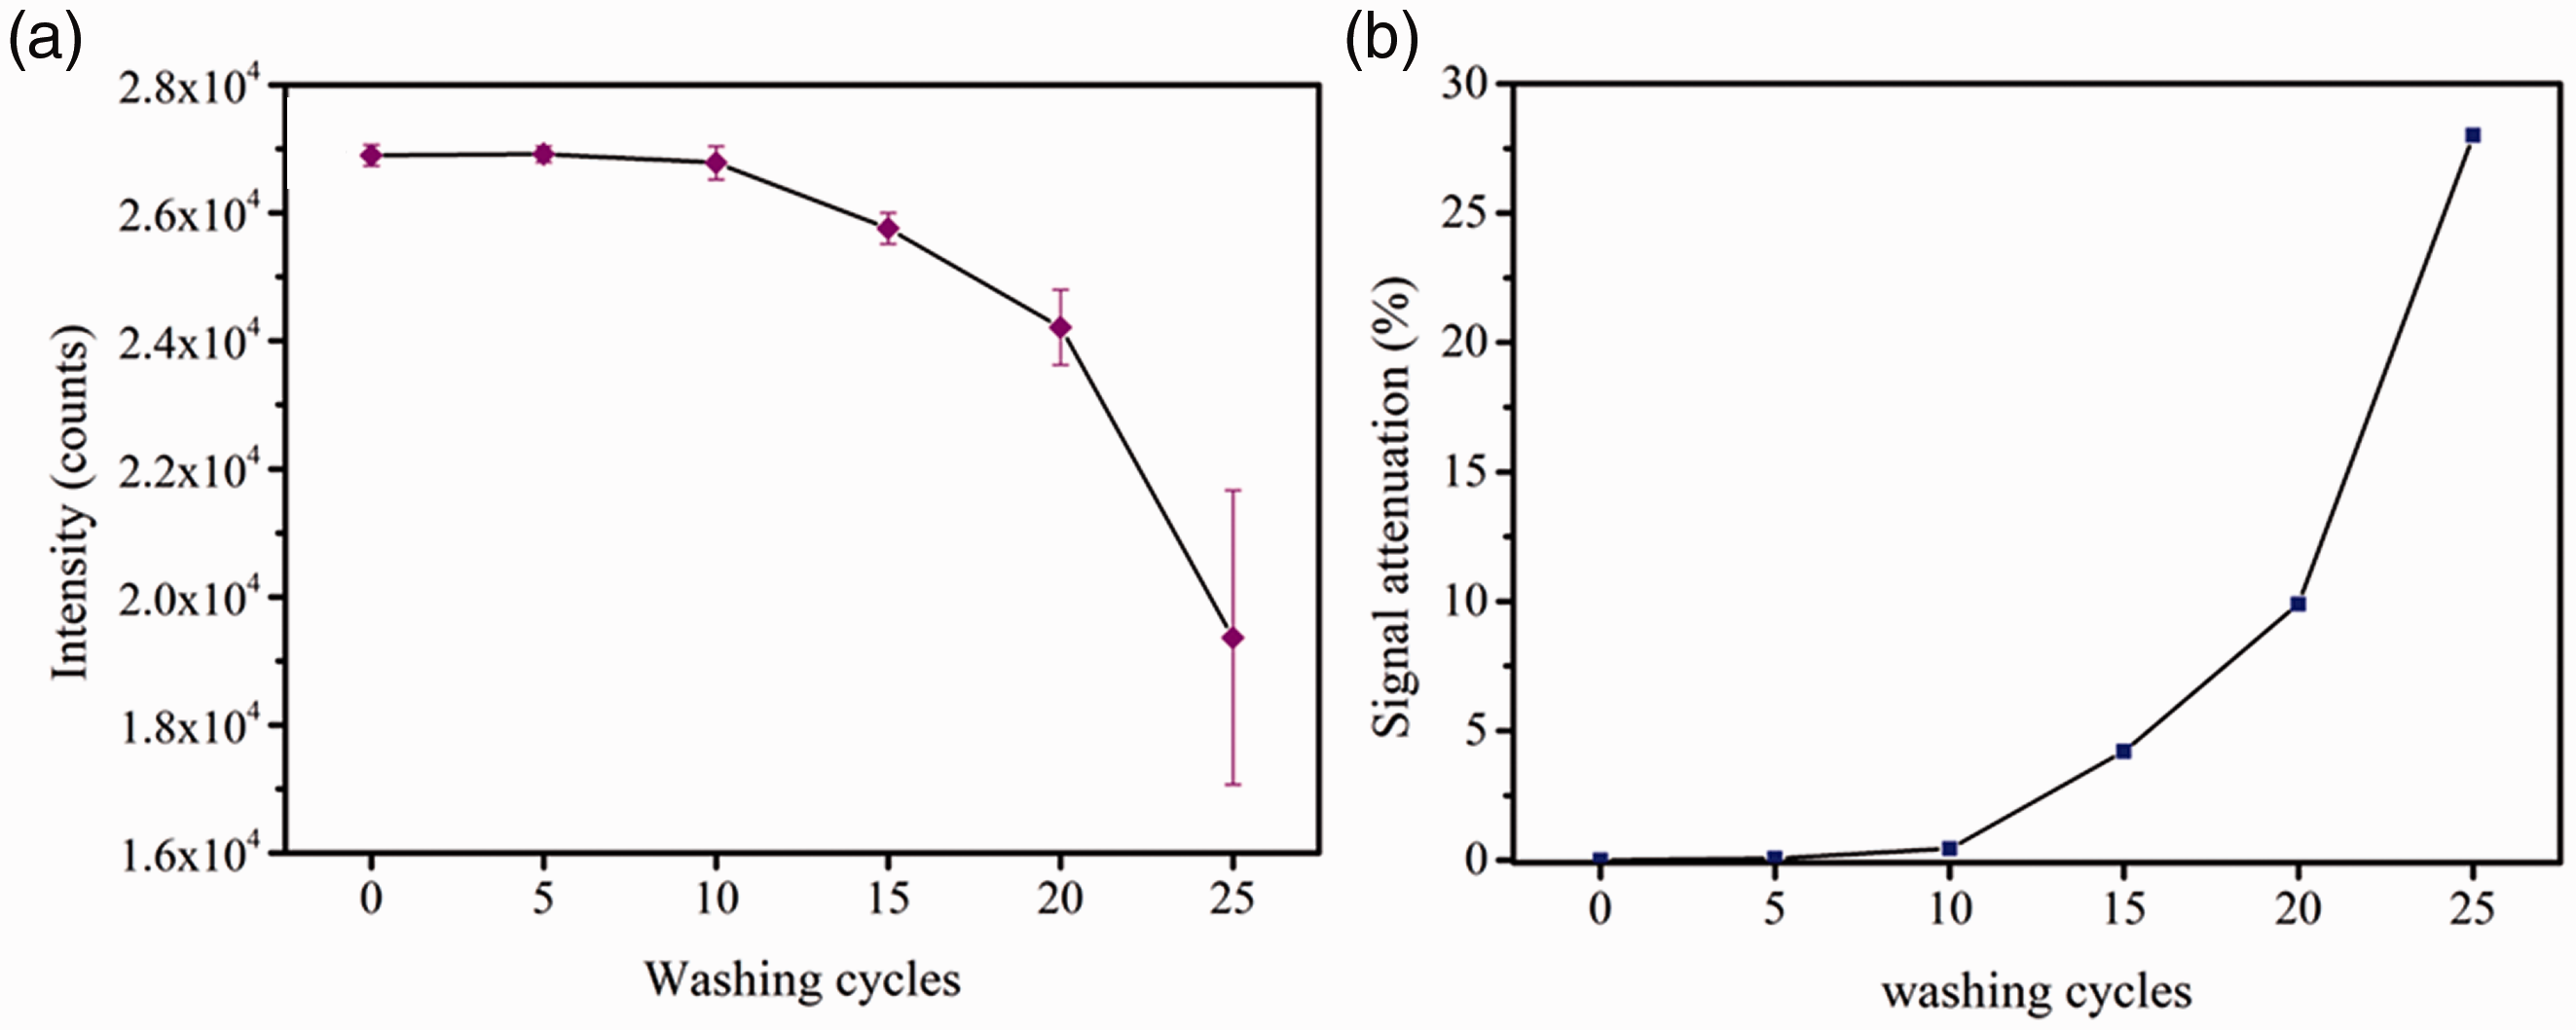
(a) Signal intensity of AC-200 with error bars and (b) signal attenuation after 0, 5, 10, 15, 20 and 25 washing cycles.
AC-200 vs. other Ag-coated SERS substrates.

MB: methylene blue; R6G: rhodamine 6G.
Application
For the practical use of SERS-active substrates, one of the most important challenges is to determine whether the substrate can be used for different analytes and in different situations. Herein, four substances were used as the probe molecules, including MG (C23H25N2), R6G (C28H31N2O3Cl), RhB (C28H31ClN2O3) and thiram (C6H12N2S4) with a concentration of 10−3 M, and were dripped onto the surface of the UC and AC-200 samples, respectively. Their Raman spectra were collected under a laser beam of 785 nm, and the results as well as their molecular structure are shown in Figure 9. The assigned vibrational peaks of these four types of probe molecules are provided in ESM Table S2. It can be observed that the signals of all of the probe molecules on AC-200 are significantly enhanced compared to those on UC, thus indicating that the enhancement effect of AC-200 extends to other chemicals and this substrate can be used in different conditions.
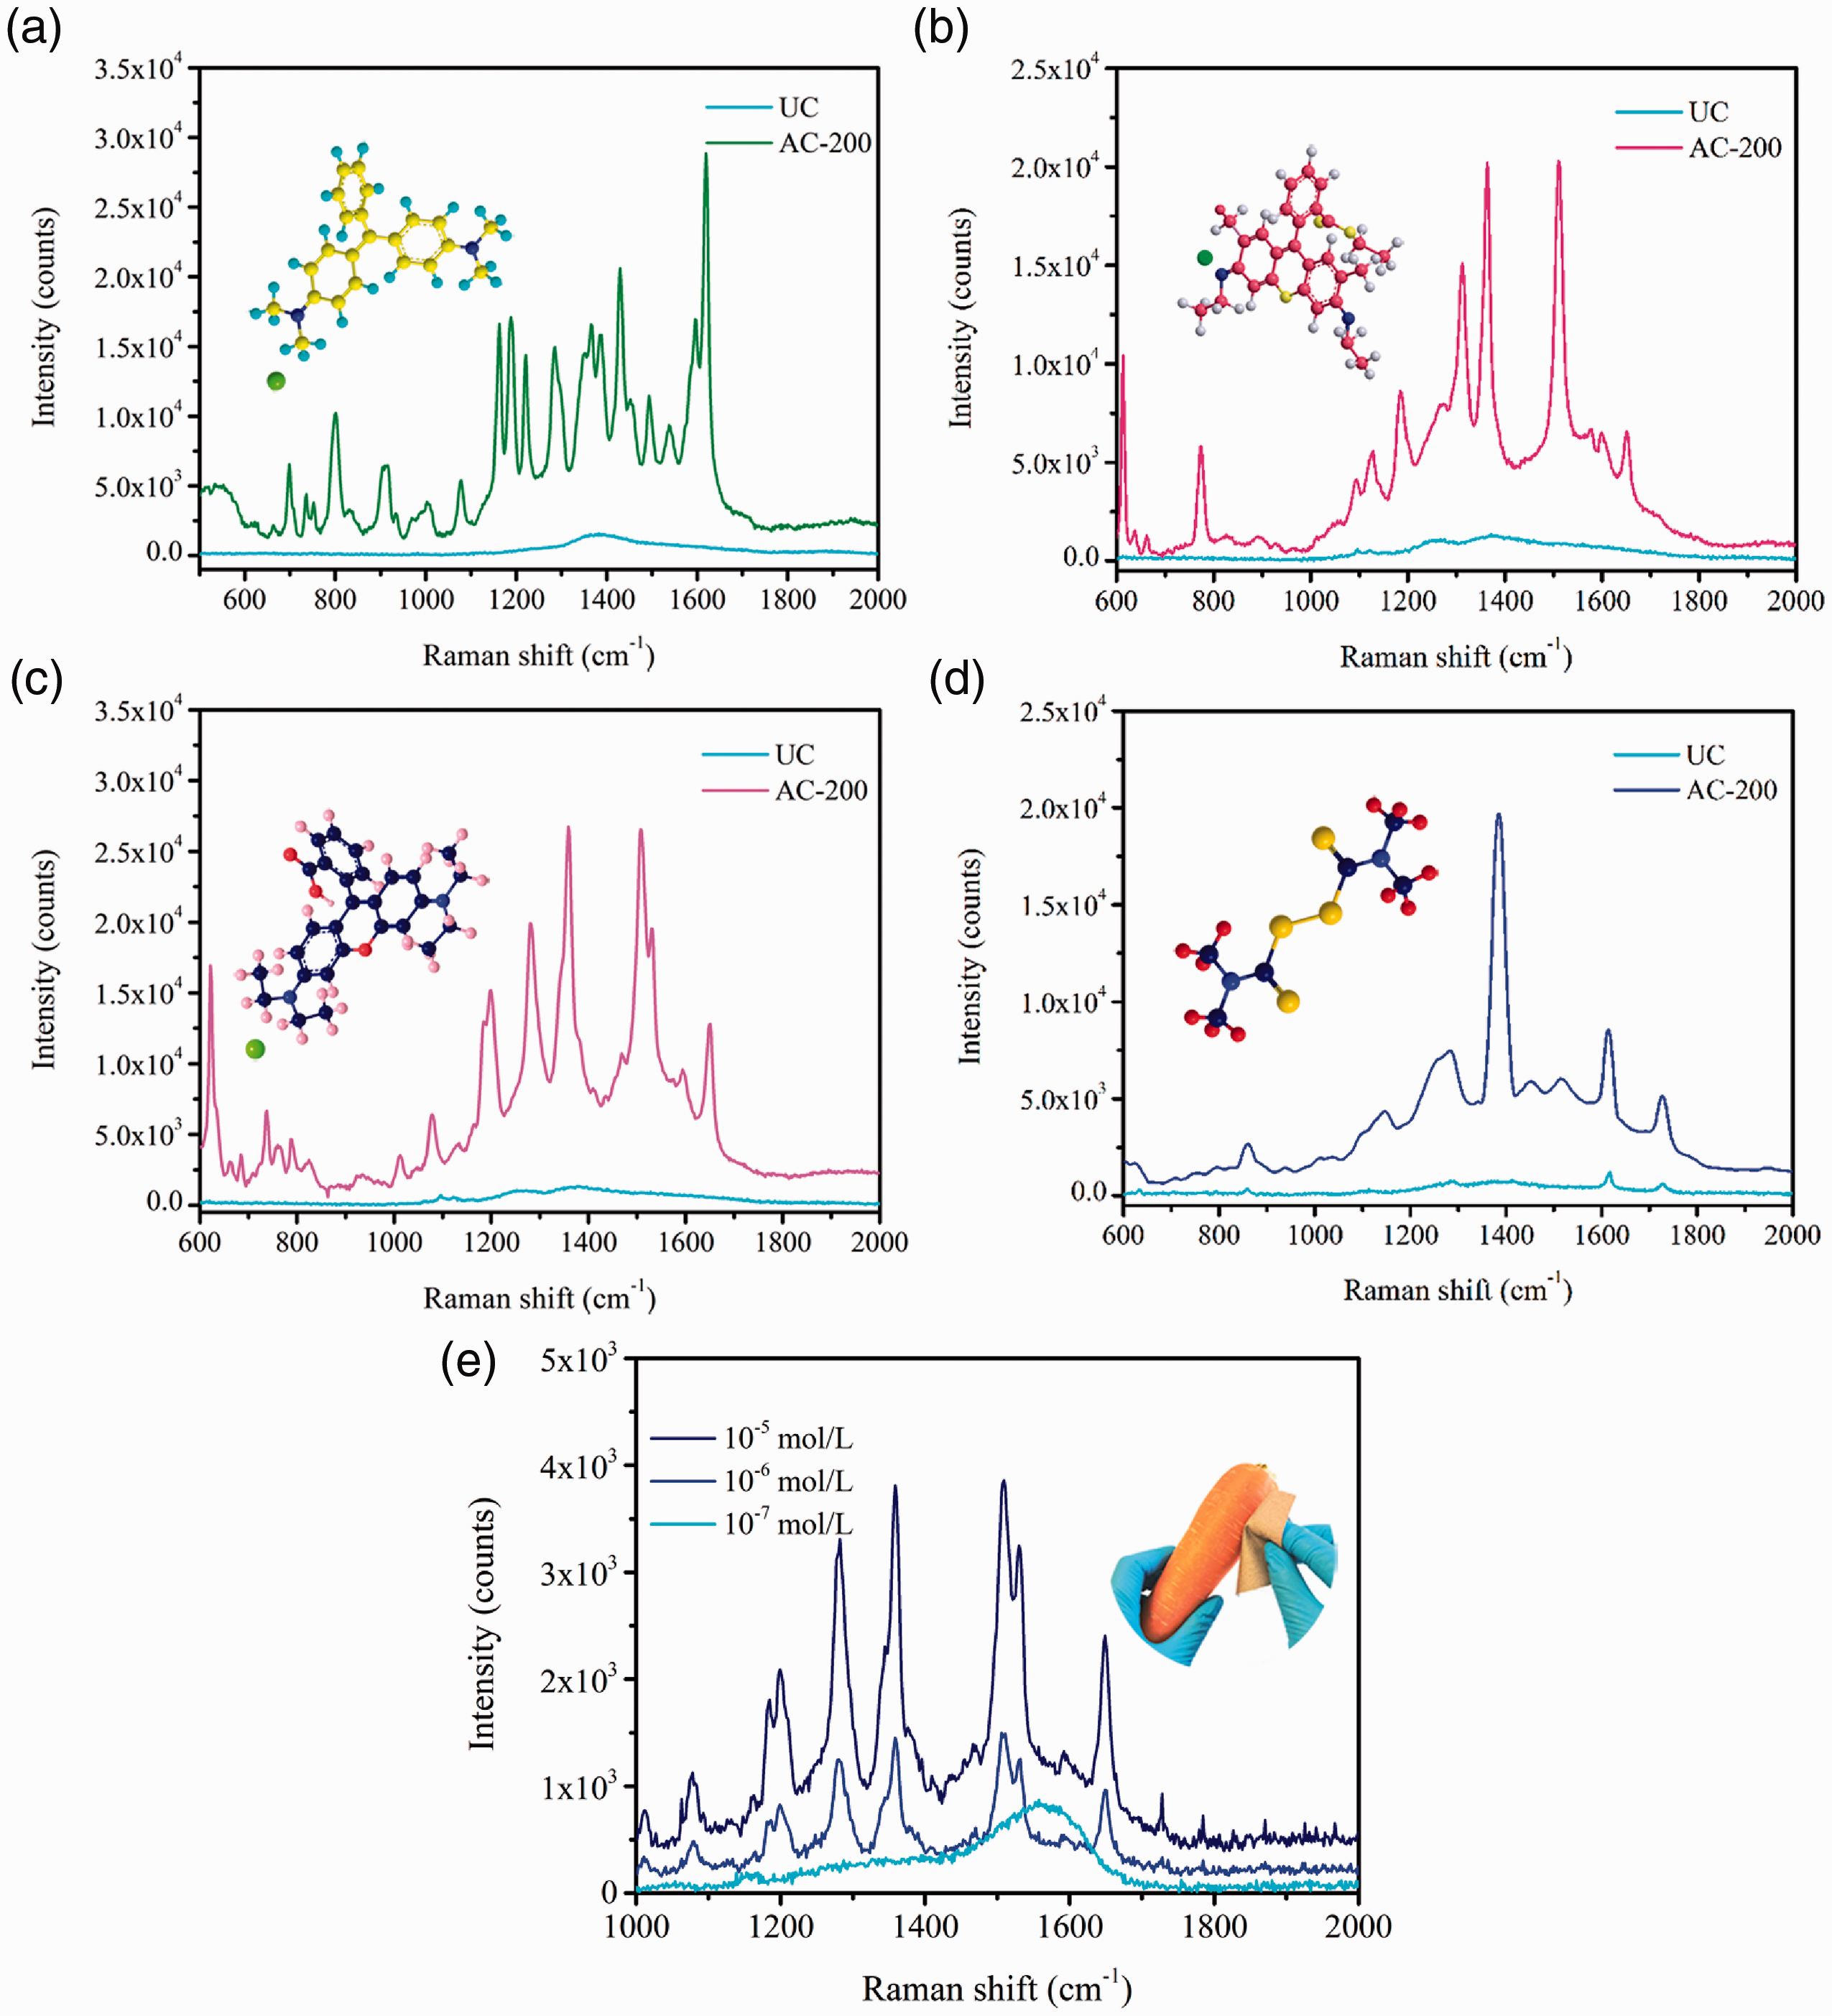
Raman spectra of UC and AC-200 deposited with (a) MG, (b) R6G, (c) RhB, (d) Thiram, and (e) Raman spectra of AC-200 deposited with RhB of different concentrations.
To further evaluate the practical applications of AC-200, RhB, which is an important ingredient in pesticides, was sprayed onto the surface of a carrot at concentrations of 10−5 M, 10−6 M and 10−7 M. The Raman signal of RhB at 1359 cm−1, which caused by the aromatic stretch vibrations, was selected as the characteristic signal to assess the SERS performance. Then AC-200 was used to wipe off the RhB solution. The Raman signal intensity was collected and the results are shown in Figure 9(e). It can be observed that the Raman signal intensity at 1359 cm−1 could increase to 3,809.35 counts with an RhB concentration of 10−5 M. It can still increase to 1,448.57 counts even at a low concentration of 10−6 M. Besides, AC-200 shows exceptional flexibility when collecting RhB from the carrot which has an irregular surface. It can be folded and rolled in different shapes, and the RhB can be directly detected without the need for any further extraction processes, which means that AC-200 can be widely used in different conditions.
Conclusion
In conclusion, an ultrasensitive and flexible SERS substrate has been successfully fabricated through magnetron sputtering in this study to detect chemical residues on the surface of a carrot. Ag nanoparticles with different grain sizes are coated onto cotton fabric and the effect is systematically investigated. The study finds that Ag nanoparticles deposited at an argon flow rate of 200 sccm onto cotton fabric (i.e., AC-200) provide the most optimal performance among all of the different argon flow rates. There is also a high EF of 2.2 × 10⁴ with 10−3 M of MB solution, excellent sensitivity of 10−9 M, and good reusability based on 20 washing cycles. AC-200 can also be used to detect different chemicals, thus indicating that this Ag-coated cotton SERS substrate has wide practical uses.
Supplemental Material
sj-pdf-1-jit-10.1177_15280837211027781 - Supplemental material for Ag-coated cotton fabric as ultrasensitive and flexible SERS substrate
Supplemental material, sj-pdf-1-jit-10.1177_15280837211027781 for Ag-coated cotton fabric as ultrasensitive and flexible SERS substrate by Xueyan Bian, Jiangtao Xu, Yi Pu, Jing Yang, Ka-lam Chiu and Shouxiang Jiang in Journal of Industrial Textiles
Footnotes
Declaration of conflicting interests
The author(s) declared no potential conflicts of interest with respect to the research, authorship, and/or publication of this article.
Funding
The author(s) disclosed receipt of the following financial support for the research, authorship, and/or publication of this article: This work is supported by The Hong Kong Polytechnic University research funding (P0031415).
Supplemental Material
Supplemental material for this article is available online.
References
Supplementary Material
Please find the following supplemental material available below.
For Open Access articles published under a Creative Commons License, all supplemental material carries the same license as the article it is associated with.
For non-Open Access articles published, all supplemental material carries a non-exclusive license, and permission requests for re-use of supplemental material or any part of supplemental material shall be sent directly to the copyright owner as specified in the copyright notice associated with the article.