
Abstract
Over 110 million tonnes of textile fibres and apparel are produced annually, ultimately ending with significant quantities of waste textiles. One route for upcycling end-of-life textiles is to repurpose the materials for atmospheric carbon dioxide (CO2) removal by integrating microalgae (single celled photosynthetic organisms) to form ‘living’ biocomposites. In this study we demonstrate the CO2 capture performance of prototype living algae biocomposites that use textiles as a solid substrate. Chlorella vulgaris was attached to 100% cotton and 100% polyester sheets, of which half were coated with kappa-carrageenan (a natural polymer derived from seaweed) as a gel topcoat to enhance microalgae retention. The biocomposites were investigated in 28 days semi-batch CO2 absorption tests using a 5% v/v CO2/air gas mixture. They absorbed significantly more CO2 than suspension microalgae culture controls, with the highest CO2 absorption rate being 1.82 ± 0.10 g CO2 g−1biomass d−1 from the coated cotton biocomposites, followed by 1.55 ± 0.27 g CO2 g−1biomass d−1 from the uncoated cotton biocomposites. The coated and uncoated polyester biocomposites had comparatively lower CO2 absorption rates (0.49 ± 0.04 and 0.42 ± 0.03 g CO2 g−1biomass d−1 respectively), likely due to the surface charges of the materials affecting microalgae adhesion and retention. A two weeks attachment test on cotton/polyester blends revealed some deterioration of the cotton which could limit the longevity of the biocomposites. Despite these issues, the CO2 abatement values compare favourably with other Chlorella CO2 capture studies with the added benefit of much reduced water usage and a reduced land requirement.
Introduction
Annually, in excess of 110 million tonnes of apparel and textiles are manufactured, yet the textiles industry still relies predominantly on a linear economy, and has been predicted to contribute up to 26% of the world’s carbon budget by 2050 [1]. Over two thirds of manufactured textile ends up in landfill with only around 15% recycled [2]. Upcycling disposed textiles would reduce the quantity of textile waste sent for landfill or incineration by extending the end-of-life period. One approach to extend the service life of textiles would be to repurpose them as vehicles to remove carbon dioxide (CO2) from the atmosphere and from industrial emission streams. This can be achieved with a nature inspired solution that we term ‘living biocomposites’. These hybrid materials utilise the textiles as a structural scaffold to support and retain unicellular photosynthetic microorganisms (e.g. microalgae) enabling them to capture and store CO2 within their cells.
Many microalgae are capable of efficient photosynthetic carbon fixation, potentially removing 1.83 kg of CO2 for every 1 kg of microalgae biomass produced [3]. The practical aspects of this carbon capture potential have been explored for carbon sequestration [4–8]; however, the very nature of suspension based cultivation techniques—growing microalgae in either ponds or photobioreactors (PBR)—presents a major techno-economic bottleneck. Conventional suspension-based cultivation systems typically have large land footprints, require substantial quantities of water, have high maintenance burdens, and are prone to contamination by competing and/or infectious microbes [9–12]. Additionally, limitations on CO2 mass transfer between the gas-liquid phases in ponds and PBRs further limits process efficiency [13,14].
Alternative approaches to suspension cultivation, primarily based on cell immobilisation or engineered biofilms [15] are showing promise for certain applications, wastewater bioremediation for example [16–21]. However, the development of biofilms for CO2 capture are in their infancy [6,22–24], most biofilms are designed to maximise biomass production rather than CO2 uptake. These systems, also known as biocomposites, typically immobilise microorganisms onto solid surfaces or within hydrogels. Hydrogels using substances extracted from natural sources such as alginate, carrageenan and chitosan have been shown to support enhanced photosynthetic performance relative to their suspension culture controls [25–27] and do not compromise their biological performance [25,28–30]. However, studies that randomly mix the cells within the hydrogel matrix generally suffer biomass loss over time, either driven externally through environmental degradation of the hydrogel structure or internally due to outgrowth and eventual escape of the microalgae. The application of hydrogels as a topcoat as opposed to the sole encapsulating matrix would represent a novel iteration of the hydrogel approach, similar to gel coating applications on food surfaces that prolong shelf life [31]. Of the various types of hydrogel, carrageenan has been extensively used to immobilise microalgae and other microorganisms because of its affordable price, with some studies reporting that the gel enhanced biological performance compared to other hydrogels (e.g. alginate) and suspended cell cultures [25,28–30].
A solid substrate to coat with cells and hydrogel is required to produce stable algae biocomposite systems. Several supporting materials (scaffolds), including various textiles, have been explored. Biocomposites made from cellulose based materials (i.e. cotton) tended to support improved cell attachment with increased biomass yield compared to other substrates [32–34]. Interestingly, Prasad et al. [35] found that cotton cloth was capable of preserving microalgae viability for up to 18 months, offering an intriguing opportunity to evaluate the potential of cotton-based biocomposites for sustained carbon capture applications; however, concern remains for cotton’s longevity in permanently wetted situations. A more robust textile, such as polyester cloth, may offer more confidence for long term operation. Indeed, polyester has previously been used for biofilm systems, including microalgae [36–38].
In the current study we evaluated the suitability of cotton and polyester materials for textile based microalgae (Chlorella vulgaris) biocomposites for upcycling textile wastes and carbon capture applications. Kappa-carrageenan was implemented as a topcoat to retain the microalgae on the textile substrate. We also investigated whether there was any effect of textile blends on natural immobilisation (i.e. without a topcoat) and whether biocomposite robustness could be improved.
Materials and methods
Textiles
Four polyester and cotton blends (100% polyester, 100PET; 80% polyester: 20% cotton, 80PET; 65% polyester: 35% cotton, 65PET; and 100% cotton, 100CO) were purchased from Aow RungRuang Co. Ltd (Bangkok, Thailand). These blends were only available by the same manufacturer and were chosen to investigate the surface properties of the blends with all of the textiles being plain weave structures. The textile sheets were washed with deionised water (dH2O), autoclaved at 125°C for a 15 mins cycle, oven dried at 105°C for 3 h and left in a desiccator for 24 h before use.
The weave structure and fibre density were characterised by scanning electron microscopy (SEM) using a Hitachi TM 3000 SEM. The sterile textiles were cut into 5 × 5 mm squares and attached to 12 mm diameter pin stubs using carbon tape and imaged at ×60 magnification. For side imaging, a sample was placed vertically against each side of a transparent acrylic cube (5 × 5 × 5 mm) that was attached to a pin stub with carbon tape and imaged at ×180 magnification. Images were analysed using ImageJ software to calculate yarn thickness (yarn being the spun thread comprising a number of material fibres), the number of fibres per yarn, fibre circumference, void space and surface area (Figure 1). The surface area (SA) was calculated using equation (1).

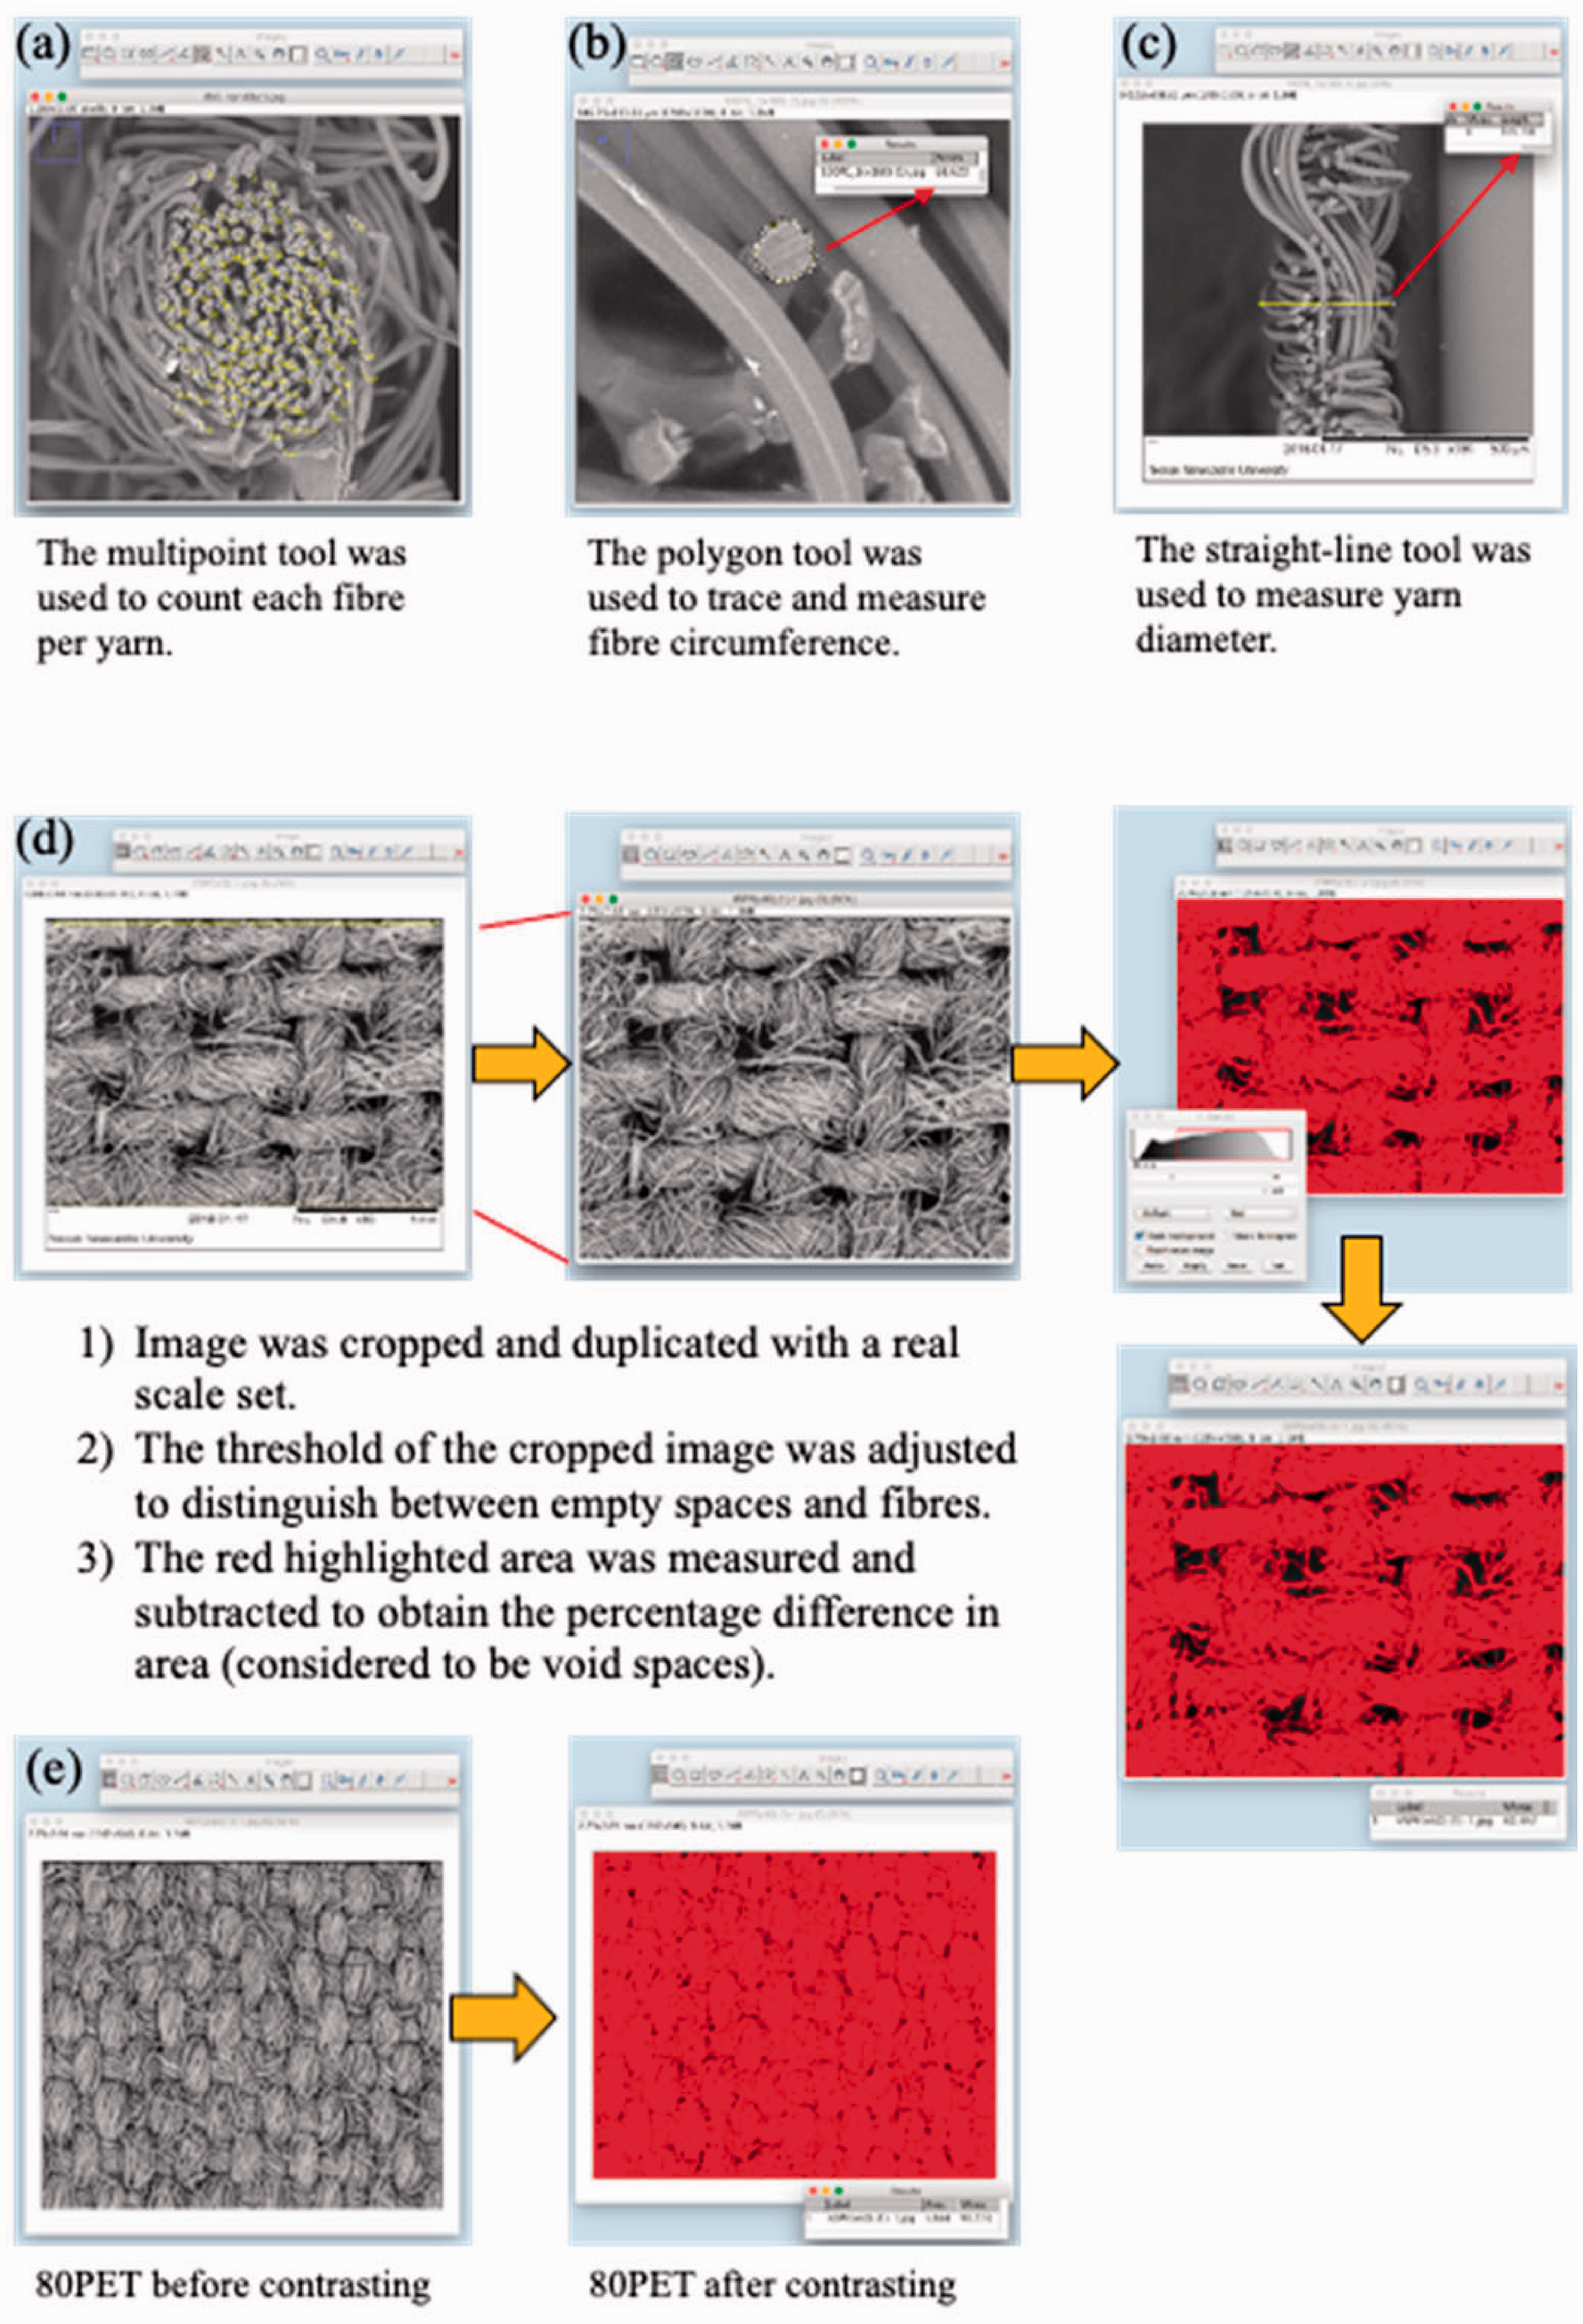
ImageJ analysis to determine: (a) number of fibres per yarn, (b) fibre circumference, (c) yarn thickness, (d) step by step definition of void space, and (e) an example of before and after contrasting of 80% polyester: 20% cotton (80PET).
Cultivation of microalgae
Chlorella vulgaris CCAP 211/63 was cultivated in BG-11 medium (containing 1.5 g/L NaNO3, 0.036 g/L CaCl2 · 2H2O, 0.075 g/L MgSO4 · 7H2O, 0.04 g/L K2HPO4 and 0.02 g/L Na2CO3; Sigma Aldrich, UK) in 10 L Nalgene polycarbonate carboys with a constant air supply from a KOI AIR 50 Blagdon aquarium pump. Cultures were maintained at 18 ± 2°C with a 16:8 h light:dark cycle with 2,500 lux (≈ 30.5 µmol m−2 s−1 [40]] of illumination provided by 30 W daylight-type fluorescent tubes (Sylvania Luxline Plus, n = 6).
Production of textile-based algae biocomposites
For the CO2 fixation trials only 100CO and 100PET were used. Sterile sheets of 100CO and 100PET (n = 12) were cut into strips (6 × 1 cm height × width) and weighed before being submerged in an algae suspension (250 mL) in a beaker with a lid, and gently stirred every two days for 14 days. After two weeks, the cells had attached to the textiles. Biomass dry weight of the attached algae was determined in weekly sacrificial sampling (n = 3) by oven drying the materials at 105°C for 3 h and leaving them in a desiccator for 24 h before re-weighed.
Half of the samples were subjected to a topcoat. The topcoat was made by mixing kappa-carrageenan powder (from >99.9% pure powder; Sigma Aldrich, UK) to obtain 0.0125 M in sterile dH2O at 50°C for 30 mins until homogeneous. Twenty milliliters of solution was poured onto the textile samples in a Petri dish and stored at 4°C for 1 h to accelerate the gelation process. The coated samples were removed from the gel solution and submerged in 0.5 M KCl (Sigma Aldrich, UK) for 1 h to strengthen the gel topcoat. A schematic of the production process is presented in Figure 2.

A schematic of textile biocomposite production and testing process under batch CO2 exposure for a period of 28 days.
CO2 absorption test and chlorophyll monitoring
The following CO2 absorption experimental procedure was modified from In-na, Umar [41]. Each 6 cm biocomposite sample (n = 3 per treatment) was placed in a 12 mL airtight vial and immersed to a depth of 1 cm in 400 µL of BG-11 medium. The suspension controls contained the equlivalent wet weight biomass incubated under the same conditions. No further nutrients were added throughout the experiment and no manual wetting of the biocomposites was conducted. Forty milliliters of 5% v/v CO2/air gas mixture was injected into each vial using a 60 mL airtight syringe. The samples were incubated under the same light and temperature conditions as the main microalgae cultures. The percentage of CO2 was measured in each vial every second day for 28 days by injecting 40 mL of extracted gas into a GeoTech G100 CO2 meter. The equivalent volume of 5% v/v CO2/air gas mix was then refreshed into the vial. CO2 fixation rate was calculated using equation (2), where MrCO2 is the molar ratio of CO2.
An estimation was made of the total number of immobilised cells using C. vulgaris cell size, based on the following assumptions: 1) all cells were of equal size (5 µm measured using a Leica DMi 8 microscope with LasX software), 2) the cells were attached uniformly as a single layer, 3) the cells had not attached between the yarn gaps, and 4) there was no cell division after attachment and coating. The chlorophyll a content of the immobilised cells was monitored every second day by placing the sample onto a glass microscope slide and measuring fluorescence in a FLUOstar Optima BMG LabTech fluorometer at an excitation of 430 nm.
To estimate the number of cells that had detached from the biocomposites and transported into the growth medium, 10 µL of the liquid medium of each replicate was sampled weekly and cell density determined at ×200 magnification using an Improved Neubauer haemocytometer. Cell density and the percentage of cells released was calculated using equation (3) [42]. In the calculation, it was assumed that cell division was negligible within the biocomposites under nitrogen depletion and once released into the media.

Natural attachment test on cotton, polyester and blends of cotton and polyester
Autoclaved textiles of all four types were cut into 1 cm2, weighed, and placed into a 24-multiwell plate. Two millilitres of algae culture was added into each well. For abiotic controls, 2 mL of BG-11 without algae was added. The plate was incubated for 14 days at the same light and temperature conditions as the algae cultures. The samples were gently agitated every two days using forward and reverse pipetting, and sacrificially analysed for chlorophyll a extraction and dry weight determination. The chlorophyll a extraction procedure was modified from Sartory and Grobbelaar, and Henriques et al. [43,44]. Samples were ground in a 1.5 mL Eppendorf tube using a micro pestle. One millilitre of 90% v/v ethanol solution was added to each tube, vortexed for 10 to 20 sec (Vortex Genie 2, Scientific Industries, Inc.), then heated at 78°C for 5 mins and left to stand for 24 h in the dark at 20°C. The supernatant was analysed for absorbance at 663, 645, 630 and 750 nm. The quantity of chlorophyll a per unit surface area (cm2) was calculated using equation (4) specifically for 90% ethanol solution, in which A is absorbance at a particular wavelength.

After the 14 day test, the samples were oven dried at 105°C for 1 h and left in a desiccator for 24 h before re-weighing. The percentage of material mass change was calculated using equation (5).

Statistical analysis
Minitab 18 was used for statistical analysis. Percentage data were arcsine transformed prior to analysis. Normality was tested using the Anderson-Darling test and equality of variance by the Levene’s test. Data that met the test assumptions were analysed by one-way analysis of variance (ANOVA), with Tukey’s test as a post-hoc analysis. The remaining data were analysed using the non-parametric Friedman test as they were repeated measures. The Wilcoxon sign ranked test was then used to determine significant differences among treatments, which is a common statistical test for comparing repeated measures in a pair [45].
Results and discussion
Characterisation of the textiles
pH varied significantly with the proportion of cotton in the blend, with higher cotton contents leading to increasing alkalinity (100PET = 6.21 ± 0.036, 80PET = 7.01 ± 0.027, 65PET = 7.15 ± 0.026, 100CO = 7.23 ± 0.019; Kruskal-Wallis: H = 19.88, DF = 3, P = 0.006; Table 1); the dH2O controls were more acidic than the textiles, varying between pH 5.71 and 6.05.
Kruskal-Wallis analysis of pH of textiles (H = 19.88, DF = 3, P = 0.006).

The textiles had plain weave structures [46] with various degrees of tightness. The higher cotton blends presented rougher surfaces (Figure 3). The SEM images showed that 100PET was made of filament yarns, whereas the others were made of spun yarns. They also revealed that both warp and weft yarns have consistent blend of cotton and polyester for 80PET and 65PET, which fixed the dimensions for the longitudinal and transverse direction of the samples. There were significant differences in percentage void space between the textiles (ANOVA: F = 6.96, DF = 3, P = 0.013; Table 2), with 80PET having a tighter weave than both 100CO and 65PET. There was no relationship between textile composition and void space. There was significant variation in the fibre density per yarn (ANOVA: F = 145.98, DF = 3, P = <0.001; Table 2, Figure 4), with each textile significantly different from each other. 65PET had the highest fibre density (138 ± 8 fibres per yarn) while 100PET had the lowest (30 ± 4 fibres per yarn). The circumference of each fibre also varied (Kruskal-Wallis: H = 9.76, DF = 3, P = 0.022; Table 3) with 100PET fibres significantly larger (75.4 ± 7.0 µm) and 80PET significantly smaller (38.6 ± 1.3 µm) than the others. Yarn thickness varied between textiles (ANOVA: F = 4.43, DF = 3, P = 0.041; Table 2) with 65PET having the thickest weave (371.7 ± 59.9 µm) and 80PET the thinnest (235.5 ± 29.0 µm). Surface area varied between fabrics (Kruskal-Wallis: H = 9.67, DF = 3, P = 0.022; Table 4) with 80PET presenting a significantly smaller area than the other textiles (1.10 ± 0.03 cm2; Mann-Whitney W = 10, DF = 3, P = 0.03) while 100PET presented a significantly larger area than the others (2.82 ± 0.09 cm2; Mann-Whitney W = 10, DF = 3, P = 0.03). Table 5 summarises the characteristics of the textiles.

SEM images (top view) of: (a) 100% polyester (100PET), (b) 80% polyester: 20% cotton (80PET), (c) 65% polyester: 35% cotton (65PET), and (d) 100% cotton (100CO).
ANOVA outputs of void space, fibres per yarn and yarn thickness.

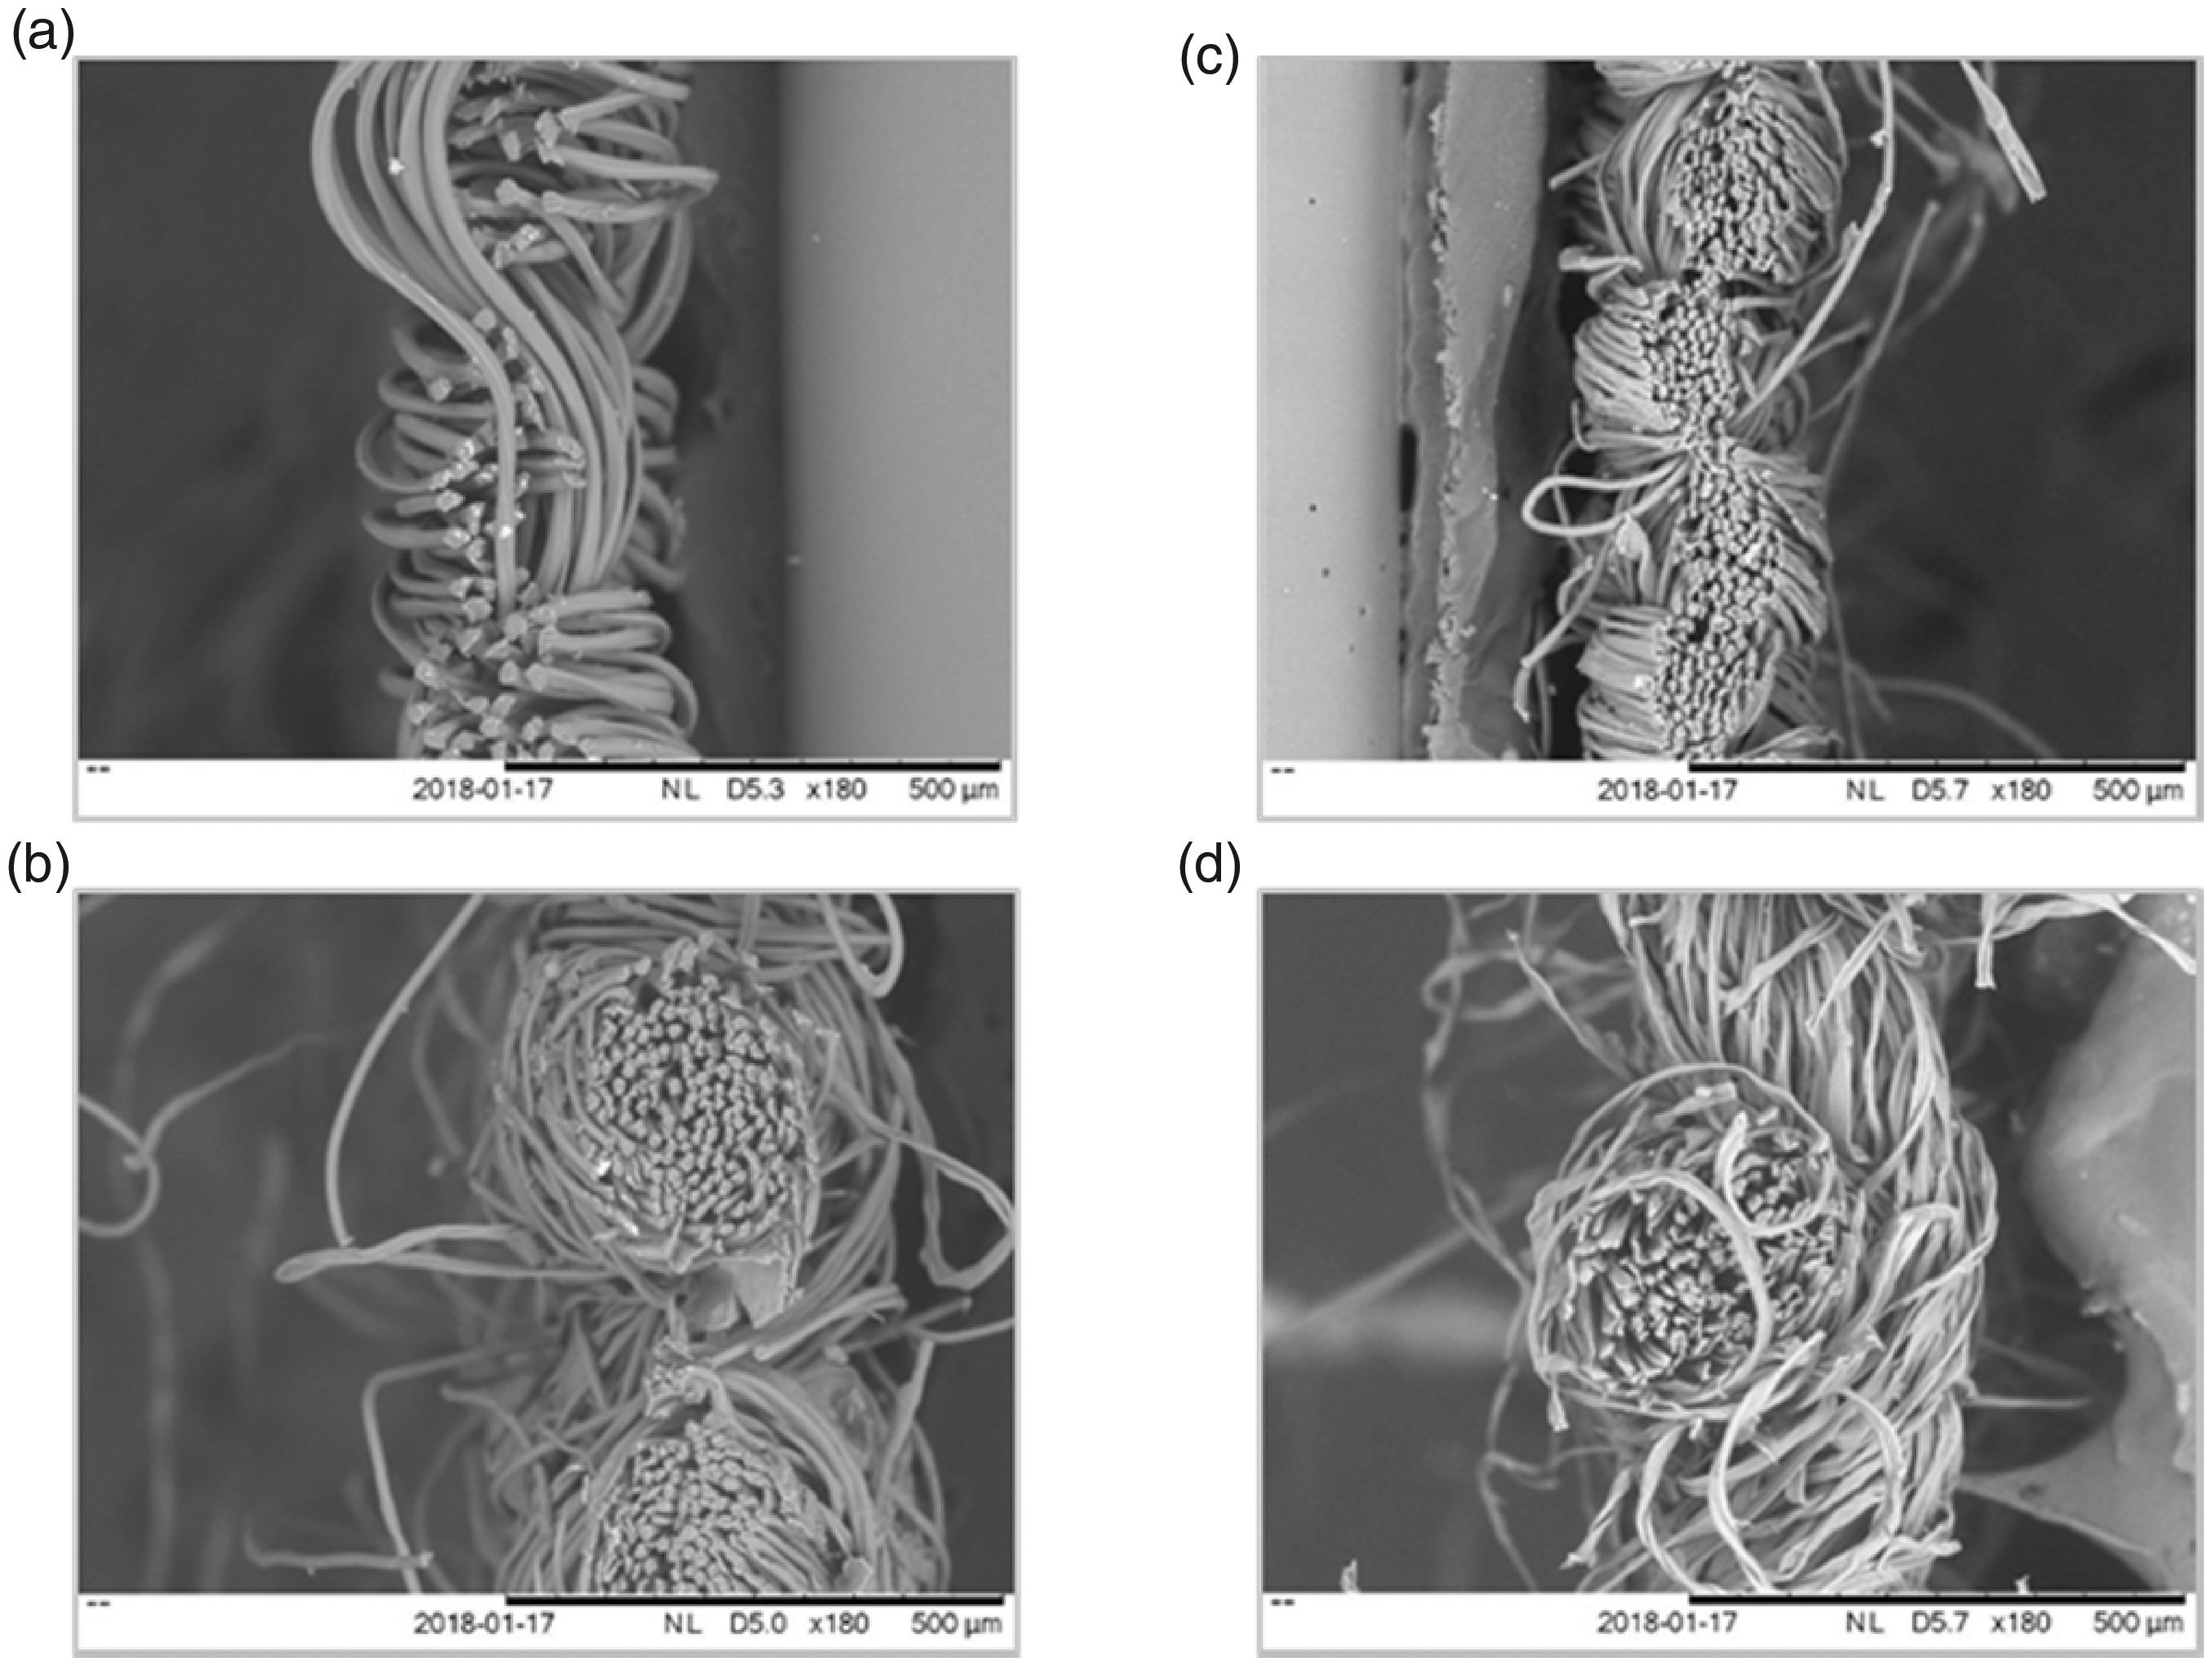
SEM images (side view) of: (a) 100% polyester (100PET), (b) 80% polyester: 20% cotton (80PET), (c) 65% polyester: 35% cotton (65PET), and (d) 100% cotton (100CO).
Kruskal-Wallis analysis of fibre circumference (H = 9.76, DF = 3, P = 0.022).

Kruskal-Wallis analysis of textile surface area (H = 9.67, DF = 3, P = 0.022).

Characteristics of textiles analysed from SEM images using ImageJ software. Measured parameters were: the number of fibres per yarn, fibre circumference, yarn thickness (diameter), estimated surface area available for cell attachment, and the percentage void space. Mean ± SD.

CO2 uptake
The cotton based biocomposites captured significantly more CO2 than the polyester versions, while both biocomposite types outperformed the algae suspension controls (0.16 ± 0.01 g CO2 g−1 biomass day−1) (Table 6). The cotton biocomposites had the highest net cumulative CO2 fixation rates (Figure 5) irrespective of whether a topcoat was applied (coated = 1.82 ± 0.10, uncoated = 1.55 ± 0.27 g CO2 g−1 biomass day−1, coated polyester = 0.49 ± 0.04, uncoated polyester = 0.42 ± 0.03 g CO2 g−1 biomass day−1; Friedman: data vs. treatment: S = 156.36, DF = 3, P = <0.001 data vs. time: S = 194.97, DF = 13, P = <0.001). The use of the kappa-carrageenan topcoat did improve CO2 uptake rates (Wilcoxon: cotton; W = 238, DF = 3, P = 0.021; polyester: W = 63, DF = 3, P = <0.001) by retaining the cells on the textiles, but the improvement was modest in comparison to the textile type (Wilcoxon: W = 903, DF = 3, P = <0.001).
Net CO2 fixation rates of the textile biocomposites and suspension control.

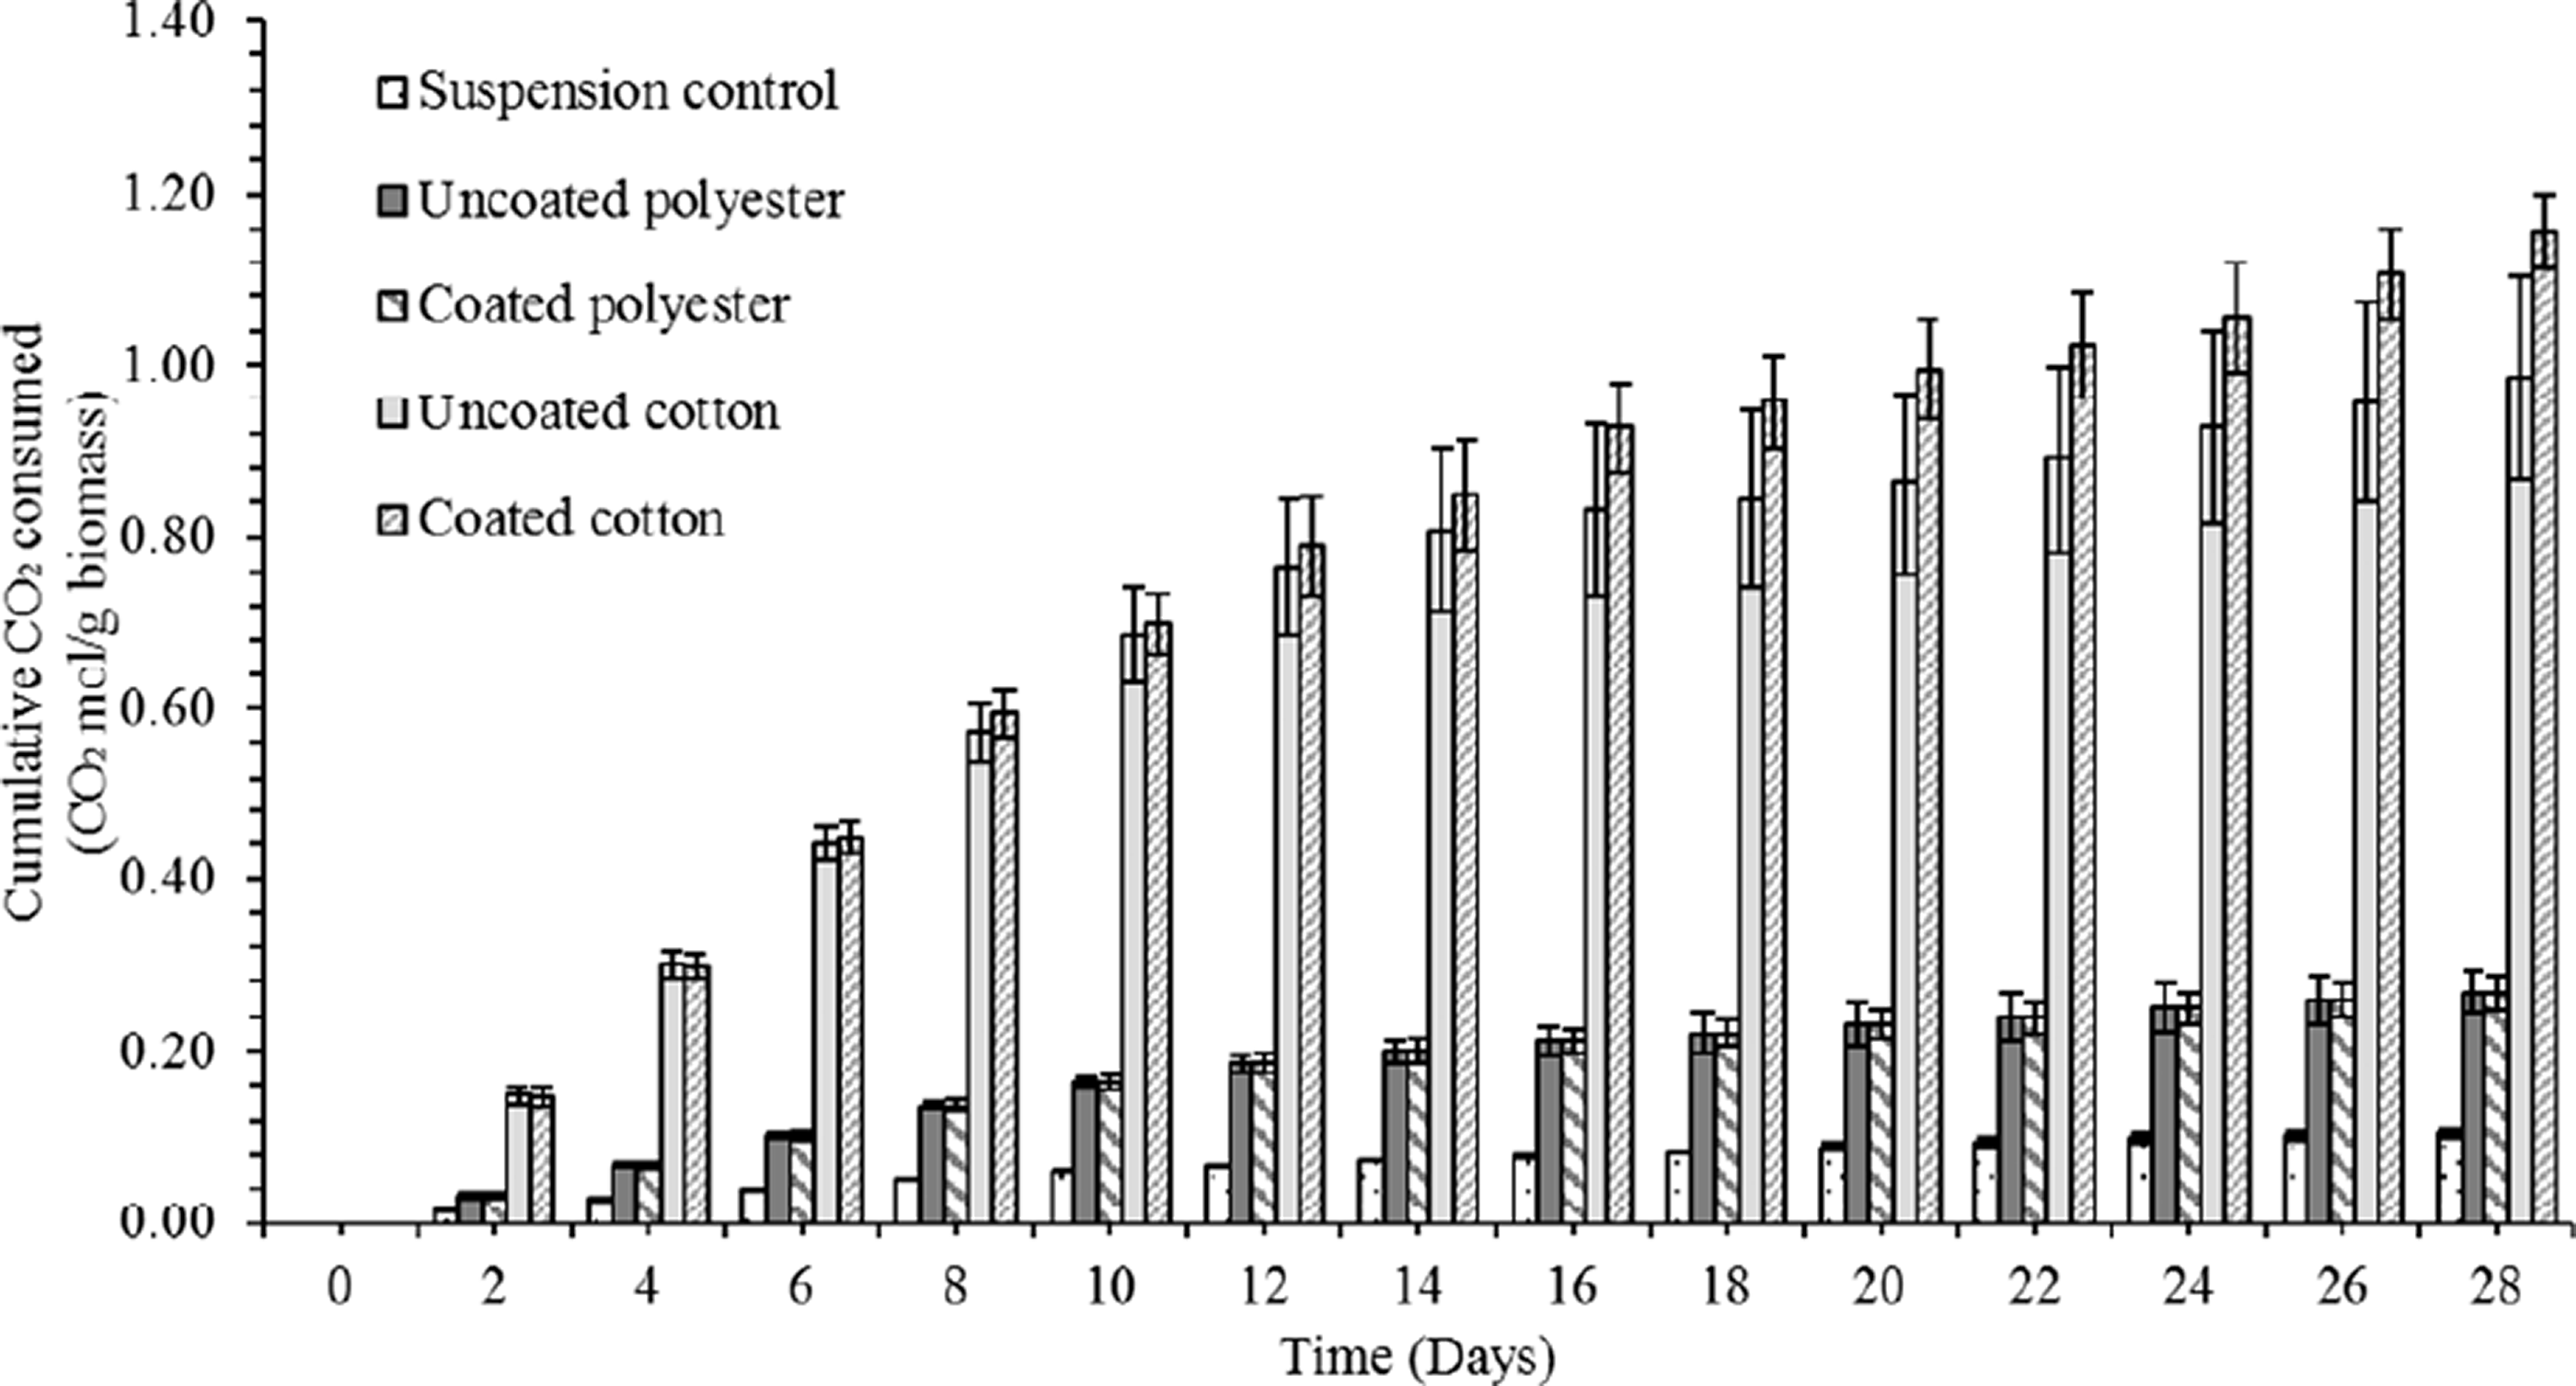
Cumulative net CO2 fixation (mol CO2/g biomass; mean ± SD, n = 3) over 28 days for kappa-carrageenan coated and uncoated cotton or polyester based biocomposites and suspension algae culture controls.
A significant enhancement of CO2 absorption rate compared to the suspension controls is likely due to an increase in CO2 mass transfer rates. Typically, phototrophic microalgae take up CO2 in the form of bicarbonate (HCO3-) or dissolved CO2 in an aqueous phase depending on species, CO2 concentration source, nutrient availability, environmental parameters, and pH of culture medium [47]. The rate of CO2 absorption by the cells on the surface of the textile is larger due to two factors, firstly the mass transfer resistance for CO2 transfer from the gas phase to the cell cytoplasm is much smaller and secondly the CO2 concentration gradient is higher [41]. The cells settled in the suspension controls relied on diffusion transfer through bulk liquid water driven by a low CO2 concentration gradient [48].
Based on the physical characteristics of either textile, there are no clear explanations for the CO2 uptake enhancement. The cotton had a higher void space percentage than the polyester due to the open weave of the yarns. The polyester presented a larger surface area but this was not translated into greater biomass attachment. The explanation may lie in the greater hydrophilicity of the cotton [49], which would allow the cells to access water and dissolved nutrients more effectively.
It is not straightforward to compare our study with other microalgae-based studies for carbon capture as there are not any agreed standards, with trials having differing conditions such as light exposure, culture arrangement, nutrient provision and the algae species used. Further, there are no agreed standards for data reporting. The majority of studies have grown microalgae in suspension at various scales and using a broad suite of photobioreactor designs and configurations; very few have used biofilm techniques (either natural or engineered) [50–55]. In Table 7, we attempt to compare our study with others that have used Chlorella species. The textile biocomposites’ net CO2 absorption rates compared favourably, particularly the cotton system when calculated on a per unit biomass basis (g CO2 g−1biomass day−1). Vaz et al. [55] cultivated C. fusca cells onto nanofibers, attaining 0.27 g CO2 g−1biomass day−1; our biocomposites outperformed this by almost seven- and twofold for coated cotton (1.82 ± 0.10 g CO2 g−1biomass day−1) and coated polyester (0.49 ± 0.04 g CO2 g−1biomass day−1) respectively.
Comparison of net CO2 fixation rates with other Chlorella based studies.

Estimated values from given experimental setups and information from the studies.
Chlorophyll a content
Chlorophyll fluorescence increased with treatment and time (Friedman: data vs. treatment: S = 99.34, DF = 3, P = <0.001; data vs. time: S = 117.61, DF = 13, P = <0.001). The fluorescence of the uncoated cotton biocomposites increased exponentially from day 10 and peaked on day 18, whereas the fluorescence of the coated cotton biocomposites increased linearly before plateauing from day 24 (Figure 6), with the uncoated cotton biocomposites having higher fluorescence than the coated treatment (Wilcoxon: W = 33, DF = 3, P = <0.001). The polyester biocomposites, which had significantly lower fluorescence than the cotton treatments, plateaued between days 14 and 16. Unlike the cotton treatments, the coated polyesters had higher fluorescence than the uncoated polyesters (Wilcoxon: W = 680, DF = 3, P = 0.004).

Chlorophyll a fluorescence intensities (relative fluorescence units; mean ± SD, n = 3) of kappa-carrageenan coated and uncoated cotton or polyester based biocomposites over 28 days of the CO2 fixation test.
The trends of net cumulative CO2 fixation plotted against chlorophyll fluorescence are shown in Figure 7. These plots were used to identify which biocomposites were more robust over time by observing the relationship between attached biomass and CO2 removed. It should be noted that the fluorescence measured here cannot be affected by kappa-carrageenan because of different absorbance ranges; i.e. kappa-carrageenan absorbs at 290 nm [56], while chlorophyll a absorbs at 400 to 700 nm [57]. The uncoated cotton and polyester showed biomass loss and the CO2 performance seemed to be approaching vertical asymptotes (Figure 7(c) and (d)). The coated cotton and polyester seemed to indicate linear relationships (Figure 7(a) and (b)).
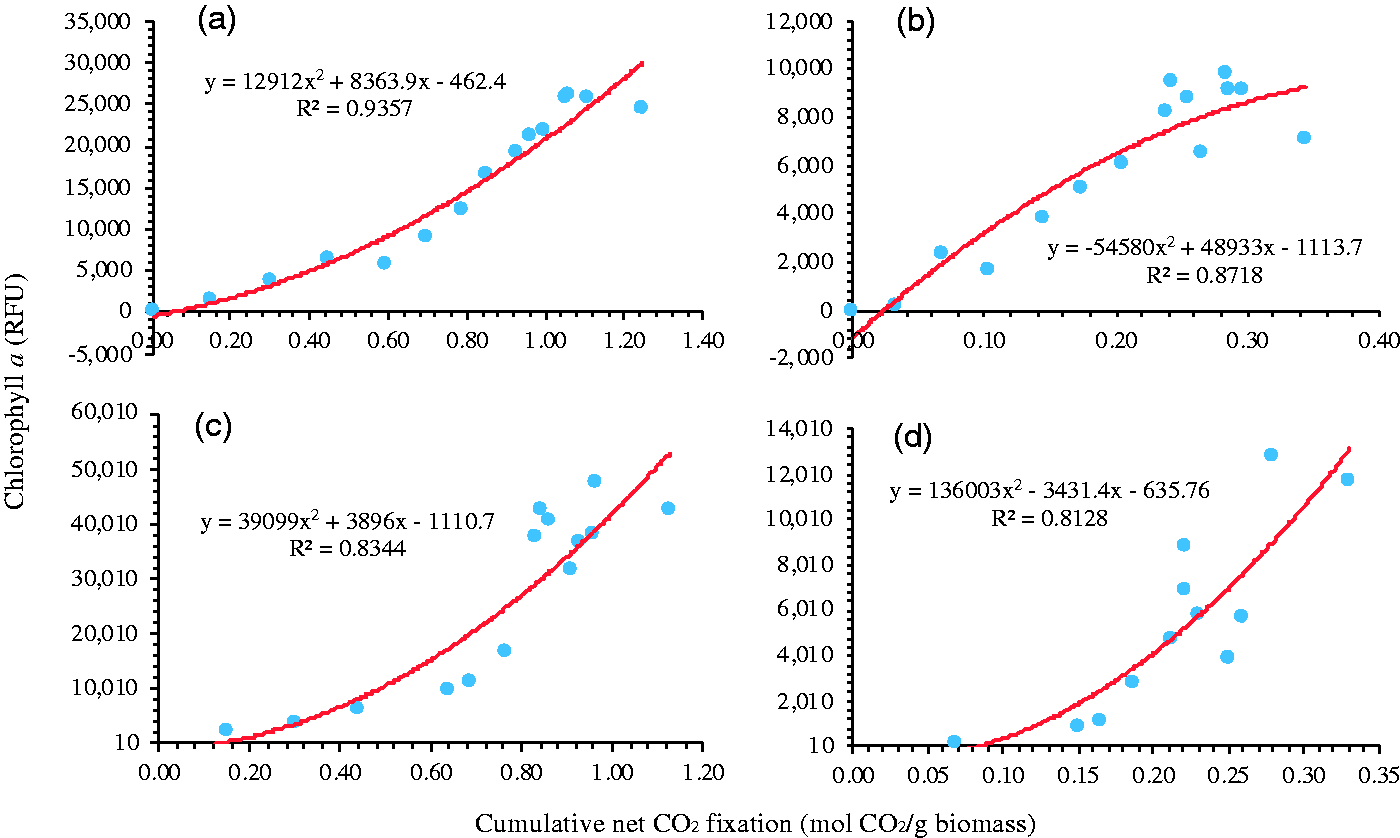
Cumulative CO2 fixation versus chlorophyll a fluorescence intensity over 28 days: a) coated cotton, b) coated polyester, c) uncoated cotton, and d) uncoated polyester based.
Cell detachment
It was noticeable that cells were detaching from the textiles into the BG-11 medium (Figures 8 and 9), particularly for the uncoated biocomposites (Friedman test: data vs. treatment; S = 40.29, DF = 3, P = <0.001; data vs. time: S = 25.95, DF = 3, P = <0.001). The coated polyester biocomposites had significantly higher cell release than the coated cotton (Wilcoxon: coated, W = 24, P = 0.044) but there was no significant difference between the uncoated biocomposites. This may be explained in the context of the surface charges of the materials. During the cell-attachment stage of the production of the algae biocomposites, the solid surface of the fibres and the ions in the BG-11 media form an electrical double layer. In the BG-11 media there is a layer of bound ions (Stern Layer) and a diffuse layer of less strongly bound ions. Luxbacher and co-workers discuss the electrical double layer in the context of textile surfaces [58]. The zeta potential measures the net charge within the diffuse layer and can be used to characterise the electrostatic repulsion/attraction between solid surfaces. Over the likely pH range experienced during the experiments (pH 7–8.5), cotton has a surface charge (zeta potential) approximating to −15 to −20 mV, polyester is between −60 to −65 mV [59], Chlorella vulgaris is −17 to −18 mV [60] and kappa-carrageenan is −50 mV [61]. The large zeta potential difference between the algae and the polyester fibres would tend to create a repulsive force that does not favour Chlorella attachment, leading to the release of algae cells into the BG-11 medium and gravity settling of these cells to the base of the vial (Figure 9). The zeta potential of the cotton and Chlorella suggests that they will repel each other, although this may be counteracted by the Van der Waals forces of attraction between the complex polysaccharides on the cotton surface and those that surround the cell wall of the Chlorella [62].

The percentage of cells released from the biocomposites (mean ± SD, n = 3) during the CO2 fixation test.

Loss of cells from the biocomposite to the BG-11 medium pool for: (a) kappa-carrageenan coated polyester, (b) uncoated polyester, (c) coated cotton, and (d) uncoated cotton biocomposites after one week of the CO2 fixation test.
Despite the use of a topcoat, the algae still tended to detach with time, indicating potential degradation of kappa-carrageenan gel. Kappa-carrageenan forms a rigid gel when cross-linked with KCl solution; however, its structure and the capacity for certain chemicals to diffuse through it may still be modified by further exposure to water [63]. Hence, alternative binding techniques for textile-based biocomposites were recently developed by Hart, In-na [64] using bio-based latex binders. These biocomposites were developed for environmental remediation applications. Stronger gel coatings should be explored to increase biocomposite robustness.
Nevertheless, the cell release data were used to normalise the CO2 fixation and chlorophyll fluorescence data to biomass retention (Figure 10(a) and (b)) (normalised CO2: Friedman test, data vs. treatment: S = 29.30, DF = 3, P = <0.001, data vs. time: S = 36.0, DF = 3 P = <0.001; normalised chlorophyll a: Friedman test, data vs. treatment: S = 30.70, DF = 3, P = <0.001; data vs. time: S = 29.30, DF = 3, P = <0.001), resulting in higher values in all cases.

Cumulative net CO2 fixation (a) and change in chlorophyll a fluorescence intensity (b) of biocomposites on a weekly basis normalised to the biomass retained within the biocomposite. Mean ± SD, n = 3.
Effect of textile blending on natural attachment
Following the initial experiments comparing cotton with polyester, an experiment was conducted using uncoated cotton/polyester blends to ascertain whether textile blends could overcome the limitations of the respective pure fabrics. As for the CO2 fixation experiments, passive cell attachment was used whereby the textiles were immersed in BG-11 containing C. vulgaris for 14 days and also a separate BG-11 only treatment was run in parallel to investigate the structural robustness of the textiles (determined as textile mass change).
After 14 days, C. vulgaris had attached to all of the textiles (Figure 11(a)), but the quantity of chlorophyll a extracted differed by treatment (ANOVA: F = 5.22, DF = 3, P = 0.027), with the lowest in 100PET (0.794 ± 0.19 µg cm−2), but this was significantly lower than others except the 65PET treatment. The SEM images (Figure 4) show that the yarns of 80PET and 65PET had cotton fibres mostly on the outer yarn circumference, while polyester fibres are within the yarn structure. Since cotton is more hydrophilic than polyester [49], these fibre arrangements could explain the significantly higher chlorophyll a measurement (Figure 11(c)) on the surface of textiles with cotton blends, implying that these blends had adsorbed more cells than the pure polyester.
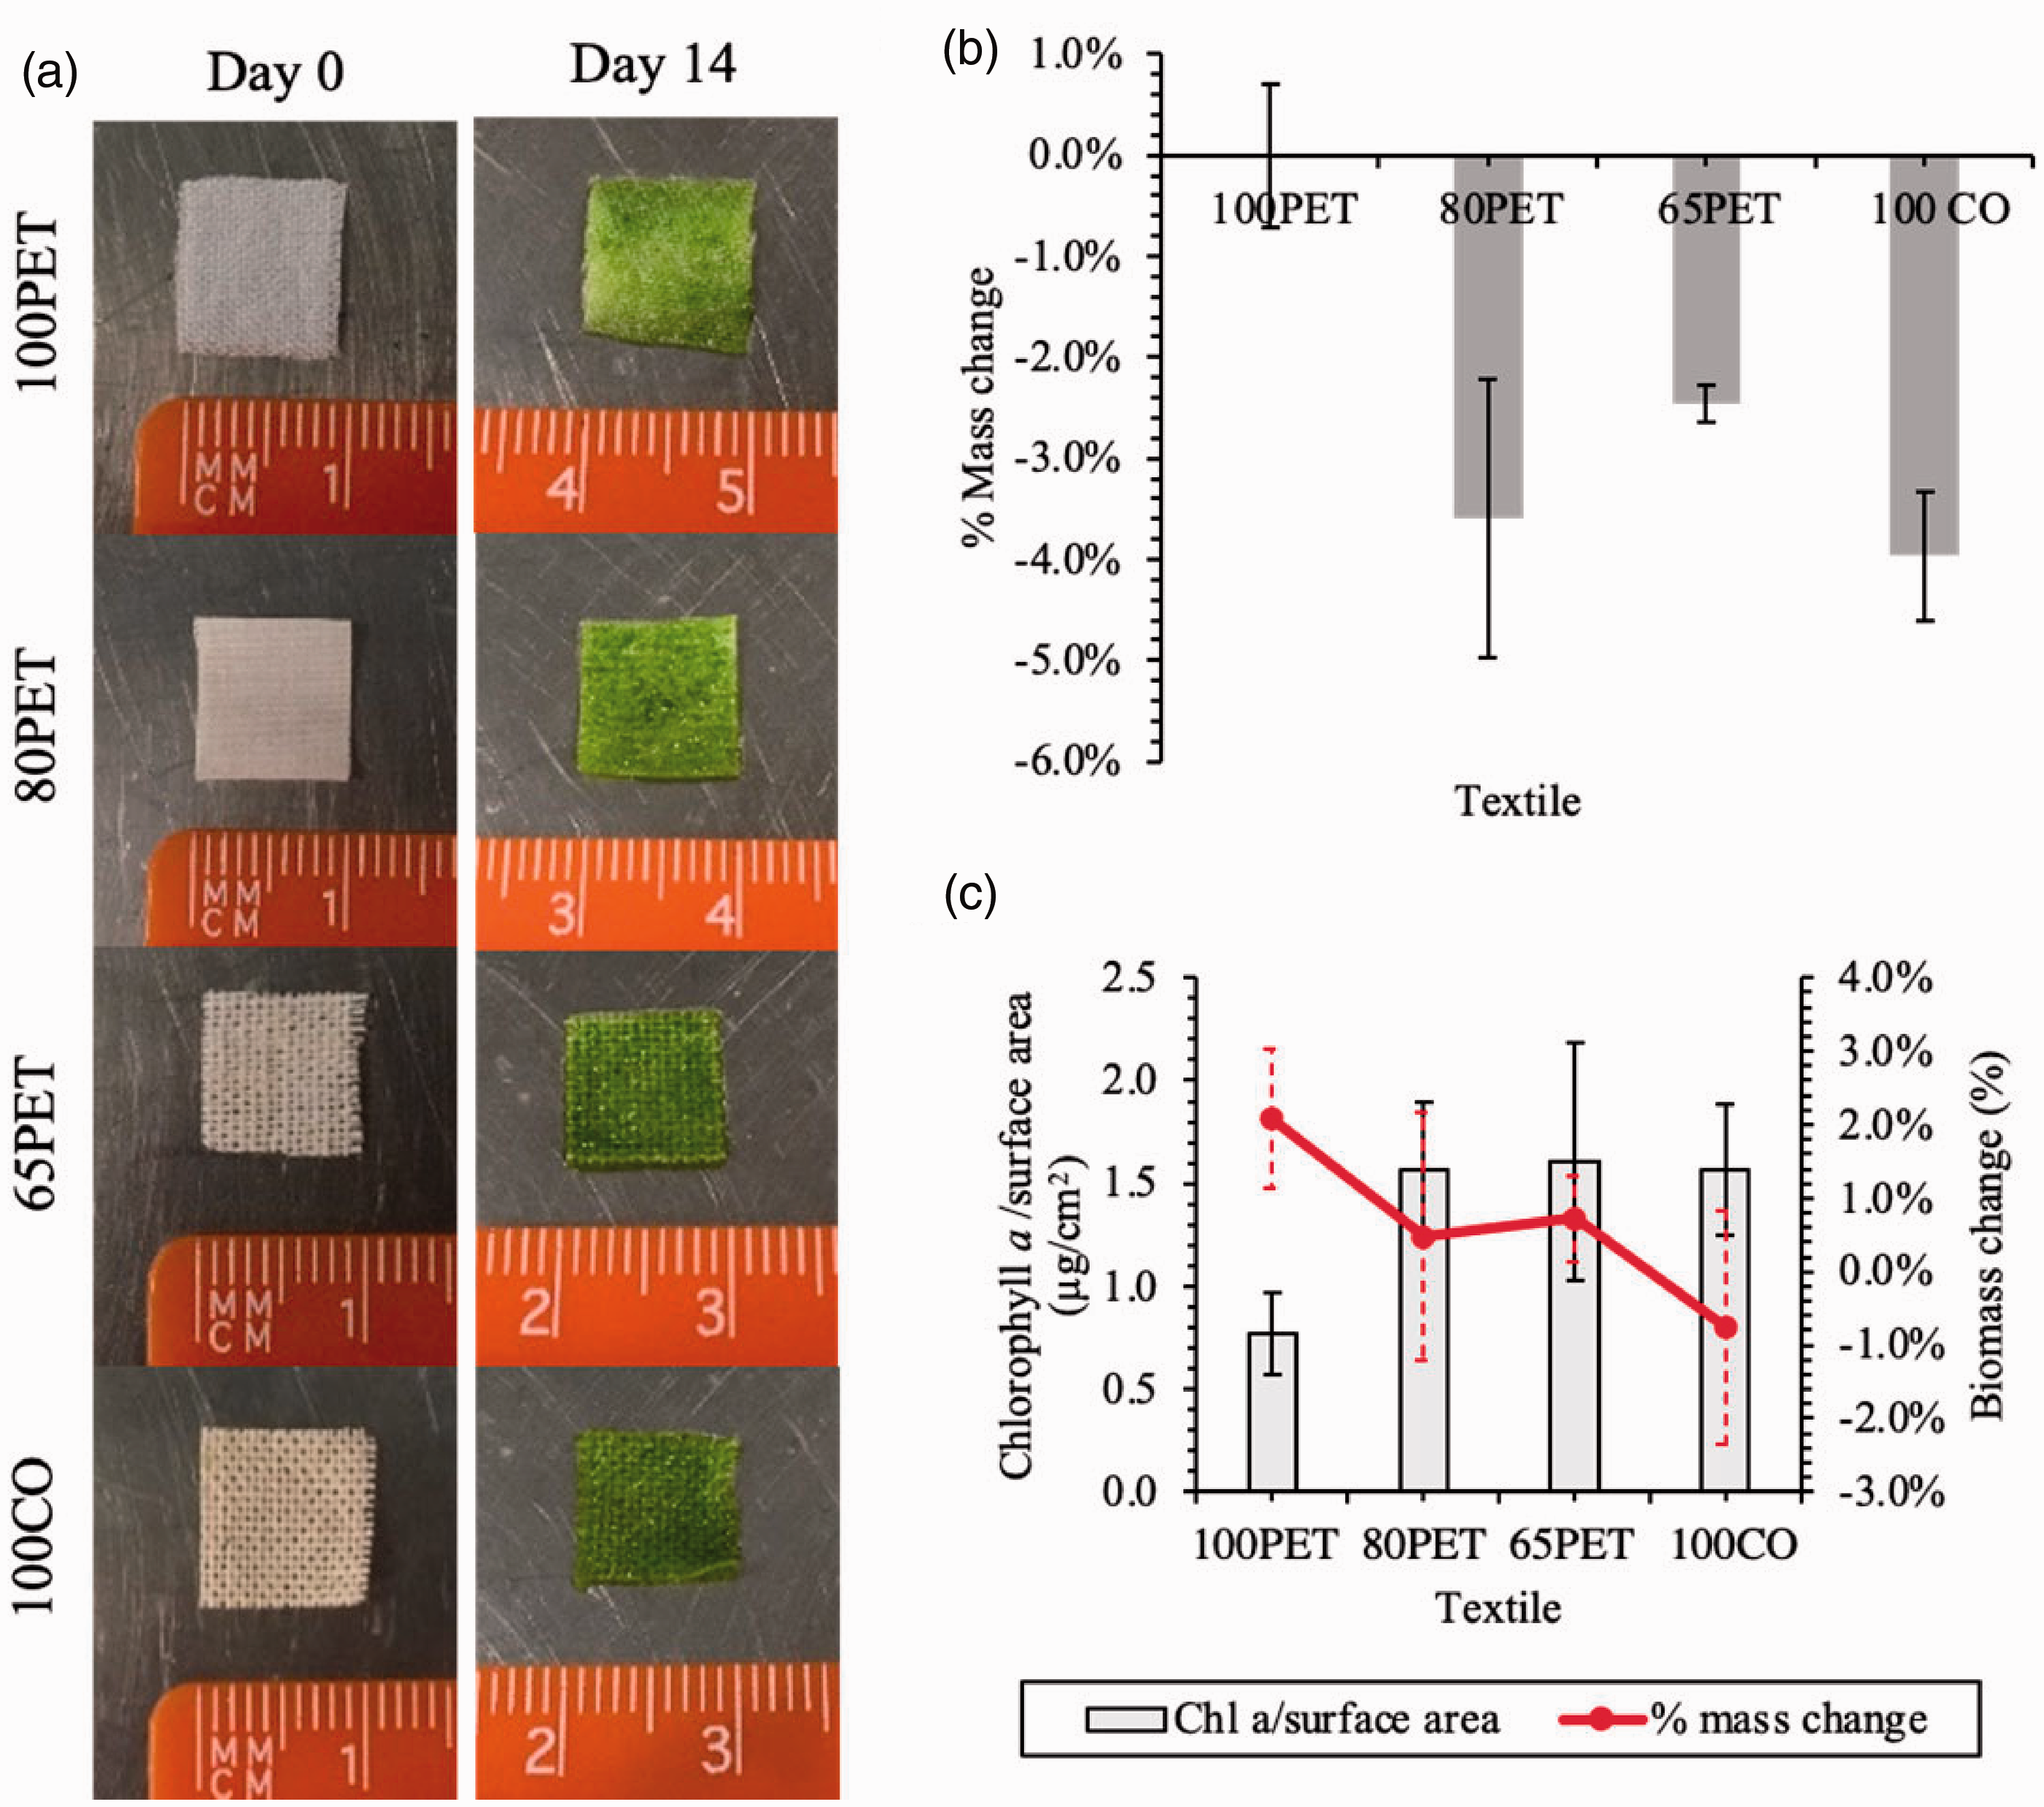
Uncoated immobilisation test of different textile blends: 100% polyester (100PET), 80% polyester and 20% cotton (80PET), 65% polyester and 35% cotton (65PET), and 100% cotton (100CO). (a) Comparison of textiles on days 0 and 14; (b) percentage mass change of the textiles in abiotic controls exposed to BG-11 medium after 14 days; (c) chlorophyll a content and the percentage biomass change of the biocomposites after 14 days. Mean ± SD, n = 3.
The textiles exposed to BG-11 only indicated that there was mass loss (Figure 11(b)) (ANOVA: F = 14.89; DF = 3; P = 0.001) from biodegradation, although there was no relationship with the proportion of cotton in the blend. 100% PET had a very small net mass loss compared to the cotton blends. The variation around zero net mass loss was probably caused by differences in moisture content between samples. These data were used to normalise the percentage biomass change in the samples. There were no significant differences between any of the cotton containing textiles. In contrast, the percentage biomass change was highest for 100PET (2.08 ± 1.11%, median ± range) (ANOVA: F = 25.16, DF = 3, P = <0.001; Figure 11(c)) showing that despite increased chlorophyll content (biomass loading was determined by chlorophyll a extraction rather than in situ fluorescence) relative to the polyester-only treatment, all cotton containing biocomposites either maintained mass or lost mass in the case of cotton-only. These data indicate that during the cell loading phase of biocomposite fabrication, natural fibres (i.e. cotton) can be degraded and may therefore perform sub-optimally. By extrapolation, if we apply this knowledge retrospectively to the CO2 capture trials it is clear that there are performance gains to be made if the degradation of the cotton can be slowed or eliminated. It would be important to determine whether the degradation rate of the cotton when totally submerged in growth media was the same during high humidity exposure as defined the CO2 fixation trials. This would be broadly in line with other studies using cotton as an attachment substrate [32–34,65]. Similarly, it will be necessary to determine whether topcoats can, in addition to promoting cell retention, also protect the cotton from degradation.
This investigation with the textile blending demonstrates the importance of material selection if textile biocomposites are to be implemented on a large scale. To better evaluate the trade-off in characteristics between cotton and polyester, Al-Oqla, Sapuan [66] suggested the integration of technical, physical, mechanical, economical, and environmental factors in the selection of natural fibres for industrial application. In their study, the cost per waste-volume ratio indicator and pairwise comparisions between natural fibres were introduced during the evaluation and better performance was achieved [66]. It is also possible to assess the important natural fibre properties and performance in biocomposite materials independently of the manufacturing techniques [67] and predict material performance deterioration for better sustainable bio-material design [68], which would be useful when re-purposing end-of-life textiles for CO2 capture biocomposites. In addition, the overall sustainability of these biocomposites needs to be viewed in the context of the environmental impact of the cotton growing industry, particularly its very high water demand [69,70]. Even so, these textile biocomposites require negligible amount of water and nutrients to operate.
Conclusion
Textile biocomposites developed in the current study had enhanced CO2 capture compared to their suspension controls. Textile biocomposites operated successfully with substantially reduced water use, offering a “low-water low-maintenance” system that overcomes many issues (tackles both CO2 emissions and water shortage) incumbent in conventional open pond or suspension based photobioreactor systems. However, issues surrounding the degradation of both the gel topcoat and the cotton substrates need to be overcome to extend the operational life of the biocomposites. Nonetheless, future studies should consider evaluating the potential to utilise recycled cotton e.g. from the fashion industry. CO2 capture biocomposites may offer an alternative use for end-of-life clothing and other textiles. The desirable textile properties that are deemed important for biocomposite applications are: 1) highly robust to moist environments; 2) hydrophilic for nutrient access and to retain water; 3) large surface area; and, 4) sufficient light penetration.
Supplemental Material
sj-pdf-1-jit-10.1177_15280837211025725 - Supplemental material for Living textile biocomposites deliver enhanced carbon dioxide capture
Supplemental material, sj-pdf-1-jit-10.1177_15280837211025725 for Living textile biocomposites deliver enhanced carbon dioxide capture by Pichaya In-na, Jonathan Lee and Gary Caldwell in Journal of Industrial Textiles
Footnotes
Authors’ contributions
The study was conceived by all authors. Data were collected and analysed by Pichaya In-na. The manuscript was written by all authors.
Availability of data and material
At request to the corresponding author.
Acknowledgements
We thank Peter McParlin for assistance with microalgae culturing, Michael Foster for assistance with SEM imaging and Edouard Thouvenin for laboratory assistance.
Consent for publication
All authors consent to the submission and publication of this work.
Declaration of conflicting interests
The author(s) declared no potential conflicts of interest with respect to the research, authorship, and/or publication of this article.
Funding
The author(s) disclosed receipt of the following financial support for the research, authorship, and/or publication of this article: This work was supported by a Newcastle University Doctoral scholarship awarded to Pichaya In-na.
Ethical approval
This study was approved by the Newcastle University Ethics in Research Committee. This study does not contain any studies with human participants or animals performed by any of the authors.
References
Supplementary Material
Please find the following supplemental material available below.
For Open Access articles published under a Creative Commons License, all supplemental material carries the same license as the article it is associated with.
For non-Open Access articles published, all supplemental material carries a non-exclusive license, and permission requests for re-use of supplemental material or any part of supplemental material shall be sent directly to the copyright owner as specified in the copyright notice associated with the article.