
Abstract
Our research aims to develop a shear forming envelope for the preforming of textiles, a critical step in the manufacture of fibre-reinforced composite materials. This paper demonstrates the progress towards this aim by conducting picture frame tests to empirically determine the locking angle of non-crimp fabrics with different fibre orientations. While conventional shear tests typically utilise woven textile samples with orthogonal fibre directions of 0°/90°, the investigation of non-crimp fabrics, especially with non-standard fibre orientations, is less common. As a result, there is little knowledge about the shear deformation behaviour of these fabric types, despite their relevance to the aerospace industry. In this study, the shear locking angles of various carbon fibre non-crimp fabrics are investigated, gradually reducing the relative fibre angles of the textile materials from ±45° to ±22.5°. Previously, it was observed that unidirectional 0° reinforcement layers induce draping defects when forming multiaxial non-crimp fabric stacks into curved aerospace stiffeners. Their substitution by reinforcements with smaller cross-ply angles such as ±30° resulted in better formability and reduced defects. It is however unclear, how the shear locking angle decreases with more acute cross-ply angles. Here, we report for the first time a correlation between the fibre orientation of the non-crimp fabric and its shear locking angle. The resulting shear forming envelope provides composite design and manufacturing guidance for an enhanced utilisation of the advantageous but anisotropic properties of carbon fibre textiles.
Introduction
The production of aerospace components through Liquid Composite Moulding techniques such as Resin Transfer Moulding or Vacuum Assisted Resin Infusion has seen a significant increase in popularity over recent years. A large potential for automation as well as cost savings over prepreg materials are key benefits, whereas the occurrence of forming defects is a significant challenge. The following sections describe the draping process, relevant shear characterisation techniques and the application of uncommon fabric architectures.
Draping of fibrous reinforcement textiles
The first step of any Liquid Composite Moulding process is the manufacture of a textile preform. Various methods can be employed to drape the fabric materials to a near-net shape prior to resin infusion and cure. A complex combination of various deformation modes such as shear, bending and slip is required to conform the two-dimensional fabric blanks into a three-dimensional preform [1–5]. Multiple types of carbon fibre fabrics, such as woven and non-crimp fabrics, are affected by these processes. A crucial limitation of the preforming method is that defects such as wrinkles and fibre misalignments may occur during the forming, which reduce the structural performance of the resultant part.
The development of draping defects can be initiated through the shear locking of the reinforcement fabric, a phenomenon which occurs when the yarn networks of the fabric have reached the maximum shear deformation. Any further rotation of the yarns requires significant amounts of energy and alternative out-of-plane deformation modes suddenly become more energy efficient [6–9]. The shear angle at this pivotal point of shear deformation is called the locking angle. For non-crimp fabrics with non-classical cross-ply angles, a detailed experimental investigation into when these materials reach their shear locking angle is an important gap to be addressed.
This study demonstrates the progress in developing a shear forming envelope that acts as an operating window to guide the design and manufacturing of industrial composite components.
Shear characterisation of fibrous reinforcement textiles
One of the two most common methods for the investigation of fabric locking angles during shear deformation is the picture frame test [2,10–15]. A cruciform textile sample is clamped in the picture frame device with its two fibre directions aligned parallel to the frame arms. The device is subsequently mounted in a testing machine. During the experiment, a tensile load is applied to two opposite corners (direction of load is indicated by arrows in Figure 1) and the initially square assembly transforms into a diamond shape.

Geometric parameters of picture frame test apparatus before and during experiment.
As the crosshead displacement of the testing machine increases, the fibres rotate around their respective contact points and ideally the fabric is subjected to pure trellis shear. An advantage of the picture frame test is the relatively simple evaluation of the shear angle γ. Values for γ can directly be related to the crosshead displacement d of the testing machine, the initial cross-ply angle θ0 and the picture frame hinge distance Lframe (cf. Equations (1) and (2)) [5]. It should be noted that Equations (1) and (2) commonly contain specific numeric values for orthogonal fabrics, which do not apply for all materials used in this study.


The relation between shear angle and shear force is specific for each textile and the characteristic locking angle marks the onset of draping defects such as wrinkling [16,17]. Before testing, it is important to precisely prepare and mount the sample in the picture frame device to avoid misalignments and unbalanced clamping [18–22]. Significant deviations in test results can occur if the fabric is not perfectly aligned in the frame [23]. Tensile strains in the fabric sample can potentially delay or inhibit wrinkling while excessive loads are recorded due to increased friction between the plies. Compressive strains decrease the recorded shear force and induce premature buckling of the sample [19].
Application of ±θ0 non-crimp fabrics
The objective of this study is to determine the shear forming limits of non-crimp fabrics with different cross-ply angles ±θ0 by using a picture frame setup. The ±θ0 textiles present a potential replacement option for the manufacture of aircraft stiffening elements. Currently, most layups for this application scenario contain 0° layers which are oriented along the longitudinal stiffener axis. These unidirectional layers provide the required strength and stiffness in the final part but in contrast have poor deformation characteristics [24].
Previous studies discovered that a layup consisting of a ± 45° non-crimp fabric with 0° support layers can be replaced by a ± 30° non-crimp fabric [24]. In doing so, the shearability of the material is enhanced by eliminating the 0° plies. At the same time, the partial loss of strength and stiffness along the longitudinal stiffener axis is compensated by rotating the biaxial fabric plies towards the 0° direction. In the above-mentioned study, no answer was however presented in terms of the forming limits, respectively the shear locking angle. Additionally, the nature of a dependency between the initial fibre angle of a non-crimp fabric and its shear deformation limit remains unknown.
It is expected that the usable shear deformation range decreases with shallower cross-ply angles. Yet, if the remaining envelope for shear deformation provides sufficient margins for the forming of a stiffening element geometry, the automation of manufacturing processes with such ±θ0 non-crimp fabrics promises a large potential in terms of production rate increase and cost reduction. A detailed investigation of the difference in locking angle behaviour is therefore necessary to establish and validate the applicability of ±θ0 non-crimp fabrics. The obtained shear forming limit curve is paramount for the design and manufacture of future aerospace stiffener geometries on an industrial scale.
Materials and methods
This article focuses on the comparison of locking angles of non-crimp fabrics with different cross-ply angles obtained by picture frame experiments. In order to derive a locking angle trend from the testing, the samples of three different non-crimp fabrics with gradually decreasing cross-ply angles are examined. The following sections outline the investigated materials, the test setup as well as the experiment and data evaluation procedures.
Investigated carbon fibre non-crimp fabrics
Previous publications (cf. [25,26]) have demonstrated that the shear behaviour of a given fabric heavily depends on its architecture such as weave type, ply stacking, stitching type or stitching tension. These variables influence the contact conditions between the individual fabric plies, such as the number of rotation points, the friction coefficient or the induced normal force which in summation govern the required force for yarn rotation. Generally speaking, an increased friction between the fabric layers results in a higher resistance to shear deformation [8].
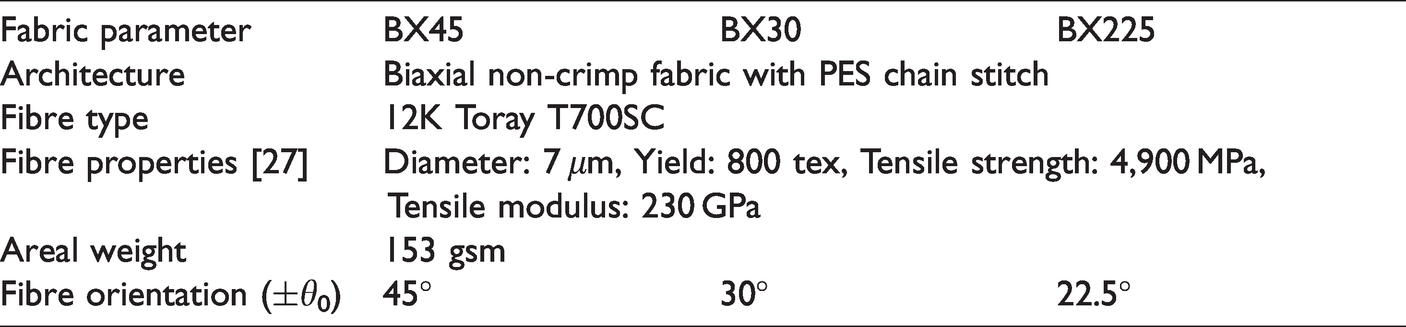
In order to link the differences in shear behaviour and shear locking angle solely to the fibre orientation, the non-crimp fabric architecture is kept consistent across the three textiles. The only varying parameter is the cross-ply angle ±θ0. Close-up grayscale images of the investigated materials, their orientation in the picture frame (arrow) and fibre orientation (dashed lines) are displayed in Figure 2. An overview of the non-crimp fabric parameters can be found in Table 1.

(a) Surface image of ±45° non-crimp fabric. (b) Surface image of ±30° non-crimp fabric. (c) Surface image of ±22.5° non-crimp fabric.
Non-crimp fabric parameters.
Picture frame setup
This study utilises a picture frame test setup at the University of Stuttgart (cf. Figure 3) for the investigation of the non-crimp fabric shear deformation behaviour. The classic picture frame apparatus design includes bearings in the hinges to reduce the resulting noise in the experiment data due to friction in the frame. The shear sample is clamped via four metal plates, each of which is attached to the frame by three M5 bolts.
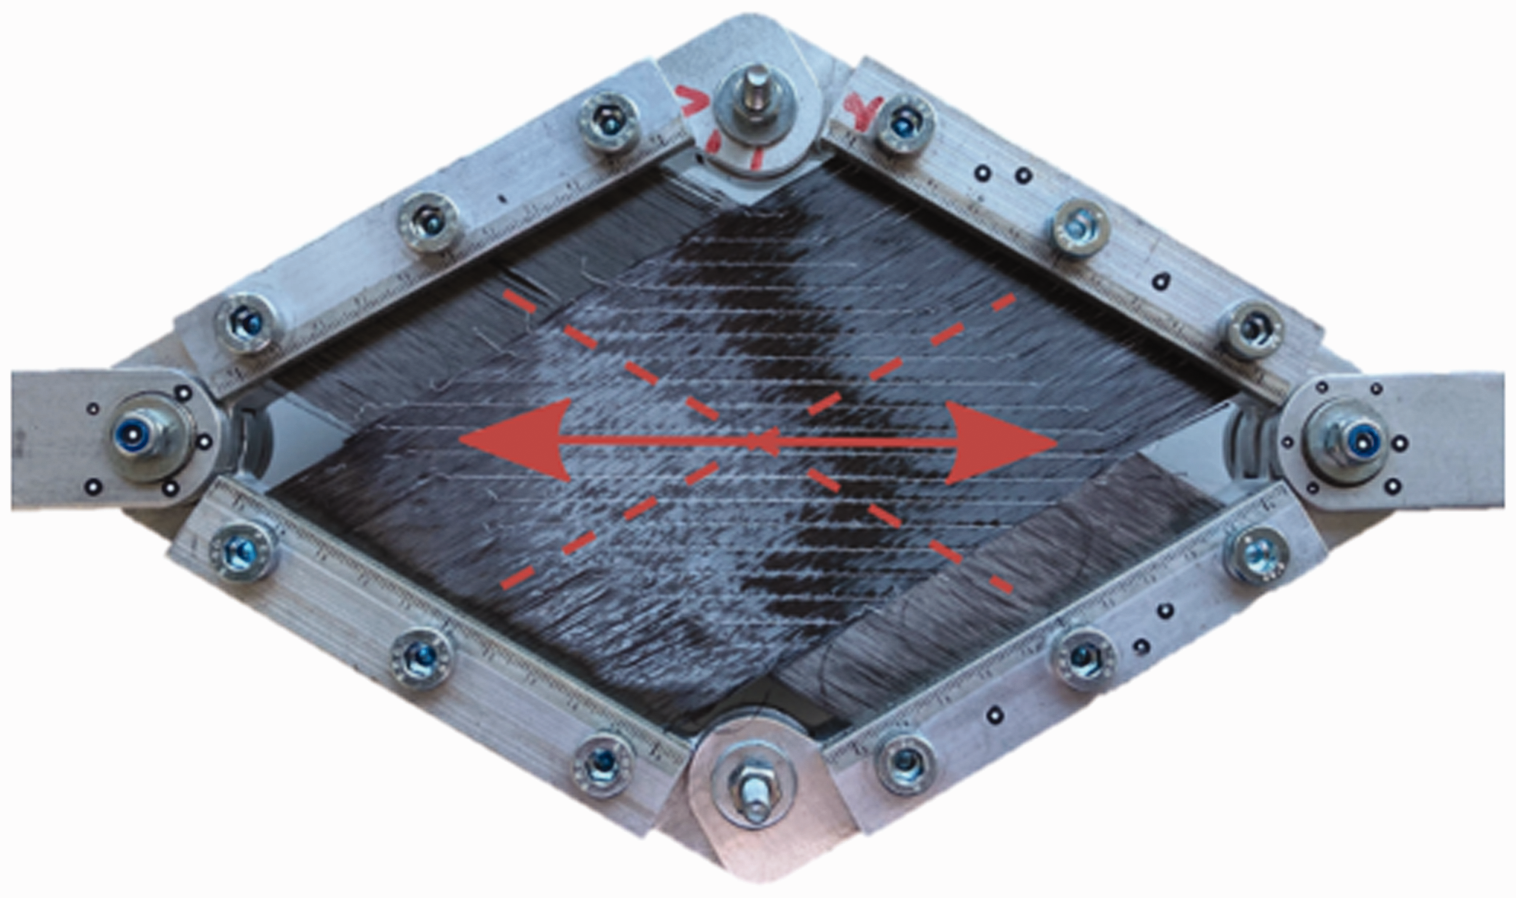
Picture frame device in initial state, equipped with a ± 30° fabric sample, University of Stuttgart.
Due to the investigation of two non-orthogonal non-crimp fabrics (BX30 and BX225), it should be noted that the initial configuration of the picture frame experiment deviates from the commonly referenced starting setup (cf. Figure 4(a)).

(a) Initial configuration for picture frame testing with BX45 fabric. (b) Initial configuration for picture frame testing with BX30 fabric. (c) Initial configuration for picture frame testing with BX225 fabric.
Trellis shear can only be introduced to the specimen when the fibre directions lie parallel to the frame arms. Hence, testing of the BX30 and BX225 fabric materials require a diamond type frame configuration (see Figure 4(b) and (c)) compared to the square configuration for the BX45 tests.
The experimental investigation of textile shear deformation behaviour is currently not standardised. This applies to the picture frame experiment as well as to the common alternative procedure, the bias-extension test. Only comparative benchmarking exercises have been reported (e.g. Cao et al. [28]). As a result, experimental setups and sample geometries vary in size across research institutes worldwide. Picture frame measurement results are therefore commonly normalised utilizing the hinge distance Lframe and side length of the shear region Lfabric (see Figure 1 for a visual representation of both dimensions in accordance with [28,29]).
The respective measurements for the employed picture frame test setup are listed in Table 2. To validate the accuracy of the experimental setup, a comparison to the picture frame benchmark study by Cao et al. was undertaken [30]. It was confirmed that, when normalised according to the energy method [19,29], neither frame length nor shear area influenced the shear deformation behaviour of the fabric specimen beyond experimental scatter.
Picture frame parameters.

Picture frame experiment procedure
The non-crimp fabric samples are cut on a CNC cutter at the University of Stuttgart. Subsequently, yarns outside the central shear region, which are parallel to the respective frame arm, are manually removed. This avoids large scatter and erroneous test data which can be caused by tensile or compressive strains, increased bending resistance near the gripping region or wrinkling outside the central shear region [6,7,19].
For the fixation of the test samples in the picture frame test rig, the frame is locked in position by an auxiliary device to ensure the correct frame angle. A unique mounting template is required for each cross-ply angle ±θ0 as the respective fibre orientations define the initial frame setup. The mounting templates also create a level surface with the clamping area to avoid fabric sagging during the sample preparation. The bolt torque is confined to a low, constant value by utilising a torque wrench, as executed in previous studies [31]. Opposite sides are attached consecutively, and the textile is manually flattened while mounting the screws. The limitation of the clamping forces is of special interest as it can lead to in-plane tension. Elevated in-plane tension is known to influence the resulting shear force versus shear angle curves of the picture frame test [1,6,32–34].
Once the fabric sample is fixed in the frame, a horizontal locking bar is attached to the frame to avoid any distortion during the transfer and mounting in the universal testing machine. Before the shear experiment commences, all auxiliary mounting devices are removed.
Every picture frame test consists of two consecutive shearing operations and both deformations are analysed in this study. This is due to the expectation that the second deformation has a lower scatter which renders comparison easier [7,25]. A minimum of six valid samples is evaluated per experiment series.
Experiment data post-processing
The test results are analysed with a MATLAB algorithm and the routine is briefly explained hereafter. The measured dataset (time, crosshead displacement, recorded force) of each individual test is extracted from the testing machine files. The crosshead displacement d of the testing machine is converted into the corresponding frame angle θ and shear angle γ, as previously demonstrated in Equations (1) and (2).
Furthermore, the force contribution from the empty frame is deducted from the total crosshead force load before converting the tensile force into a shear force, cf. Equation (3). In doing so, it is ensured that the remaining friction within the hinged bearings does not affect the fabric shear response. Subsequently, the absolute shear force is normalised according to the commonly applied energy method, cf. Equation (4). It should be noted that a factor of sin(2θ0) is included for the normalisation in order to account for initially non-square shear regions when testing non-crimp fabrics with fibre orientations other than the traditional ±45° (cf. Figure 3).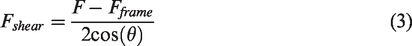

To evaluate the experiments, the normalised shear force average values, minimum & maximum values, standard deviation and coefficient of variance are calculated. The locking angle is obtained from the graph of normalized shear force versus shear angle. In literature, the term ‘locking angle’ is defined as the point of side-by-side contact of individual yarns, which correlates with the occurrence of fabric wrinkles and a sharp increase in normalised shear force [7–9]. Also, the shift from in-plane to out-of-plane deformation occurs at the point of locking [6]. Values for the locking angle can be derived via different options:
The latter is chosen as it is found to be more appropriate for the non-crimp fabrics in this study.
Accordingly, calculating the locking angles is based on a linearisation of the average value curve of each experiment series. This linearisation is also executed via a MATLAB code using different numbers of linearisation base points, ranging from four to seven. For each linear approximation, the end of the section with the shallowest slope is where the material is considered to start locking, cf. [37]. Considerable differences can occur due to the varying granularity of the linearisation. As such, the median locking angle of all four linearisations is calculated and saved at the end which can then be utilised for comparisons between the different non-crimp fabrics.
Analysis of locking angle for non-crimp fabrics with different cross-ply angles
In this section, the effect of the cross-ply angle ±θ0 on the shear behaviour for a given non-crimp fabric is derived from the performed picture frame experiments (cf. earlier section). A comparison with results of supplementary shear experiments is added to validate the experimental procedure. Furthermore, a shear forming envelope is presented based on these results.
Picture frame shear experiment results
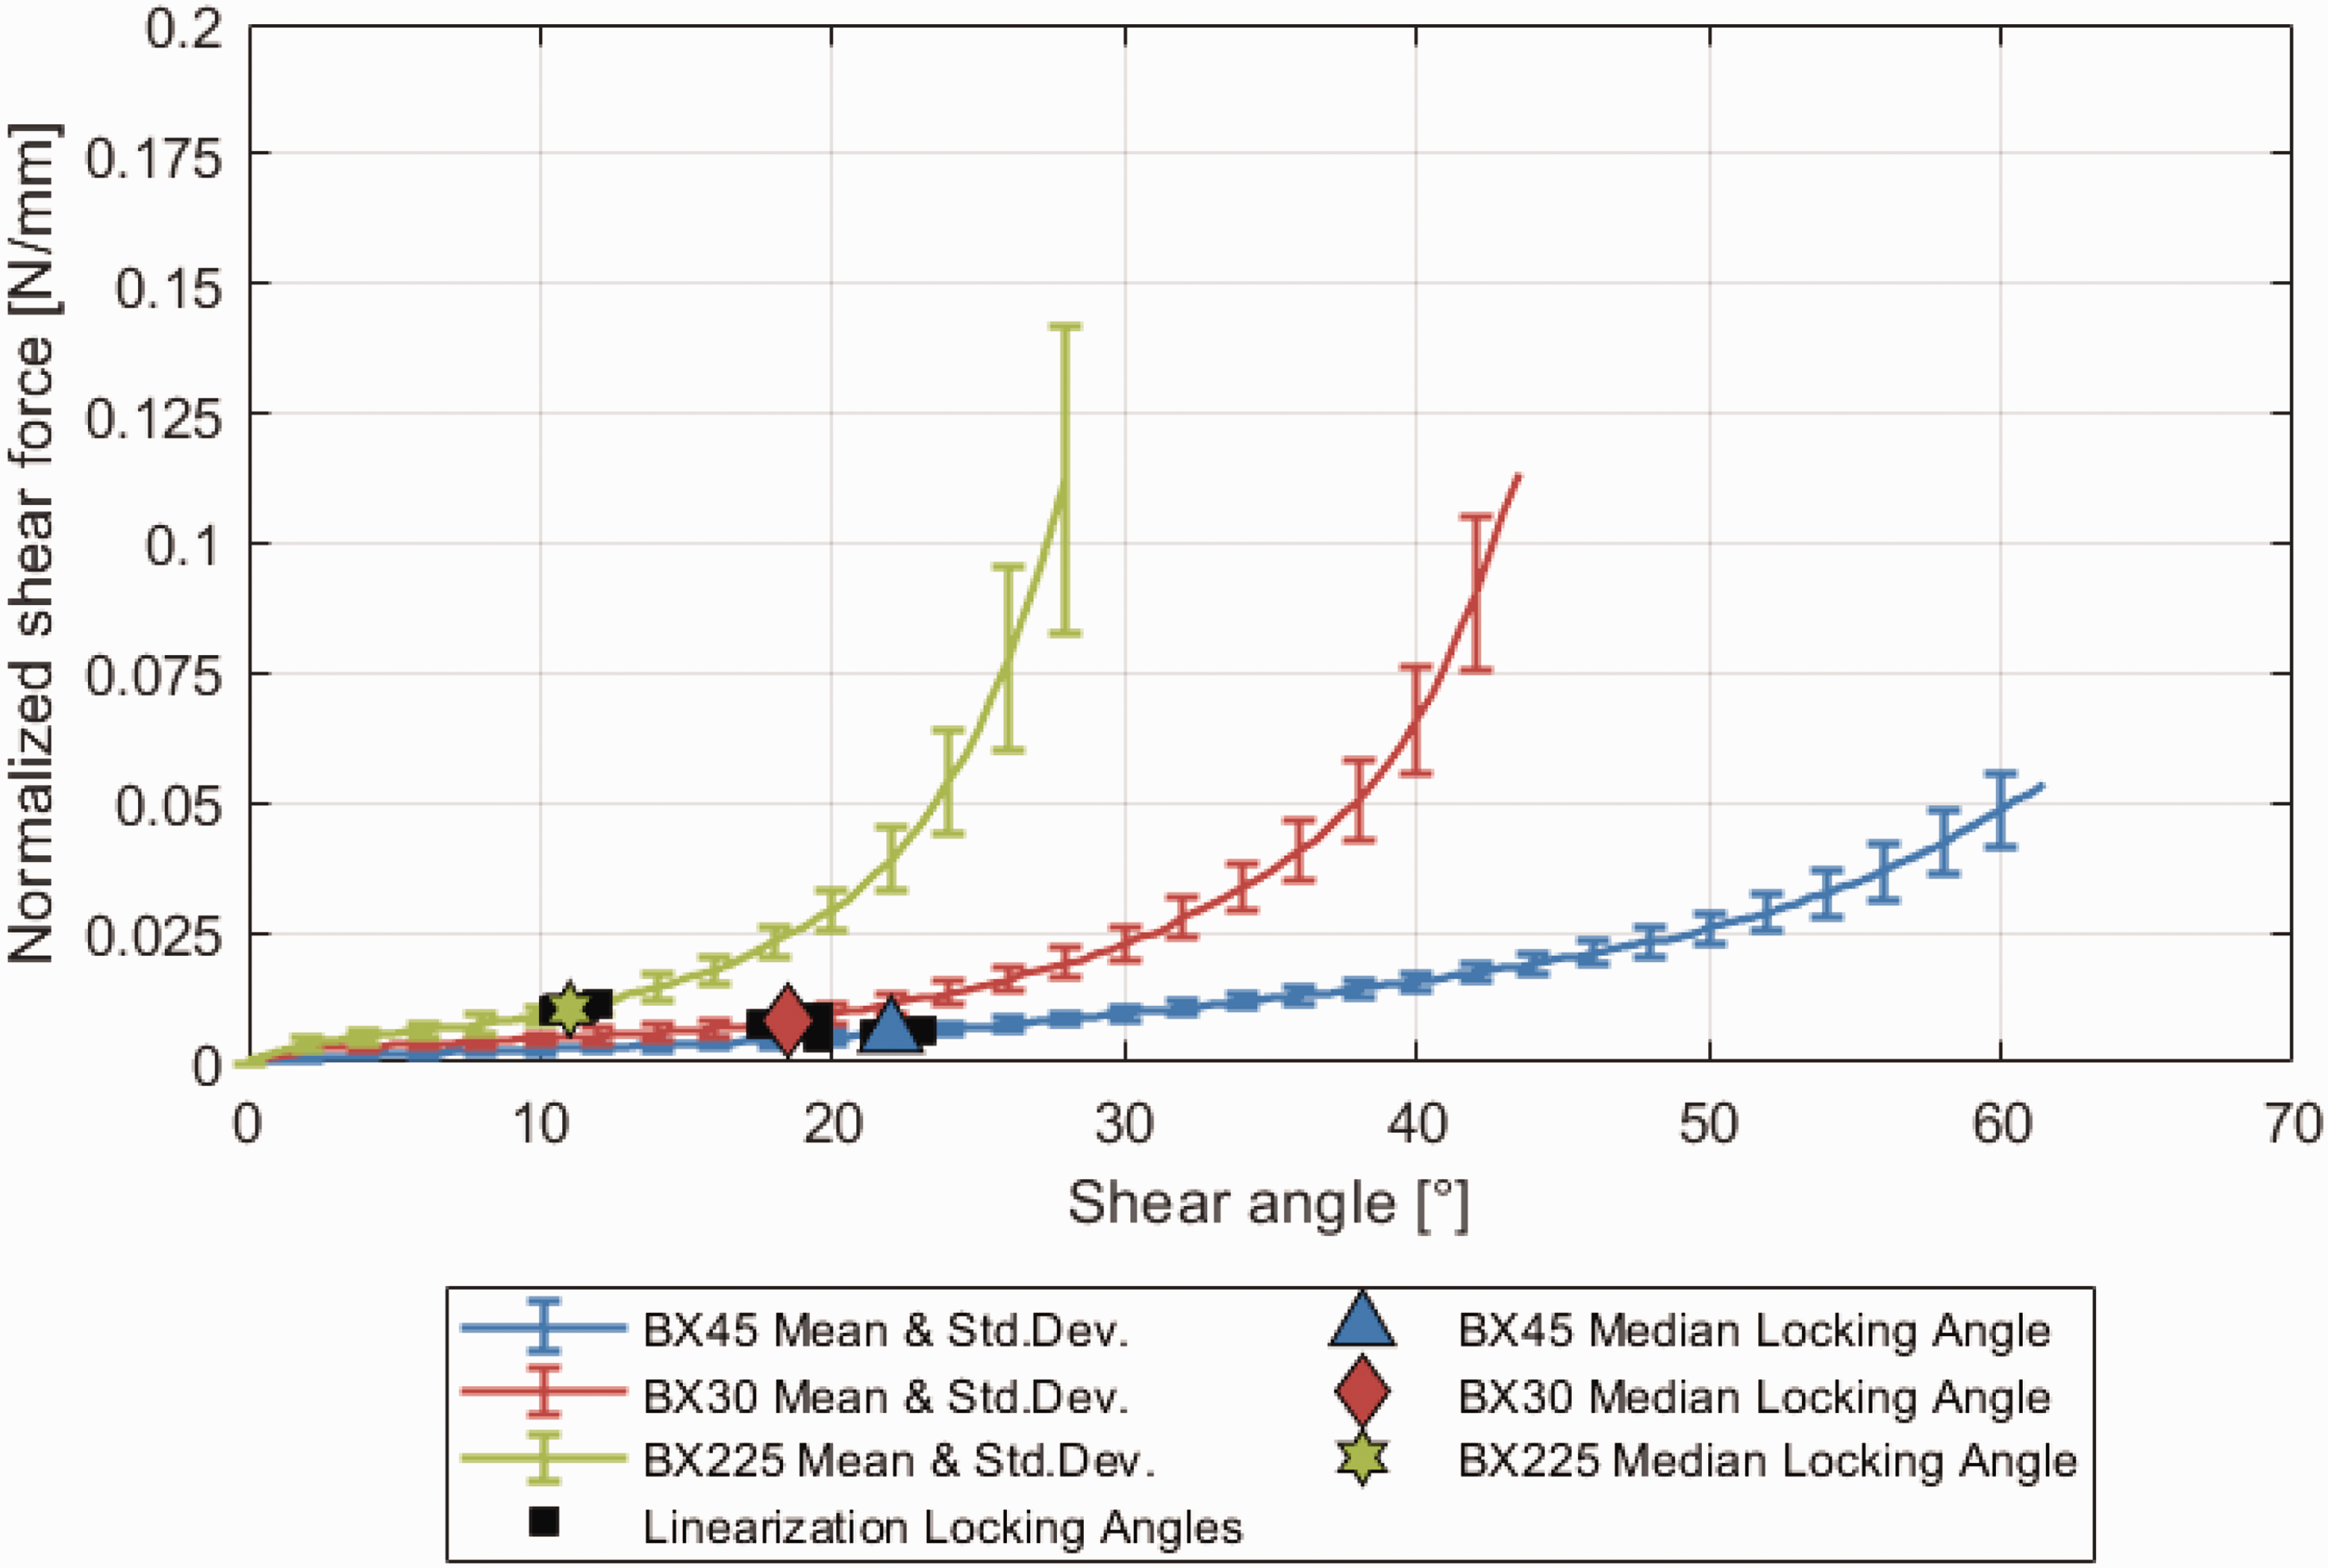
With three different non-crimp fabric types and two experiment runs per sample, a total of six data sets is recorded. The evaluation of the tests is executed with the previously outlined MATLAB routine. Figure 5 shows the normalised shear force versus shear angle curves for the first run of all three non-crimp fabrics on the picture frame at the University of Stuttgart. The typical shear force load curve can be observed, with a steep initial increase until around 2.5° of shear. Subsequently, the graph flattens and becomes more linear. All three non-crimp fabrics exhibit a similar slope, which confirms their identical architecture. The black squares in Figure 5 represent the locking angles that are obtained from the individual linearization with four, five, six and seven base points. The fabric locking angle (triangle for ±45°, diamond for ±30° and star for ±22.5°) is determined as the median of the four values.
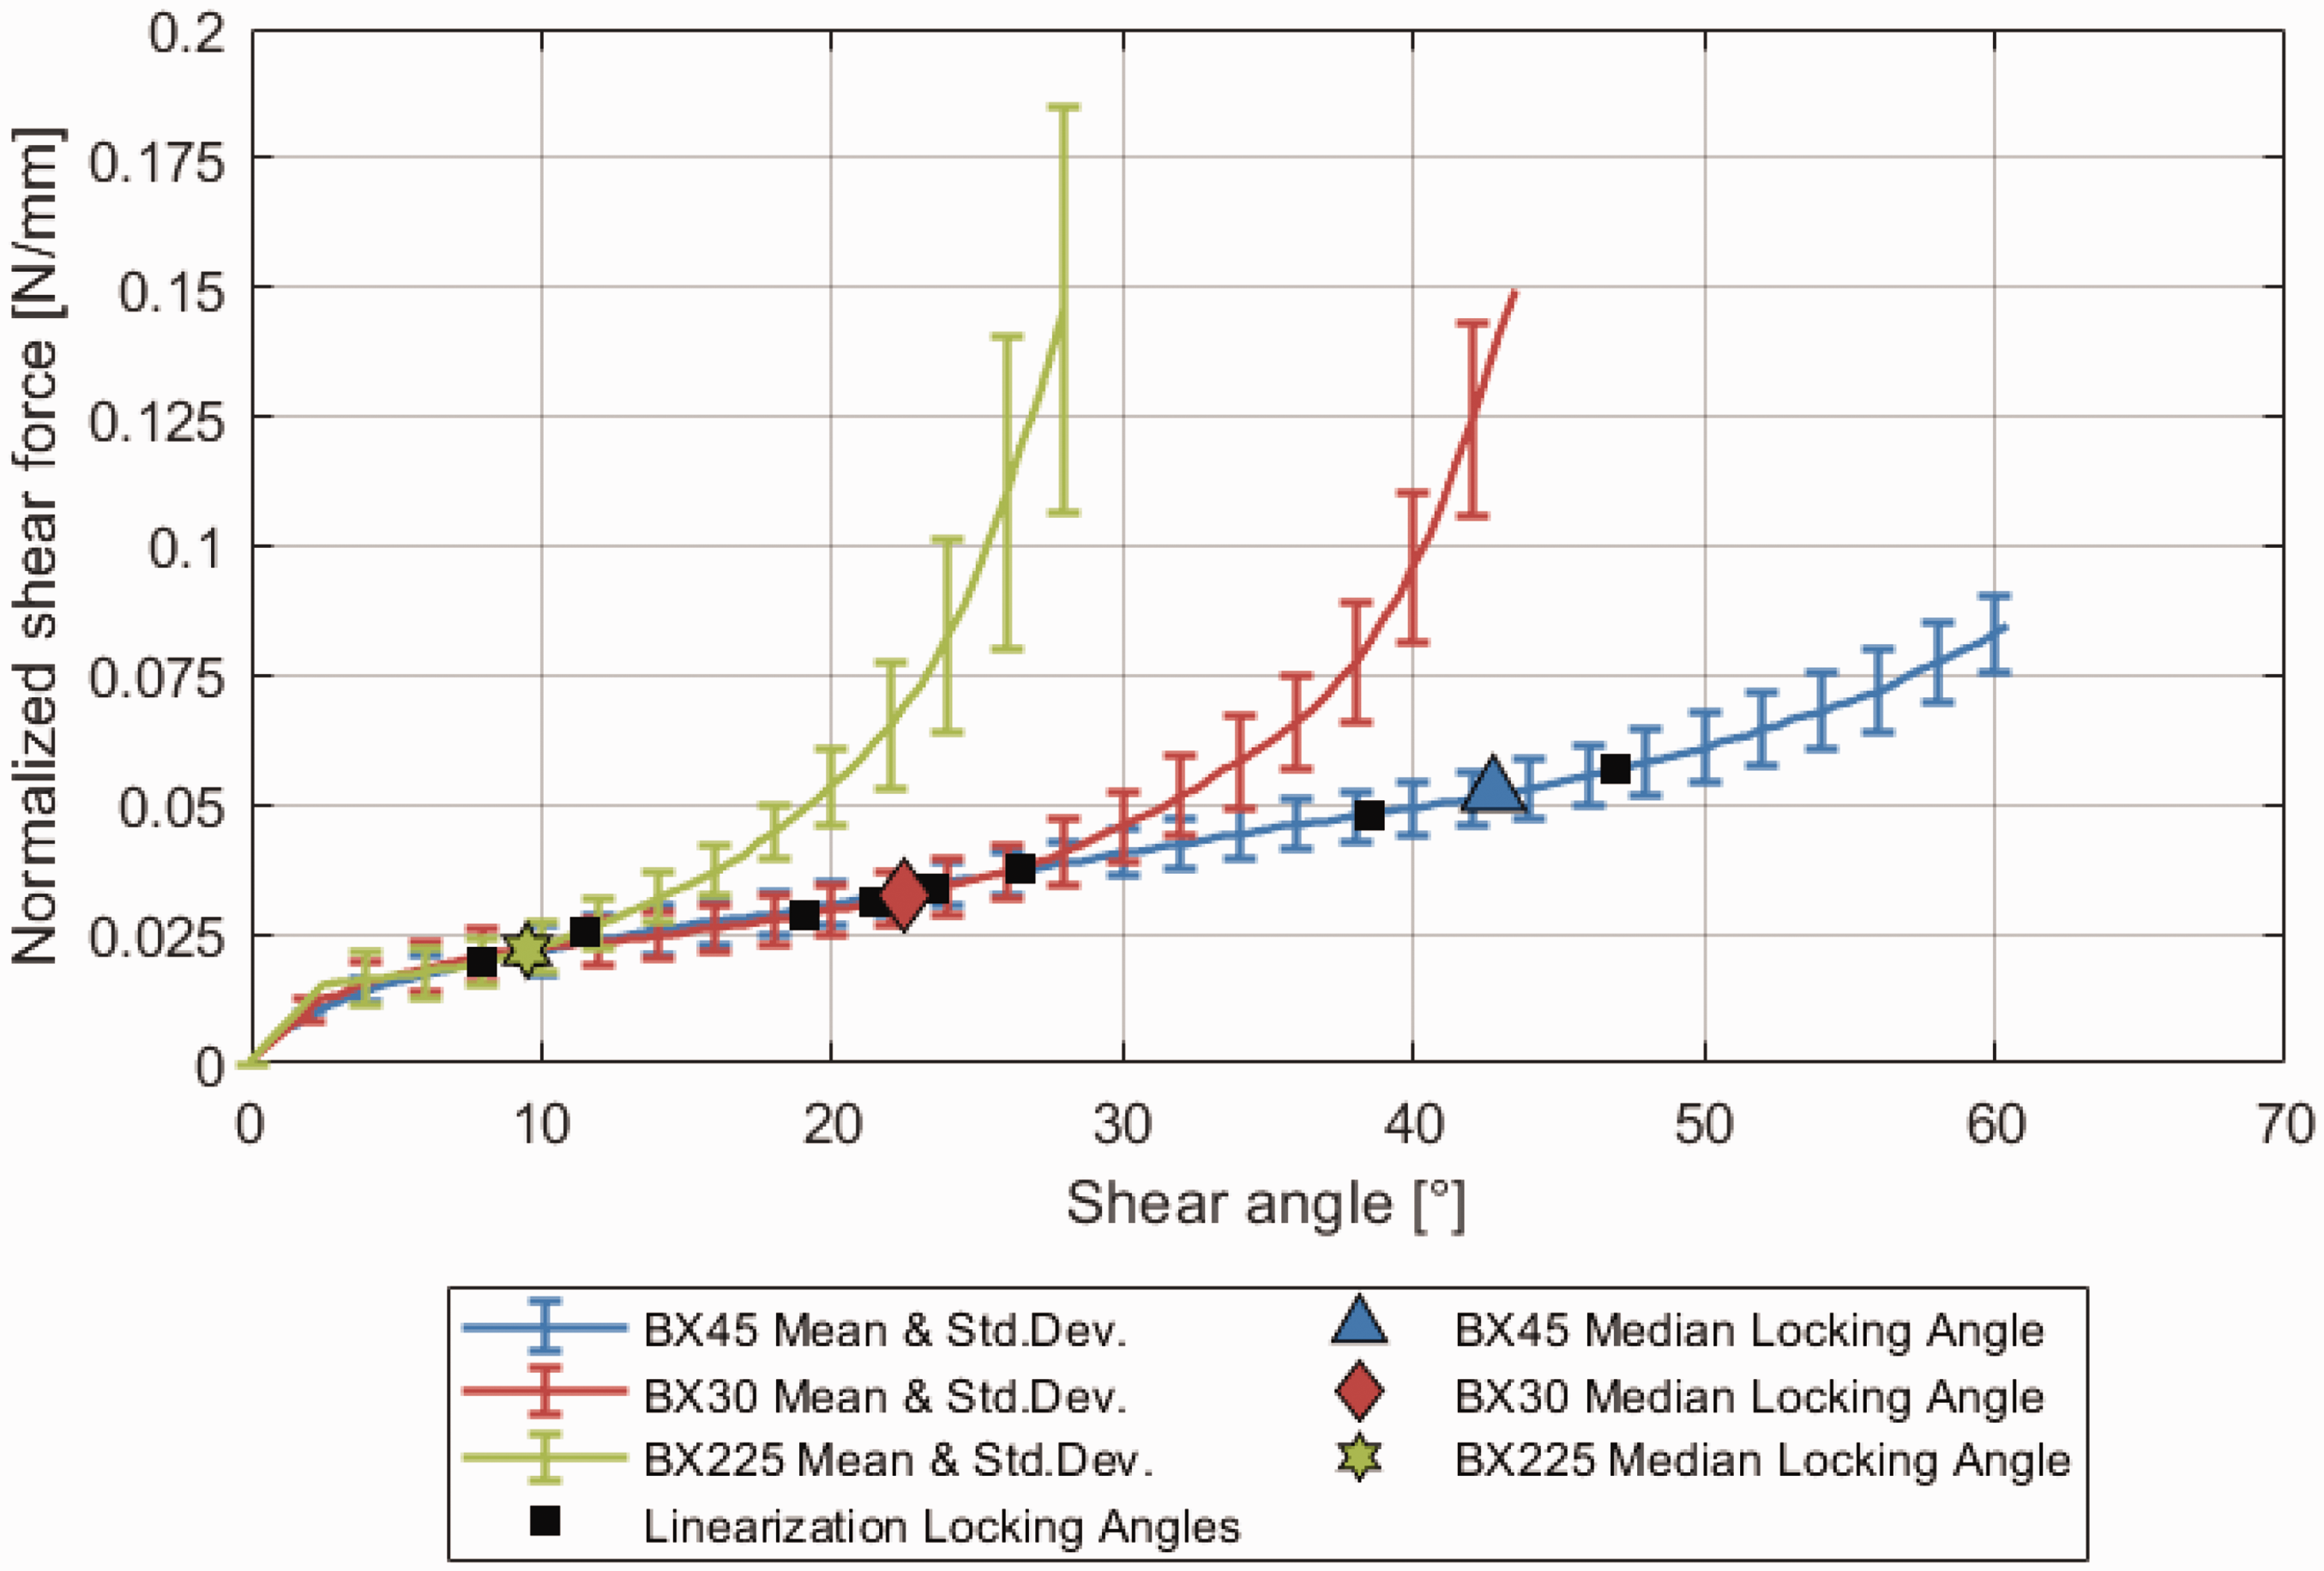
Picture frame test results of BX45, BX30 and BX225 samples, normalised shear force versus shear angle, initial run.
Tests of the BX225 fabric (green) experience a large increase in normalised shear force around the 10° mark. BX30 samples (red) lock noticeably later at around 22° and BX45 (blue) tests exhibit locking behaviour at 43° of shear. A clear trend of decreasing locking angles for smaller cross-ply angles is visible. It can further be observed that the increase in normalised shear force after the locking angle is more severe for shallower cross-ply angles. Towards the end of the test, the fibres become increasingly aligned with the testing direction. As a result, tensile loads can potentially contribute to the overall measured force of the testing machine.
The results of the subsequent second test runs are presented in Figure 6. While the shapes of the shear force vs. shear angle curve are similar, there are noticeable differences between the data sets from the first and the second run of the picture frame test. A clear decrease of the normalized shear force is apparent, as are smaller locking angles for two of the three non-crimp fabrics in this test. Error bars for all three non-crimp fabrics are reduced in size for the repeated run and thus confirm the expected decrease in standard deviation presented in previous literature findings.
Picture frame test results of BX45, BX30 and BX225 samples, normalised shear force versus shear angle, repeated run.
Both the initial and the repeated experiment run exhibit a trend of decreasing shear locking angles with decreasing cross-ply angles ±θ0, thus confirming the initial hypothesis. As a result, non-crimp fabrics with fibres oriented increasingly towards the 0° direction will experience shear deformation defects such as wrinkling at smaller shear angles. Their application to high-performance aerospace components is therefore restricted to part geometries with shear deformations of lower magnitudes.
Validation of picture frame experiment findings
To further validate the recorded locking angles from the shear experiments with the classic picture frame setup at the University of Stuttgart (labelled as PF1 onwards), supplementary shear deformation investigations with the ±θ0 non-crimp fabrics are conducted on two additional shear testing devices with varying dimensions and boundary conditions: one setup located at the Swinburne University of Technology and a secondary test rig at the University of Stuttgart (labelled as PF2 and PF3, respectively) [30].
Both the experiment and the data processing procedures are maintained consistent for the supplementary testing to achieve comparable results. After evaluating the normalised shear force versus shear angle curves, two additional sets of fibre orientation dependant locking angles are available for comparison.
Figures 7 and 8 show the evolution of locking angle over the cross-ply angle ±θ0 for the first (Figure 7) and the second (Figure 8) run of the experiments. A clear trend of decreasing locking angles for smaller cross-ply fibre orientation is obvious for both test runs. This observation is a crucial input for the forming envelope in the following subsection, as the non-crimp fabric locking angles constitute the upper formability limit.

Evaluation of locking angle over cross-ply angle, initial run.
Results for the repeated run exhibit a closer correlation as is expected from previous studies [7,25]. The reduced variation in the test data of the secondary runs can be attributed to a type of sample conditioning, where the primary run straightens the fibres and removes inhomogeneities.
Understanding the forming envelope and developing a shear forming limit curve
Based on the previous experimental investigations, this section presents the forming envelope for the shear deformation of ±θ0 non-crimp fabrics. The process window describes the correlation of their fibre orientations and the corresponding shear locking angles for the draping process. This complements previous studies which suggest replacing 0° reinforcement layers with such ±θ0 non-crimp fabrics. The concerning stiffening elements are merely gently curved; thus, the non-crimp fabrics do not experience large shear deformations during preforming. As a result, a reduced shear locking angle due to smaller cross-ply angles can still be accepted.
Previous research outlines how the required shear angle γ for curved stiffener geometries can be assessed depending on the elongation ε of the stiffener and the cross-ply angle ±θ0 of the non-crimp fabric [30]. This data essentially constitutes the lower bound of the forming envelope for curved stiffening elements. The results from the initial run of the shear testing experiments illustrate the upper bound of the forming envelope. Shear deformations above the locking angle from the study are not feasible due to defect development such as wrinkling. The combination of both lower and upper bound creates the said forming envelope, which is illustrated in Figure 9.

Evaluation of locking angle over cross-ply angle, repeated run.

Forming envelope depicting the non-crimp fabric cross-ply angle (x-axis), stiffener elongation (y-axis) versus the required shear angle and the locking angle (z-axis); preforming without shear locking is feasible in the coloured region.
The process window for feasible shear deformations consists of two three-dimensional surfaces intersecting each other: A parametric surface with two axes of curvature, defining the required shear angle γ for manufacturing a curved stiffener with elongation ε from a non-crimp fabric with cross-ply angle ±θ0. The dashed black line traces the theoretical extremum of shear deformation for a curved stiffening geometry. A combination of flat planes which outline the previously acquired shear locking angles for the non-crimp fabrics with varying cross-ply angle ±θ0 (independent from elongation ε). The solid blue, red and green lines depict the locking angles which were measured at ±45°, ±30° and ±22.5°, respectively.
For the shear deformation envelope, surface I acts as the lower bound, representing the minimum requirements for shear deformation respective to each curved stiffener geometry. Surface II acts as the global upper bound, constituting the maximum feasible shear deformation defined by the shear locking angle. Both surfaces intersect each other along the solid black line shown in Figure 9. On this line, the required shear angle γ to form the curved stiffener with the respective parameter set of ε and ±θ0 is equal to the shear locking angle γLock.
The process window subsequently enables a quick and intuitive judgement on the manufacturing feasibility of a curved stiffening element with a parameter set of ε and ±θ0: the coloured portion of the envelope to the left of the intersection outlines the range where preforming is feasible according to the shear elongation theory from [30] and the picture frame experiment results. However, combinations of ε and ±θ0 in the grey area to the right of the intersection must be avoided as the required shear angles γ exceed the non-crimp fabric locking angles.
Accordingly, non-crimp fabric material can be safely preformed with combinations of ε and ±θ0 if the resulting shear angles lie above surface I and below surface II.
Conclusions
This study examined the locking behaviour of three different non-crimp fabrics with varying cross-ply angles on three different test setups. A clear reduction of locking angles with more acute cross-ply angles is evident in Figures 5 to 8. The initial hypothesis of decreasing locking angles with shallower cross-ply angles ±θ0 was therefore proven. In conjunction with values from the literature, a forming envelope for the draping of ±θ0 non-crimp fabrics into curved stiffening elements could be generated, based on the measured locking angles. It should be noted that the shear test results of this study are specific to the material type described in Table 1. Results of shear experiments are highly dependent on fabric architecture and the comparability between different types of fabrics is therefore not automatically given. While the decreasing trend should prevail, exact values of locking angles will vary with fabric type and fibre orientation. Further studies are required to enhance the reliability of the locking angle trend.
To verify the fundamental findings of the shear experiments, preforming trials on production parts or reference geometries such as the double dome need to be conducted [38]. Given that previous findings have established a shear-tension coupling during picture frame testing, additional research is to be conducted on non-uniform distributions of normal tensions during the experiment, which can be enabled through segmented clamping capabilities of enhanced shear testing devices [39].
Footnotes
Declaration of conflicting interests
The author(s) declared no potential conflicts of interest with respect to the research, authorship, and/or publication of this article.
Funding
The author(s) received no financial support for the research, authorship, and/or publication of this article.