
Abstract
Porous membranes find natural application in various fields and industries. Water condensation on membranes can block pores, reduce vapour transmissibility, and diminish the porous membranes' performance. This research investigates the rate of water vapour transmission through microporous nylon and nanofibrous Gore-Tex membranes. Testing consisted of placing the membrane at the intersection of two chambers with varied initial humidity conditions. One compartment is initially set to a high (
Keywords
Introduction
Cotton garments, which are constructed from natural fibres, aid body temperature regulation due to the fabric's pores, which allow moisture evaporating from the skin to leave the clothing envelope without significant resistance [1]. More recently, breathable, thin synthetic materials such as Gore-Tex have been developed. Gore-Tex consists of nanoporous layers of expanded polytetrafluoroethylene that allow air and water vapour to pass through them. Such materials have traditionally been used to make windproof clothing and are now being tested in other applications such as building construction [2].
A growing application of porous membranes is in pressure-relief vents for electronic enclosures, such as LED lights or CCTV cameras. These devices generate large amounts of heat and can not be hermetically sealed due to the internal pressures that develop within their enclosures during operation. Instead, they are equipped with porous membrane vents that allow air and water vapour to pass through while blocking dust particles and water droplets [3]. However, if sufficient water vapour accumulates inside the enclosure and there is a large enough temperature drop, that liquid will condense [4,5] on the electronic components, possibly causing damage. To correctly design these devices, it is essential to know the rate at which moisture diffuses through these porous membranes.
Moisture permeability is a physical property of fabrics and nanofibrous filters that depends on their porosity [6], which may vary depending on operating or environmental conditions. Mechanical stresses, such as those generated by stretching, can change the pressure drop of air flowing through porous filters [7,8]. Temperature changes may also produce mechanical stresses that alter pore geometry [9]. More importantly, in urban environments, solid particle pollutants can accumulate on filters blocking their pores over time [10]. The reduced number of pores in a contaminated porous membrane results in an increased pressure drop across its structure [11], increasing its resistance to vapour transmission. Additionally, increased fluid velocity due to wind can alter the convective mass transfer to the porous membrane, altering the moisture permeation rate [12,13].
Wetting of a porous membrane due to water impingement or condensation can also impact its permeability. The swelling of hygroscopic cotton fibres has been shown to reduce vapour transmission [14]. Water condensation on fabrics has been shown to influence their moisture transmissivity [15,16], but the mechanism behind this is not well understood. Depending on the temperature and ambient humidity conditions, the pores in a membrane could either act as moisture sink, where the vapour condenses, or a source, where accumulated water evaporates and adds to that diffusing through it [17]. Farnworth et al. [18] observed a significant fluctuation in Gore-Tex's water vapour resistance as temperature and relative humidity were varied.
The work is the first to investigate the impact of pore blockage and water condensation on the water vapour transmissivity of hydrophobic microporous and nanofibrous membranes. Testing consisted of placing the membrane at the intersection of two chambers with varied initial humidity conditions. One compartment is initially set to a high water vapour concentration and the other low, with changes in humidity recorded as a function of time. The impact of pore blockage was explored by pre-wetting the membranes with water or interposing glycerine onto the membrane pores before testing. Pore blockage was measured using image analysis for the nylon membrane.
Experimental setup and data processing methodology
Experimental apparatus
An experimental facility was constructed to investigate the moisture transmission behaviour through porous membranes. The test setup is shown in Figure 1. It consists of a dual-chamber apparatus and an air supply unit to study moisture flow from a moist environment chamber into a dry environment chamber through the porous membrane.

Schematic diagram of the experimental apparatus.
Dual-chamber apparatus
A test chamber was built consisting of two compartments, one “moist ” in which the relative humidity (
The test membrane was installed across the opening of this fitting with a steel washer that pressed the membrane's circumference against a flange, as shown in Figure 2. Prior to testing, the two chambers are isolated from each other by a flat magnetic lid with an attached silicone gasket that covered the fabric membrane (see Figure 2), blocking the linking hole until the desired humidity conditions are reached. The magnetic lid does not directly contact the fabric membrane to avoid contamination. A linear solenoid (P/N: 7723K5, McMaster-Carr®, U.S) connected to the magnetic lid was used to remove it, exposing the porous membrane at the start of testing.

Schematic diagram of the vent sealing mechanism. With the activation of a toggle switch, the magnetic lid is pulled away, exposing the test membrane.
Air supply unit
A description of the air supply lines is shown in Figure 1. Air with low water vapour concentration (
Selected porous membranes
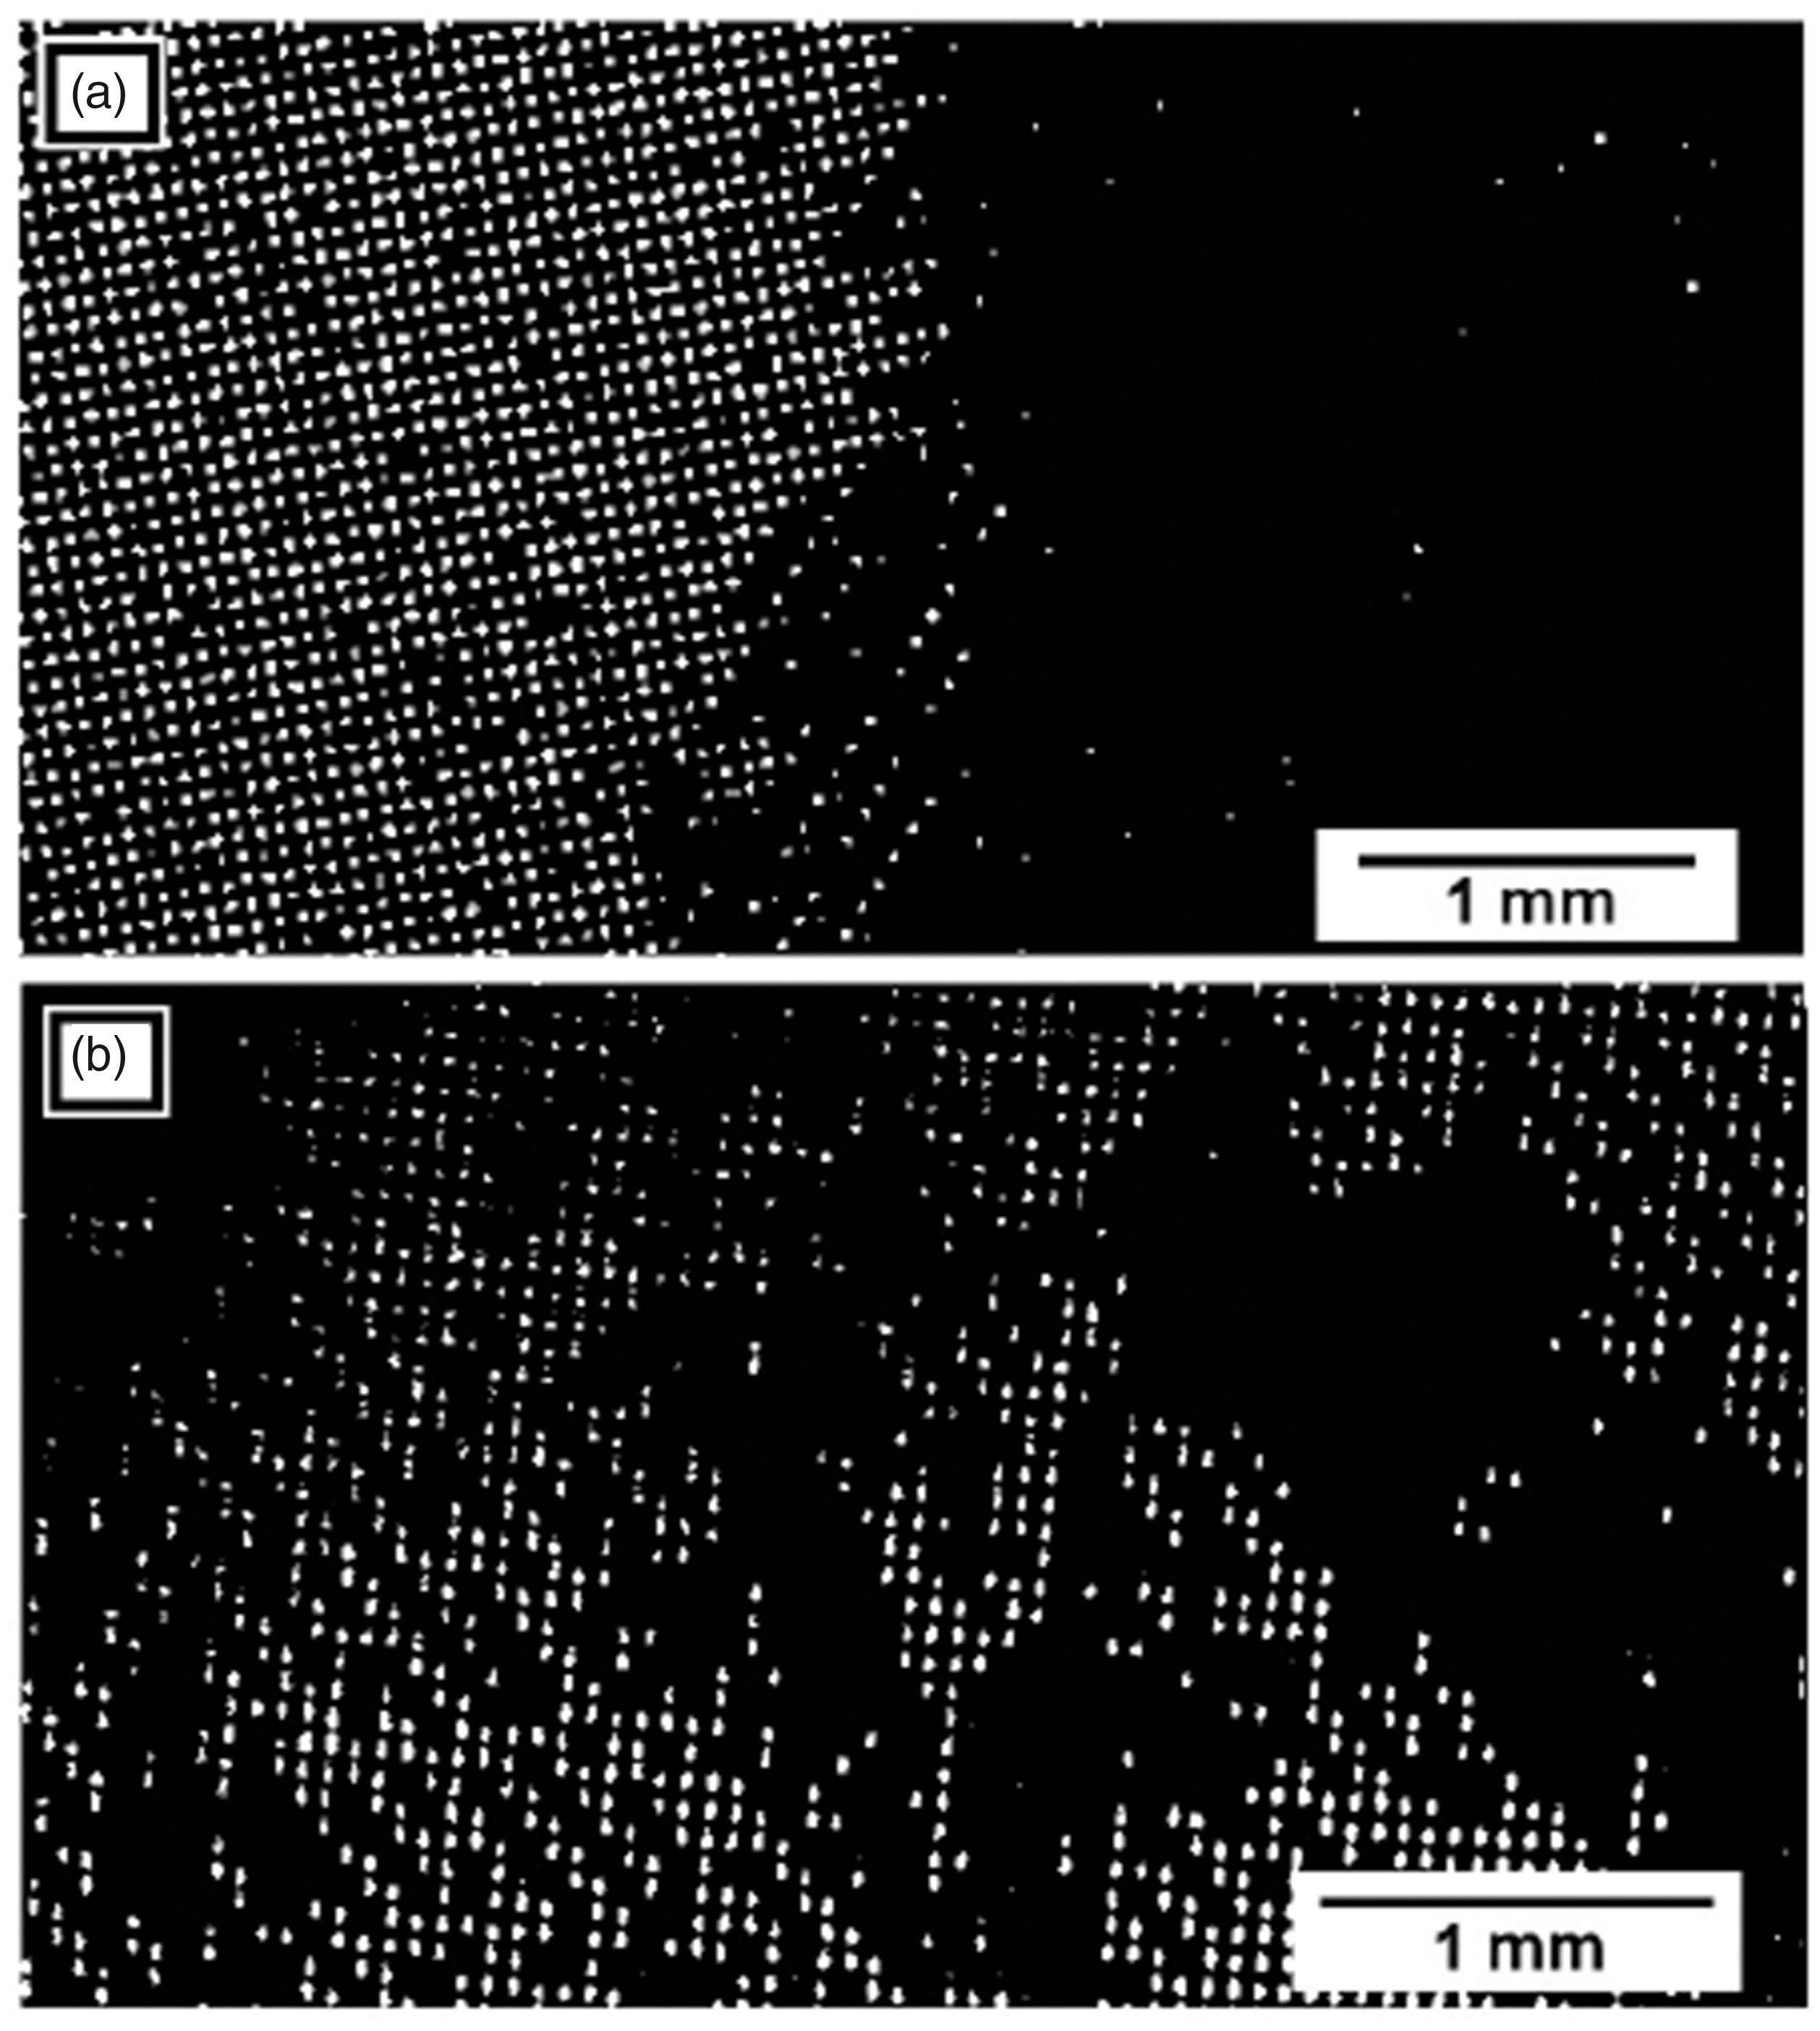
This study investigated two different fabric membranes: a microporous nylon membrane and a nanoporous Gore-Tex membrane. Their specifications are listed in Table 1 [19,20]. An SEM (Scanning Electron Microscope) image of the nylon membrane is given in Figure 3(a), and an SEM image of the Gore-Tex membrane is shown in Figure 3(b). It can be seen from Figure 3(b) that the Gore-Tex membrane is constructed of multiple layers of expanded PTFE with fibres in each layer oriented randomly.
Technical specifications of the tested fabric membrane.


(a) SEM view of the nylon membrane under 100× magnification. (b) SEM view of the Gore-Tex membrane with a 250× magnification. The Gore-Tex membrane has a nano-porous structured mesh underneath a larger, randomly structured layer.
Experimental procedure
Test procedure
Before starting the experiment, the two chambers were isolated by the magnetic lid (see Figure 2) covering the porous membrane. The desired relative humidity conditions in each chamber were established by supplying moist (
Images of the nylon porous membranes were captured using a Nikon D90 camera equipped with a macro lens (AF Micro Nikkor, Focal length: 60 mm, Aperture: 32 mm) directly pointing at the membrane, which was back-illuminated by a LED light (see Figure 1). Image analysis of the Gore-Tex membrane was not possible due to its dense multi-layered nature obfuscating any back illumination. For the nylon membrane, the captured raw images were converted to grayscale and binarized with darker cells (pores filled with liquid and the membrane itself) set to 0 (black). Lighter pixels (empty pores) were set to 1 (white). From the binarized image, the breathable area of the membrane was calculated.
Data collection, processing, and analysis methodology
The mass flow rate of moisture (ṁv) into the dry chamber of volume (Vd) through a piece of fabric is a function of the area of the membrane (A) and the difference in moisture concentrations between the two chambers (Cv,m in the moist and Cv,d in the dry chamber), which is given by
Equation (1) can be rearranged to give the diffusion coefficient as a function of the instantaneous rate of change of moisture concentration and the difference in moisture concentrations of the two chambers, as given by equation (2). The rate of change in moisture concentration of the initially dry chamber (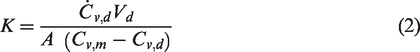

Moisture concentration variation in both chambers is plotted as a function of time during a test of water vapour diffusion from the wet chamber to the dry chamber through a dry, clean nylon mesh.
Equation (2) can be discretized into a form suitable for calculating K from experimental measurements of vapour concentration at time intervals Δt
A psychrometric function was used to convert experimentally measured temperature and relative humidity readings into moisture concentration values for both the moist and dry chambers (Cv,m and Cv,d) [23]. Figure 4 shows the moisture concentration variation with time for both wet and dry chambers in a nylon membrane permeation test. The two chambers were supplied with moist and dry air, respectively, until the wet chamber reached a relative humidity of above 95% and the dry chamber had a relative humidity of about 10% prior to the vapour diffusion experiments. These initial relative humidity values were selected as they were the highest and lowest that could be achieved repeatably with the experimental apparatus used. The moist chamber concentration remains constant, while the dry chamber increases with time as vapour diffuses through the membrane. The temperature gradient between the two chambers was negligible, and the wall temperatures were in equilibrium with the external and internal ambient air.
Two separate methods were used to calculate K. In the first approach; a logarithmic function was fit through the data for (
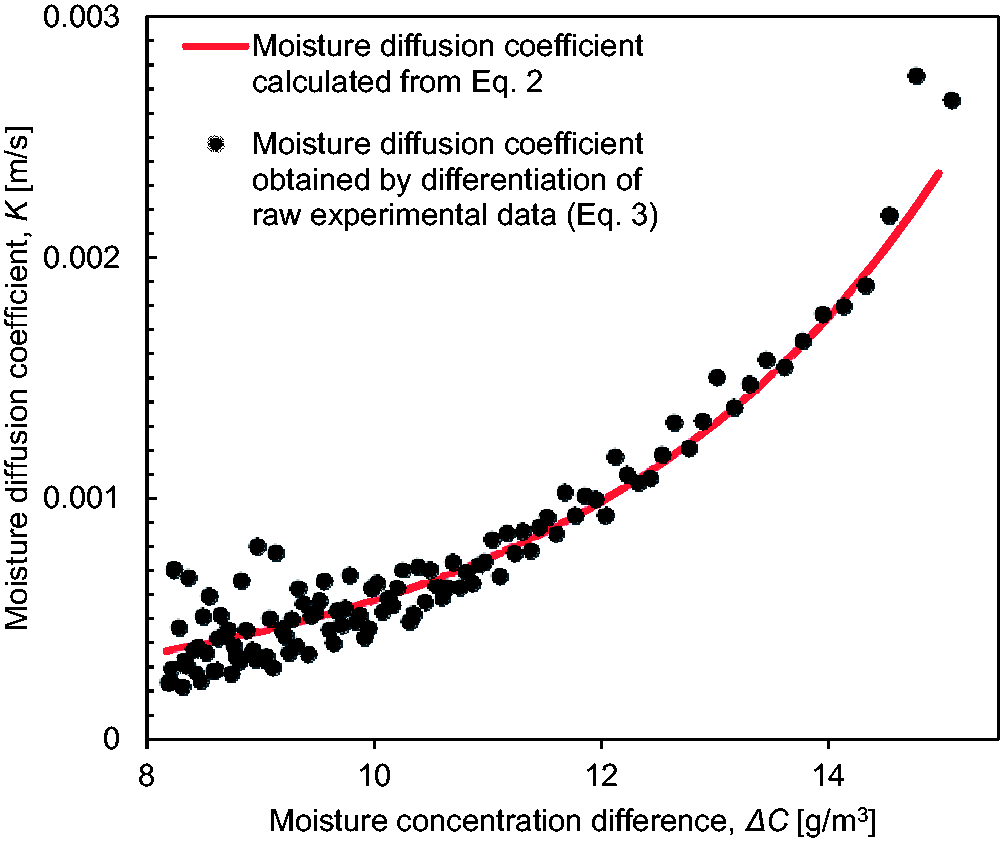
Moisture diffusion coefficient of the dry nylon membrane plotted against concentration difference between the chambers calculated using equation (2), shown by the solid line, and equation (3), shown by scattered data points.
The continuous line in Figure 5 was calculated using equation (2), while the data points were determined using equation (3). The data points show some scatter, especially at low concentration differences, since numerical differentiation magnifies variations in experimental measurements. Good agreement between the two data sets is observed. All further calculations of moisture diffusion coefficients presented in this research are determined using equation (2).
Repeatability and uncertainty analysis
Three experiments with similar initial conditions were performed on the microporous nylon membrane to investigate experimental repeatability. The relative discrepancy was obtained as the ratio of the standard deviation of moisture concentrations in the dry chamber at a given time to the mean value of moisture concentration. It was observed that the discrepancy remained <5%. To test the reliability of moisture diffusion coefficient analysis, the root mean square error of the exponential fit (see Figure 4) was obtained as
Results and discussion
Dry nylon mesh and non-evaporative liquid contamination
The calculated vapour diffusion coefficient (K) of a dry nylon membrane at room temperature is a function of the moisture concentration difference (ΔC) across it, as shown by the curve (solid red line) in Figure 5. The variation can be described by an exponential function
To investigate the impact of pore blockage on the porous membrane, a small droplet of glycerin was placed on the nylon membrane. A sample processed image of the porous membrane is shown in Figure 6(a), where the white dots represent open pores, and black spaces denote the porous membrane fibres or glycerin blockage. Glycerin was chosen because it is a safe chemical to work with that does not evaporate significantly at room temperature [24] and has high viscosity so that it remains where it is placed. The blocking part of the membrane should not change the value of K (which is defined per unit area of the breathable membrane) but reduces the open area (A) for vapour transmission in equation (1). The blockage area was varied from 8% to 78% by varying the amount of glycerin deposited. Measurements of humidity levels in the two chambers were used, following the procedure described above and equation (2), to determine the vapour diffusion coefficient values. Four different sets of tests were done in which the amount of blockage was progressively increased (8%, 21%, 43%, and 78% of the open membrane area), reducing A in equation (3) by corresponding amounts. Moisture diffusion coefficients for all four experiments, calculated at vapour concentration differences (ΔC) of 10 g/m3, 12 g/m3, 14 g/m3, and 16 g/m3, are plotted in Figure 7. The variation in calculated values for K is within the experimental uncertainty.
Processed images of the nylon mesh (a) partly contaminated by glycerin oil (b) with partial pore blockage due to the presence of condensed water on it.

Moisture diffusion coefficient of nylon membrane measured with varying amounts of pores blocked by glycerin (8%, 21%, 43%, 78%), for moisture concentration differences of 10, 12, 14 and 16 g/m3.
Water condensation and liquid water obstruction of nylon mesh filter
Water condensation on the porous membrane results in pore blockage and subsequently reduces the area open for vapour transmission. However, this liquid film can also evaporate from the membrane adding to the vapour to pass through the membrane. To understand the effect of water blockage on moisture transmission, it is essential to separately quantify the contributions of water evaporating from the wet membrane and that which transfers through the porous membrane.
To investigate the water evaporation rate from the membrane, a small container of water with an open surface area of 94 mm2 and depth of approximately 5 mm was placed within the sealed test chamber with an initial temperature of 22°C and relative humidity of 29%. As the water evaporated, changes in relative humidity were recorded and used to calculate vapour concentration. The increase in vapour concentration as a function of time is shown in Figure 8.

Change in vapour concentration due to film evaporation calculated from equation (5) (solid line), compared with experimental measurements (data points).
The experimental results were compared with the model of Boelter et al. [25], which predict that the evaporation rate (E [kg/hour]) from the surface of a liquid layer, in the absence of any convective flows in the air surrounding it is given by
To simulate water condensation on the exposed membrane, warm moist air (T ≈ 47°C,
As the experiment proceeded, the water on the membrane evaporated so that the number of pores blocked by water decreased. Figure 9 shows photographs taken at 5 min intervals of a portion of the nylon membrane, with the darker regions revealing wet sections where pores were blocked. As the water evaporated, the dark area decreased as more pores became open. Figure 10 shows the variation with time of the fraction of pores in the membrane blocked by water, measured at 3-minute intervals. Initially, 39% of the pores were blocked, but this decreased to 23% after 15 min and then stayed constant at this value.

Photographs of a section of the partially wet nylon membrane during test at t = 0, 5, 10, and 15 min.

Fraction of pores in nylon membrane blocked by water as a function of time. Pore blockage tends to shrink due to the evaporation of water from the wet surface of the porous fabric.
Figure 11 shows the measured rate of change of moisture concentration in the initially dry chamber as a function of the difference in moisture concentration between the two chambers separated by an initially wet membrane. Included is the predicted rate of change (solid line) using the value of K from equation (4) and the open pore area determined from Figure 10. The predicted values are less than those measured, with a growing difference between the two as the moisture concentration difference increases. The additional moisture detected can be attributed to the evaporation from the surface of the membrane.

Expected vapour permeation rate plotted against moisture concentration difference compared with the measured rate of change of moisture concentration within the initially dry chamber.
To estimate the rate of water evaporation from the surface of the membrane, it is necessary to know the wetted area

(A-1) Assumed wetted area used to model evaporation (upper bound) contains the pore area and the surrounding mesh. (A-2) Schematic cross-sectional representation of the wetted filter, showing that the fibre's surface is wet as well as the filled pore. (B-1) Assumed wetted area used to model evaporation (lower bound) only containing the blocked pores. (B-2) Schematic cross-sectional view of the wet pore, area of which was used for evaporation modelling.
The total amount of water evaporated from the surface of the film was calculated using either

The measured rate of change of moisture concentration compared to the modelled rate of change of moisture concentration as a function of the difference in moisture concentration between the two chambers separated by a wet nylon membrane. The total modelled rate of moisture concentration combines the estimated permeation with the modelled evaporation. The upper bound model uses
Water condensation and liquid water obstruction of Gore-Tex membrane
The moisture transmissivity coefficients of Gore-Tex membranes were characterized for three cases; initially dry and those exposed to a warm water mist for either 40 or 120 minutes prior to testing. The test procedure was identical to that followed for the nylon membrane, except that it was not possible to image water condensation on the Gore-Tex membrane due to its multi-layered dense structure (see Figure 3(b)) did not allow for light to pass through it. The open area for vapour diffusion was therefore not measured.
Figure 14 shows the vapour diffusion coefficient (K) of the dry Gore-Tex membrane as a function of the moisture concentration difference. When ΔC < 8 g/m3 K approaches zero, showing that there is negligible diffusion of vapour through the Gore-Tex membrane. This behaviour is different from that of the nylon membrane, which allowed significant diffusion through it even at low values of ΔC (see Figure 6). At more substantial moisture concentration differences (ΔC >12 g/m3), values of K were higher than those of nylon. From this data, the moisture diffusion coefficient (K) through the Gore-Tex membrane for a given moisture concentration difference (ΔC) across it can be approximated by

Moisture diffusion coefficient of dry Gore-Tex membrane plotted as a function of moisture concentration difference of either side of the membrane.
Prolonged exposure to a heated flow of moist air prior to testing significantly reduced vapour diffusion through the Gore-Tex membrane. Figure 15 shows the rate of increase in moisture concentration in the dry chamber as a function of moisture concentration difference for a dry membrane and those that had been exposed to a warm water mist for 40 min and 120 min, respectively. For ΔC >13.5 g/m3, the dry membrane had the highest vapour diffusion rate, whereas those exposed to moisture had lower diffusion rates. It is plausible that the pores in the membrane were blocked by condensed water, which prevented vapour diffusion. The diffusion of water through the membrane exposed to the mist for 120 min was much lower than that exposed for 40 min.

The measured rate of change of moisture concentration in the initially dry chamber as a function of the difference in moisture concentration between the two chambers separated by a Gore-Tex membrane (Gore-VENT). Results are shown for an initially dry membrane and those exposed to warm, moist air for 40 or 120 min prior to the start of the test.
At low concentration differences (ΔC <13.5 g/m3), the moisture concentration rate to the dry chamber was slightly greater for the pre-wetted membranes than the dry membrane. This may be due to evaporation from the surface of the membranes rather than diffusion through them. Since the diffusion rate is low at lower values of ΔC, water evaporating from the surface of the membrane may be a significant portion of the moisture entering the dry chamber.
Conclusions
This research investigated the rate of water vapour transmission through microporous nylon and nanofibrous Gore-Tex membranes. The mass flow rate of water vapour diffusing through a porous membrane is shown to be proportional to both its area and the difference in vapour concentration across its two faces, such that
At low vapour concentration differences (
Footnotes
Declaration of conflicting interests
The author(s) declared no potential conflicts of interest with respect to the research, authorship, and/or publication of this article.
Funding
The author(s) disclosed receipt of the following financial support for the research, authorship, and/or publication of this article: The authors gratefully acknowledge funding for this project provided by the Natural Sciences and Engineering Research Council of Canada.