
Abstract
It is widely known that the pore size of a meltblown fiber assembly extensively affects the final applications of its products. We have developed a model for simulating melt-blowing production to investigate the formation mechanism of a fiber assembly. In this study, we calculated the pore size under different production conditions using the model. The predicted results reveal the relationship between the pore size and the production conditions, namely, the air jet pressure, suction pressure, die temperature, polymer flow rate, die to collector distance, and collector speed. The predicted results also verified the experimental trends reported in previous studies. High air jet pressure and die temperature tend to generate smaller pores, while a large polymer flow rate, die to collector distance, and collector movement speed contribute to the production of larger pores in the fiber assembly. In addition, the circularity was predicted in this study to describe the pore shape. The numerical investigation of virtual production is a novel method in which the expected pore size and corresponding production conditions can be easily obtained using a computer with a few keystrokes and mouse clicks.
Introduction
The melt-blowing process is a commercial single-step process that is commonly used for the fabrication of fiber assembly products containing microfibers. In the fabrication process, a polymer is melted and squeezed out of an extruder. Then, the molten polymer is blown by a hot and high-speed air jet to form microfibers. These fibers are collected on a grid-like collector. The fiber assembly is then strengthened by bonding using two hot rollers to form the final meltblown nonwoven material. Owing to the fine fibers, meltblown (MB) nonwoven products usually have small pores and large specific surface areas. Thus, these products are widely employed in liquid filtration, air purification, and oil absorption. Many experimental works have investigated the pore structure and melt-blowing fabrication conditions to further control the pore size of the MB fiber assembly products.
The fiber diameter and fiber assembly thickness are strongly related to the pore size. For example, Lee and Wadsworth [1] found a decrease in the pore size of an MB fiber assembly when the assembly consists of finer fibers. By using an image analysis method, Chhabra [2,3] found that fast air jets produce fine fibers and micropores. Additionally, Zhang and Chen’s work [4] confirmed a common trend that thick nonwoven products usually have relatively small pore sizes. Therefore, the conditions that affect the fiber diameter and thickness can also change the pore size. It has been found that the achievement of finer fibers [5] and larger pore sizes [6] is, to a limited extent, dependent on the use of a longer die to collector distance (DCD). A higher throughput rate increases the fiber diameter and pore size [7]. High-speed air jets produce finer fibers and smaller porosities accompanied by smaller pore sizes in the fiber assembly [7,8]. However, much lighter fibers are easily blown into the air by a powerful air jet [9,10], which produces a non-uniform pore size distribution. Bresee and Qureshi [11] determined that the die temperature can effectively reduce the fiber diameter and pore size. Additionally, the thickness of the fiber assembly is affected by the collector speed. For example, a slow-moving collector can strongly increase the thickness and further reduce the pore size of the fiber assembly [12].
These experimental works demonstrated a clear connection between the processing conditions and the pore structure of the fiber assembly. However, theoretical studies on the pore structure are still scarce. This is mainly because the pore structural parameters should be calculated based on the predicted fiber assembly morphology. However, many theoretical simulations have focused excessively on fiber formation, and not sufficiently on the fiber assembly morphology, which to the best of our knowledge, has only been studied in a few works. The fiber assembly formation was studied in an earlier theoretical work using the Markov stochastic process method [3]. However, this work did not provide further details on the prediction of the structural parameters. Yarin et al. [12–14] developed a quasi-one-dimensional model to study the fiber assembly morphology on the collector, and successfully predicted the fiber diameter, basis weight distribution, fiber orientation, porosity, and permeability. In our previous works, we introduced a different fiber assembly morphology simulation [15–17]. However, none of these works predicted the pore structure in the fiber assembly. Thus, in this article, we introduce a prediction method for the pore structure. Corresponding experiments were conducted to verify the predicted results. This work, therefore, bridges theoretical research with experimental measurements in the study of MB fiber assembly fabrication conditions and their structures.
Numerical simulation
Fiber dynamics in melt-blowing
In our model introduced in a previous work [15], the fiber is composed of many fiber elements. Each fiber element connects two beads through a Maxwell model component (a Newton dashpot and a Hook spring), as shown in Figure 1. Each fiber element can be easily stretched and bent. The molten polymer extruded from the die is driven and stretched by air drag (

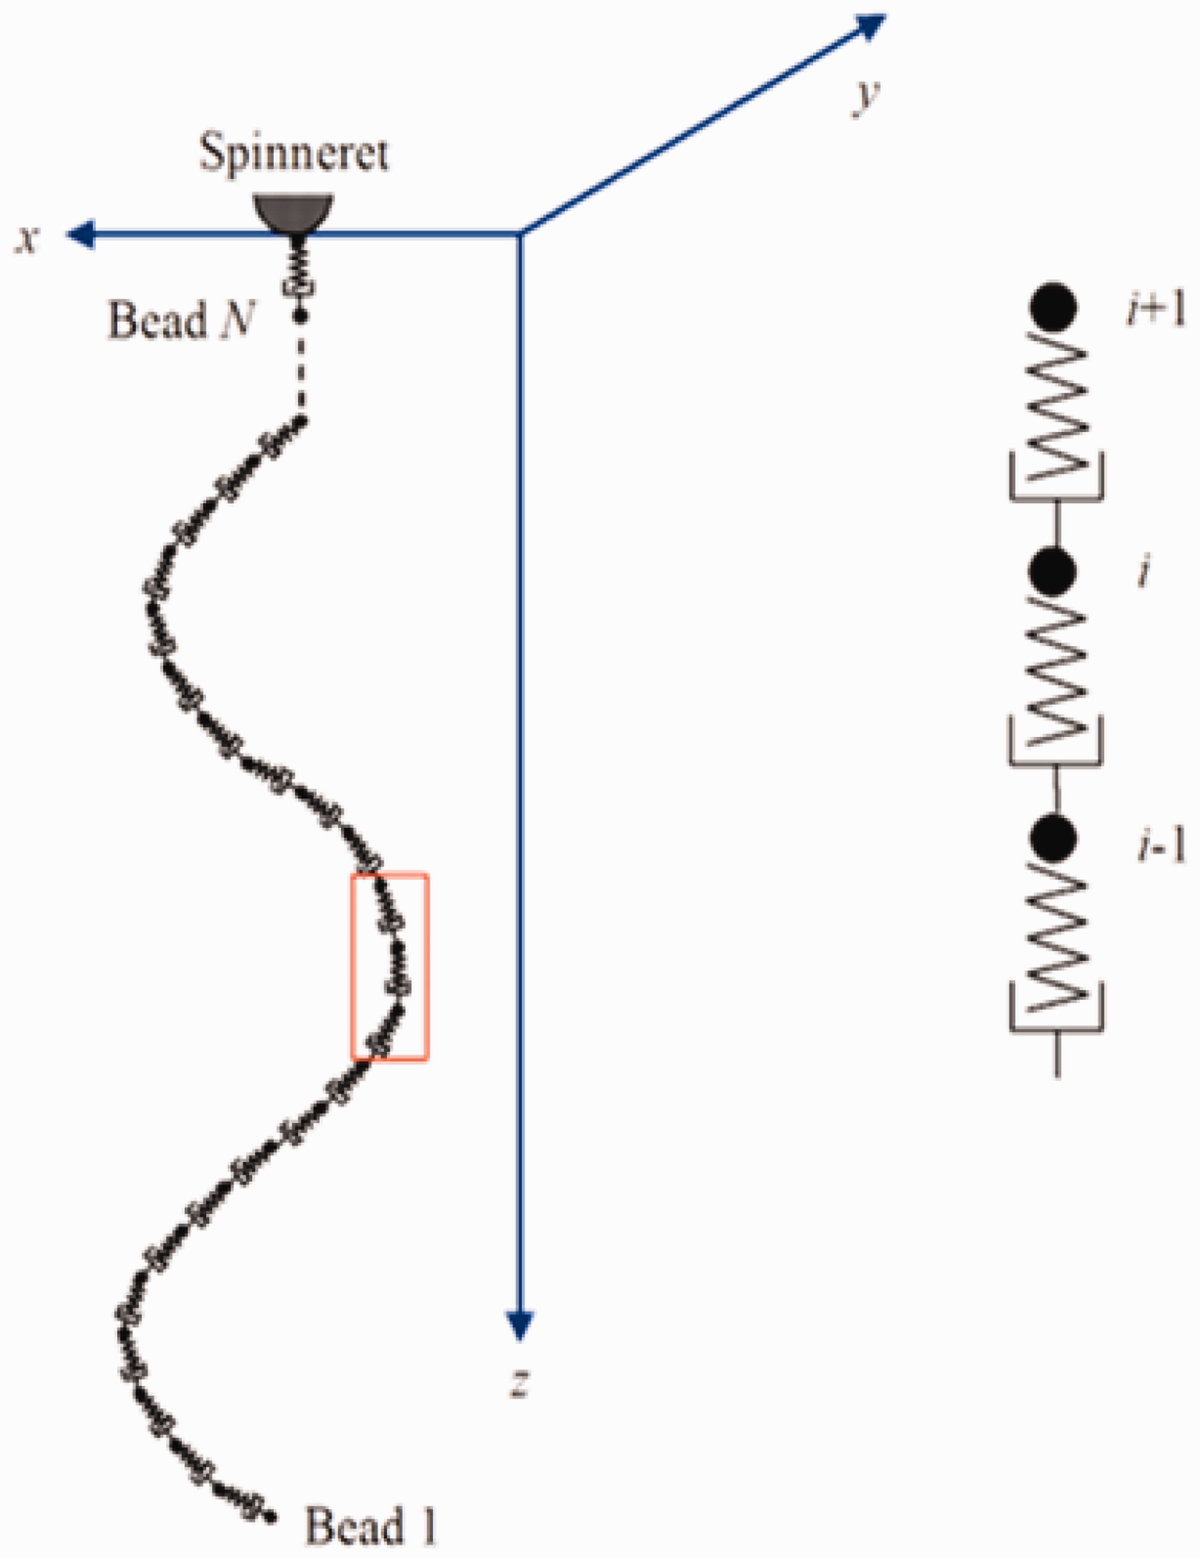
Schematic diagram of fiber model.
Once the fiber is laid down on the collector, the latter exerts friction (

The mass conservation and energy conservation equations are as follows [7]


In equations (1) to (4), the subscript (i-1,i) represents the fiber element (i-1,i), which is composed of beads i and i-1. ρ
f
, d, and l are the density, diameter, and length of the fiber element, respectively. m0 is the initial fiber mass, which is determined by the polymer flow rate. h is the convective heat transfer coefficient. Cp is the thermal capacity of the fiber. T represents the temperature. The subscripts a and f denote the air and fiber.
Herein, the air velocity and temperature were simulated in advance. In some published works [19–22], the Fluent module in the ANSYS software was employed to simulate the air velocity and temperature. However, most MB air flow simulations usually involve high-speed air jets. In our previous work [17], we built 3D models of the collector and suction in ANSYS, and successfully predicted the air speed and temperature distribution on the collector. These results are necessary for the fiber assembly morphology simulation. Once a fiber has arrived at the collector, its physical parameters, including its diameter and temperature, were frozen. The fiber was then moved on the moving collector. The pore structure of the fiber assembly was calculated by exporting the position of the fiber on the collector from the program and using the calculation method discussed in ‘Calculation of pore structural parameters’ section. The model was solved using an iterative algorithm implemented in MATLAB. The solution procedure is described in the Supporting Information.
Calculation of pore structural parameters
The pore structural parameters investigated in this study are the pore size and pore circularity. In the example shown in Figure 2(a), five fiber elements are deposited on the collector. Their coordinates (xi, yi) are predicted using the numerical model shown in ‘Fiber dynamics in melt-blowing’ section. The fiber elements enclose six pores. The pore structural parameter calculation is performed after the computer has recognized all the pores. Herein, we describe the algorithm for recognizing pore 6 as an example. The other pores can be recognized using the same method.

Web schematic diagram.
A point is first selected randomly, as shown in Figure 2(b). We choose point A as an example. A neighboring point is then chosen at random to constitute a vector. To enclose pore 6, point B is selected as an example. The next point that should be selected is point C. The question of how to avoid selecting points D and E then arises. To achieve this, we stipulate that the clockwise angle between the vector
Every point considered in the algorithm is used to find the enclosed area formed by the virtual fibers. The perimeter can then be easily obtained by summing the lengths of the enclosed edges. The pores can be separated into several triangles (Figure 3). For instance, the area of pore 6 is calculated as


Segmentation of a pore.
Here, | | denotes the norm of the vector. The above algorithm is employed to traverse all of the points to calculate the area of all the pores. The pores are regarded as equivalent circles, and the pore size D can then be calculated using

Another pore structural parameter is the circularity, which is defined as

Experiment
To verify the model, 25 samples were fabricated and simulated under the different conditions listed in Table 1. The polypropylene (MFI = 150 g/min) and melt-blowing machine with a single orifice (F-6D) were supplied by Huada Co., Ltd., China and shown in Figure 4(a). The details of the die are shown in Figure 4(b) and (c). The pore size of the fabricated fiber assembly was measured using a capillary flow porometer (CFP-1100A, Porous Materials, Inc., USA) following the ASTM D6767 standard. All samples were conditioned for 24 h before the measurement. To reduce the experimental errors, three pieces were cut from each sample and measured separately.
Sample information.


Melt-blowing machine and die: (a) melt-blowing machine; (b) lateral view of die; (c) top view of die.
Results and discussion
Figure 5 shows an example of a simulated fiber assembly formed using a single orifice. The fibers were ejected from the orifice (origin point) and fell on the moving collector. The red line represents the fibers in the air jet. The blue lines represent the fiber assembly on the collector. The pore size and circularity of all the simulated fiber assembly samples were calculated using equations (6) and (7), respectively. The results are listed in Table 2 and plotted in the figures to show the influence of the fabrication conditions.
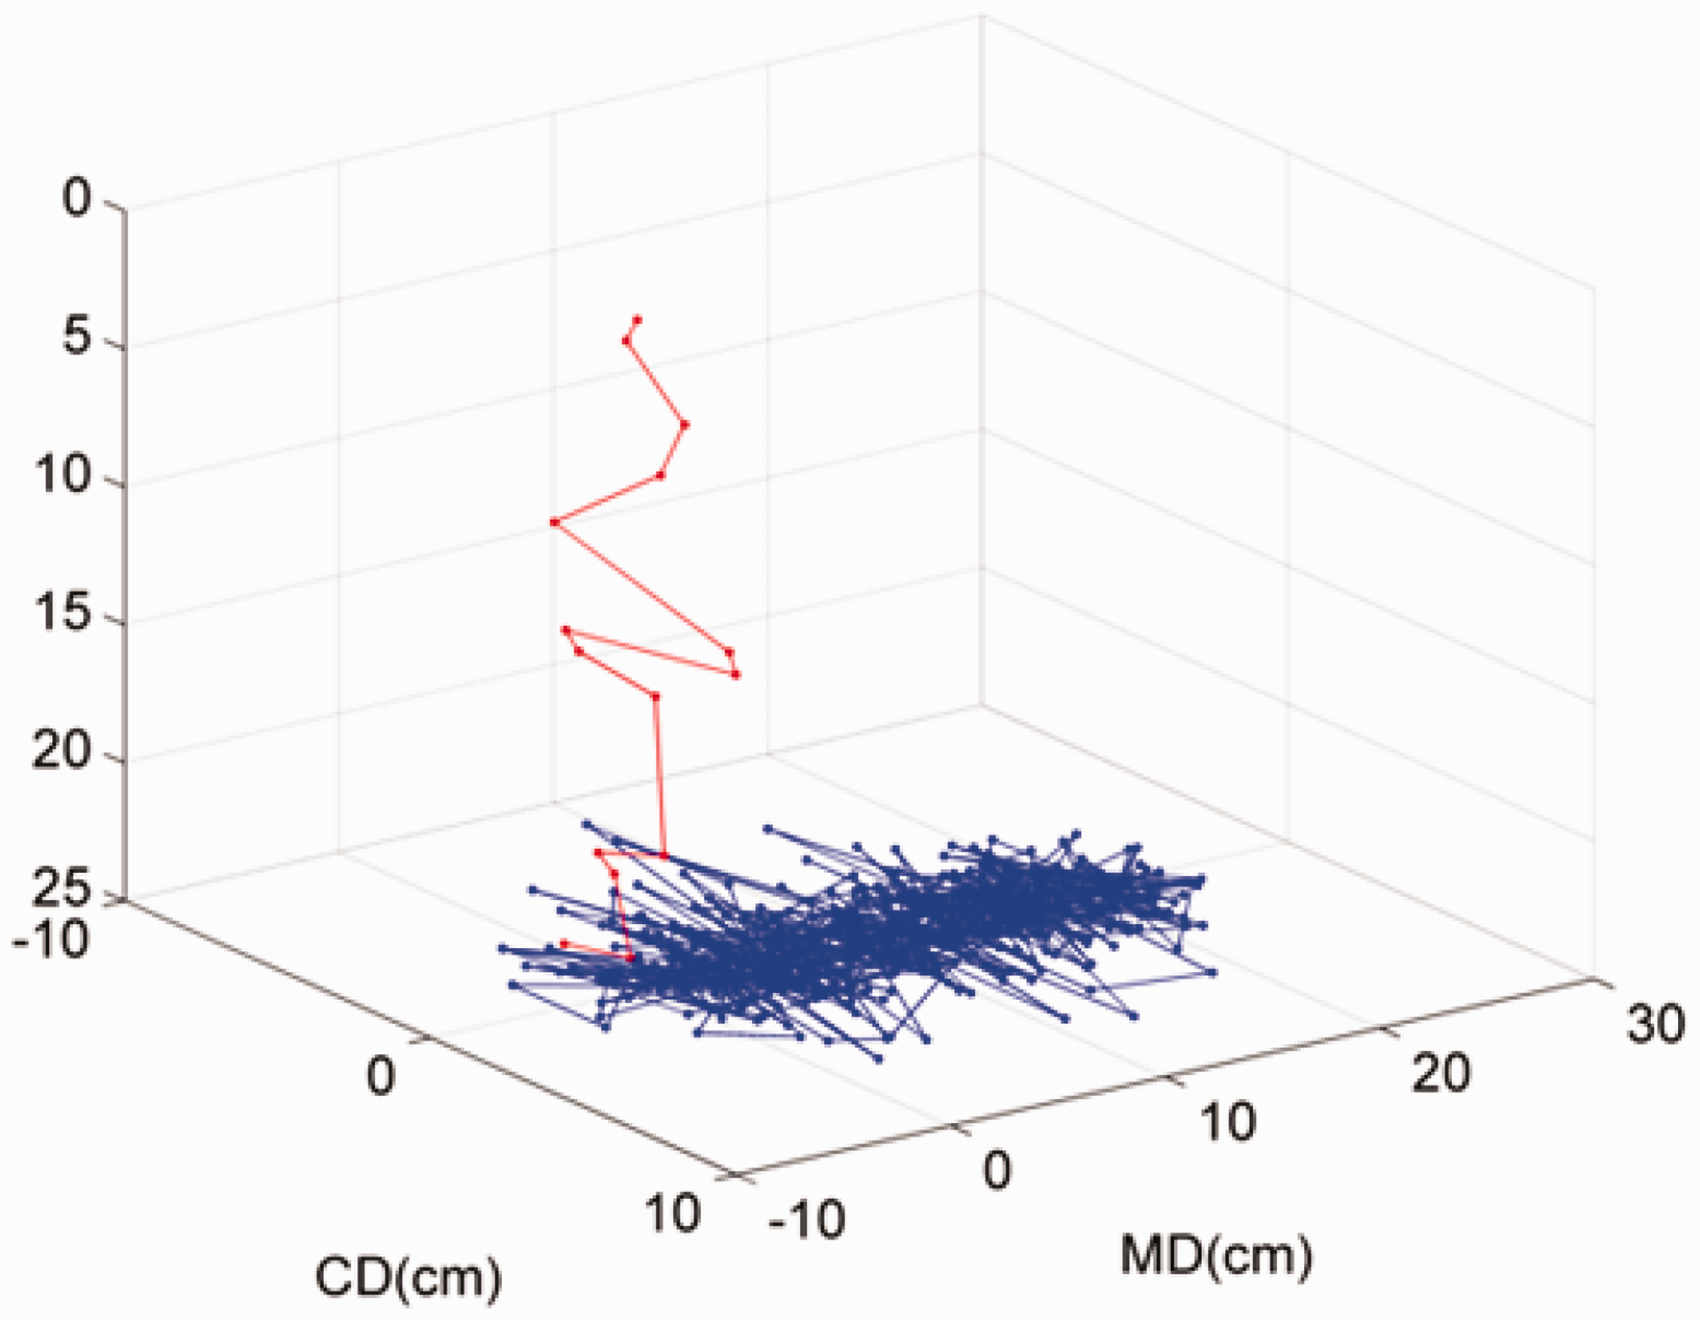
Predicted fiber assembly.
Simulated and measured pore structural parameters.

Effect of fabrication conditions on the pore size
The influence of the fabrication conditions on the pore size is shown in Figure 6. Error bars have been added to each sub-figure. The error bars indicate that there are significant fluctuations in the data owing to the non-uniformity of the samples, which is in turn due to fiber entanglement, uneven thickness, and uncontrollable factors. We analyze each sub-figure individually.
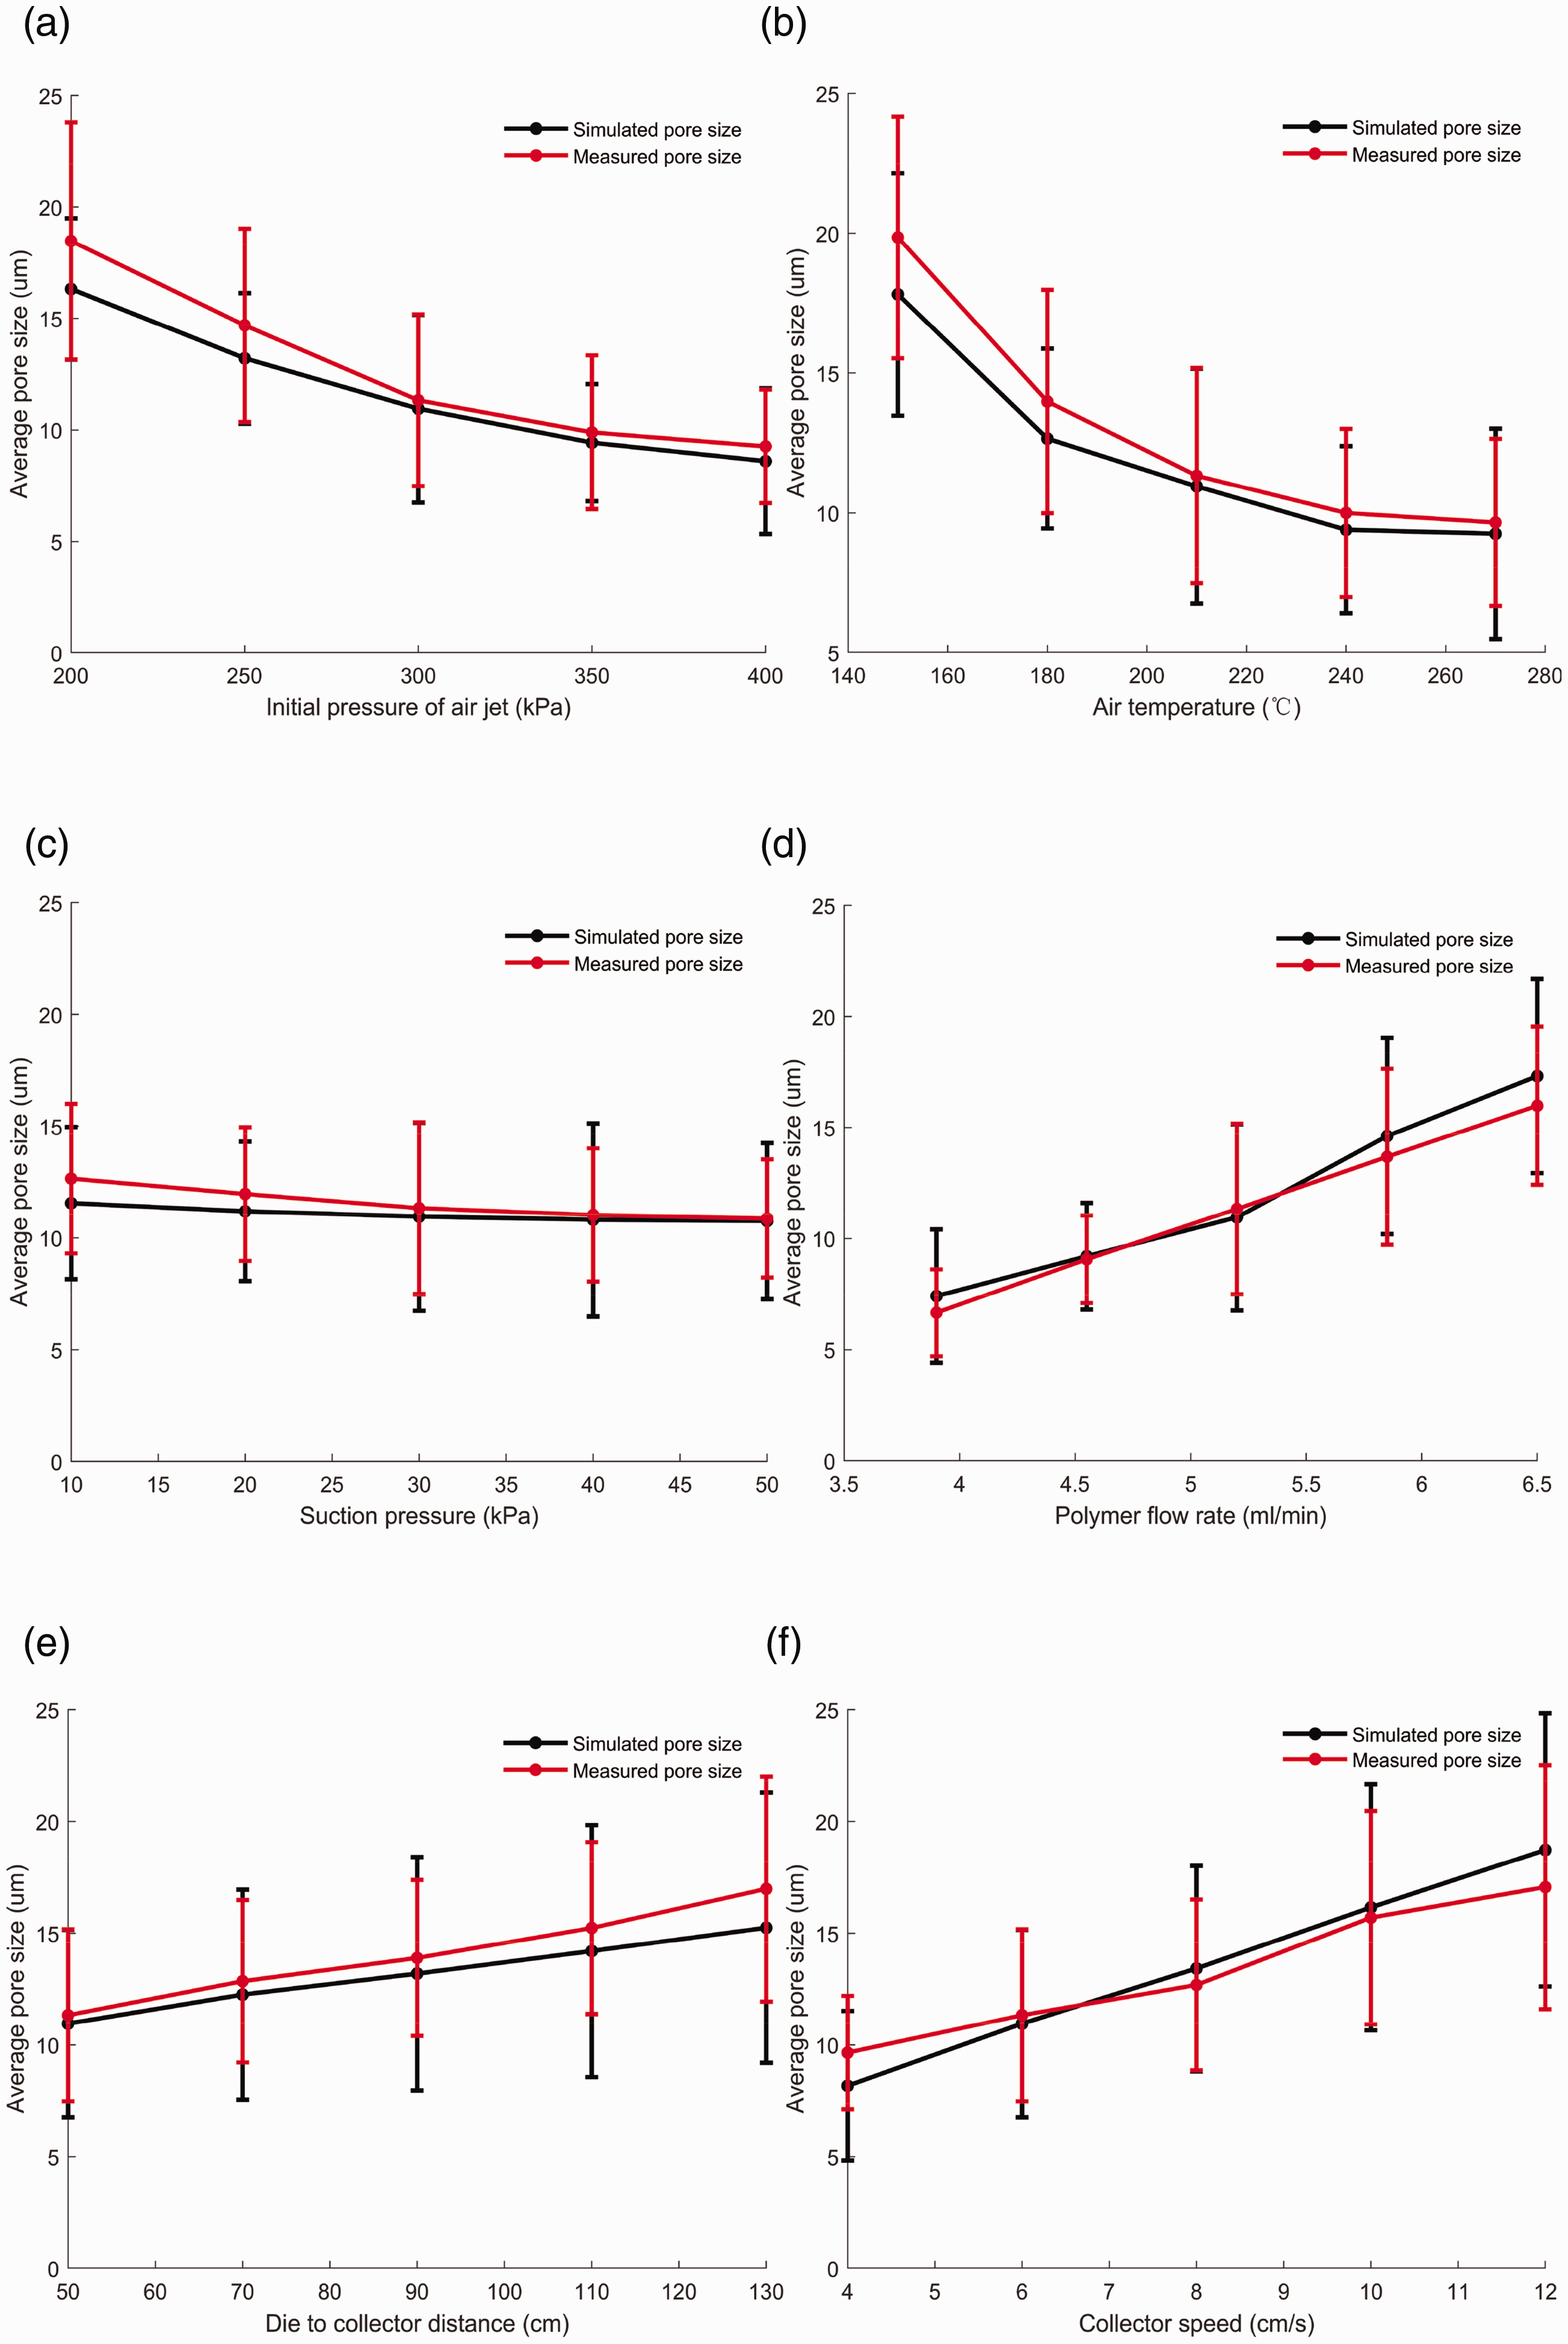
Influence of fabrication conditions on the pore size: (a) initial pressure of air jet; (b) air temperature; (c) initial suction pressure (d) volume flow rate of molten polymer; (e) die to collector distance; (f) collector speed.
Figure 6(a) displays the influence of the air jet speed on the pore size of the fiber assembly. The measured and predicted pore sizes decrease with increasing air jet speed. Many studies have reported that finer fibers are usually fabricated using high-speed air jets. Lee and Wadsworth [23] and Han and Wang [24] separately found a positive correlation between the pore size and fiber diameter. Their data confirms that decreasing the fiber diameter slightly decreases the average pore size. We arrived at a similar conclusion in our simulation. According to equations (A5) and (A6) in the supporting information, a higher speed of the air jet produces a larger air drag
The effect of air temperature on the pore size is shown in Figure 6(b). The pore size decreases when the air temperature is increased. Lee [1] also found that a higher air temperature contributes to the production of finer fibers and accompanying smaller pores. In equation (6), the enhancement of Ta results in the slow attenuation of Tf, which reduces the fiber density and viscosity, thereby evenly thinning the fiber. As mentioned above, longer and finer fibers tend to form more and smaller pores. Additionally, extremely high air temperatures can no longer reduce the fiber density and viscosity effectively. Hence, the pore size under extremely high air temperatures remains nearly constant.
A suction fan was installed under the collector. The suction assisted in fixing the fiber on the collector. A higher suction speed can effectively reduce the covered area of the fiber assembly by making it difficult for the fibers to move on the collector. Thus, the thickness of the fiber assembly increases and a smaller pore size is thereby formed. As shown in Figure 6(c), both the simulated and measured pore sizes gradually decrease with increasing suction pressure. Our simulation results are consistent with the measurements. According to Eq. (A24) and (A25) in the supporting information, a higher suction speed generates a larger friction
Many studies have reported that a high molten polymer volume flow rate increases the fiber diameter. In addition, thick fibers usually form large pores. The influence of the polymer flow rate is shown in Figure 6(d). In equation (3), an increase in m0 directly results in an increase in the fiber diameter di-1 ,i and length li-1 ,i . As mentioned above, the latter two tend to result in the generation of many large pores.
As shown in Figure 6(e), the pore size increases when the collector moves further away from the orifice. A larger distance between the collector and the orifice causes the fiber assembly to cover a larger area and reduces its thickness on the collector. Thinner fiber assemblies usually exhibit a larger pore size. Additionally, Xu and Wang [7] found that increasing the DCD decreased the contact probability between fibers. Therefore, increasing the DCD resulted in the attenuation of the fiber quantity per unit space and the accompanying contact probability between the fibers. Our simulation results are similar to the experimental observations. The fiber positions are widely distributed on the collector when the collector is far from the die. Hence, the enclosed area S and the accompanying pore size D in equations (5) and (6) increase.
As shown in Figure 6(f), the pore size is also increased when the collector is accelerated. The fiber assembly is spread in the direction of the machine on the collector. Thus, a fast-moving collector can generate a thin fiber assembly with a larger area. In our simulation, the formed pores are drawn by the collector; thus, the enclosed area S is increased.
Circularity simulation results
Additionally, we present another index, the circularity defined in equation (7), to describe the pore structure. The circularity ranges from 0 to 1. A circularity close to 1 indicates that the pore is circular, whereas a value around 0 represents a non-circular pore. We usually assume that a particle can easily pass through a pore with a relatively large diameter. However, this assumption neglects the influence of circularity. During filtration, a particle may still be blocked by a pore with a relatively large diameter when the pore circularity is small. For instance, the triangular and circular pores in Figure 7 have the same area and equivalent pore diameter, but different filtration performance. We predicted the average circularity, and list the results in Table 2. Most of the circularity values are approximately 0.5, which means that the samples have many triangle-like pores (the circularity of the regular triangle is 0.6). However, there was no equipment available to measure the pore circularity in the fiber assembly. Scanning electron microscopy (SEM) can be used to observe the pore circularity, but cannot easily quantify the circularity of the entire sample because of the small scanning area. The measurement of the circularity was a difficulty faced in the current study. To verify our predictions, we will try to measure the circularity by employing image analysis on multiple SEM images obtained at different positions on the sample surface in the future.
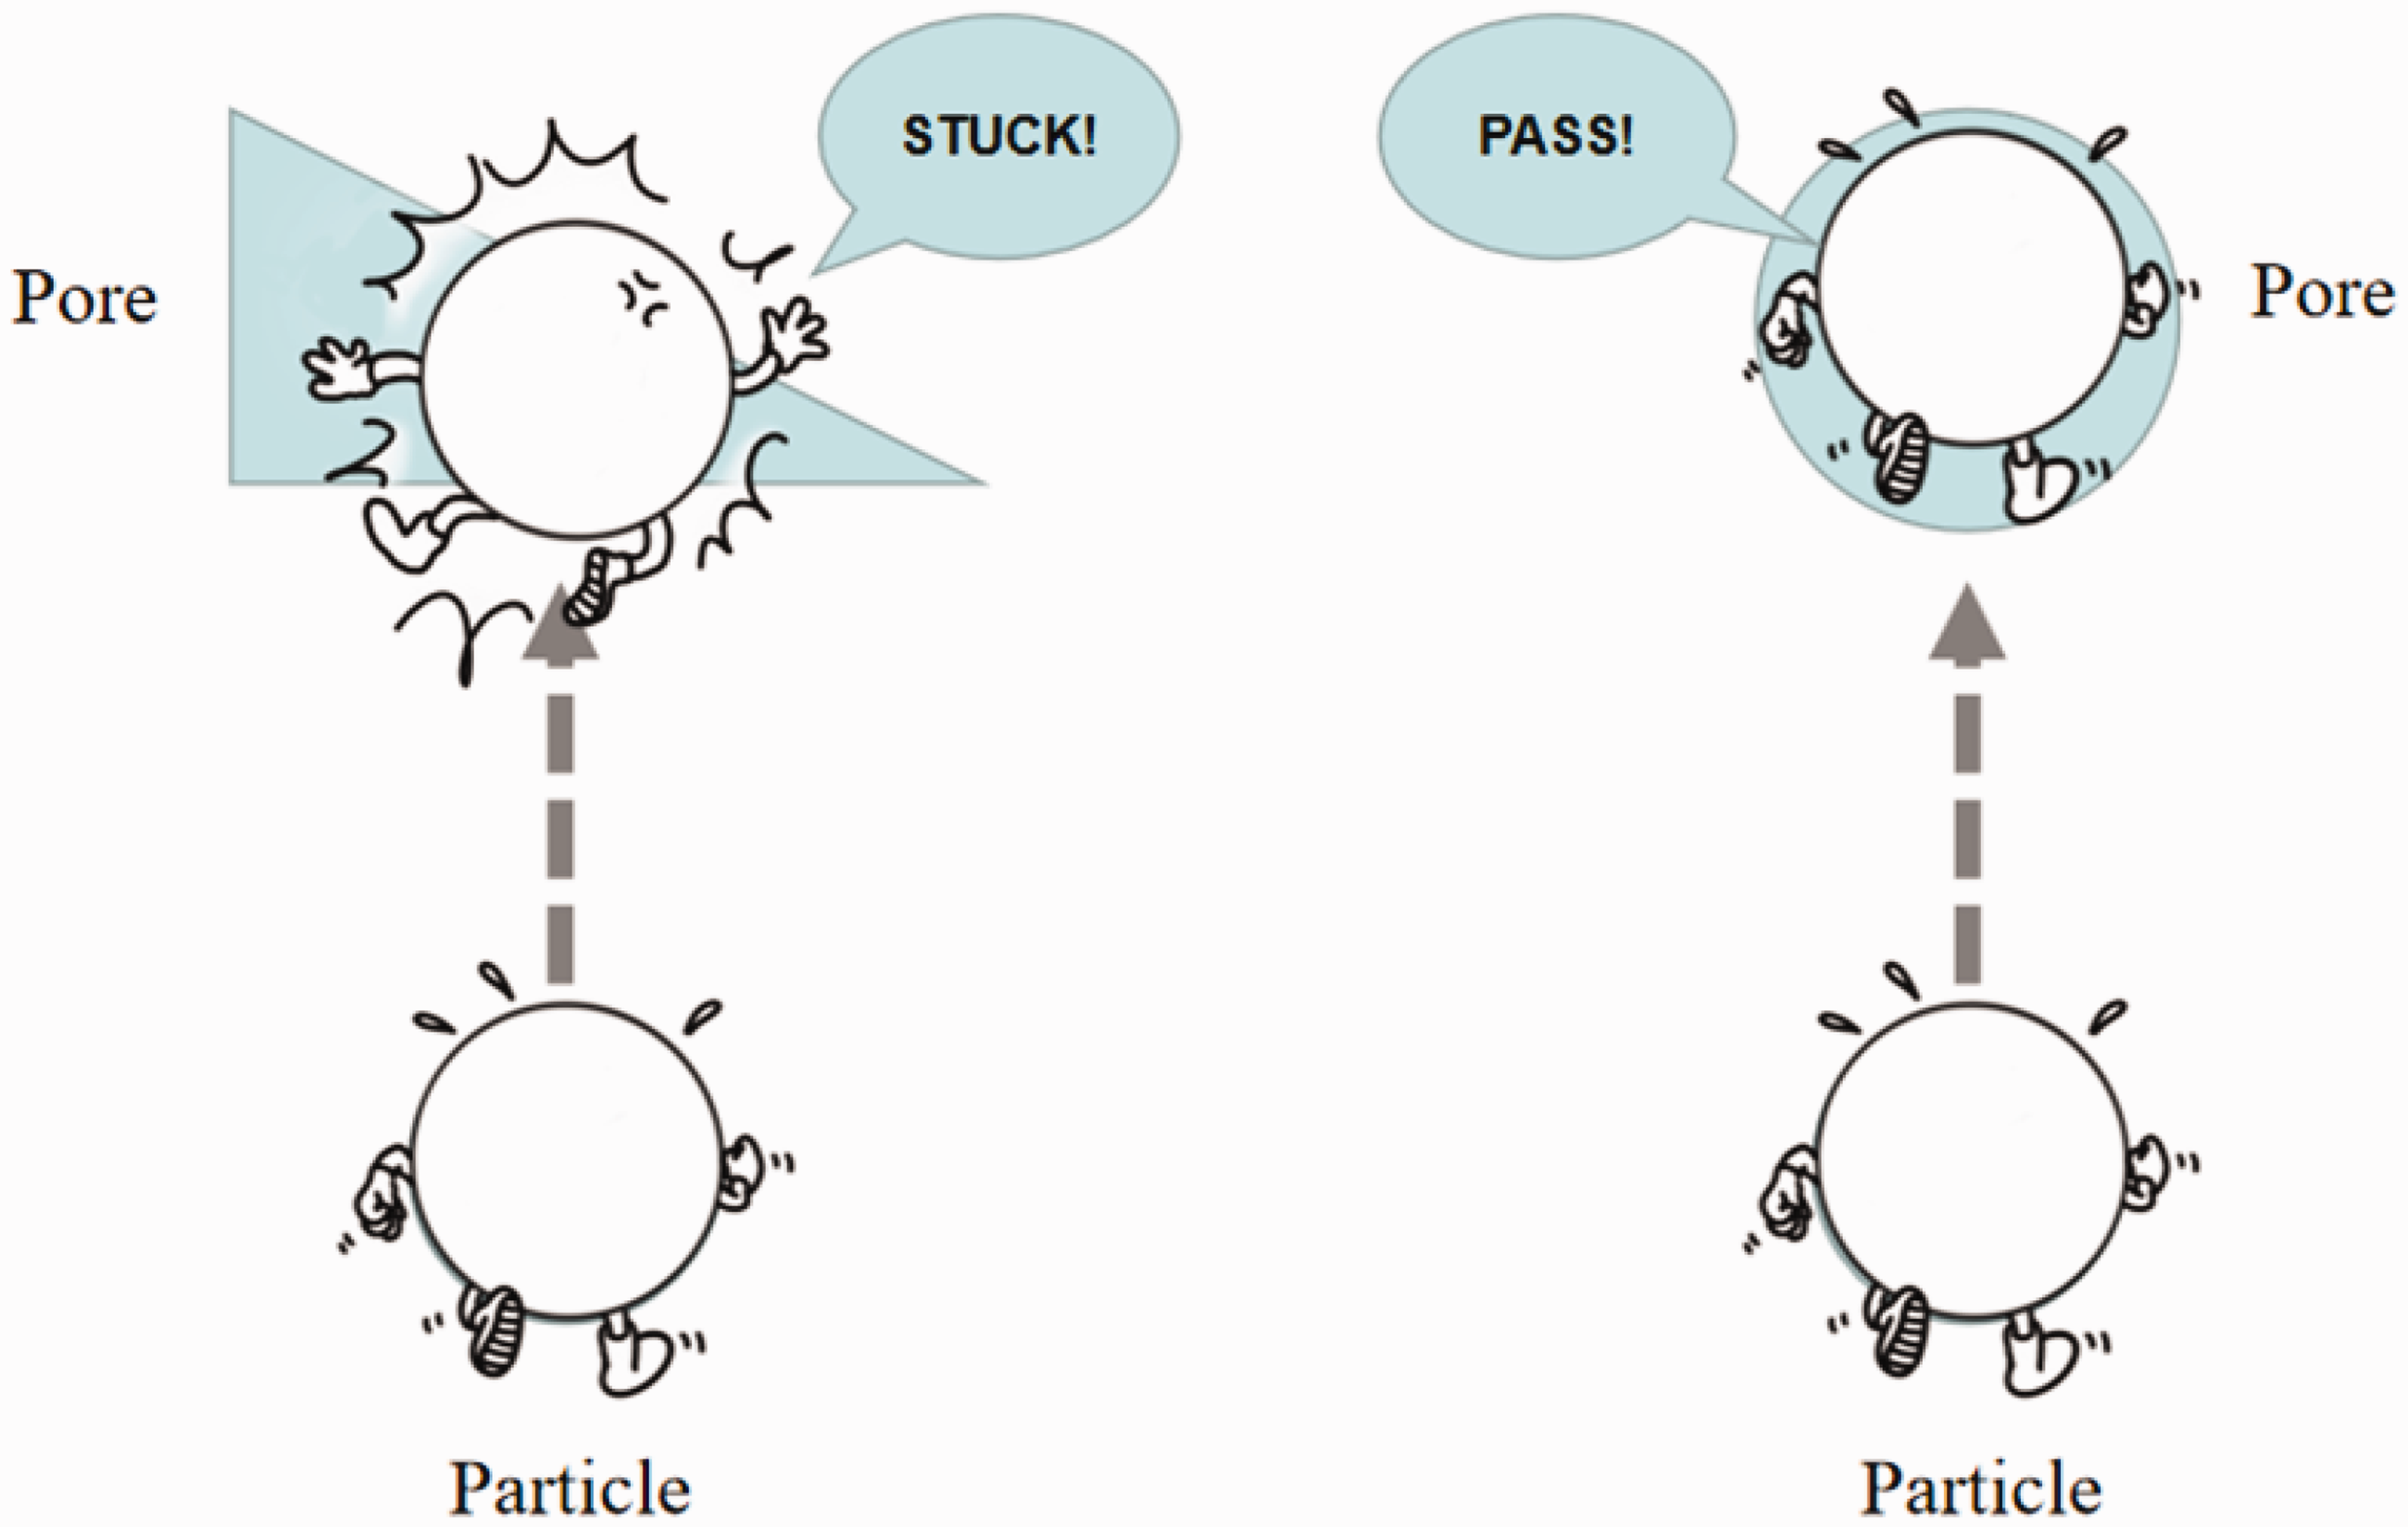
Influence of circularity on filtration performance.
Conclusion
The pore size of the meltblown fiber assembly extensively affects the final application of the products. A numerical model for predicting the pore size was presented in this work. We also conducted experiments to verify the simulation results. The model exhibited relatively good agreement with the experimental results. We found that a higher air jet pressure, air temperature, and suction pressure, and a decreased volume flow rate, DCD, and collector speed can generate smaller pore sizes in the fiber assembly. Additionally, our model predicted the circularity of the pores, which was difficult to measure using the current experimental instruments. To verify our predictions, we will analyze the circularity using image analysis.
Footnotes
Declaration of conflicting interests
The author(s) declared no potential conflicts of interest with respect to the research, authorship and/or publication of this article.
Funding
The author(s) disclosed receipt of the following financial support for the research, authorship, and/or publication of this article: National Natural Science Foundation of China, Grants No. 51703124 Program for Professor of Special Appointment (Eastern Scholar) at Shanghai Institutions of Higher Learning.
Supplemental material
Supplemental material for this article is available online.