
Abstract
A successful optimization of the electrospinning parameters for obtainment of biodegradable polyester urethane (DP) webs of fibers, neat and graphene oxide (GO) modified, was performed. The effect of the processing parameters (distance between the needle tip and the collector, applied voltage, and flowing rate), solution type and polymer concentration, on the fiber-forming process and the obtained fibers’ morphology was examined. The best homogeneity of the fibers was achieved for 12 wt% DP dissolved in 80:20 wt% mixture of chloroform and ethanol, applying similar processing parameters for the neat and modified samples (0.5 ml/h pumping rate, 15 kV applied voltage, and 150 mm distance to the collector, for the neat sample, and 0.4 ml/h, 18 kV, and 110 mm, for the GO modified samples). The main novelty of this work is the modification of DP with low quantities (0.5, 1.0 and 2.0 wt%) of GO – the “next generation” nanomaterial for stem cell control. The morphological characterization revealed a fibrous microstructure consisting of randomly oriented fibers with a diameters ranging from hundreds nanometers to couple micrometers, representing a feasible imitation of the structure of extracellular matrix (ECM). The XRD studies showed high dispersion of GO in DP matrix and even exfoliation for the sample that contains 2 wt% GO. Raman studies neatly complemented the highest filler/matrix interactions and the superior levels of dispersion for this sample. TGA was used to analyze the thermo-oxidative degradation and also to determine the actual content of GO present in the samples.
Introduction
Electrospinning is a versatile electrohydrodynamic process, exploited for the production of ultrathin fibers with diameters in the order of a few nanometers to several micrometers [1,2]. A typical electrospinning setup is very simple and consists of three fundamental components: a capillary spinneret through which the polymer liquid to be electrospun is forced; a high-voltage power source with positive or negative polarity, which injects charge into the liquid; and a grounded static or rotating collector [3]. When the electrostatic force is higher than the surface tension of the polymer solution a charged jet is ejected from the nozzle towards the grounded collector, undergoing a process of stretching and whipping. Thus formed charged thin polymer fibers are deposited on the collector as a nonwoven web [1,2,4,5].
What makes electrospinning particularly attractive for use is the ease of its implementation not only on a lab scale, but also due to the simplicity of the process it could be easily transferred to a large-scale production. Furthermore, in contrast to other forms of nanofibers (e.g. carbon nanotubes), electrospun fibers are essentially continuous, and the resulting nonwoven webs have very high specific surface area and high porosity. These qualities make electrospun materials attractive candidates for tissue engineering scaffolds [6–10], drug delivery systems [11,12], catalyst and enzyme supports [13], sensors [14], and other applications in biology, medicine and controlled release [15]. When used as a scaffold for tissue repair/regeneration it is important to mimic the native extracellular matrix (ECM – an extensive three-dimensional molecule network that provides structural and biochemical support to surrounding cells) as close as possible in terms of composition, porosity, and other properties [2].
Both synthetic (such as polyglycolides [16], polylactides [17], and polycaprolactone [16]) and natural (such as collagens [18], gelatine [17], alginates [19], chitosans [18,20], and silk fibroin [17]) polymers were electrospun to be used for biomedical application. However, obtaining scaffolds with mechanical properties compliant with those of biological tissues and with suitable degradation kinetics still remain as a challenge. Among synthetic polymers, polyurethanes offer many advantages in designing materials with tailor-mad properties [2,21–23]. Their segmented block copolymeric character endows them with a wide range of versatility in terms of their physical properties and biocompatibility. Initially, used for long-term implants, now a new class of bioresorbable polyurethane materials is being developed. A number of long-term studies, in several different animal models, have demonstrated the safety of their use as scaffolds in tissue engineering [24–28]. DegraPol® (DP), as promising biocompatible and biodegradable polyurethane, belongs to this new class of materials. It consists of polyhydroxybutyrate-diol as hard segment and polycaprolactole-dyglicol-diol as soft segment, both biodegradable polymers which degradation products are nontoxic. What is very convenient is that by slightly varying the DP composition, its mechanical properties and rate of degradation can be controlled independently from each other.
Despite the extensive work on scaffolds fabrication, the further improvement of their properties is still a challenge. Even now the polymer scaffolds lack of combined sufficient elasticity and sufficient strength [29–31]. A wide number of nanofillers (bioactive nanoparticles, ZnO, TiO2, nano-hydroxyapatite, silica, bioactive glass, nanotubes, nanoclays and whiskers) [2,29,32] have been used to modify the scaffolds properties, among which nanocarbons are considered the most promising. Due to the possibility to achieve an extremely wide range of tailored properties upon varying their structure, nanocarbons are extensively studied in applications going from photonics and optoelectronics to biotechnology and nanomedicine. Intensive research shows that their exceptional properties can be exploited for biomedical applications, especially in drug delivery and tissue engineering. In this context, nanocarbons offer intriguing physicochemical and biological features for biomedical applications due to their nanometric size, large specific area and ability to interface/interact with the cells/tissues [8,33–36]. Of all the nanocarbons used, graphene oxide (GO), has attracted great interests having the potential to be the “next generation” nanomaterial for stem cell control in tissue engineering and regenerative medicine [37]. In vivo studies showed its biocompatibility with neurons that paved the road to significant biomedical applications [38,39].
Surface properties of the scaffold including chemical composition, topography or rigidity are of vital importance for the cell-scaffold surface interactions and have great effect on cell functions (adhesion, migration, differentiation) [40]. Interestingly, it was demonstrated that moderately rough fibers with surface nanotopography could selectively boost cell proliferation [41] indicating that smooth appearing electrospun polymer fibers are not always favourable choice. Therefore, it is very important to carefully design the scaffold structure and morphology. Factors that affect the properties of the final web of fibers, such as fiber morphology, average fiber diameter, porosity and bead formation are directly linked to polymer properties (polymer molecular weight, solvent type, concentration of the solution, its surface tension, conductivity and viscosity) and process parameters (applied voltage, distance between tip and collector, infusion rate, tip diameter) [35,42–44]. For instance, higher infusion rate results in larger fiber diameter, higher conductivity of the solution – lower diameter, and higher polymer concentration/viscosity – larger diameter. In addition, ambient parameters like temperature and humidity also affect both diameter and shape of the electrospun nanofibers, for instance, higher temperature results in fibers with lower diameter and higher humidity leads to formation of porous fibers [45].
In this study we present the optimization of the electrospinning process of pure and GO-modified DP, a biocompatible, bioresorbable and biodegradable polyurethane material, which preceded a successful in vivo implementation of one of the obtained scaffolds, used to heal an artificial lesion of subcutaneous tissue (the innermost layer of skin) in a rat model, an injury that cannot heal only by reepithelialisation alone [8]. Fibrous materials have a unique structure of complex geometry, characterized by system anisotropy and heterogeneity which strongly affects the fluid transport behavior through their fibrous structure [46]. Ultimately, the transfer of fluids depends on the combination of scaffold porosity, pore size and distribution, pore interconnectivity, pore orientation, and scaffold tortuosity [47]. These aspects laid extreme importance to tissue engineering application owing to the fact that enhanced micro/nano-scale transport phenomena in fibrous structures helps to promote the diffusion of nutrients to cellular constituents, while promoting the diffusion of metabolic waste farther from the cells. Given into consideration our preceding in vivo evaluation work of the scaffolds in a rat animal model, here, fluid transport studies were not considered. Namely, it was found that histological tissue analysis revealed absence of an inflammatory process and scaffold degradation as well as a penetration of tissue cells in the scaffold structure that confirmed optimal porous and fibrous structure [8]. There are multiple examples of using DP in different studies [48,49], but to the best of our knowledge its properties were modified for the first time by incorporation of GO in our studies [8]. GO has the potential to be the “next generation” nanomaterial for stem cell control and hence the interest to evaluate its impact on the morphology of the fibers in the electrospinning process which further dictates mechanical modifications and bioactivity [50,51]. Although some studies embrace numerical methods comprising response surface methodology (RSM) or artificial neural networks (ANNs) to optimize the complex and non-linear process of electrospinning [52–54], here we decided to examine and determine the effect of the processing parameters (distance between the needle tip and the collector, applied voltage and flowing rate), solution type and polymer concentration on the fiber-forming process and the obtained fibers morphology. In order to modify the properties of the web, an effort was made to incorporate low amount of GO into the polymer solution prior electrospinning and to achieve homogeneous dispersion of the nanofiller in the matrix. The level of dispersion of GO layers in DP matrix was determined by XRD analysis. TGA was used to evaluate the thermal properties with addition of GO, to stretch out information about the matrix–nanofiller interaction and, finally, to determine the actual quantity of the GO present in the scaffolds. To evaluate the possible interactions between the polymer matrix and the nanofiller, Raman spectroscopy was utilized.
Experimental
Materials
The polymer used in this study was DegraPol® (DP), a biodegradable polyester urethane block copolymer, kindly supplied by ab medica s.p.a., Italy, composed of polyhydroxybutyrate-co-caprolactone as crystalline segment and polycaprolactone-co-glycol as amorphous segment. The synthesis of this already established polymer is reported in Refs. [44,55]. Graphene oxide (GO) in form of powder, consisted of 15–20 layer sheets with 4–10% edge-oxidation and with a nominal particle size diameter of 400 nm with 90% of the particle sizes below 800 nm in diameter, was supplied from Garmor Inc., USA. Chloroform (CHROMASOLV™, for HPLC, ≥99.8%, amylene stabilized) and dimethylformamide (N,N-Dimethylformamide suitable for HPLC, ≥99.9%) were purchased from Sigma-Aldrich. Ethanol and acetone used were of technical grade.
Scaffold production by electrospinning
Typical horizontal set up of the electrospinning apparatus was used, which consisted of a high-voltage power supply (Gamma High Voltage with 0–40 kV power range), a syringe pump (New Era Pump Systems), a syringe with a needle (diameter 0.6 mm) and a rotating drum used as a collector. The high voltage was applied to the needle and the drum was grounded. The scaffolds were collected as a fiber web on aluminum foil substrate which was attached onto the drum surface. The speed of drum rotation was kept constant at 250 rpm for all samples. Figure 1 is a schematic presentation of the experimental set-up.

Schematic presentation of the experimental set-up for electrospinning.
Electrospinning was conducted at room temperature under standard atmospheric conditions. In the process of optimization, different solvents and solvents mixtures were used. Chloroform and dimethylformamide were used as single solvents. Mixtures of chloroform and acetone and chloroform and ethanol in ratios 80:20(wt%/wt%) and 90:10(wt%/wt%) were also used. For the six different solvents and solvents mixtures, polymer solutions with concentration of 9 wt% were prepared. The obtained solutions were homogenized by magnetic stirring overnight prior electrospinning. Afterwards, the prepared polymer solutions were electrospun at applied voltages of 15 and 20 kV, with a flowing rate of 0.5 and 0.8 ml/h and collected at three different distances of 100, 150, and 200 mm between the needle tip and the rotating drum. Small pieces of each sample were quickly checked on SEM without sputter-coating with gold. In Table 1, the electrospinning parameters that were changed during the process of optimization are summarized.
Variable parameters in the process of optimization of electrospinning of polymer solutions (with concentration of 9 wt%) dissolved in different solvents and solvents mixtures.

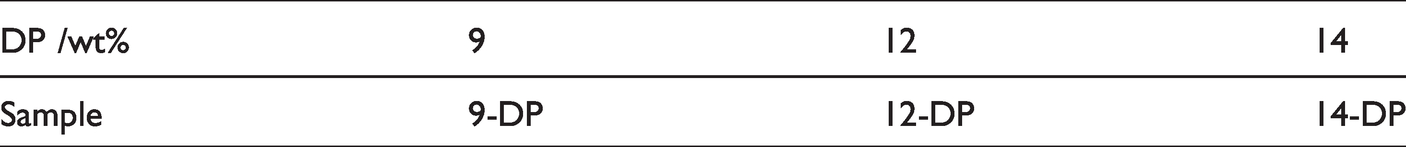
In order to determine the optimal polymer solution concentration, different amounts of DP, ranging from 8 to 16 wt%, were dissolved in the mixture of 80 wt% chloroform and 20 wt% ethanol. The obtained solutions were homogenized by magnetic stirring overnight prior electrospinning. The processing parameters were 0.5 ml/h pumping rate, 15 kV applied voltage and 150 mm distance to the collector. The fiber formation was achieved for polymer concentration between 9 and 14 wt%. Three samples fabricated with concentration of 9, 12 and 14 wt% (Table 2) were sputter-coated with gold and then examined by SEM.
Electrospun samples obtained from solutions prepared by different DP concentrations.
For the preparation of GO-modified scaffolds, dispersions of 0.05 g, 0.1 g and 0.2 g of GO in 8 g chloroform were fabricated. The dispersions were assisted by ultrasonication, using Sonoplus HD 2070 sonicator with maximum power output of 70 W, with adjust ultrasonication intensity to 30% for a period of 30 minutes. Then 2 g ethanol and 1.2 g of DP were added into the dispersions of GO in chloroform and magnetic stirring was applied overnight. Prior electrospinning, all solutions were ultrasonicated for 15 minutes with ultrasonication intensity adjusted to 10%. Immediately after sonication, electrospinning was conducted at room temperature under standard atmospheric conditions applying voltage of 18 kV, a distance to the collector of 110 mm and a flow rate of 0.4 ml/h.
The designation of the samples prepared with different amount of GO in the optimized 12 wt% DP solution, is given in Table 3.
Electrospun samples prepared by adding different amount of GO in the 12 wt% DP optimized solution.

Characterization
Scanning electron microscopy
Small pieces of the electrospun samples were mounted on metal stubs with conductive carbon double-sided adhesive tape. Samples were sputter-coated (Q150R S, Quorum Technologies) with gold and then examined by scanning electron microscopy (SEM) (VEGA3 LMU, Tescan, Brno, Czech Republic). Six measurements of the fiber diameters were performed manually for each sample and, average values and standard deviations were calculated. Fiber diameters are given as averages ± standard deviations.
Scaffold porosity
Scaffold porosity, P, was determined by hydrostatic weighing typically employed for density determination. The fiber web porosity is described as volumetric ratio [56]:

Introducing measurable quantities mwet, mdry and msubmerged provides:
Thermogravimetric analysis
Thermogravimetric analysis (TGA) was performed on a Perkin-Elmer Pyris Diamond thermogravimetric analyser (TG/DTA). The weight of the samples ranged from 7.4 mg to 8.2 mg. The samples were heated from 40 °C to 550 °C at a constant rate of 10 °C/min in an air atmosphere using ceramic pans.
X-ray diffraction
X-ray diffraction patterns were recorded on a Rigaku Ultima IV diffractometer. The X-ray beam was Ni-filtered CuKα (λ = 0.154178 nm), and the radiation generated by setting the tube voltage at 40 kV and the tube current to 40 mA. The scan rate of 4°/min in a 2θ range from 4° to 50° was selected. The interlayer spacing was calculated via the Bragg’s equation:
The average height of stacking layers, denoted as H, was evaluated using the Scherrer’s equation:
Raman spectroscopy
The micro-Raman spectra of GO-grafted DP electrospun samples were collected on a Horiba JobinYvon LabRam Infinity spectrometer using the 532 nm excitation obtained from the frequency doubled Nd:YAG laser. The laser power of 0.11 mW was applied and the 50× objective for magnification was selected. Raman peak shape of the D- and G-bands was fitted using mixed Gaussian+Lorentzian function to obtain the ID/IG ratio in the GO-modified samples. No spectral smoothing to improve the signal-to-noise was applied.
Results and discussion
The first step for fabrication of the fibrous DP scaffolds suitable for tissue engineering application comprises the optimization of the electrospinning process. DP is completely soluble in chloroform, but due to the solvent high volatility the need for continuous electrospinning process was hindered and, instead of obtaining the continuous fiber, a clog of polymer was formed in the front of the needle tip. Therefore, we have taken two different approaches to get a continuous electrospinning process. The first was to use another good solvent for polyurethanes, dimethylformamide (DMF), and the second was to introduce additional solvent to stabilize the solution evaporation during the electrospinning process.
From the control SEM micrographs taken for each sample during the optimization process, it was concluded that the electrospinning of the DP solution in DMF didn’t result in fiber formation. The best fibers in terms of homogeneity and continuity were formed for 80:20 mixture of chloroform and ethanol. It was also observed that at a distance of 100 mm, between the needle tip and the rotating drum, the solvent had no time to evaporate properly and the obtained webs of fibers were still wet at the end of the process. For increased distances of 150 and 200 mm the fibers had similar morphology and diameters. The higher flowing rate produced fibers with higher diameters. The experiments carried out at applied voltages of 15 and 20 kV, keeping all other parameters constant, resulted in webs with no significant differences in fibers morphology. Therefore, the following process parameters were chosen for optimal during DP electrospinning: pumping rate – 0.5 ml/h, applied voltage – 15 kV and distance to the collector – 150 mm.
Further, various concentrations of the polymer solution were tested, and a proper fiber formation was reached in the range of 9–14 wt% DP. Lowering the concentration of polymer below 9 wt% was insufficient to produce continuous fibers whereas the increase of the DP content above 14 wt% resulted in viscous fibers associated by undesired droplet patches.
The SEM micrographs of the scaffolds obtained from solutions with different polymer concentrations (9, 12, 14 wt% DP) are presented in Figure 2.

SEM micrographs of the scaffolds electrospun from ethanol-chloroform solutions. (a) 9-DP, (b) 12-DP, and (c) 14-DP.
As depicted in Figure 2(a), the web obtained from 9 wt% DP solution exhibits high inhomogeneity in fibers diameter, ranging from 500 nm to 1.9 μm with an average diameter 1.39 ± 0.49 μm and is also showing an unfavorable bead-on-string morphology. This kind of morphology usually considered as “poor” quality fiber-morphology is commonly reported when the polymer concentration in the solution or its molecular weight are too low [57]. The cause of beads formation has been attributed to the elasticity of the solution. Fluids with low relaxation time or low extensional viscosity tend to result in beads formation. The mechanism of beads formation is due to Rayleigh instability driven by surface tension which can be suppressed by viscoelastic behavior of the fluid jet [58]. When the viscoelastic force completely suppresses or resists the instability, smooth fibers are formed. Instability is caused by surface tension as it forces a liquid to assume a smaller surface area per unit mass (which is the form of a sphere) resulting in appearance of beads/droplets along the fibers length [57].
The viscoelasticity of the solution was increased by ramping up the polymer concentration. Thus, the formation of beads was eliminated in the 12 wt% DP sample where the size diameters were more homogeneous distributed from 863 nm to 1.4 μm (Figure 2(b)) with an average diameter of 1.09 ± 0.21 μm. It was evident that the web microstructure is porous and constitutes of randomly oriented fibers. The fibers form 3 D interconnected porous network, which is very important for tissue engineering applications and mimic the structure of the extracellular matrix (ECM) [59]. The further increase of the polymer concentration in the solution (14 wt% DP) leads to an increase in the web fiber diameter (Figure 2(c)) with an average value 3.76 ± 2.11 μm. The higher polymer concentration leads to a higher viscosity of the polymer solution and as soon as the viscoelastic force exceeds the Coulomb force (being responsible for the stretching of the jet), the jet cannot be stretched further resulting in formation of deep fibers that exhibit larger diameters (even up to 8 μm).
An ideal tissue-engineered scaffold should promote both good cellular attachment and infiltration, and a balanced combination of both is needed to eventually promote whole-tissue formation [29]. A balance between fiber diameter and pore size is essential to guarantee good cell infiltration, and a combination of micro- and nanofibers is known to represent a solution for optimized cell attachment and cell infiltration [24]. Electrospun polymer-based nanofibers are typically characterized by morphological features that include a uniform diameter, usually a circular cross-section, and a smooth surface [2]. However, smooth appearing fibers are not always favoured, because the nanoscale surface topographical features on cell functions can resemble the natural extracellular matrix (ECM) in which cells reside and interact [41]. It was demonstrated that surface nanoroughness promoted cell adhesion and longevity [60], selectively boosted cell proliferation [61] and to date, it has been generally accepted that the surface nanotopography plays a key role in mediating cell functions [62–64]. Therefore, we aimed not to perfectly obtain smooth surface of the fibers.
The addition of biocompatible additives/nanofillers is a promising method of tailoring the scaffold properties. The presence of certain nanofillers could affect the mechanical performance of the scaffolds, their hydrophobicity and biocompatibility, and stimulate cellular interactions between cells and scaffold [65–68]. Graphene and its derivatives have attracted great interests having the potential to be the “next generation” nanomaterials for stem cell control and tissue engineering applications [8,37,68,69]. A series of GO-modified electrospun scaffolds were fabricated by incorporating GO into the most homogeneous and size-favorable 12 wt% DP solution. A detailed description of the method of preparation is given in the experimental section. SEM micrographs of the specified DP based scaffolds containing 0.5 wt% GO, 1.0 wt% GO and 2.0 wt% GO are shown in Figure 3.

SEM micrographs of the GO-containing scaffolds: (a) DP-0.5-GO, (b) DP-1.0-GO, and (c) DP-2.0-GO with magnification x 1000; and d) DP-2.0-GO with magnification x 3000.
The nanocomposite fibers are randomly oriented and form 3 D interconnected porous structure similar to that of the neat DP fibers (Figure 2(b)). In comparison to the neat DP scaffold (Figure 2(b)), GO-modified scaffolds (Figure 3) depict higher number of fibers with diameters downsized to 524 nm for DP-0.5-GO (average 0.86 ± 0.39 μm), 442 nm for DP-1.0-GO (average 0.73 ± 0.42 μm) and 391 nm DP-2.0-GO (average 0.66 ± 0.36 μm). These fibers exhibit smooth surface that demonstrate adequate encapsulation of the GO nanosheets in the polymer matrix. The decrease in the fiber diameter is probably attributed to the improved electronic and ionic conductivity of the electrospinning solution, induced by the presence of GO [58,70]. Therefore, the nanofibers are well elongated, split off, and separated into thinner fibers when fabricated under similar processing conditions as those of unmodified DP. In a study of unmodified electrospun DP scaffolds, the obtained fibers’ diameters were much larger, ranging from 3.83 ± 2.12 μm to 6.31 ± 2.35 depending on the flow rate [48].
The porosity and pore size of the scaffolds have direct implications on their functionality during biomedical applications. Open porous and interconnected networks are essential for cell nutrition, proliferation, tissue vascularization and new tissue formation [71,72]. However, the mechanical properties important to maintain the structural stability of the biomaterial are often compromised by the increased porosity [73]. Hence, for an optimal scaffold system there should be a balance between the mechanical properties and porosity of the scaffolds. In our study the scaffold porosity, P, was determined by hydrostatic weighing using the equation (3). The mean values of the measured values for mdry (the mass of the dry scaffold), msubmerged (the mass of the scaffold submerged in ethanol), mwet the mass of the scaffold after removal from the ethanol while ethanol is retained in the pores) and the calculated value for the porosity, P, are presented in Table 4.
The mean values of the measured masses of the dry, wet and submerged scaffolds and the obtained values for the porosity P.
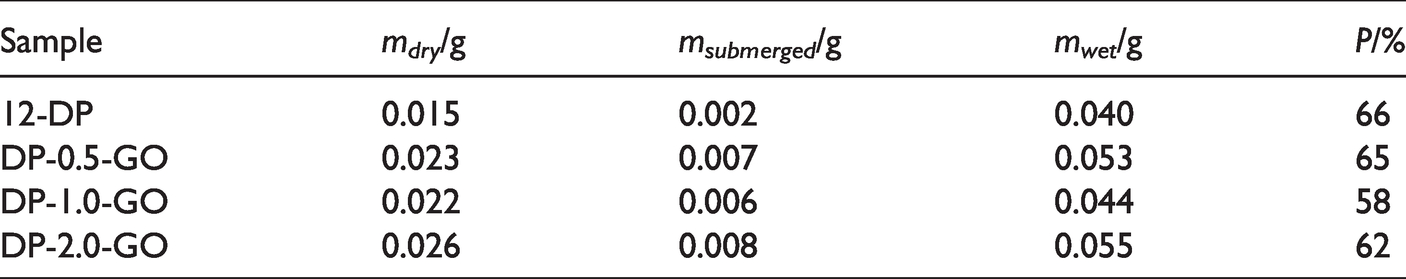
The values of the scaffolds’ porosity are between 58% and 66%. Compared to another study where the porosity of two types of DP scaffolds (with different ratio of ε-caprolactone to glycolide, and a hard-to-soft segment ratio of 40:60) obtained by electrospinning from chloroform solution was 74–77% [56], here the porosity of the scaffolds is lower. The final porosity and pore sizes of the scaffold govern their eventual future application [71,74]. For instance, polymer scaffolds with porosities not higher than 55–74% were applied for bone regeneration, since higher porosity usually induces deterioration of mechanical properties of the scaffolds [75–77].
In our previous study [8], DP-2.0-GO sample was already tested in vivo, implanted subcutaneously into a rat animal model. Histological analysis performed after 3 months revealed a lack of accumulation of neutrophils or other types of granulocytic cells, suggesting that the scaffold did not induce an acute inflammatory or allergic reaction. Confirmation that the scaffold had successfully played the role of extracellular matrix was proven because the cells on both sides of the artificial incision proliferated and infiltrated into the scaffold.
Although these scaffolds are intended for tissue regeneration and their use would take place at body temperature, TGA was performed to envisage the interaction between the filler and the segmented polymer matrix. Fundamental research has shown that the thermal decomposition of PUs is a complex heterogeneous process and consists of several partial decomposition reactions [78]. Figure 4 depicts the TGA (a) and DTG (b) curves of the electrospun scaffolds. Different parameters that characterize the thermal stability of the electrospun scaffolds (Tmax – maximum degradation temperature, Vmax – maximal rate of thermal decomposition), obtained from the TGA and DTG curves are presented in Table 5.

TGA profiles (a) and DTG curves (b) of the electrospun GO-modified scaffolds.
Different parameters that characterize the thermal stability of GO-modified electrospun scaffolds (Tmax – maximum degradation temperature, Vmax – maximal rate of thermal decomposition, and residuel mass), obtained from the TGA and DTG-curves.

Segmented polyurethanes based on microheterophase structure possess different degradation temperature of hard (HS) and soft (SS) segments [79]. Generally, hard segments degrade at lower temperatures in comparison to the degradation of soft domains of polyurethane materials [80].
This characteristic is registered on DTG thermogram (Figure 4(b)) of the neat DP on which two maximum peaks for maximum degradation temperatures for HS and SS can be observed, one at 274 °C, corresponding to the weight loss due to the HS degradation, and the other at 345 °C, corresponding to the weight loss due to the SS degradation. For the scaffolds containing GO, additional peak at higher temperatures is detected particularly pronounced for the scaffold containing 2 wt% GO. In similar studies of thermal stability of polyurethanes, it was found that the addition of GO or other carbon based nanofillers stabilize the soft segment [80,81]. For instance, Xia and Song [82] prepared PU–CNT nanocomposites and showed that the incorporation of MWNT and SWNT did not improve the first onset decomposition temperature, influenced by the hard segment content, which involves the dissociation of urethane to the original polyol and isocyanate, which then form a primary amine, alkene and carbon dioxide while, the second decomposition temperature caused by the soft segment degradation was improved. This indicated that CNTs may preferably interact with the soft segment in the PU structure [82]. They found three reason to be responsible for the improvement in thermal stability: (1) the uniformly dispersed carbon nanotubes presumably provided thermo-oxidative stability to the polymers in the vicinity of the tube surfaces; (2) the enhanced thermal conductivity of the composite could facilitate heat transport and thus increase its thermal stability; (3) like fullerene (C60), carbon nanotubes possibly could lead to the formation and stabilization of the CNT-bonded macroradicals. Here also, the addition of GO stabilizes the soft segment resulting in reduction of the weight lost in the second phase, corresponding to the SS degradation. In this second phase the unmodified DP drops additional 62% of the mass (total mass loss of 92.8%), while addition of 0.5, 1.0 and 2.0 wt% GO reduces the mass loss in this second step to 45.3%, 44.5% and 19%, respectively (total mass loss of 86.8, 79.4 and 69.7%, accordingly).
TGA was also used to determine the real quantity of GO present in the scaffolds. In the last row of the Table 5 the values of the residual masses for all samples are presented. As expected for the neat DP there is no residual mass since all the polymer has degraded. For the other three samples the value of the residual mass is increasing with the increase of the amount of GO present in the samples, which is also expected. If we transfer the contents of GO from concentrations in the samples to the concentrations in the solution, as they were first calculated, we get 0.27 wt% for DP-0.5-GO sample (expected 0.5 wt%), 0.54 wt% for DP-1.0-GO (expected 1.0 wt%), and 0.69 wt% for DP-2.0-GO (expected 2.0 wt%). The obtained values are much lower than the expected, but this could be explained with the elimination of the oxygen functional groups present in the GO during the thermal treatment [83].
In order to evaluate the level of dispersion of GO layers in DP matrix, XRD analysis was used. This method is often applied to identify the degree of dispersion of layered nanofillers in polymer matrices, since the presence of the polymer macromolecules in the interlayer spacing leads to its increase (which is observed as shifting of the diffraction peaks towards lower values of 2θ), and a decrease in the degree of ordering (which is manifested as appearance of broader peaks with lower intensity) [84]. Figure 5 shows the XRD patterns of the electrospun scaffolds of the neat DegraPol® and its nanocomposites that contain 0.5, 1.0 and 2.0 wt% GO.
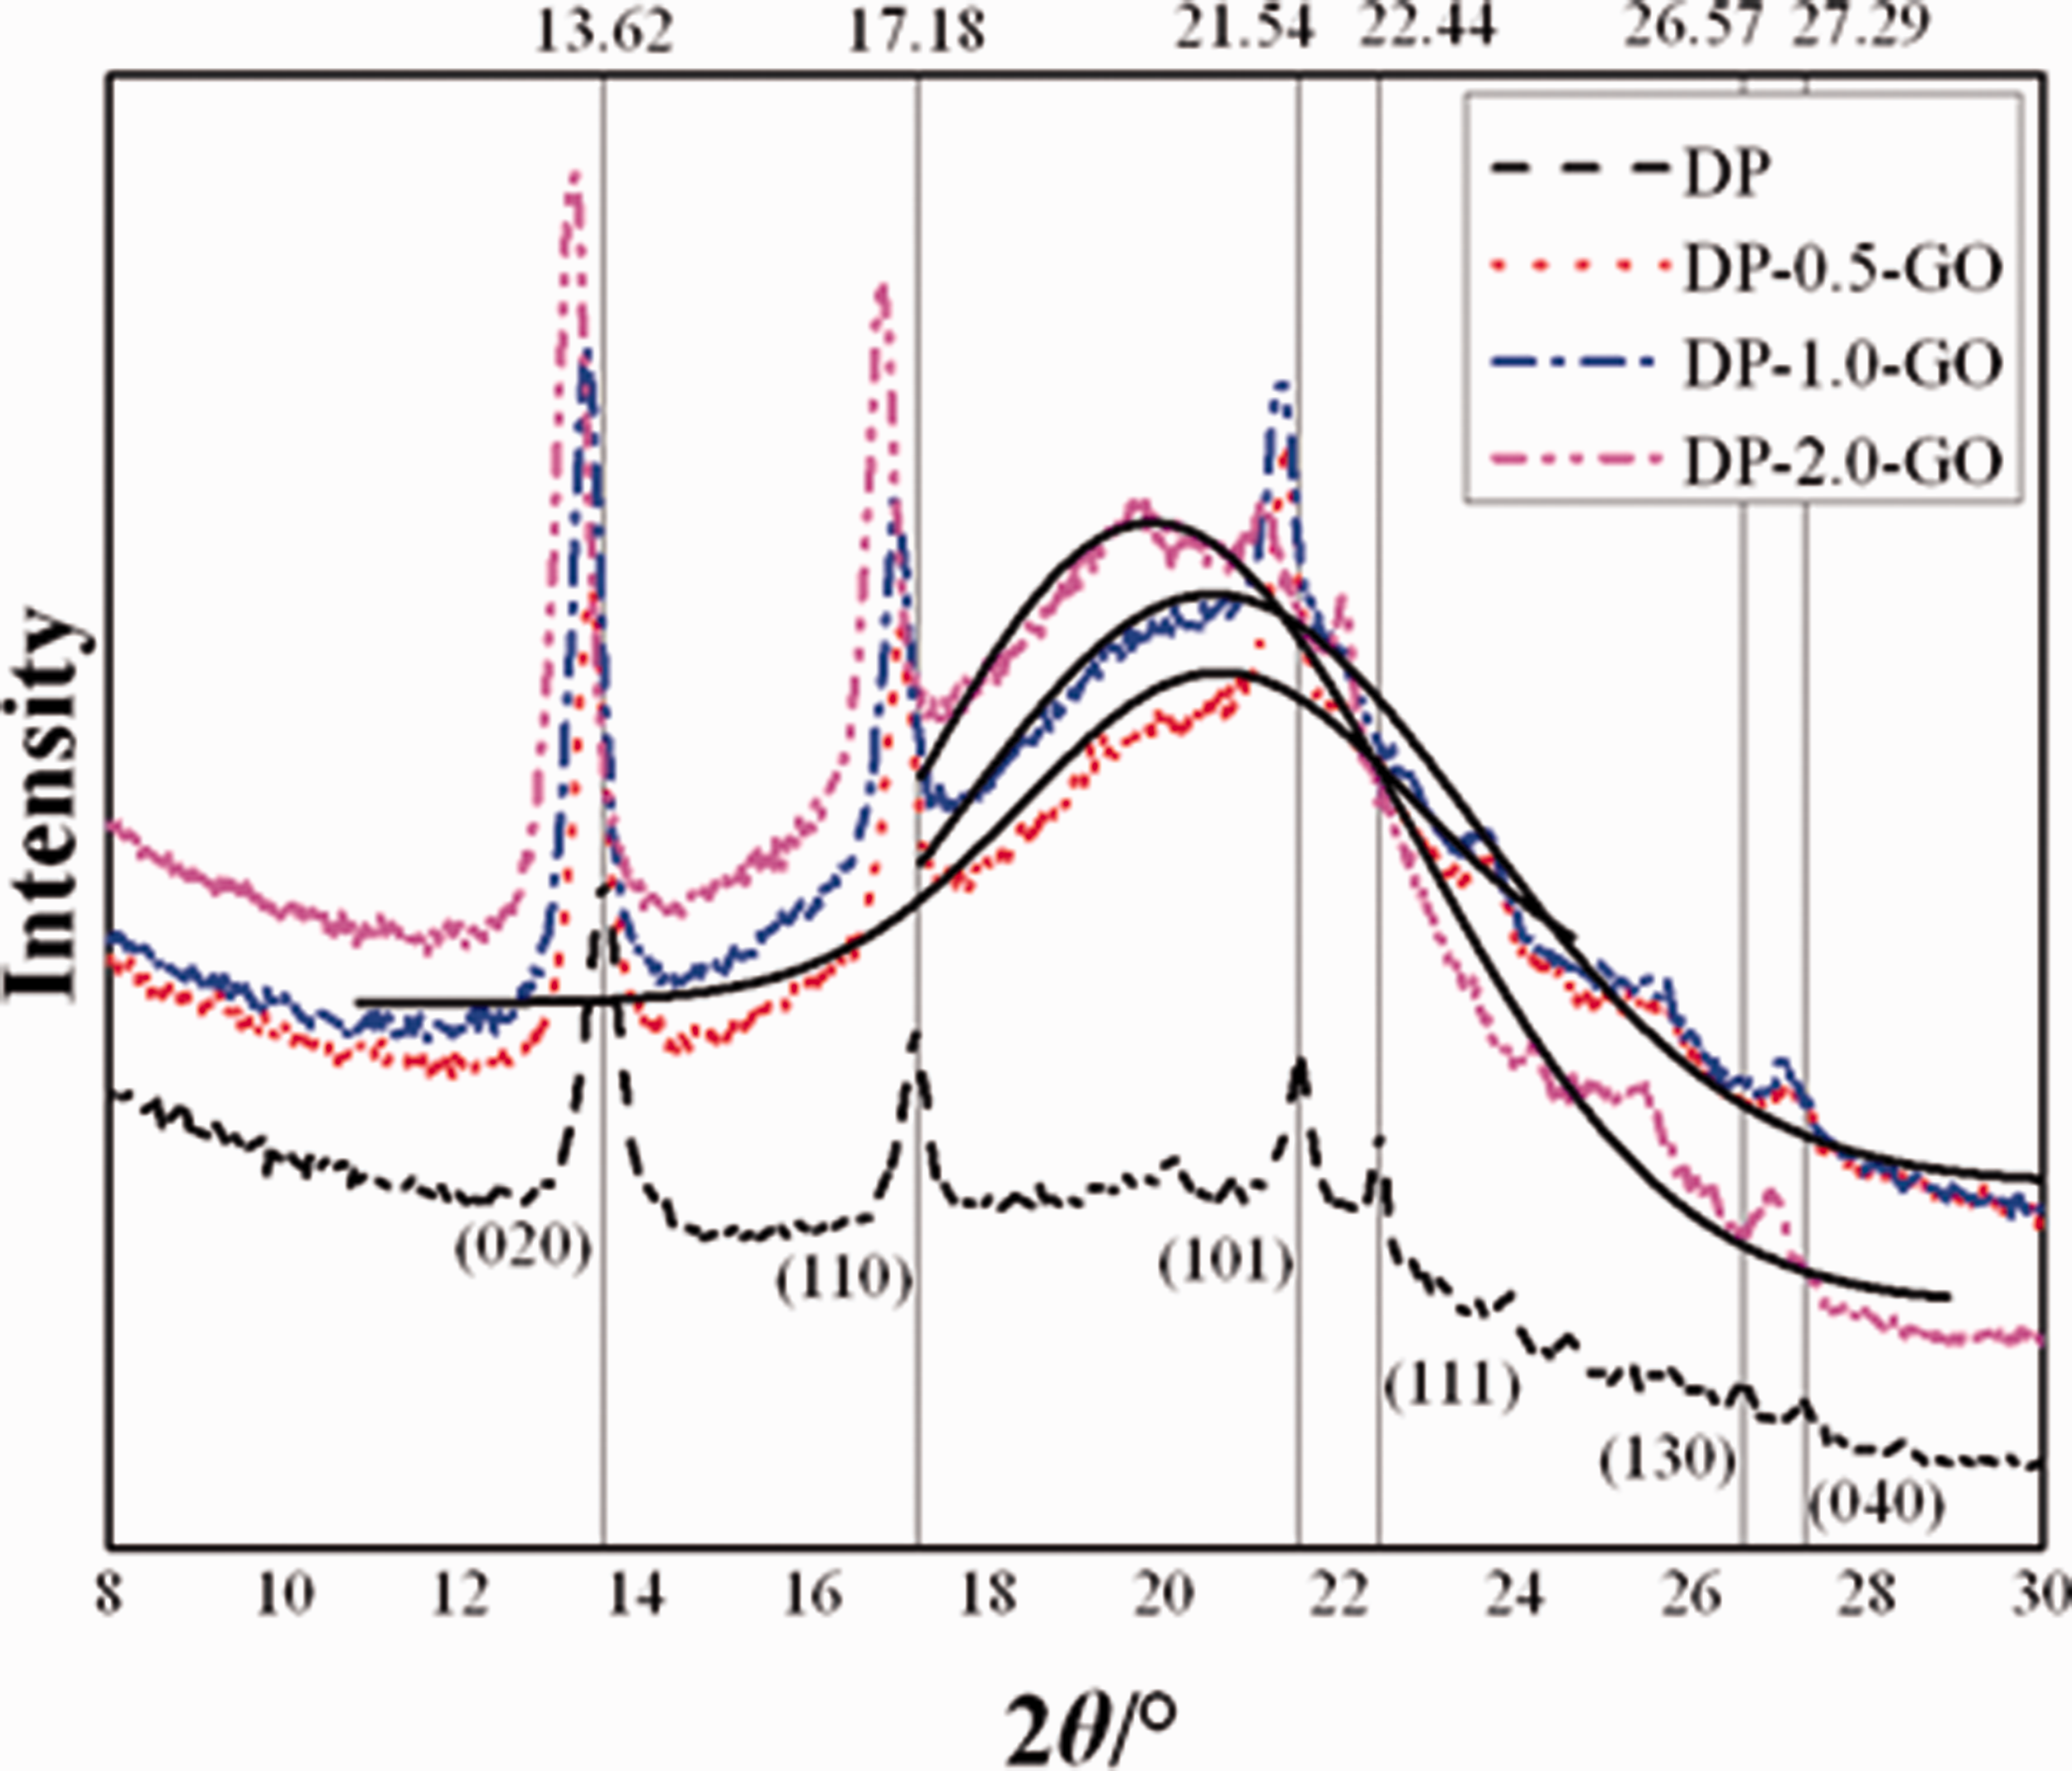
XRD patterns of the electrospun scaffolds based on DP, neat and modified with GO.
DP itself has characteristic sharp diffraction peaks that appear in the XRD patterns of all samples (unmodified and modified). The DP has not been previously characterized by means of XRD but having into account its composition of polyhydroxybutyrate-co-caprolactone as crystalline segment and polycaprolactone-co-glycol as amorphous segment, one would expect dominant peaks from the crystalline co-former. XRD literature patterns of pure polyhydroxybutyrate (PHB), pure polycaprolactone (PCL) and 80%PHB/20%PCL samples revealed that the two strong peaks from the PLC (20.45° and 22.85° [85]) were majorly diminished in the polyhydroxybutyrate/polycaprolactone nanocomposite and the overall XRD representation of the nanocomposite contained only the maxima from the PHB, associated very weak appearance of the PLC strongest peak at 20.45° [86]. In the light of this observation, a parallel is drawn that the two strongest scattering peaks (that in our pristine DP sample determined at around 2θ = 13.62° and 17.18°) are in very good agreement to the 13° and 17° peaks assigned to (020) and (110) of PHB [87]. In addition, weaker reflections located at around 21.54° and 22.44° fit nice to the 21.5° and 22.5° peaks that are attributed to (101) and (111) indices of PHB segment, respectively. Others reflections that were detected at around 26.57° and 27.29° are reported in literature at 26° (130) and at 27° (040) [88].
The doping of the DP sample with GO exhibits additional broader halo peak shape centered around 2θ ∼ 20° that corresponds to (002) GO reflection whose exact position determines the distance between the graphene layers [89–91]. Such halo peak existing only in the GO-modified scaffolds could serve as indicator for a decrease in the degree of ordering of GO layers. Therefore, these broad peaks in the GO modified samples (presented with solid black lines in Figure 5) were fitted by a Gaussian lineshape to calculate the average distance between the graphene layers.
The interlayer spacing, denoted as d, was calculated via the Bragg’s equation (4) and the average height of stacking layers, denoted as H, was calculated via Scherrer’s equation (5) with a constant, dimensionless shape factor, equal to 0.9. The calculated structural parameters of the electrospun GO-DP based nanocomposites resulting from the XRD patterns are presented in Table 6.
Structural parameters of the electrospun GO-DP based nanocomposites resulting from the XRD patterns. Notation: H – average height of the stacking nanolayers, n – average number of graphene layers in graphene stacking nanolayers, d – average distance between graphene layers.

The values of 2θ decrease and accordingly the average distance between graphene layers increases, with increase of GO concentration in the polymer system. It is important to further note that the stacking nanolayers consist of average 3–4 layers for DP-0.5-GO, 2–3 layers for DP-1.0-GO and only 1-2 layers for DP-2.0-GO, indicating almost exfoliation of GO layers in the polymer matrix, keeping in mind that the used GO is declared as consisted of 15–20 layer sheets. These results suggest that the applied power and time of ultrasonication of the GO dispersions in chloroform and then in the polymer solutions lead to a full delamination and uniform dispersion of GO in the polymer matrix. This is in correlation with the test results of the performed mechanical properties [8]. The mechanical properties changed with the addition of GO. Modulus 100 increased significantly and tensile strength of the samples increased moderately with the addition of 0.5 and 1.0 wt% GO.
Raman spectroscopy was utilized to evaluate the possible interactions between the polymer matrix and the nanofiller. Raman spectroscopy offers to effeciently probe the structural characteristics and properties of graphene, graphene-based materials and their nanocomposites [92]. Figure 6 shows the Raman spectra of the electrospun webs of pure DP and its nanocomposites with 0.5, 1.0 and 2.0 wt% GO.

Raman spectra of the electrospun DP sample and GO-modified nanocomposites.
DP is a biodegradable polyester urethane block copolymer composed of polyhydroxybutyrate-co-caprolactone as crystalline segment and polycaprolactone-co-glycol as amorphous segment (diisocyanate as a junction unit). Therefore, the strong Raman band at 1726 cm−1 is attributed to the stretching C = O vibrations within the (poly)caprolactone units [93]. On the other hand, the intense band at 1443 cm−1 is ascribed to the bending in-plane (scissoring) CH2 mode whereas the 1306 cm−1 band evolved from the bending out-of-plane (twisting) CH2 vibrations. The methylene groups are present in both the polycaprolactone and the hexamethylene fragment of the diisocyanate chain extender units. The Raman spectrum of DP practically completely resembles the Raman behavior of polycaprolactone used to determine its conformational order and crystallinity [94]. These peaks are hardly visible in the DP-0.5-GP sample, but with increase of the graphene oxide concentration they disappear from the spectra.
The samples that contain GO exhibit similar Raman spectrum in terms of the shapes and positions of Raman peaks. The two peaks characteristic for graphitic structures are present in the spectra. One at 1601 cm−1, denoted as G band, is characteristic for the C–C vibrations of delocalized p-electrons with sp2 hybridization, and the other at 1345 cm−1, denoted as D band, is distinctive for the defects in the graphitic structures with sp3 hybridization [95]. Consequently, the higher values for the ratio between the intensity of D band and the intensity of G band (ID/IG) demonstrate presence of more defects in the graphene structure [96].
Thus, to evaluate the differences between the obtained fibrous webs, the ratio intensity of D and G bands was determined by calculation of their peak area. For such purpose, the peak-fitting was applied and the ID/IG, ratio was calculated for each spectrum. The value of ID/IG for DP-0.5-GO was 1.55, for DP-1.0-GO – 1.70 and for DP-2.0-GO – 2.07. The ID/IG value increase with increase of GO content having the highest value for the sample with the highest concentration of GO (2 wt%), indicating highest number of defect sites on the graphitic structure which are promoting filler/matrix interactions and/or higher level of filler dispersion [95–98]. In the line of these observations, the increase of the GO content also induced alteration of the shape and intensity of the D-band whereas the G-band is found to be practically unaltered (Figure 6). Namely, D-band despite its increase of its intensity, gained more symmetrical shape that closely resembles to the profile of the corresponding band in pristine GO sample [99]. The observation nicely complement to the triggered spectral phenomenon observed in the fabricated polycarpolactone-GO scaffolds [93] inferring that the polymer-GO interactions involve the oxygenated sublattice of GO while preserving its graphenic domains.
These Raman features are well-correlated with the XRD results revealing structural parameters pinpointing highest level of GO dispersion in the 2% GO-modified DP sample having stacking nanolayers consisted of average 1–2 layers and indicating almost exfoliated graphene oxide structure.
Conclusion
A successful optimization of the electrospinning parameters for obtainment of DP and DP/GO based webs of fibers was performed. The morphological characterization of the samples obtained by optimized parameters revealed a fibrous microstructure consisting of randomly oriented fibers with a diameter ranging from hundreds nanometers to couple of micrometers. The fibers are forming a 3 D interconnected pore network, which is very important for tissue engineering application, for which the samples are intended, and represent a feasible imitation of the structure of extracellular matrix (ECM). The successful modification of the DP web of fibers by addition of GO is evaluated from the achieved high level of dispersion. The XRD studies showed high dispersion of the GO in DP matrix and even GO exfoliation for the sample that contains 2 wt% GO was achieved. Raman studies neatly complemented the highest filler/matrix interactions and the superior levels of dispersion for this sample.
Footnotes
Declaration of conflicting interests
The author(s) declared no potential conflicts of interest with respect to the research, authorship, and/or publication of this article.
Funding
The author(s) received no financial support for the research, authorship, and/or publication of this article.