
Abstract
Composite materials which are reinforced with 3D warp interlock fabrics have outstanding mechanical properties such as higher delamination resistance, ballistic damage resistance and impact damage tolerance by means of their improved structural properties. Textile reinforcements are exposed to large deformations in the production stage of composite materials which have complex shape. Although good formability properties of 3D warp interlock fabrics in forming process were already proven by recent studies, further information is needed to elucidate forming behaviours of multi-layer fabrics which is produced with high stiffness yarns like carbon. In this study, 3D warp interlock carbon fabrics were produced on a prototype weaving loom and the same carbon yarn was used in two fabric directions with equal number of yarn densities. Fabrics were differentiated with regard to the presence of stuffer warp yarn, weave pattern and parameters of binding warp yarn which are angle and depth. Therefore, the effect of fabric architecture on the mechanical and formability properties of 3D warp interlock carbon fabrics could be clarified. Three different breaking behaviours of fabrics were detected and they were correlated with crimp percentages of yarn groups. In addition, the bending and shear deformations were analysed in view of parameters of fabric architectures. Two distinct forming behaviours of fabrics were determined according to the distribution of deformation areas on fabrics. Moreover, the optimal structure was identified for forming process considering the fabric architecture.
Keywords
Introduction
Textile materials have been used within composites as fibrous reinforcement by means of their superior properties like non-corrosion, fully designable and high strength versus weight ratio.
Textile structural composites usually consist of stacked reinforcement layers in which fibres can have unidirectional or multi-directional orientations. Therefore, they exhibit in-plane high strength and stiffness values. However, poor mechanical properties have been found in the out-of-plane direction due to the lack of fibrous reinforcement in the thickness direction.
3D fabrics can be defined as a single fabric system, where constituent yarns are disposed in three perpendicular directions of the structure [1]. 3D fabrics can be produced with different textile manufacturing methods like weaving, knitting, non-woven, tufting or stitching.
Among all these different types of 3D fabrics, the 3D warp interlock fabric is an integrated structure, which is produced by two and more groups of yarns using the weaving technology. Fabric layers are connected to each other via binding warp yarns to maintain the integrity of the woven structure. As a result, composite material, which is reinforced with 3D warp interlock fabric, exhibit higher inter-laminar fracture toughness owing to the presence of binding warp yarns within all the structure [2]. Additionally, 3D woven composites have higher delamination resistance, which is a suitable property for thick composite material [3–6] as well as for ballistic applications [7–10].
3D warp interlock fabrics offer huge opportunity for producers to get the desired mechanical properties thanks to their product and process parameters. However, more test results and research studies are needed in the literature to clarify their influences on their mechanical properties. Accordingly, many research studies have been focused on this problem since the last decade [11–17]. In addition, complex deformations like impact, knife penetration, permeability and formability properties were examined under different structural parameters in other studies [18–21].
The carbon fibre is one of the main components for high resistant composite materials due to their high strength values. As the carbon fibre is a stiff and brittle structure, they can lose their strength because of abrasion during the 3D weaving process [22,23]. It was reported in the study of Rudov-Clark et al. [24] that the proportion of strength loss of breakable fibres reached 50% for binding warp yarns during the 3D weaving process of E-glass yarns.
Owing to the complex shape of mould, fibrous reinforcements are exposed to large deformations before impregnation process to manufacture composite materials. Thus, understanding the formability behaviour of fibrous reinforcements can be helpful to avoid wrinkles or defects on the fabric before impregnation process [25,26].
Single layer of 2D woven carbon fabrics can be deformed into complex shape mould without any wrinkles providing that fabric has optimized combination of structural parameters, which are the linear density of yarn, end and pick densities and the weave pattern [27–29]. On the other hand, when the multi-layers of 2D fabrics, which were produced from high stiffness yarns, were moulded, several defects and wrinkles occurred [30,31].
Although it was proven by recent studies [32,33] that the 3D warp interlock fabrics have good formability properties during forming process, the forming behaviour of multilayer fabrics made with high stiffness yarns is still a challenge.
Initially, the bending in the thickness direction of a 3D interlock warp fabric was studied [34], due to the low shear stiffness value in the direction of the binding warp yarns for angle type 3D warp interlock fabrics with through-the-thickness binding. It has been shown that the number of layers of weft threads and the values of warp and weft yarns’ densities directly influence the bending capacity of the 3D warp interlock fabric made from E-glass yarns.
In the framework of our research work [35], we have also observed the geometry of the 3D warp interlock fabric at different stages of the bending until its final shape to understand the thickness behaviour of fabric in the forming process. Cross-sectional observation studies were carried out on the geometry of fabric and evolutions of warp and weft yarns were measured to detect changings of their positions. For this purpose, a 3D warp interlock fabric (A-L 3-2 9), made with 8 K carbon yarn in warp and weft directions, were used and folded from an initial flat shape to a complete turn over on itself, passing through four deformation steps. We observed a change in the orientation of the weft yarn columns as a function of the applied pure shear stress, on either side of the woven structure, in the direction of the binding warp yarns and in the two opposite directions. Thus, a state of equilibrium is reached in the final phase of deformation of the 3D warp interlock fabric. This results in a conservation of the integrity of the woven structure and a local modification of the cross-sectional geometries of the warp and weft yarns to adapt to the different applied stresses in the thickness of the 3D warp interlock fabric.
In our other research works [36,37] we have increased the number of weft yarn layers in the 3D warp interlock structure and verified that the thickness of the fabric had an influence on the deformation of the initial geometry during the forming process in the direction of weft yarns. Different 3D warp interlock fabrics (O-L 1-2 13) were tested and we found an equilibrium in the distribution of pure shear stresses in the direction of weft yarns. We observed that the 3D warp interlock structure deforms by sliding in the weft direction, with warp yarns arranged within the same insertion column layer-to-layer of the binding warp yarns, which implies higher shear stresses at the edges of the folded fabric. It was concluded that maximum tensile stresses were concentrated on yarns in the largest bending radius of 3D warp interlock fabric and compression stresses occurred on yarns in the smallest bending radius of fabric. The same phenomenon was observed in the quasi-static 3-point bending tests of a 3D warp interlock fabric thanks to in-situ measurements provided by sensor yarns located inside the woven structure [38].
In our recent research works [33,39–41], we have investigated the deformation mode of a 3D warp interlock fabric during the forming process. Different studies have shown the influence of forming at different temperature values [42,43] or at room temperature [44], as well as the deformation rate parameter [43,44]. Other studies have been carried out on different types of materials such as un-impregnated 2D fabrics [43,45], impregnated 2D fabrics [42,44] and unidirectional stacked structures (NCF) [46]. More specifically for fabrics, the influence of the initial geometry of the 2D fabric has been demonstrated for plain [47], twill [42–44,47] and satin [42,47] weave diagrams.
During the forming process, directions and intensities of forces, which are exerted in both directions of the fabric, lead to a local rearrangement of yarns in relation to each other depending on the initial geometry, densities of warp and weft yarns and yarn strength values. This results in various observable physical phenomena, on a global scale by a consumption of threads in the thickness of the fabric plane leading to different values according to the warp and weft directions [48,50], and on a local scale leading to a change of angle of position between the warp and weft threads [51]. In these numerical and experimental studies [25,26,29,52–59], dealing with the analysis of deformations and defects during the shaping of dry reinforcements, we can see that studies on thick multi-layer reinforcements or 3D warp interlock fabrics appears to be scarce [60–64].
Within the framework of our various research works [37,40,65], we have shown the deformation capacities of 3D warp interlock fabrics during the folding and forming processes. The first results obtained show us the combined influence of both the path and the binding depth of the binding warp yarn on the anisotropy of the tested architectures. Thus, the 3D woven architecture close to the layer-to-layer binding type with a limited binding depth and with a reduced number of warp and weft crossing points, allows the integrity and homogeneity of the initial geometry to be maintained by consuming warp and weft threads within the woven structure [66].
The variations observed in the thickness direction of 3D warp interlock fabrics also show local behaviours between warp and weft threads leading either to a deformation out of the plane of the fabric or to a compression of the fabric. The use of a fibrous reinforcement such as a 3D warp interlock fabric requires the application of a global compressive stress during the resin impregnation process in order to minimize the heterogeneity of resin distribution in the different zones of the 3D warp interlock fabric, therefore the fabric is deformed.
Nevertheless, specific knowledge on the choice of the suited fabric architecture of 3D warp interlock structure to be used for forming ability and mechanical properties appears to be missing, and especially for carbon yarns. This additional knowledge will help designers to choose optimal structure to produce complex shape of composite materials with the required properties.
The types and number of warp yarn groups, angle and depth of binding warp yarns and weave pattern are main parameters to constitute the fabric architecture of 3D warp interlock fabrics. The distinctive effects of main fabric architecture parameters on the mechanical properties have not been studied in the literature. In addition to this, as the complex formability behaviour of 3D warp interlock carbon fabrics could be elucidated, number of measurements, which are locking angle, draw- in distance, formability load and local shear angle values, were carried out and hence, optimal fabric architecture could be more accurately detected.
Several 3D warp interlock fabric architectures were produced with the same warp and weft densities and with the same linear density of carbon yarn onto our prototype weaving loom. 3DWICF were differentiated in terms of the binding warp yarn parameters (3D architecture), weave pattern and presence of stuffer warp yarns. The effects of fabric architectures on their tensile, bending, shear and forming properties were comprehensively investigated. Hence optimal fabric architecture could be determined for large deformations while forming into a mould during the composite production process.
Material and method
Tested materials
3D warp interlock fabrics can have two or more number of yarn groups in respect of their structural design. The cross section along the warp direction and the 3D simulation of a 3D warp interlock fabric are presented in the Figure 1. The fabric has three types of yarn groups and they are indicated with different colours in the Figure 1(a). Weft yarns (grey) are inserted into the fabric by picking mechanism of the weaving machine and they are perpendicular to the warp yarns. While the stuffer warp yarns (green) have straight path into the fabric and characterize its longitudinal properties, the binding warp yarns (blue) connect the fabric’ s layers by a specific 3D architecture. The cross-section view was given through the fabric thickness in the warp direction, in this view one of the binding warp yarn was coloured in red to highlight the yarn path pattern.

Interlock A-L 5-3 4 {Twill 1 × 5} (a) the cross section along the warp direction and (b) the 3D simulation.
3D warp interlock structures have four main classes (O-L, O-T, A-L and A-T) based on the 3D architecture of the binding warp yarn. These classes are established in terms of angle of the binding yarn through the fabric thickness, when the binding warp yarn passes from a layer to next layer; ‘Orthogonal’ (O) or ‘Angle interlock’ (A) and depth of the binding yarn at each weft column; ‘Layer-to-layer’ (L) or ‘Through-the-thickness’ (A) [2,67–69]. Additionally, by looking at one weft layer, binding warp yarns are interlaced with the weft yarns with respect to a weave pattern. The 3D architecture and weave pattern are main parameters to define the fabric architecture of 3D warp interlock fabric. A concise definition, which is presented in the expression 1, was used in the study to identify 3D warp interlock fabrics in compliance with the general definition proposed by Boussu et al. [70].

3DWICF were differentiated in terms of 3D architecture, weave pattern and presence of stuffer warp yarn. Firstly, fabrics were distinguished in two groups according to the presence of stuffer warp yarns.
First fabric group was manufactured without stuffer warp yarns. While fabrics’ 3D architectures were kept the same for all structures, they were diversified by the weave pattern. These fabrics are described in the Table 1.
Description of 3D warp interlock fabrics without stuffer warp yarns.

Contrary to the first group, the fabrics of the second group include stuffer warp yarns. It was taken into consideration that the group should comprise the four main classes of 3D warp interlock structures (O-L, O-T, A-L and A-T). Further, the fabrics were differentiated in terms of the weave pattern. The architecture properties of these fabrics are represented and defined in the Table 2.
Description of 3D warp interlock fabrics with stuffer warp yarns.

6 K (400 Tex) carbon yarn, that belongs to Toho Tenax Company, was chosen as raw material. The same yarn was used in warp and weft directions for all produced fabrics.
Fabric production process
Prototype weaving machine, which was developed in GEMTEX Laboratory [71], was used to manufacture the fabrics. This machine is dedicated to manufacture 3D warp interlock fabric from high performance fibres by using special designed mechanisms like warp tensioning system. It was equipped with a dobby shedding system to control 24 heddles frames and the shedding system is actuated by pneumatic mechanism because of the electrical conductivity of carbon yarn.
The same warp density was set on the loom for all fabric as 10 yarns per cm. Thus, all fabrics were produced on the same loom without changing either warp beams or count of the warp yarns on the reed. In the case of the first fabric group, Table 1 weaved without stuffer warp yarn, all warp yarns were used as binding. However, for the second group, Table 2 weaved with stuffer warp yarn, the warp yarns were assigned alternatively (one by one) between stuffer and binding. Similarly, the same number of weft yarns was inserted per cm of fabric. Thus, all produced fabrics have the same count of weft yarn per cm of fabric. Although fabric groups have different number of weft layers, weft insertion count was not changed. Consequently, count of weft columns per cm decreases with the increasing number of weft layers. Fabrics with three weft layers, first group without stuffer, contains 3.3 weft columns per cm while fabrics with four weft layers, second group with stuffer, contains 2.5 weft columns per cm. However, total number of weft yarns per cm was kept the same.
Methods of measurement
Areal weight and thickness measurements
Fabrics’ areal weight and thickness were measured according to ISO 12127 and ISO 4603 test standards, respectively. Ten samples were tested for every fabric and average values were calculated with standard deviation in both measurements.
The yarn crimp measurement
Yarn crimp percentages were measured according to ISO 7211-3 test standard. This measurement was performed for each constituting yarn set in terms of their type (stuffer warp, binding warp and weft) and their position in the fabric thickness (at which layer or inter-plies position they are located). For instance, O-T 3-4 4 {Twill 3 × 3} involves one binding warp (red), three stuffer warp yarns (green) and four weft yarns groups (grey). Their distinctive crimp percentages are shown in Figure 2 according to which layer “L” (for weft) they belong to and which inter-plies position “I” (for stuffer and binding warp) they are located at. The weft layers were numbered from top fabric surface to bottom. The inter-plies positions were numbered similarly with considering the upper fabric surface is the inter-ply position zero “I0”.

Crimp percentages of different warp and weft yarn groups into O-T 3-4 4 {Twill 3 × 3}.
Yarn tensile test
Ten samples of carbon yarn, taken from the provided yarn bobbin, were tested according to ISO 2062 test standard. MTS Criterion-Model 43 tensile test machine with 10 kN load cell was used in the test. The determined yarn tensile properties are presented in the Table 3.
Properties of carbon yarn.

The tensile test
Tensile properties of each manufactured fabric in both fabric directions were characterized via quasi-static tensile test. Test was performed according to the ISO 13934-1 standard using INSTRON 5900 tensile machine with 250 kN load cell. Five specimens, which have 300 × 50 mm dimensions, were tested for both fabric directions with a gauge length of 200 mm. In order to avoid a premature failure during tensile test and to prevent specimen sliding from the machine grips, both fabric edges were impregnated with resin epoxy matrix for a length equal to the gripping length of 50 mm. Additionally, E-glass [+45, –45] NCF reinforced epoxy matrix tabs were applied at 0° on the gripping area in order to avoid soft interface.
Maximum tensile load per unit fabric width and breaking energy were determined for all produced fabrics. The breaking energy corresponds to required work to break the fabric during tensile test. It was determined by computing the area under the load-strain curve in respect of trapezoidal method [72] between zero and maximum strain. The maximum strain corresponds to the complete specimen rupture where the load value comebacks to zero. As the breaking energy is intrinsic structural property for each fabric, it was normalized to the specimen width to be used as a comparative factor.
Further, breaking energy coefficients were calculated to clarify the effect of fabric architecture on the mechanical properties of 3DWICF. Therefore, coefficients were calculated according to equation 2 for every fabric in warp and weft directions. The carbon yarn breaking energy was determinate by following the same method as calculation of the breaking energies of 3DWICF.
The bending test
Fabrics’ bending lengths were measured and bending rigidities were calculated for both fabric directions according to ISO 9073-7 test standard. Fabrics’ bending rigidities “G “(N.cm) were calculated in warp and weft directions with the equation 3. p is the own weight per unit area (g/m2), C is the overall mean bending length that is half of measured value (cm) and the gravitational acceleration is accepted as 9,81 (m/s2) for calculation. Bending test was performed on five specimens of each manufactured fabric with dimensions of 300 × 50 mm in both fabric directions.
Bias extension test
In-plane shear properties of each fabric structure were characterized via bias extension test. Test specimens were cut at 45° in I shape with a length/width ratio of 3 as shown in Figure 3. The test was carried out via MTS Criterion-Model 43 tensile test machine with 10 kN load cell and 10 mm/min speed without pretension load. Evolution of the shear angle on the fabric face was followed by tracking the displacement of white points, which were drawn on the fabric face, with 2D digital camera. Then the captured images were analysed via GOM Correlate 2018 programme [73].

Bias extension test. (a) Tested specimen with all its dimensions and (b) resulted deformation.
Moreover, locking angles of all produced fabrics were determined. The warp and weft yarn, which are initially perpendicular, rotate relative to each other at the crossover point with the transverse displacement. The lateral compression between the two yarn sets get higher because the gap between the yarns are decreased. Then the shear load began to increase considerably and shear angle tends to stagnate. The shear angle at this stage is known as locking angle. At this stage, with attending the maximum shear angle of the structure, some defects occurred such as wrinkles formation. Therefore, it is important to identify this angle. A simplified method is followed to determine the locking angle. It consists of localising the separation between the theoretical shear angle-displacement curve, calculating according to equations 4 and 5 [74], and measuring shear angle-displacement curve, as illustrated in Figure 4.


Measured and calculated shear angle values of O-T 3-4 4 {Twill 3 × 3}.
The formability test
Formability testing machine, which was developed in GEMTEX laboratory [75,76] and shown in Figure 5, was used in this study to evaluate the fabric behaviour during forming. A test sample is placed between the two plates (upper and lower), which contain concentric holes and they are fit with the punch shape. The in-plane tension of the fabric is controlled during the test via blank-holder plate which applies a compression force on the upper plate and is controlled by a pneumatic system.
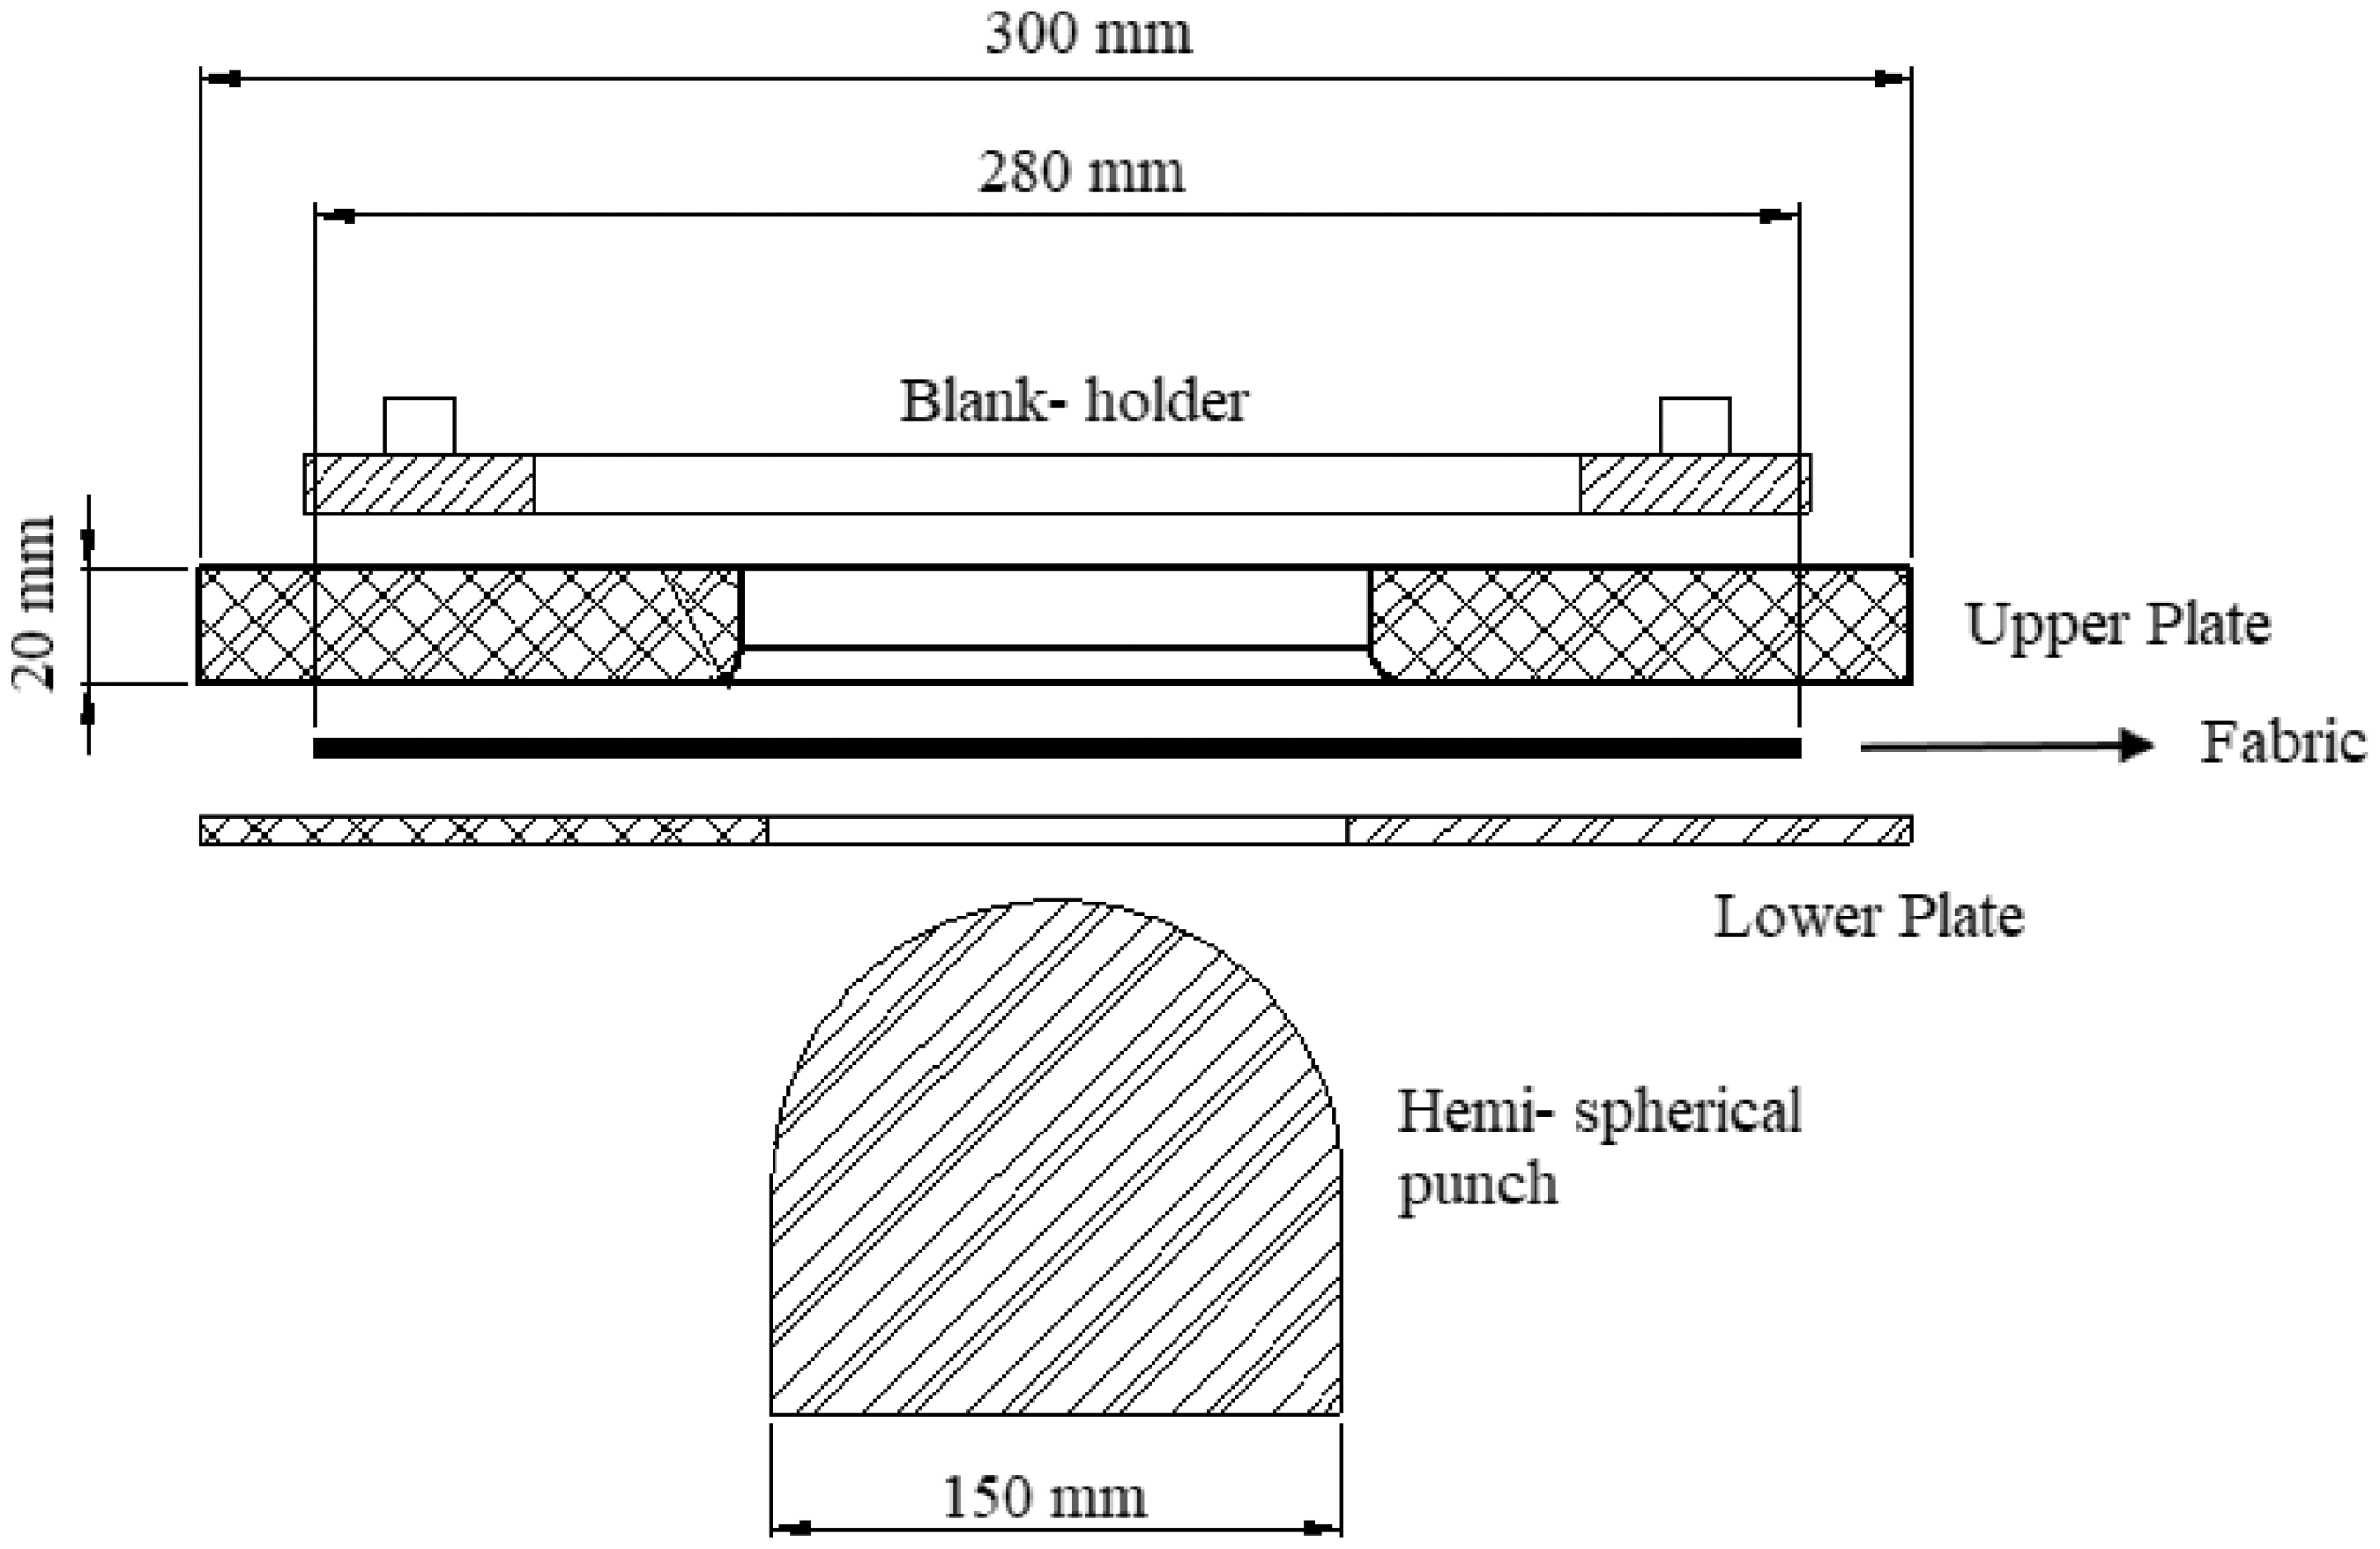
Formability testing machine scheme.
The flat fabric is deformed into desired 3D shape by a punch which is actuated with pneumatic system. Different shapes of punch (spherical, triangular prism or rectangular prism) can be used in accordance with the shape of purposed deformation.
All samples were tested at a constant 45 mm/s velocity by hemi-spherical punch, which has 150 mm diameter. The blank holder pressure was settled to 2 bar, which was constant during the forming test, and it was kept the same for all test samples.
One specimen, which has 280 × 280 mm dimensions, was tested for each manufactured fabric due to the lack of material. A grid was drawn with white pen on the top surface of test samples to evaluate in-plane fabric deformation and edge displacements. The 2D digital camera was used to capture fabric top surface during the test.
Analysis of deformed 3D warp interlock carbon fabric
Several measurements were carried out on the deformed fabric to comprehensively examine the formability behaviour of 3DWICF. The formability is a complex deformation and deeply affected by different structural and mechanical properties of fabric. However, the shear is the main deformation that occurs during fabric forming to fit the required shape. Furthermore, the shear deformation is a key indicator for defects such as wrinkles, which are observed during the test.
The shear angle was locally measured on each sub-region, which was created by pre-drawn lines on the top surface of fabric, Figure 6(a). Lines were drawn on warp and weft yarns of fabric with respect to fabric’s weave pattern. Fabric has the same deformation in each quarter of it because of the punch axis-symmetry. As a result, the analysis was conducted on a quarter of fabric to reduce the analysis time. Un-deformed and deformed O-T 3-4 4{Basket 3 × 3} are shown in Figure 6.

O-T 3-4 4 {Basket 3 × 3}. (a) Un-deformed fabric and (b) deformed fabric.
Warp and weft yarns were perpendicular to each other before the forming process. Two axes (x, y) are considered to indicate the yarns’ orientations. The weft direction is remarked with x axis while the warp direction is indicated with y axis. After forming, warp and weft yarns are rotated to a new orientation (x′ and y′ axis) with an angle (θ׳) between two axes. The angle (θ׳) was measured by using an image analysis software (image j) [77] for each sub-region. Then shear angle values (γ) were calculated with the equation 6.
By forming the fabric, its edges withdraw towards the midpoint of the plate. The displacement of withdrawal is determined with draw-in distances from the initial position and they vary along the fabric edge with respect to the punch shape.
Draw-in distances are significant parameters to clarify forming behaviour of fabrics. Draw-in points were created on fabric edges in both directions and their displacements were measured thanks to the image analysis software (image j) [77]. Marked draw-in points in warp and weft directions of A-T 5-4 4 {Twill 1 × 5} and measured draw-in distances are shown in Figure 7.

Draw in points of A-T 5-4 4 {Twill 1 × 5} and its draw-in distances.
Results
Fabrics were produced with the same carbon yarn on the prototype weaving machine with equal warp and weft densities. They were differentiated in terms of binding warp yarn parameters, weave pattern and presence of the stuffer warp yarn. Testing results are presented in this section.
Physical properties of 3D warp interlock carbon fabrics
Areal weight and weft densities measurements
Areal weight values of the produced fabrics vary between 768 and 815.43 g/m2. Remarkable differences were observed between the fabrics, which were differentiated only by the fabric architecture, as it can be seen in the Figure 8. The presented results were split into two clusters regarding the two manufactured fabric groups; without stuffer warp yarn made of three weft layers (Table 1) and with stuffer warp yarn made of four weft layers (Table 2). The difference in areal weight was accompanied with a difference in weft density after production as shown in Figure 8, even the same weft insertions density is set on the machine. That can be attributed to the effect of angle of the warp binding yarn in the fabric thickness. Binding yarn with “Angle Interlock” pattern tends to separate and spread out the weft columns and compact the fabric in the thickness direction as it passes layer by layer through the thickness. Thus, fabric condensation in weft direction is more difficult with this pattern comparing with “Orthogonal” pattern that has higher weft density.

Areal weight and weft density values of 3D warp interlock carbon fabrics.
Thickness measurements
Measured thickness values of both fabric groups, with and without stuffer warp yarn, are presented in the Figure 9. A significant difference is observed between the two groups and it was explained by the difference in number of weft layers. While fabrics without stuffer yarn, made of three weft layers, have thickness values between 1.47 and 1.61 mm, fabrics with stuffer yarn, made of four weft layers, have thickness values between 1.95 and 2.37 mm.
Thickness values of 3D warp interlock carbon fabrics.
In order to highlight the effect of the fabric structure on areal weight and thickness values, with maintaining the warp and weft insertion density, the obtained results of O-L 3-2 4 {Twill 1 × 3} and O-L 5-2 3 {Twill 1 × 5} were compared and analysed. These structures, circled on Figures 8 and 9, belongs to the two manufactured fabric groups; O-L 3-2 4 {Twill 1 × 3} was made of 4 weft layers with stuffer warp yarn while O-L 5-2 3 {Twill 1 × 5} was made of 3 weft layers without stuffer yarn. The difference in the number of weft layers explains the difference in the fabric thickness; 2.1 and 1.6 mm for O-L 3-2 4 {Twill 1 × 3} and O-L 5-2 3 {Twill 1 × 5}, respectively. The ratio between the two thickness values is near to 3/4 corresponding to the ratio between the number of weft layers. This means that the fabric layers are well stacked in the through-the-thickness direction after production. The weft insertion count was kept constant for both fabric groups as it was mentioned in section 2.1.1. Thus, the total number of weft yarns per cm was kept the same even with increasing the weft layer number. Consequently, increasing the number of weft layer did not cause to raise the areal weight for O-L 3-2 4 {Twill 1 × 3} comparing to O-L 5-2 3 {Twill 1 × 5}. O-L 5-2 3 {Twill 1 × 5} does not include stuffer warp and all warp yarns were used as binding. Since the binding yarn passes through the fabric thickness and links the layers, the binding yarn is more waved comparing with stuffer warp yarn which are straight into the fabric. That causes higher crimp percentage for binding yarn than stuffer yarn and resulting in higher areal weight for O-L 5-2 3 {Twill 1 × 5}. When the areal weight and thickness values of structures are compared, it can be concluded that fabrics with higher number of weft layers are less packed in the warp direction providing that the weft density is kept the same.
Mechanical properties of 3D warp interlock carbon fabrics
Results of tensile test
Different tensile behaviours were observed in the tensile test of 3DWICF in warp direction. Among the structural parameters of the fabric, a strong relationship was found between the tensile behaviour in warp direction and warp yarn crimp percentages. Stuffer and binding warp yarns, which are in different inter- plies position in the fabric, have distinct crimp percentages to each other. The load-strain graphs of fabrics were classified according to the difference between maximum and minimum crimp percentages of warp yarns, Figure 10.

The tensile load–strain graphs of 3D warp interlock carbon fabrics in warp direction.
If the difference between maximum and minimum crimp percentage of warp yarns is lower than 1%, warp yarns are broken simultaneously then the load drop down dramatically, Figure 10(a). Therefore, fabric’s tensile test graph has just one peak. This behaviour was observed for A-L and O-L fabrics having “layer-to-layer” depth pattern of binding yarn. In this pattern, the binding yarns do not cross over all the fabric thickness, so the difference of crimp percentage with the stuffer yarns is less. This group of fabrics, which have one peak on the tensile graph, were denoted as Group 1. Fabrics without stuffer yarns, which have similar crimp percentage for different binding yarns, also showed one peak on the tensile graph and they were denoted as Group 2.
If the difference between maximum and minimum crimp percentages of warp yarns is higher than 1.5%, two separate peaks are obtained on the load-strain graph, Figure 10(b). First peak corresponds to rupture of the warp yarn characterized by lower crimp in comparison with the second group of the warp yarns in the fabric. Higher crimp percentage leading to a second rupture at higher strain. This behaviour was noticed in A-T and O-T 3DWICF in which the binding warp yarn has” Through-The-Thickness” depth pattern. In this pattern, the binding warp yarns link all weft layers, therefore it has higher crimp percentage than stuffer warp yarns, which have straight path into fabric. This group of fabrics, which have two peaks on the tensile graph were denoted as Group 3.
If the difference between maximum and minimum crimp percentages of warp yarns is comprised between 1 and 1.5%, two peaks, which are close to each other, is seen in the tensile test graph. This breaking behaviour was observed in warp direction of O-T 5-4 4 {Twill 1 × 5} and its load- strain graph is shown in Figure 10(c). This fabric was denoted as Group 4.
Breaking load values, which were normalized to the specimen width, of 3DWICF in warp direction are shown in Figure 11. Fabrics without stuffer yarn (Group 2) have almost similar breaking load values in warp direction. On the other hand, fabrics with stuffer yarn have different load values because of the variation in the crimp percentage of binding and stuffer warp yarns as a result of the binding yarn depth pattern. Fabrics belong to Group 1, which has one peak on tensile graph, show high breaking load as the fibre strain is similar and their strength is accumulated. Whereas, fabrics belong to Group 3 and 4, shows low breaking load, as the fibre strain of the two warp set is dissimilar owing to the difference in their length inside the fabric. Thus, the strength of the two warp yarn sets (stuffer and binding) is not accumulated. In addition, breaking load values within the same class of tensile behaviour were diversified also by the weave pattern of 3DWICF that produce a variation in crimp percentage of warp yarns and inter-yarn cohesion. Therefore, even though A-L 3-2 4 {Twill 1 × 3} and A-L 5-3 4 {Twill 1 × 5} have the same 3D architecture (A-L), they have different breaking load values. The same phenomenon was observed in O-T structures.
3D warp interlock carbon fabrics’ breaking load values in warp direction.
The relationship between the breaking behaviour and crimp percentages of yarn groups are highlighted in Figure 12. The breaking load values of fabrics were associated with the crimp percentage of warp yarns represented by box plot, which indicate the minimum, maximum and average values. It can be clearly seen in the graph that high breaking load is associated with low variation in crimp percentage and leading to occur one peak on tensile graph. In contrary, when the difference between minimum and maximum crimp percentage is higher than 1.5%, second peak is obtained on the tensile graph which has low breaking load.

Breaking loads and yarn crimp percentages of 3D warp interlock carbon fabrics in warp direction.
Tensile behaviour of 3DWICF in weft direction were analysed also and shown in Figure 13. Like the conducted analysis for the fabric tensile behaviour in warp direction, the fabric tensile behaviour in weft direction can be analysed in the light of the crimp percentage of weft yarns. While one peak was observed on load- strain graphs for fabrics with stuffer warp yarn, three different tensile behaviours were obtained for fabrics without stuffer warp yarn. The fabrics without stuffer yarn include twice number of binding warp yarns than the fabrics with stuffer warp yarn. So, the contact between binding warp and weft yarns are raised and weft yarn’s crimp percentage is increased. Furthermore, the fabrics of this group, which were manufactured with O-L 3D architecture, is characterized by higher warp-weft yarn contact at middle layer in comparison with the two outer layers. Hence crimp percentages vary within the fabric with respect to weft yarn location.

The load–strain graphs of 3D warp interlock carbon fabrics in weft direction.
Fabrics with stuffer yarn are characterized with one peak because a difference between maximum and minimum is less than 1%. This fabric group was denoted as Group-a, Figure 13(a). Both fabrics, O-L 5-2 3 {Basket 3 × 3} and O-L 5-2 3 {Twill 1 × 5}, in the fabric group without stuffer yarn also showed one peak. They were classed in a group denoted as Group-b, Figure 13(a).
Two separate peaks were observed on load-strain graph of O-L 3-2 3 {Twill 3 × 3} because the difference between maximum and minimum crimp percentage of weft yarns is higher than 1.5%. This fabric was assigned to another class, which was denoted as Group-c, Figure 13(b). As the difference between maximum and minimum crimp percentage of weft yarn groups is slightly higher than 1%, two peaks, which are close to each other, appeared on the load- strain graph of O-L 5-2 3 {Satin 6}. This fabric was assigned to another class also as Group-d, Figure 13(c).
Breaking load values of 3DWICF in weft direction are shown in Figure 14. The four fabric groups (a, b, c and d) are mentioned on the graph. Although the depth of binding warp yarn (layer- to- layer (L) or through- the- thickness (T)) strongly affects the breaking load value of 3DWICF in warp direction, it does not have statistically meaningful effect in weft direction.
Breaking load values of 3D warp interlock carbon fabrics in weft direction.
On the contrary, within Group-a it can be observed that the angle of binding warp yarn (angle (A) or orthogonal (O)) is a significant parameter to affect breaking load values of fabrics in weft direction. A-T 5-4 4 {Twill 1 × 5} has higher breaking load value than O-T 5-4 4 {Twill 1 × 5}. The same phenomenon was observed between A-L 3-2 4 {Twill 1 × 3} and O-L 3-2 4 {Twill 1 × 3}. Consequently, the 3D warp interlock fabrics in which the binding warp yarn have ‘angle interlock’ evolution have higher breaking load values than ‘orthogonal’ fabrics in weft direction if the weave pattern and depth of binding warp yarn are the same.
In addition, the weave pattern is another significant parameter to characterize breaking load values of 3DWICF in weft direction. For example, O-L 3-2 3 {Basket 3 × 3} and O-L 3-2 3 {Twill 3 × 3} have distinct breaking behaviours and load values to each other. Also, O-T structures, which have different weave patterns, have various breaking load values in weft direction.
Correlation between breaking loads and crimp percentage of fabrics in weft direction is demonstrated in the Figure 15. Crimp percentages of weft yarns in each fabric are presented by a box plot, which indicate maximum, minimum and average values. It can be seen obviously that larger crimp variation between weft yarns leads to decrease the breaking load because the fibre strain is not the same for all weft yarns at each instance of the tensile test.
Breaking loads and yarn crimp percentages of 3D warp interlock carbon fabrics in weft direction.
The results of breaking energies
The carbon yarn breaking energy was calculated as 545.26 mJoules. Breaking energies and coefficients of fabrics in warp direction are shown in Figure 16.
3D warp interlock carbon fabrics’ breaking energies and coefficients in warp direction.
It can be seen on the graph that breaking energy and coefficient values have a similar trend. Breaking energies of fabrics in warp direction were mainly impacted by the depth of binding warp yarn. Fabrics in which the binding warp yarn has through- the- thickness (T) yarn path (group 3 and 4) have higher energy values than fabrics in which the binding warp yarn has layer- to- layer (L) evolution (group 1). While the binding warp yarn links several weft yarn layers in A-L and O-L fabrics in terms of its structural design, all weft yarn layers are linked by the binding warp yarn in A-T and O-T fabrics. Therefore, A-T and O-T fabrics have more tight structure than A-L and O-L fabrics. Because of the higher cohesion between yarns, more breaking energy is needed to break fabrics in warp direction.
Breaking energies and coefficients in weft direction are shown in Figure 17. Angle and depth parameters of binding warp yarn could not create statistically meaningful differences between obtained values. However, the weave pattern is a significant parameter to differentiate fabrics in term of breaking energy in weft direction because the inter-yarn cohesion changes with weave pattern.
Breaking energies and coefficients of 3D warp interlock carbon fabrics in weft direction.
A remarkable point in both graphs is that breaking coefficients have higher values than 1. That indicates the considerable effect of inter-yarn cohesion, which is closely related with the fabric architecture, on the tensile response of fabric and it is significant as much as tensile properties of the yarn material.
Results of bending test
Bending rigidities of 3DWICF in warp and weft directions are presented in the Figure 18. Bending behaviours of fabrics were observed to differ for fabric directions in terms of fabric architecture. Fabrics, in which the binding warp yarn has layer-to-layer evolution (A-L and O-L), have mostly higher bending rigidity values in warp direction than in weft direction. Moreover, bending behaviour of fabrics, in which the binding warp yarn has through-the-thickness evolution (A-T and O-T), is deeply affected by the weave pattern. While O-T 3-4 4 {Basket 3x3} has equal rigidity values in both directions, O-T 5-4 4 {Twill 1 × 5} and O-T 3-4 4 {Twill 3 × 3} have opposite bending behaviours with respect to warp and weft directions.
Bending rigidities of 3D warp interlock carbon fabrics in warp and weft directions.
As the binding warp yarn link all weft yarn layers in A-T and O-T fabrics, weft yarns are more compressed than A-L and O-L fabrics. Because of the compression forces, the movement of weft yarn within the fabric is prevented by its neighbouring yarns. Consequently, A-T and O-T fabrics have higher bending rigidity values than A-L and O-L fabrics in weft direction.
Bending behaviours in warp direction are also influenced by the angle of binding warp yarn. Orthogonal (O) fabric has higher bending rigidity than angle interlock (A) fabric for the same weave pattern and depth of binding warp yarn. Additionally, the step of binding warp yarn is another significant parameter to influence bending behaviour of fabric in warp direction. When the step is increased, number of weft yarns that are in contact with binding warp yarn is raised. Because of larger contact surface area with weft yarns, inter- yarn friction forces are increased and finally the bending rigidity of binding warp yarn is improved.
Results of bias extension test
Machine load-shear angle graphs of fabrics are shown in Figure 19. Fabrics without stuffer warp yarn (green) show higher shearing rigidity than fabrics with stuffer warp yarn (blue). As all warp yarns are binding, fabrics without stuffer yarns involve higher interlacement (number of contact) between warp and weft yarns. The inter-yarn friction by rotating at crossover point is the main factor to characterize the shear behaviour of a fabric. Fabrics without stuffer warp yarn include two times higher number of binding warp yarns than fabrics with stuffer warp yarn. Because of higher number of binding warp yarn and crossover points, frictions between yarns are raised and consequently fabrics without stuffer warp yarn have more rigid shear behaviour than fabrics with stuffer warp yarn. Further, as it was mentioned in section 3.1 that weft columns in the fabrics with stuffer yarn have more space (less columns density) because the number of weft layers was raised to 4 with the same weft insertion density. Thus, less shearing rigidity can be expected for fabrics, for the relative yarn rotation becomes easier by increasing the gap between yarns.

Shear load–shear angle graphs of fabrics.
At the same time, the depth of binding warp yarn is another significant parameter to affect the shear behaviour of 3DWICF. Fabrics in which the binding warp yarn has through- the- thickness evolution (dark blue) have higher shear rigidity than fabrics in which the binding warp yarn has layer-to-layer evolution (light blue). Because of their tight structure, the friction between yarns are higher in A-T and O-T fabrics. Hence, they have higher shear rigidity in bias extension test.
Locking angle value is the beginning point of occurring of possible wrinkle in the formability test. Locking angle values of fabrics are presented in the Figure 20. O-T 5-4 4 {Twill 1 × 5} has highest locking angle value among all fabrics. It was detected that the weave pattern is a significant parameter to affect locking angle value. Fabrics which have ‘Basket 3 × 3’ weave pattern have lowest locking angle values in both fabric groups. It can be concluded that O-T fabrics have higher locking angle values than other fabrics if the proper weave pattern is chosen such as ‘Twill 1 × 5’ or ‘Twill 3 × 3 Herringbone’.
Locking angle values of 3D warp interlock carbon fabrics.
Maximum formability load values
Maximum formability load values of 3D warp interlock carbon fabrics are presented in the Figure 21. Formability load values of fabrics are mainly characterized by the depth of binding warp yarn. Fabrics in which the binding warp yarn has through-the-thickness evolution (T) have higher load values than fabrics in which the binding warp yarn has layer-to-layer evolution (L). In addition, the angle of binding warp yarn is another significant parameter to affect formability load value of fabric. Orthogonal (O) fabrics have higher formability load values than angle interlock (A) fabrics if the weave pattern and depth of binding warp yarn parameters are kept the same. Consequently, O-T fabrics have highest load values among all produced fabrics.
Maximum formability load values of 3D warp interlock carbon fabrics.
The draw-in distances analysis
Maximum draw-in distances values of 3DWICF in warp and weft directions are shown in Figure 22. According to Labanieh et al. [78], the draw- in value is highly related with punch dimensions. Moreover, the fabric tension is a significant factor to affect draw- in distances values.
Maximum draw-in distances of 3D warp interlock carbon fabrics.
As the hemi- spherical punch was used in the test, the deformation was applied to the fabric symmetrically along the warp and weft directions. When the fabric is deformed by the punch in the formability test, friction forces between fabric and plate are increased and yarns are forced to recover their waviness because of this in-plane tension. After friction forces are overcame by the punch force, the withdrawal has begun on fabric edges. The draw-in distances values are diversified with respect to fabric architecture.
Fabrics have lower maximum draw-in distances values in warp direction than in weft direction due to their higher yarn crimp percentages in warp direction. Nevertheless, A-L 3-2 4 {Twill 1 × 3} and O-L 3-2 4 {Twill 1 × 3} have opposite behaviour because their yarn groups mostly have higher crimp percentages in weft direction.
The stuffer warp yarn has the straight path into the fabric as the weft yarn has. Fabrics with stuffer warp yarn have more balanced behaviour as regards its draw- in values in both fabric directions than fabrics without stuffer warp yarn.
The weave pattern is another significant parameter to characterize the maximum draw-in values of 3DWICF. As the weave pattern affects surface properties of 3D warp interlock fabric, the contact area and friction forces between fabric and machine’ s plates in formability test are influenced. For example, although A-L 3-2 4 {Twill 1 × 3} and A-L 5-3 4 {Twill 1 × 5} have the same 3D architecture (A-L), they have opposite behaviour at fabrics directions about their maximum draw- in values.
The local shear angle analysis
Quadrant of each fabric was divided into sub-regions and their local shear angle values were determined to analyse the forming behaviour of fabrics. After the shear angle measurement was carried out on fabrics, four deformation areas were identified considering the shear angle ranges as indicated in the Table 4. Every sub-region was marked with different colours in terms of their shear angle values. Therefore, different formability behaviours of fabrics could be distinguished to each other.
Deformation areas on fabrics and their colours.

After all manufactured fabrics were analysed, two distinct formability behaviours were detected with respect to the distribution of deformation areas on the fabric. These two types of formability behaviours are schematically shown as type I and type II in the Figure 23.
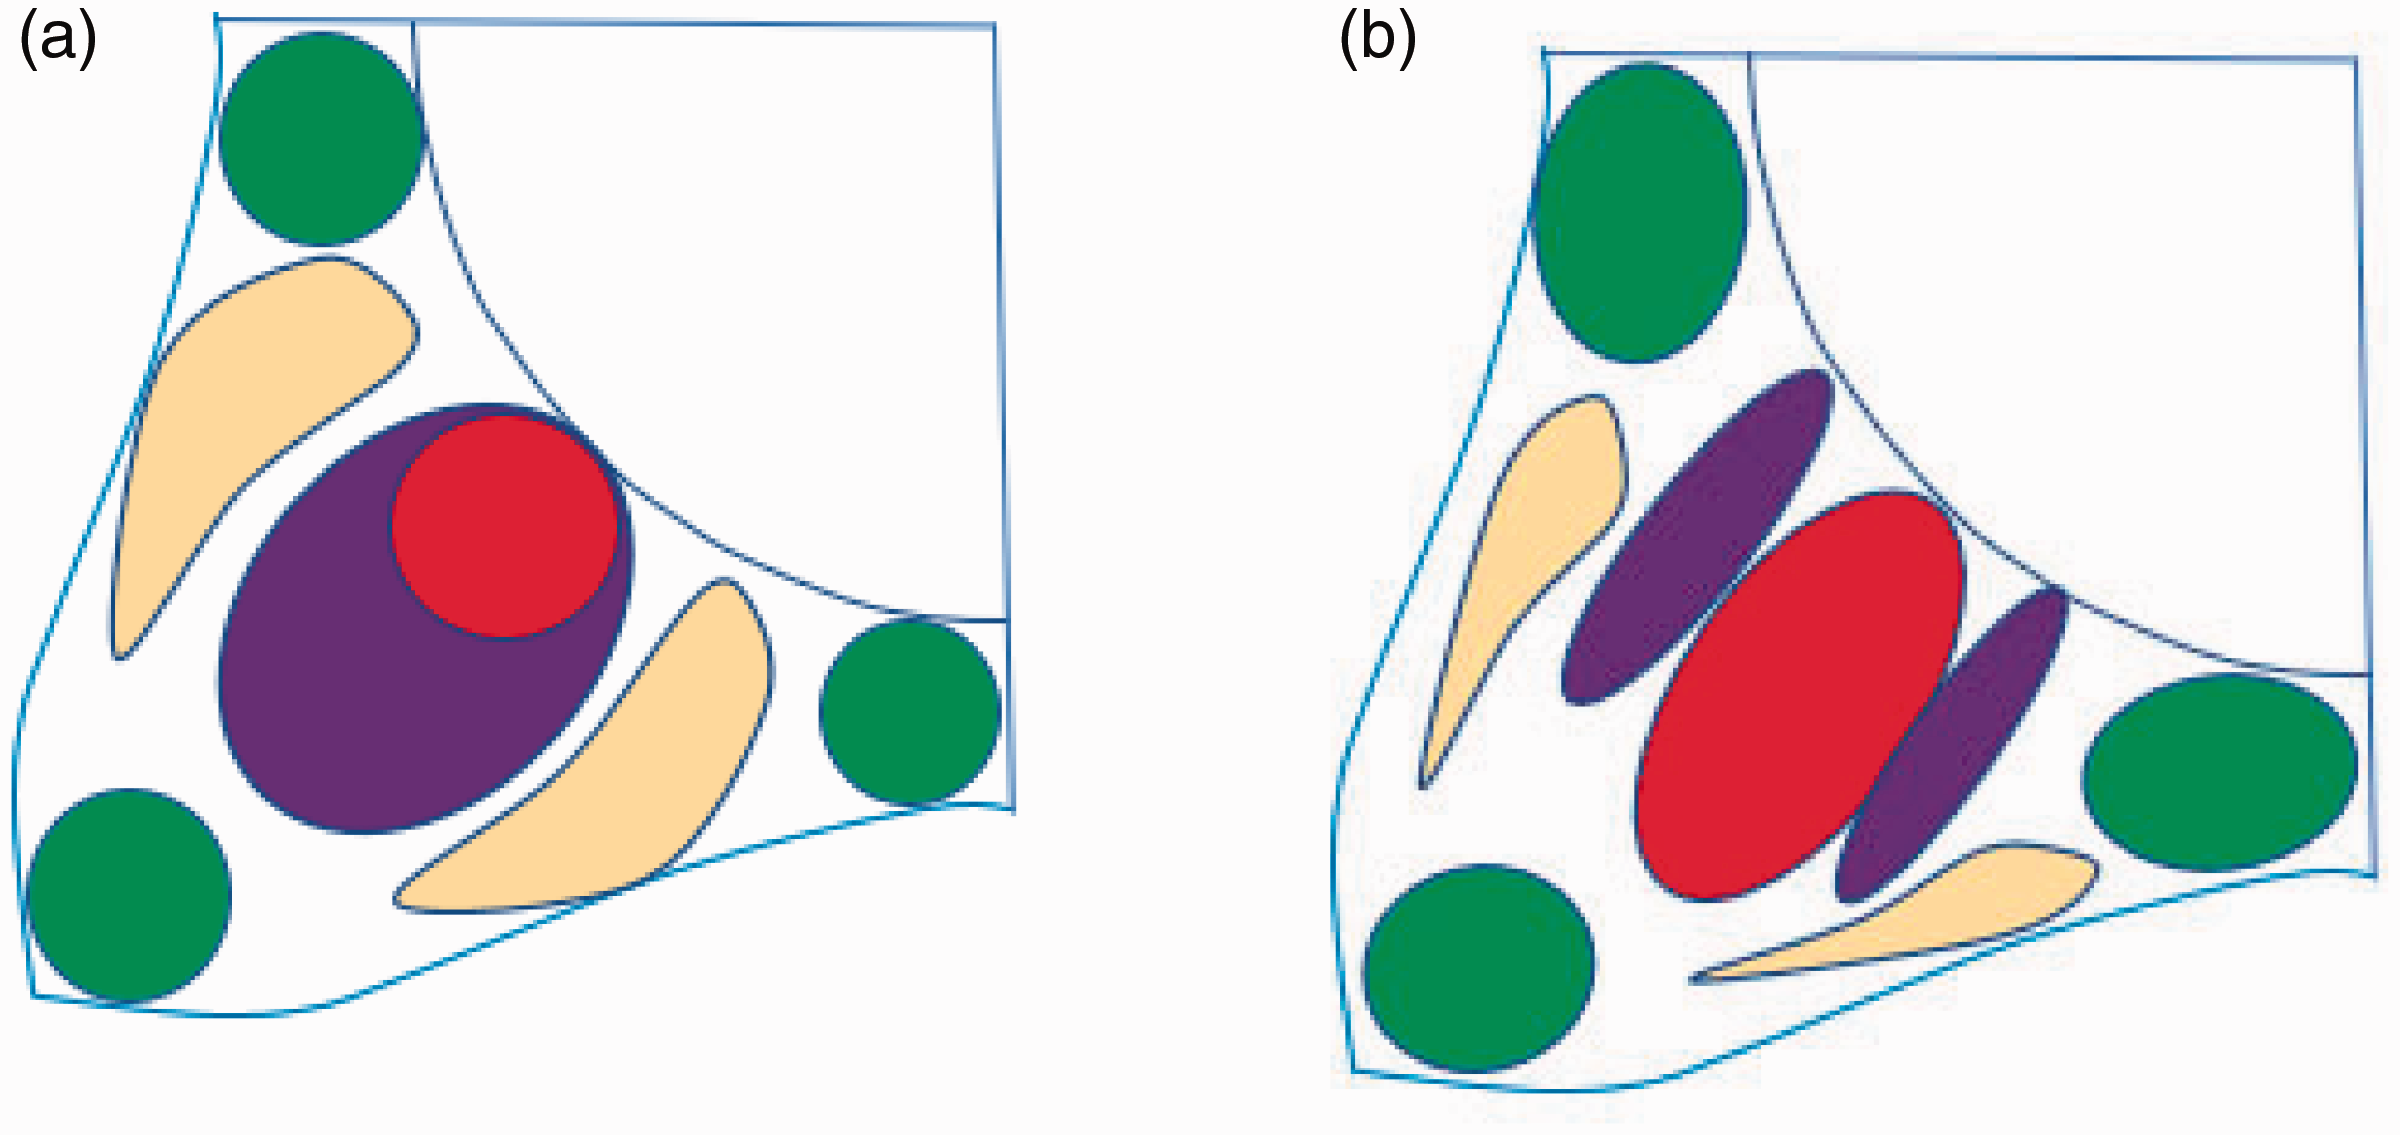
Different formability behaviours of 3DWICF. (a) Type I and (b) Type II.
Fabrics with stuffer warp yarn have formability behaviour that is schematically shown with the type I in the Figure 23(a). While edges of fabrics are slightly deformed (green areas), local shear angle values of sub-regions are increased diagonally toward the midpoints of fabrics. Highest shear angle values (red areas) are obtained near to punch section.
Fabrics without stuffer warp yarn have the formability behaviour that is schematically represented by type II of Figure 23(b). Shear angle values of sub- regions are raised from edges to midpoint of fabric the same as the type I. However, type II has bigger red area than type I. In addition, type I is more symmetrically deformed along warp and weft directions than type II. Local shear angle values of O-T 3-4 4 {Twill 3 × 3} and O-L 3-2 3 {Twill 3 × 3} are shown in Figure 24. While O-T 3-4 4 {Twill 3 × 3} is represented by type I formability behaviour, O-L 3-2 3 {Twill 3 × 3} is represented by type II.

Local shear angle values of fabrics. (a) O-T 3-4 4 {Twill 3 × 3} (b) O-L 3-2 3 {Twill 3 × 3}.
As formability behaviours of fabrics could be compared to each other, proportion of each sheared zones, which were defined in Table 4, were determined. The proportions were calculated by dividing the number of each sheared zone sub-regions by the total number of sub-regions of deformed quarter. Results of fabrics with stuffer warp yarn are shown in Figure 25 with pie charts. The same colours were used in pie charts that were defined in Table 4.

Proportions of deformation areas of 3D warp interlock carbon fabrics with stuffer warp yarn.
The highest shear angle value of a sub-region was detected as 43° in A-T 5-4 4 {Twill 1 × 5} among fabrics with stuffer warp yarn. Wrinkles were not observed in the formability tests of 3DWICF. However, the red and purple areas are considered as the most deformed areas of fabric where is more likely to observe defects after the forming process. The smallest red area was obtained in A-T 5-4 4 {Twill 1 × 5}, O-T 5-4 4 {Twill 1 × 5} and A-L 5-3 4 {Twill 1 × 5} fabrics with 4% of the fabric quarter area. In addition, fabrics were evaluated about their total most deformed areas (red and purple) to compare fabrics with each other. O-T 3-4 4 {Twill 3 × 3 Herringbone}, O-T 5-4 4 {Twill 1 × 5} and A-L 5-3 4 {Twill 1 × 5} have minimal total red and purple areas with 30% of the deformed quarter area.
The highest shear angle value of a sub- region was found as 47° in O-L 3-2 3 {Basket 3 × 3} among fabrics without stuffer warp yarn. Proportions of deformation areas of fabrics without stuffer warp yarn are shown with pie charts in Figure 26. The red area is larger in fabrics without stuffer warp yarns than fabrics with stuffer warp yarns. Also, all testing results of produced fabrics are presented in the Table 5.

Proportions of deformation areas of fabrics without stuffer warp yarns.
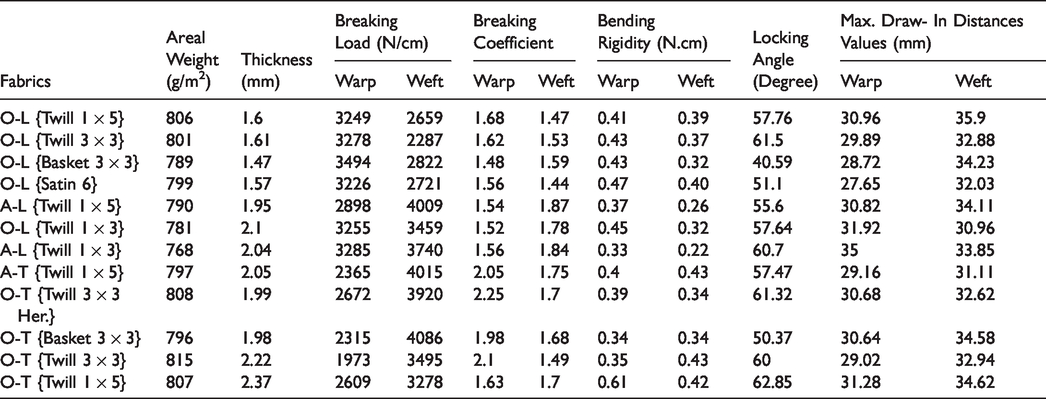
Testing results of 3DWICF.
Discussion
Locking angles, formability loads, draw-in distances and local shear angle values were deeply analysed to understand the complex forming behaviours of 3DWICF with respect to the fabric architecture. Two distinct forming behaviours of 3DWICF were detected and they were associated with the number of binding warp yarns.
When the number of binding warp yarns are increased in the 3DWICF, the difference between draw- in distances at fabric directions is grown and most deformed areas are expanded in the forming process. As a result, the forming behaviour of 3DWICF is worsen. On the grounds that the stuffer warp yarns have straight form same as the weft yarns, the fabric has more balanced behaviour if the number of stuffer warp yarns are increased in the fabric.
At the same time, the forming behaviour of 3DWICF was examined according to the weave pattern and the parameters of binding warp yarns. If the depth parameter of binding warp yarn is increased in the fabric, the draw- in distance of 3DWICF at warp direction is reduced and the formability load is raised. The breaking energy and formability load values are shown with graphs in Figure 27. Fabrics in which the binding warp yarn has through-the-thickness evolution (A-T and O-T) have higher formability load values and breaking energy coefficients in warp direction than fabrics in which the binding warp yarn has layer-to-layer evolution (A-L and O-L). Although the breaking energy results are related to the in- plane behaviour of the fabric, formability results are relevant with the out of plane behaviour. However, similar trend was observed in both deformation graphs. Because of the higher cohesion between yarns, more breaking energy and formability load are needed to deform A-T and O-T fabrics. It was proven that path of binding warp yarn into the fabric profoundly affect in- plane and out of plane properties of 3DWICF.

The breaking energy and formability load values of fabrics.
Furthermore, the weave pattern was determined as another significant factor to characterize the formability behaviour of 3DWICF. The friction, which is between fabric and plates, is affected by the weave pattern in the formability test by reason of the surface properties of 3DWICF are strongly influenced by the weave pattern. It was detected that while the fabrics, which have minimum red and smallest most deformed areas in the local shear angle analysis, have ‘Twill 1 × 5’ weave pattern, the fabric, which has largest most deformed areas, has ‘Basket 3 × 3’ weave pattern in the fabric group with stuffer warp yarn. After all analysis were carried out, O-T 5-4 4 {Twill 1 × 5} was selected as optimal structure among all produced fabrics.
In addition, the results were supported by the locking angle analysis. The fabrics, which have lowest locking angle values into their groups, have ‘Basket 3 × 3’ weave pattern. O-T 5-4 4 {Twill 1 × 5} has the highest locking angle value as it can be seen in the Figure 28. This means that, it is the most capable fabric for forming process to do not observe possible defects.

The locking angle values of fabrics.
Conclusion
The mechanical and formability properties of 3DWICF were comprehensively analysed for complex shape of composite material. Fabrics were produced on the prototype weaving loom with the same carbon yarn (6k, 400 Tex) in both fabric directions and yarn densities were settled as equal to each other.
First, two separate fabric groups were manufactured according to the presence of stuffer warp yarns into the 3DWICF. Therefore, the effect of number of binding warp yarns on the mechanical and formability properties of 3DWICF could be analysed. When the number of binding warp yarns are increased into the fabric, the areal weight value is raised by means of its higher crimp percentage than stuffer warp yarn. Three distinct tensile behaviours were determined and they were correlated to crimp percentages of yarn groups. According to the difference of maximum and minimum crimp percentages of yarn groups, the load-strain curves of 3DWICF have revealed one peak, two separate peaks or two peaks, which are close to each other. The number of binding warp yarns into the fabric is closely related with the total number of crossing points in the fabric. If the number of binding warp yarn is raised, the total crossing points between warp and weft yarns are increased. So, the weft yarns gain the crimp and has lower breaking load values. However, the weft yarn density and the friction between yarns are raised due to the higher number of crossing points. Consequently, the 3DWICF have more rigid shear and bending behaviours. Additionally, the number of binding warp yarns has the remarkable effect on the formability behaviour of 3DWICF. Two different forming behaviours of 3DWICF were detected with respect to the number of binding warp yarns.
At the same time, 3DWICF were differentiated according to the weave pattern and parameters of binding warp yarn that are angle and depth. When the depth parameter of binding warp yarn is increased in the fabric, the higher number of weft yarn layers are bonded to each other. The contact surface between yarns are raised and inter- yarn cohesion is grown. Hence, the fabric has more compact form. As a result, the areal weight is increased and bending and shear behaviour become more rigid for 3DWICF. Also, the depth parameter profoundly impresses the formability of fabrics in terms of draw- in distances and formability load values.
The angle parameter of binding warp yarn has secondary importance on the mechanical and formability properties of 3DWICF in comparison with the depth parameter. If the ‘angle interlock’ structure is chosen instead of the ‘orthogonal’ and other structural properties are kept same, the areal weigh is reduced, the breaking load in weft direction is improved and bending rigidity in warp direction is decreased in the fabric.
While the weave pattern is a complementary parameter for mechanical properties and characterize them with other parameters, it has remarkable effect on the formability behaviour of 3DWICF. After the locking angle, the draw- in distance, the formability load and the local shear angle analysis were performed, O-T 5-4 4 {Twill 1 × 5} was identified as optimal structure for forming process.
As a consequence, every parameter of fabric architecture has its distinctive effect on the mechanical and formability properties. In the study, main parameters of fabric architecture were deeply analysed to choose optimal structure to produce complex shape of composite material with required properties.
In future works, composite materials reinforced with the studied 3DWICF will be produced and their mechanical properties will be investigated and compared to dry structures.
Footnotes
Acknowledgements
Authors would like to thank the Scientific and Technological Research Council of Turkey (TÜBİTAK) to have funded this research work with ‘2214- A Scholarship for PhD Students Program’. Authors also would like to thank the Gemtex laboratory/ENSAIT to supported the study with the raw material, prototype weaving machine and testing machines.
Declaration of conflicting interests
The author(s) declared no potential conflicts of interest with respect to the research, authorship, and/or publication of this article.
Funding
The author(s) disclosed receipt of the following financial support for the research, authorship, and/or publication of this article: Scientific and Technological Research Council of Turkey (TÜBİTAK) funded this research work with ‘2214- A Scholarship for PhD Students Program’.