
Abstract
Vacuum resin infusion (VRI) is a promising technique for manufacturing complicated structural laminates. This high viscosity of nanofilled resin increases the filling time and leads to an incomplete mold filling. The mold filling time can be reduced either by making the fiber dimensions smaller than the mold (gaps around the fibers) or by adding ethanol to nanofilled epoxy. However, ethanol addition influences the mechanical properties of composite laminates. In this study, different amounts of ethanol (0.5 wt. % and 1 wt. %) were used as a diluent to both neat epoxy and epoxy filled with (0.25 wt. %) of titanium dioxide (TiO2) nanoparticles. From results, it was found that ethanol addition saves the time for neat and nanofilled epoxy by 47.1% and 24.1%, respectively. It was found that adding 0.5 wt. % of ethanol to 0.25wt. % of TiO2 nanoparticles (GT0.25E0.5) enhances the tensile and flexural strength by 30.8% and 55.9%, respectively compared with neat specimens. Furthermore, the tensile and flexural moduli increased by 62% and 72.3%, respectively. Furthermore, the mold filling time was investigated experimentally and validated numerically using ANSYS FLUENT software. The mold filling time prediction using ANSYS FLUENT can be used to avoid resin gelation before the incomplete mold filling and thus can be considered a cost-effective methodology. The results showed that the gaps around the fibers reduce the time by 178% without affecting the mechanical properties.
Introduction
Polymeric composites are used in the aerospace and marine due to its good characteristics and lightweight. Liquid composite molding technology (LCM) can fabricate highly complex composite laminates with better control of properties such as the tensile and flexural strength, hardness, and wear and corrosion resistance [1]. The LCM technologies involve processes used to manufacture composite laminates by infusion of a thermoset resin in a closed mold. Vacuum resin infusion (VRI) is a LCM process in which the mold cavity is sealed by a vacuum bag and the polymer is forced into the mold by a vacuum pump [2]. Many parameters in the VRI process influences directly the filling time, the successful and complete impregnation of the composite laminate by the resin as the shape and locations of the inlet gates, and outlet vents of the mold [3]. Besides, resin viscosity is a key factor in any of the LCM processes that should be optimum to adequately wet the preform with a minimum bleed out [4].
The vacuum resin infusion (VRI) process can be used for the manufacturing of large composite laminates due to its low cost and high accuracy [5]. It has a lot of advantages compared with the hand layup technique (HLT). VRI process is a cost-effective technique for the manufacturing of large-scale composites laminates [6,7]. Also, it enhances the ratio of fiber-to-resin greatly and gives high mechanical properties composites. However, there are some drawbacks to the VRI technique. These drawbacks include thickness variation of the composite laminate owing to the non-uniform compaction pressure, limited ability to get different fiber content [8,9]. Also, the processing time for very large laminates is very long owing to the limited vacuum pressure [10]. Moreover, it is essential to allow some of the resin to bleed through the outlet vent, which causes resin wastage and longer filling time [11]. In extreme cases, resin gelation may occur before the mold is filled.
Polymeric nanocomposites can be used in electrical applications owing to its dielectric properties [12,13]. Also, These nanocomposites can be used in biomedical applications [14]. Moreover, these nanocomposites can be used in the aerospace industry due to its high impact resistance and flexural properties [15]. Besides, these nanocomposites can be used in aerospace, automotive, electronics, and biotechnology [16]. Furthermore, substantial improvements in mechanical, and thermal properties can be achieved with nanocomposites while maintaining the same density to those of the neat resin [17]. Although the incorporation of nanoparticles enhances the laminate quality, it increases the viscosity and decreases the mold filling time. The manufacturing of polymeric nanocomposite laminates with the VRI technique is limited owing to the high viscosity of nanofilled polymer solution that hinders the easy flow of resin into the fibers material [18]. Kumar and Sundaram [4] found that the incorporation of Multi-walled carbon nanotube (MWCNT) to epoxy resin increased the resin viscosity and thus the mold filling time. Umer et al. [19] added different amounts of graphene oxide (GO) nanofillers to epoxy resin. It was found that the resin viscosity increased and resin gel time decreased by adding GO to neat epoxy resin. The liquidity of epoxy resin can be enhanced by solvent addition [20]. Gonçalves et al. [21] investigated the effect of ethanol and acetone on the bond strength between glass fiber and resin. It was found that untreated specimens had lower bond strength compared with all treated specimens. Teh et al. [22] Investigated the effect of ethanol addition on the mechanical properties of mineral silica/epoxy composites. It was found that the filler amount increased with the addition of ethanol. Wan Dalina et al. [23] Studied the influence of ethanol and Triton X-100 on the properties of multi-walled carbon nanotube (MWCNT) epoxy resin composites. It was found that (MWCNT) composites dispersed in ethanol possessed higher properties compared with neat composite laminates. In this study, TiO2 nanoparticle was used as it enhances the toughness of the polymer matrix without affecting the glass transition temperature [18]. Moreover, it can be added to polymers to produce electrical insulators [13] and smart composites [24]. Furthermore, Adding the optimum quantity of TiO2 nanoparticles increases the flexural strength significantly [25]. Also, ethanol was used as a diluent to reduce the viscosity of nanofilled epoxy and enhance the dispersion of TiO2 nanoparticles.
Many numerical models and simulations have been developed to predict mold filling in the resin transfer molding (RTM) process and the VRI process. Lam et al. [26] performed a numerical simulation to the RTM technique under isothermal and non-isothermal conditions. Um and Lee [27] simulated the mold filling of the RTM process by using the boundary element method(BEM). Also, Yoo and Lee [28] simulated the filling time during the RTM process with a heated die using the BEM. Simacek and Advani [29] used a numerical model to predict fiber tow saturation during the RTM technique. Gourichon et al. [30] developed a numerical procedure to predict the void content in LCM. Tan and Pillai [31] developed a multiscale approach to model the non-isothermal flow during LCM. Caglar et al. [32] used an explicit time-marching algorithm to evaluate the part thickness and resin pressure during the VRI process. Robinson and Kosmatka [33] investigated the post-filling stage of the VRI process through experimental studies and flow simulation. This study focused on thick laminates in which both flows through-thickness and in-plane are considered. Moreover, Wang et al. [34] used numerical modeling and 3D simulation to estimate the filling time and the shape of the flow front of different four kinds of injection methods. The results show that changes in preform permeability during filling and post-filling stages have the potential to influence the VRI process. Torres et al. [35] used CFD and FEA to minimize the inner flaws and manufacturing time of the LCM process. Zhao et al. [36] used mathematical modeling to investigate and analyze the void formation during the LCM process. Shevtsov et al. [37] developed a new approach for modeling the VRI process to predict the dry spots that occurred due to the manufacturing process. Sharifpur et al. [38] used ANSYS FLUENT 15 to simulate a multilayer infusion process by using two different approaches. It was found that the equivalent one layer approach is unsuitable simulate a combination of different layers of different permeability and porosity. Tuncol et al. [39] used FLUENT software to monitor the resin flow and infusion time of fiber metal laminate (FML) manufactured by the VRI technique. Yang et al. [40] used ANSYS FLUENT to simulate the macro flow of resin during the VRI process. Khattab and Sherif [41] used ANSYS FLUENT to predict the flow profiles, pressure distribution, and defects inside the VRI mold. Sharifpur and Meyer [42] used ANSYS FLUENT to find the best place for inlet and the number of required resin inlet for the VRI process.
In this study, ANSYS Fluent was used to investigate the influence of making the fiber dimensions smaller than the mold (gaps around the fibers) on the resin flow front positions and mold filling time of diluent and non-diluent neat and nanofilled composite laminates manufactured by the VRI process. It was found that these gaps reduce the filling time without affecting the mechanical properties. Also, in this study, the effect of ethanol on the mold filling time and mechanical properties of nanocomposite laminates was investigated. Studying the effect of gaps around the fibers and ethanol addition on the resin flow front positions and mold filling time of nanocomposite laminates using ANSYS Fluent hasn’t been studied yet.
Experimental work
Materials
The laminates were manufactured using an epoxy resin (Kemapoxy 150 RGL) which presented the matrix. Eight layers of woven E-glass fiber mats with 0.28 mm thickness were used as primary reinforcements. Titanium dioxide nanoparticles of 18 nm diameter were used as the secondary reinforcement. These nanoparticles were provided by US Research Nanomaterials, Inc.
Composite laminate fabrication
The VRI process consists of three stages: pre-infusion, infusion, and post-infusion [43]. In the pre-infusion stage, the wax was applied to the surface of the mold, then the mold was left to dry. Then, the fibers were laid to mold and the sealant tape was sealed using adhesive masking tape then applied to the boundaries of the mold to adhere to the vacuum bag. The resin was infused under vacuum using a vacuum pump (-27 inHg). As the mold was completely filled with epoxy, it was cured for 24 hrs. A digital camera was used to detect the flow front and time during the infusion stage. The vacuum resin infusion process for the manufacturing of glass fiber reinforced epoxy laminates was shown in Figure 1. Table 1 shows the specimens designation.
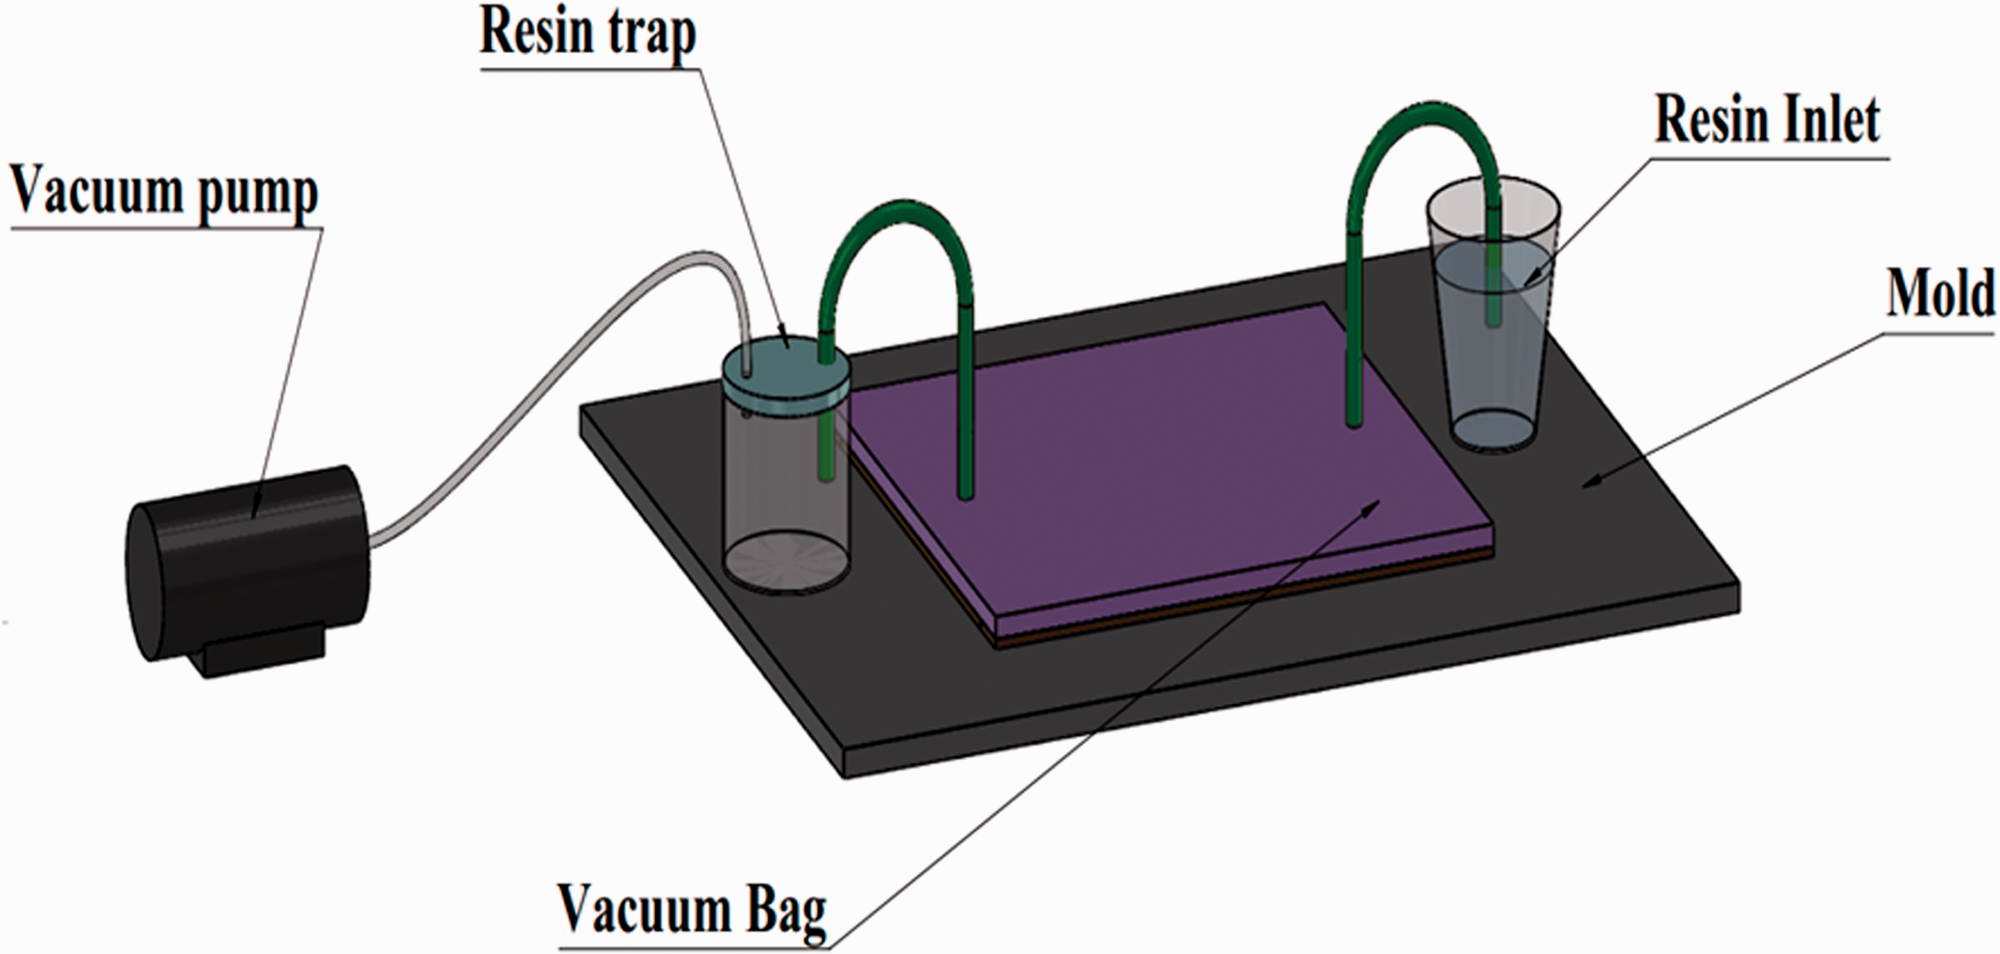
Schematic diagram of the vacuum resin infusion process.
The types of composite laminated specimens.

Nanocomposites fabrication
Titanium dioxide nanoparticles were dispersed into the epoxy matrix via the sonication process. Mixing was performed manually for 5 min to initially disperse TiO2 nanoparticles in epoxy matrix and beginning of wetting occurred then conducted with Hielscher ultrasonic processor UP 200 S (200 W, frequency 24 kHz). Sonication was performed with a pulse ratio of 0.5s on/0.5s off with an amplitude of 55% for 1 hr. Sonication for 1 hour was selected as recommended by Refs. [44,45]. This led to an enhancement in the mechanical properties of epoxy filled with silica, carbon, and alumina nanoparticles. To prevent resin degradation, the epoxy and TiO2 nanoparticles mixture were cooled by placing it in a bath of ice water during the sonication process [46]. Subsequently, the hardener was manually added to the mixture of epoxy and TiO2 nanoparticles with a ratio of 1:2 by weight of the epoxy resin. The mixture was then placed in a resin reservoir then infused into the mold by a vacuum pump. Epoxy and TiO2 nanoparticles mixture were sucked from the inlet and distributed to impregnate the layers of glass fibers. Different percentages (0.5 wt. % and 1 wt. %) of ethanol were added to this mixture. The required mixture was sucked and distributed to impregnate the layers of woven glass fibers mats. The impregnated composite laminate remained under vacuum until hardening occurred. Table 1 shows the types of non-diluent and diluent composite laminated specimens. The percentages of 0.5 wt.% ethanol was added to neat glass fiber/epoxy composites (GE0.5), glass fiber/epoxy composites filled with 0.25 wt.% TiO2 nanoparticles (GT0.25E0.5). Furthermore, the percentage of 1 wt.% ethanol was added to neat glass fiber/epoxy composites (GE1), glass fiber/epoxy composites filled with 0.25 wt.% TiO2 nanoparticles (GT0.25E1). Based on the mechanical properties results, the best amount of ethanol was chosen to give the maximum mechanical properties. From experimental results, adding 0.5 wt. % of ethanol to 0.25wt. % TiO2 nanoparticles gives the maximum mechanical properties compared with other manufactured laminates. So, the best amount of ethanol is 0.5 wt. % of ethanol.
Viscosity measurement
The resin viscosity was measured using a falling body viscometer. In our case, three different steel spheres with different radius were used. The tube was filled with resin and the steel spheres were allowed to drop under gravity. After the sphere has reached its constant velocity (
Mold filling simulation model
Using Computational Fluid Dynamics (CFD) to simulate the filling stage of the VRI process had a lot of benefits including recognizing the best place for resin suction and intake as well as the cycle time of the process [42]. In the present research, a flat plate with dimensions 420 mm x370 mm x3 mm was simulated by using ANSYS-FLUENT 19 commercial software for investigating the influence of making fiber dimensions smaller than the mold (gaps around the fibers) on the mold filling time and flow front positions for composite laminates manufactured by the VRI process.
Governing equations
The flow of resin was assumed to be laminar, incompressible, and transient flow, and E-glass fiber layers were defined as porous media. Therefore, impregnation of fiber preform by a resin can be modeled as flow through porous media which can be described by Darcy’s law.

Since there is a variation in preform thickness, the continuity equation for the resin can be expressed as follows

For simplification (4) can be simplified
By using (2) the general law of Darcy for the flow in VRI process can be expressed as
SIMPLE algorithm and finite volume method were used to solve the coupling between the velocity and pressure field. Because of the presence of both resin (liquid phase) and air in the computational domain, a multiphase model had to be employed. Thus, the volume of fluid (VOF) model had been considered the most appropriate model because of the presence of free interfacial between the two phases during simulation. The VOF model was developed by Hirt [48] used to model two or more immiscible fluid phases by solving a set of momentum equations and followed the volume fraction of each phase throughout the domain. This method depended on the idea of volume fraction function F that was defined as the integration of fluid’s characteristic function in a computational cell. If F=0, the computational cell was empty of the tracked fluid phase; when the tracked fluid completely filled the cell, F=1; and when the interface between the two phases cut the cell, 0 < F < 1. The VOF method had been extensively used in RTM and VRI mold filling simulation because of its simple calculation and accurate results. Devalve and Pitchumani [49] used the VOF method to track the interface between resin and air during the mold filling process. Oliveira et al. [50] used the VOF method to track the flow of resin during the RTM filling process. Yang et al. [51] applied the method of piecewise linear interface construction (PLIC-VOF) to track the resin flow front during the RTM process.
In the VOF method, the velocity field for any phase was obtained by solving a single set of momentum equations.

The interphasal interface between the resin and air was tracked by the solution of a transport equation for the volume fraction as
The physical properties of fluid 
For the flow in a porous media, the flow velocity must be volume averaged according to equation (3) and the drag term should be included according to Darcy’s law, therefore the momentum (4) was replaced by the following equation
The equations (5) and (6) can also be replaced in VRI process as

Mesh
Ansys meshing software was used to generate the mesh for this study using different element shapes and sizes according to the zone. In the central zone (resin) prism elements with high quality were used, while for the gaps around the resin, tetrahedral elements were used with a slightly lower quality. However, in all cases, the average element quality was above 0.8 and the minimum element quality was around 0.5 for tetrahedral elements. Mesh independence study was conducted to observe the effect of element size on the filling time of the resin. Maximum elements sizes of 3 mm, 2 mm, and 1 mm were used to simulate the same conditions, and they all yielded comparable results with an error of less than 5%. Therefore, an element size of 3 mm is chosen for this study as it is the most computationally cost-effective, which corresponds to a number of elements of 41,468. Table 2 illustrates the details of each grid used and the relative error of the filling time for each grid for the same case.
Details of the grid independence study based on filling time.

Computational domain and the boundary conditions
The computational domain is shown in Figure 2(a) and (b). In Figure 2(a) the dimensions of fibers are the same as the mold so, there are no gaps between the fibers and the mold. On the contrary, in Figure 2(b), the dimensions of fibers are smaller than the mold so, there are gaps between the fibers and the mold. To verify and demonstrate the influence of making the dimensions of fiber layers smaller than the mold (gaps around the fibers) on the filling time and flow patterns, two simulation cases are presented, one without these gaps as traditional VRI and the other with gaps.

The computational domain (a) without the gaps around the reinforcement preform, and (b) With the gaps around the reinforcement preform.
Boundary conditions
The boundary conditions for both cases are shown in Figure 3. Inlet and outlet surfaces are characterized by a prescribed pressure according to the values in the experiment. Walls of the domain were all set to a no-slip condition, in which values of velocity in all directions were set to zero. As for the interface between the free-flow zone and the porous media zone, it is resolved automatically by FLUENT to resolve the condition of Navier-Brinkman [52]. This condition ensures that shear stress and normal stress (pressure) of the fluid is equal on both sides of the interface.

Boundary conditions for the computational domain (a) with gaps, and (b) without gaps.
Studied cases
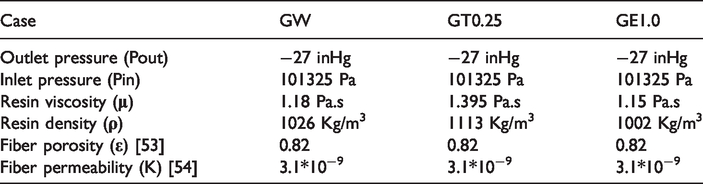
The mold filling parameters of the two simulation cases were presented in Table 3. Details about the inlet pressure, outlet pressure, viscosity, porosity and permeability of the fiber were presented.
Mold filling parameters.
Mechanical characterization
Tensile test
The tensile properties of the manufactured composite laminate were conducted according to ASTM D3039. The fabricated composite specimen was cut into a bar with dimensions of 250 × 25 × 3 mm3. The tensile properties were estimated using the curve of stress-strain obtained from the tension test.
Three-point flexural test
The flexural test was conducted by using a three-point flexural test according to ASTM standard D-790. Tensile and flexural tests were performed by using Jinan Test Machine WDW 100 KN universal testing machine.
Results and discussions
Processing time experimentally
Adding a diluent such as ethanol to epoxy resin decreases its viscosity, and consequently reduces the mold filling time. In mass production or producing large shapes, saving processing time is an important issue. The experimental filling time of neat and nanofilled woven (GW) composites is shown in Figure 4. It is obvious from this figure that the processing time of GW filled with 0.25 wt. % of TiO2 nanoparticles (GT0.25) is higher than neat GW. For neat GW, adding ethanol with 0.5 wt. % and 1 wt. % saves time for about 20% and 32%, respectively as compared to neat GW. For GW filled with 0.25 wt. % of TiO2 nanoparticles, adding ethanol with 0.5 wt. % and 1 wt. % saves time for about 10% and 24%, respectively as compared to GT0.25. Also, the time need for GT0.25 is greater than GW by 16%. This increase in processing time is due to the high viscosity of nanoepoxy.

Effect of ethanol addition on neat and nanofilled GW composites.
Processing time theoretically
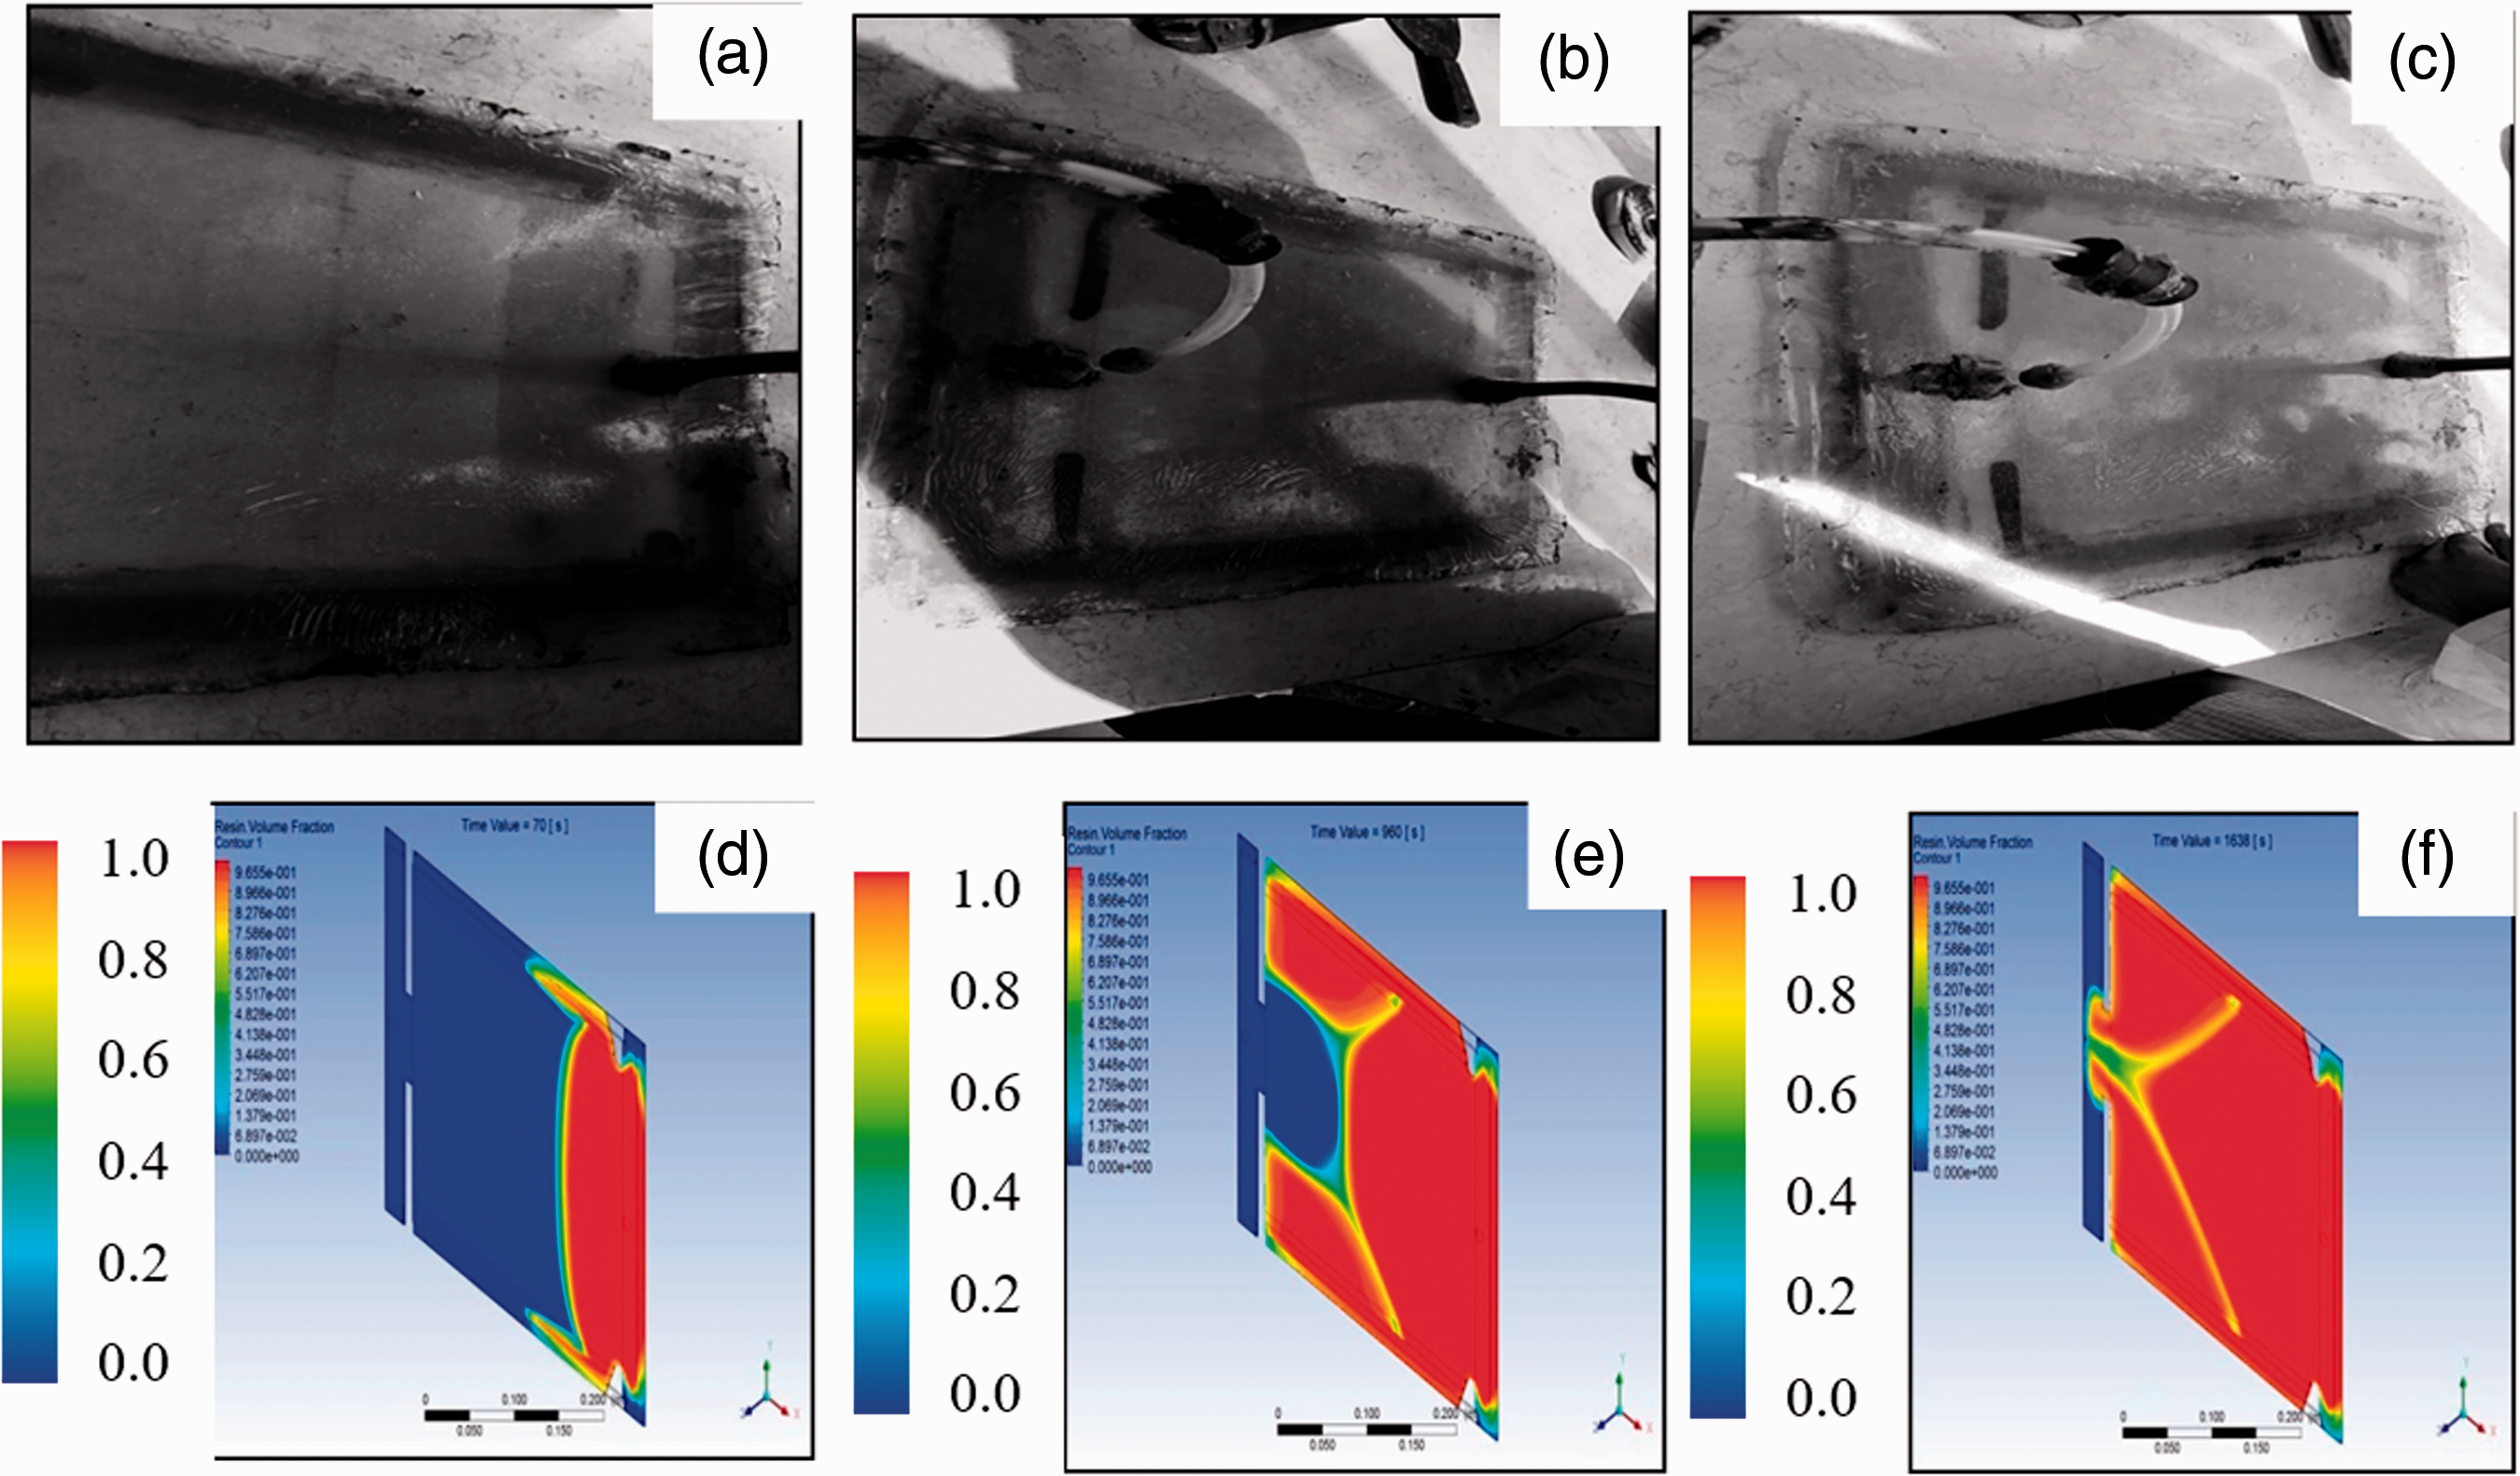
Figure 5 shows the resin flow front position and the time for the two computational domains (the first computational domain (a, b, and c) with gaps around the fibers and the second domain (d, e, and f) without gaps around the fibers) at different times. For the first computational domain (with gaps) the resin began to fill the gaps around the fiber rather than the fiber itself and thus because of the high permeability of air compared with the fiber permeability. On the contrary, for the second domain (without gaps) at the beginning the flow took the shape of a semi-circle until reach the boundary of the mold, then the flow became almost the same at all points. This shape of flow is similar to that of Porto et al. [55] and Tuncol et al. [39]. Also, from ANSYS FLUENT the time needed to complete filling of mold in case 1 (with gaps) is 1802 sec while the time needed for case 2 (without gaps) is 5014 sec that means there is a time saving about 178.25% from this result, it can be concluded that the gaps produced by (making the fiber dimensions smaller than the mold) can be used to reduce the mold filling time without affecting the mechanical properties.

Comparison according to resin volume fraction between the two computation domain, with gaps (a),(b) and (c) and without gaps (d),(e) and (f).
ANSYS FLUENT was used to predict the flow front position and the mold filling time of three different cases. These cases were studied to prove the feasibility of mold filling simulation using ANSYS FLUENT. Figure 6 shows the resin flow front position for both experimental (a, b, c) and simulation results (d, e, f) for GT0.25. It is clear from the figure that the flow front position of the simulation is almost the same as the experimental results. Moreover, the resin moves faster through the gaps than the fibers due to the high permeability of gaps. The time needed for complete filling of mold analytically is 1802 sec (30 min) whereas the time needed experimentally is 29 min. From this result, the error between experimental and simulation is 3.4% which validated our simulation.

Experimental flow front (a), (b) and (c) and simulation flow front (d), (e) and (f) for GT0.25.
Figure 7 shows the relationship between the filling time and the corresponding resin flow front position experimentally and theoretically for GT0.25. At the beginning of the VRI process, the time needed for the same flow front position for simulation is smaller than that for experimental results. However, at the end of the process, the time needed for experimental results is lower than that for simulation. This may be attributed to the high viscosity of nanofilled epoxy which makes the flow difficult through the fibers. Also, the resin begins to fill the gaps around the fiber rather than the fiber itself, and this made the flow front position slow at the beginning and faster at the end.

Comparison between experimental and simulation filling time for GT0.25.
Figure 8 shows that the resins flow front position for both experimental and simulation results for GE1.0. It is clear from the figure that the time of the flow front position of the simulation is almost the same as the experimental results. Also, the resin moves faster through the gaps around the fibers similar to GT0.25.However, for GE1.0, the amount of resin moved across the gaps is small compared with that for GT0.25 owing to the low viscosity of GE1.0. The time needed for complete filling of the mold analytically is 1030 sec (17.2 min) whereas the filling time needed experimentally is 17 min. From this result, the error between experimental and simulation was 1.2%.

Experimental flow front (a), (b) and (c) and simulation flow front (d), (e) and (f) for GE1.0.
Figure 9 shows the relationship between the filling time and the corresponding resin flow front position for GE1.0. This figure shows that at the beginning of the VRI process the flow front position for both simulation and experiments almost the same, after that the time needed for experimental results is higher than that for simulation. The time difference began to decrease at the end of the process. At the beginning of the VRI process, the resin moves across the fibers and the effect of gaps was neglected, this behavior has occurred owing to the low viscosity of GE1.0. However, in the middle of the VRI process in simulation analysis, the resin began to fill the gaps around the fiber rather than the fiber itself thus made the flow front position faster than the experimental setup.

Comparison between experimental and simulation filling time for GE1.0.
Figure 10 shows the relationship between the filling time and the corresponding resin flow front position for GW. This figure shows that at the beginning of the VRI process, the flow front position for both experimental and simulation results almost the same, after that the time needed for experimental results is higher than that for simulation ones. The time difference began to decrease at the end of the filling process. This may be attributed to that the flow of resin in both experimental and simulation results is close to each other at the beginning of the VRI process. However, in the middle of the VRI process for simulation, the resin begins to fill the gaps around the fiber rather than the fiber itself this made the flow front position faster than the experimental setup.
Experimental flow front (a), (b) and (c) and simulation flow front (d), (e) and (f) for GW.
Figure 11 shows the resin flow front position for both simulation and experimental results for GW. It is clear from the figure that the time of the flow front position of the simulation is almost the same as the experimental results. The time needed for complete filling of mold analytically is 1638 sec (27.3 min) whereas the time needed experimentally is 28 min. From this result, the error between experimental and simulation is 2.5% which validates our simulation.

Comparison between experimental and simulation filling time for GW.
From the mold filling simulation, the behavior of the resin flow is dependent on the additives to epoxy resin. The flow front position and the corresponding time for GW, GW filled with nano-filled and GW filled with ethanol can be predicted using ANSYS FLUENT.
Tensile and flexural properties
Figure 12(a) and (b) shows the stress-strain curve of diluent neat and nanofilled GW. Figure 12(a) shows the effect of ethanol percentages (0.5 wt. % and 1.0 wt. %) on the tensile properties of neat GW. It is clear from this figure that 0.5 wt. % of ethanol enhances the tensile strength and strain of GW owing to the good fiber impregnation. These results are similar to that of Salmoria et al. [56]. The influence of ethanol on the mechanical properties of casting epoxy resin was investigated. It was found that adding small percentage of ethanol increase the tensile properties of composites laminates. However, increasing the ethanol percentage (1 wt. %) reduced the tensile strength and strain compared with (0.5 wt. %) ethanol. This behavior can be attributed to the hindering of the cross-linking process with ethanol addition [57]. Figure 12(b) shows the effect of ethanol percentages (0.5 wt. % and 1.0 wt. %) on the tensile properties of nanofilled GW. It is clear from this figure that GT0.25 has the maximum tensile stress and strain compared with other specimens. This behavior has occurred due to the good dispersion and distribution of TiO2 nanoparticles into the epoxy matrix as shown in Figure 13. Also, it is clear from Figure 12(b) that ethanol addition decreased the tensile properties of nanofilled GW. This decrease in the tensile properties may be attributed to the poor adhesion between TiO2 nanoparticles and woven E-glass and the cross-linking hindering process.
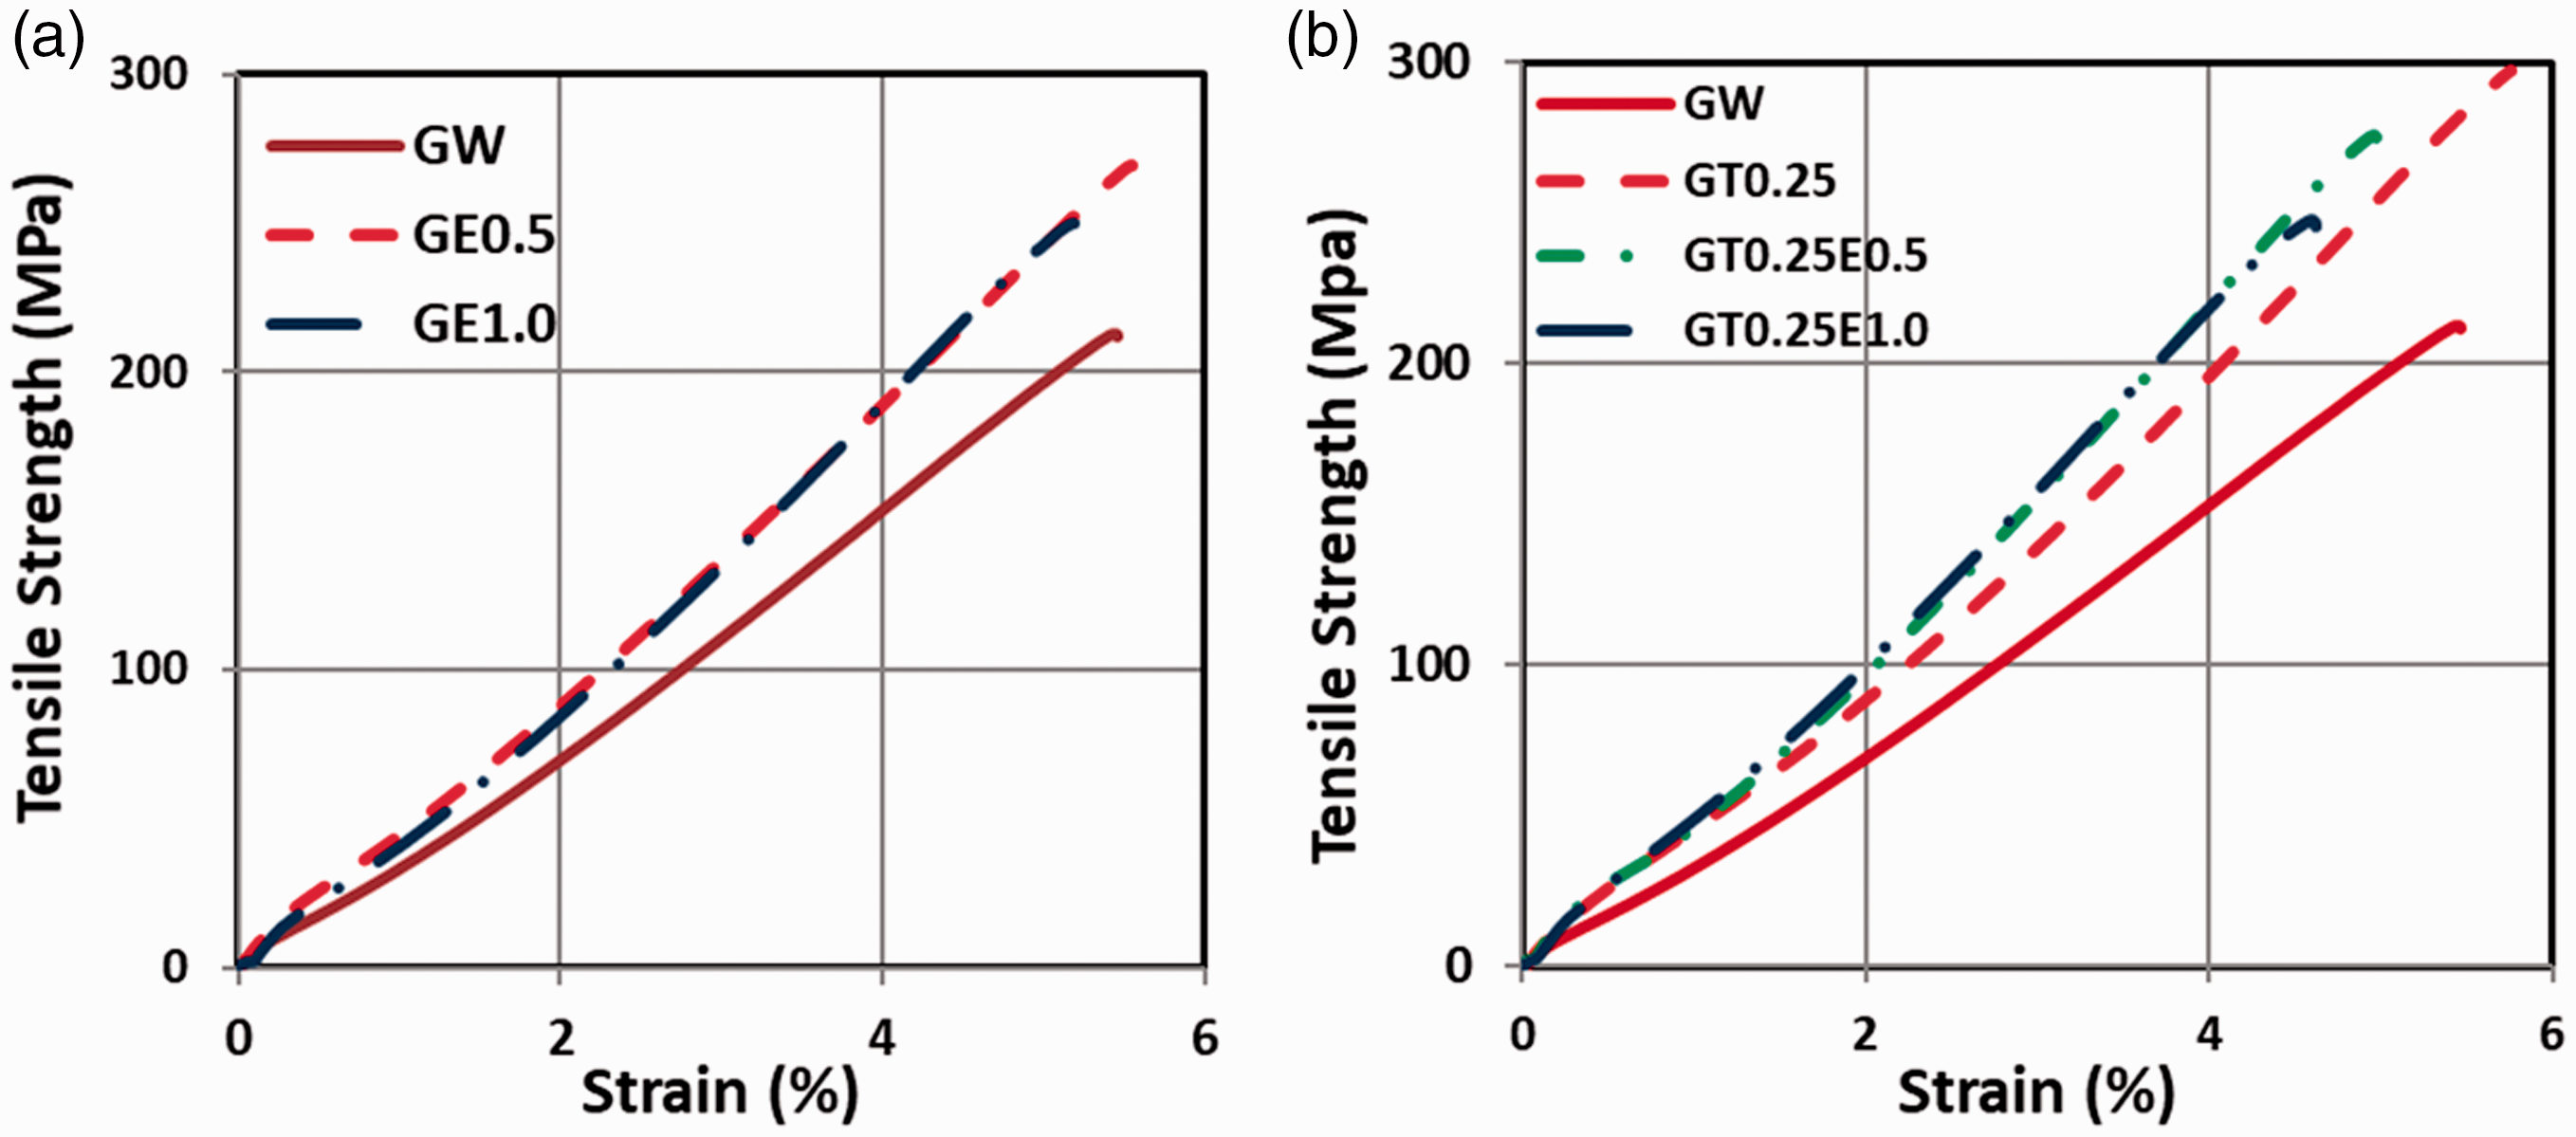
Effect of ethanol on the tensile stress-strain of (a) GW, (b) nanofilled GW.
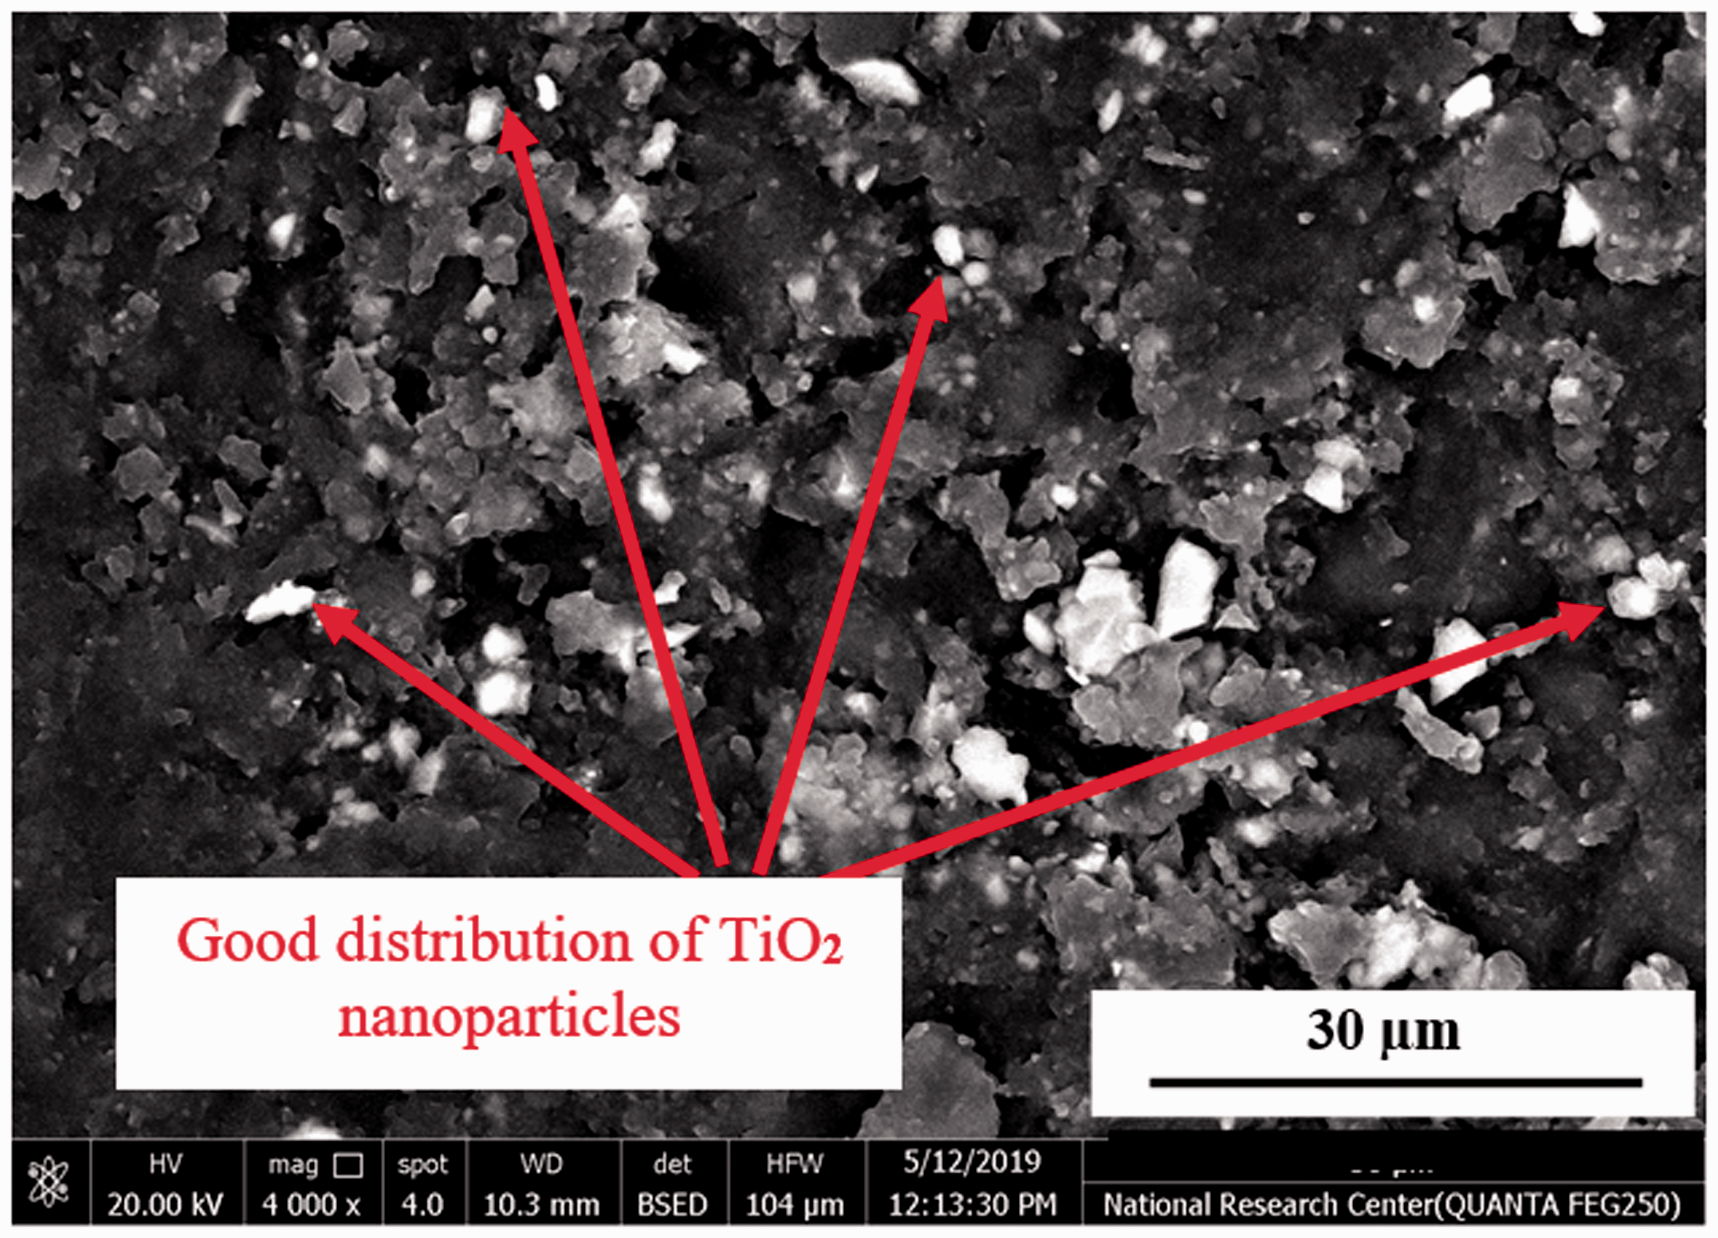
SEM of the surface of GW filled with 0.25 TiO2 nanoparticles.
Figure 14(a) and (b) shows the flexural stress-strain curve of diluent neat and nanofilled GW. Figure 14(a) shows the effect of ethanol percentages (0.5 wt. % and 1.0 wt. %) on the flexural properties of neat GW. GE0.5 has the maximum flexural strength and strain compared with GE1.0 and GW. Figure 14(b) shows the effect of ethanol percentages (0.5 wt. % and 1.0 wt. %) on the flexural properties of nanofilled GW. GT0.25E0.5 has the maximum flexural strength and strain compared with other specimens. This result is similar to that provided by Saharudin et al. [58]. They investigated the influence of ethanol percentages on the flexural properties of graphene nanocomposites. It was found that 1 gram of ethanol the flexural strength of graphene nanocomposites increased by 62% and further increase in ethanol content decreases the flexural strength. This behavior may be attributed to the rapid flow of diluent nanophase epoxy resin during fabrication, thus the outer layers were impregnated better than the inner layers [18]. This resulted in the good adhesion between the nanoparticles and the outer layers thus stiffer exterior layers.

Effect of ethanol on the flexural stress-strain of (a) GW, (b) nanofilled GW.
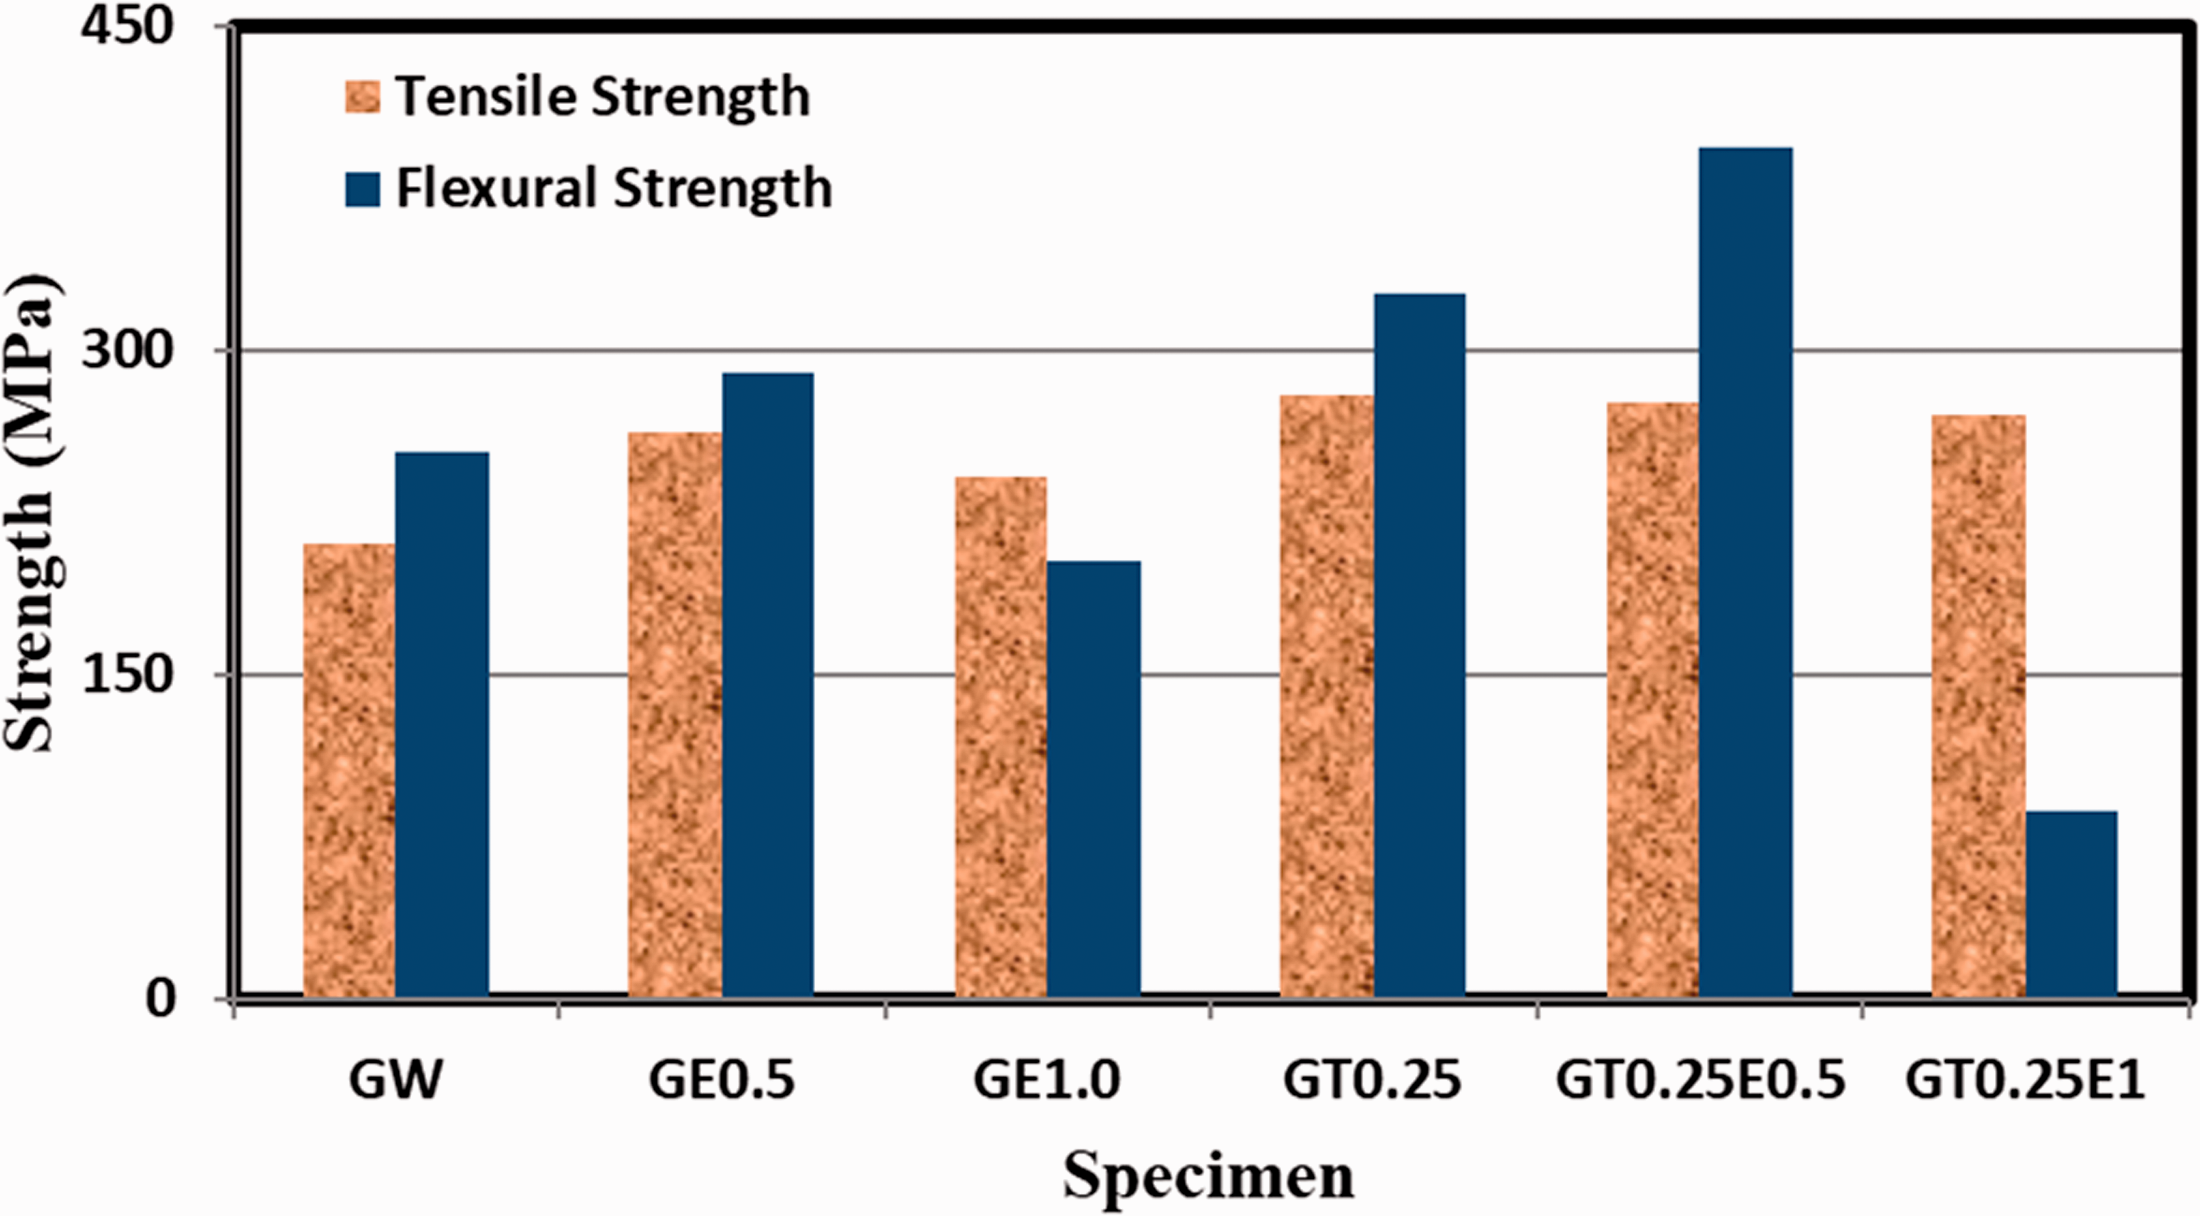
Figure 15 shows the tensile and flexural strength of diluent and nondiluent GW. This figure shows that the addition of 0.5 wt. % of ethanol to GW led to an increase in both the tensile and flexural strength as compared to GW. This behavior can be explained that the fluidity of epoxy resin can be improved by solvent addition [20]. Also, the epoxy resin plasticity enhanced if the proper quantity of solvent is added. However, a high percentage of solvent to resin prevents the cross-linking process, so that the mechanical properties of the resin are deteriorated [57]. Adding a small percentage of 0.5 wt. % of ethanol to woven E-glass fibers gives good impregnation of glass fiber. This good fiber impregnation results from the enhancement of the resin fluidity which is more prominent than hindering the cross-linking process so that the mechanical properties of GE0.25 are better than both GW and GE1.0.The addition of 0.5 wt. % ethanol to nanofilled epoxy increased the flexural strength however; further increased in ethanol deteriorated the flexural strength. Due to the woven E-glass structure, nanoparticles addition to the epoxy resin increases the possibility of nanoparticles filtrations [59]. These filtrations results from the fiber permeability [60]. The addition of a small percentage of ethanol enhanced the dispersion of nanoparticles and thus reduces the chance of filtrations [61]. However, the addition of high percentages of ethanol deteriorates the tensile and flexural properties of diluent nanofilled composite laminates owing to the poor adhesion between TiO2 nanoparticles and woven E-glass and the hindering of the cross-linking process of diluent epoxy resin.
Effect of ethanol on the tensile and flexural strength of GW laminates.
Figure 16 shows the tensile and flexural strain of neat and nanofilled GW, respectively. The higher tensile and flexural strain was obtained with the incorporation of 0.25 wt. % ethanol into the neat epoxy laminate. The addition of the solvent increased the fluidity of epoxy resin [20]. Also, this solvent may increase the epoxy resin plasticity if the proper quantity was added. However, further addition of solvent to epoxy resin may be responsible for preventing the cross-linking process, so the mechanical properties of epoxy resin were deteriorated [57].

Effect of ethanol on the tensile and flexural strain of GW laminates.
Figure 17 shows the average tensile and flexural modulus of diluent and nondiluent GW. It was seen from this figure that all modified GW specimens had higher tensile modulus than neat GW. A maximum enhancement of 62.05% was attained in tensile modulus with GT0.25E1.0. Also, a significant improvement in the tensile modulus by 62%, 30.3%, 24.57%, 24.53%, and 20.2%, for GT0.25E0.5, GT0.5E1, GE1, GE0.5, and GT0.25 compared with neat GW. Moreover, a maximum enhancement of flexural modulus of 72.3% was attained with GT0.25E0.5. An enhancement in flexural modulus of 37.7% and 12.46% was obtained with GT0.25 and GE1, respectively as compared to neat GW.

Effect of ethanol on the tensile and flexural modulus of GW laminates.
Figure 18(a) and (b) shows the SEM of tensile fracture surfaces of neat GW and GW filled with 0.25 wt. % TiO2 nanoparticles and 0.5 wt. % ethanol. From Figure 18(a), debonding between glass fibers and epoxy matrix was observed for neat GW that indicated poor adhesion between epoxy and woven glass fibers. This poor adhesion caused bad stress transfer between the epoxy and glass fiber after subjected to tensile load. However, Figure 18(b) shows a relatively good wetting of epoxy filled with 0.25 wt. % TiO2 nanoparticles and 0.5 wt. % ethanol to the woven glass fibers. Thus, adding 0.25 wt. % TiO2 nanoparticles and 0.5 wt. % ethanol into the epoxy matrix enhanced the adhesion between woven glass fibers and matrix in the interfacial zone. This good adhesion permitted good load transfer between glass fibers and 0.25 wt.% TiO2 nanoparticles and 0.5 wt.% ethanol which resulted in high tensile strength [62]. Hence, adding a small percentage of TiO2 nanoparticles and ethanol content to epoxy resin improved the flow of the resin during vacuum infusion thus improved the wetting between glass fiber and modified epoxy resin.
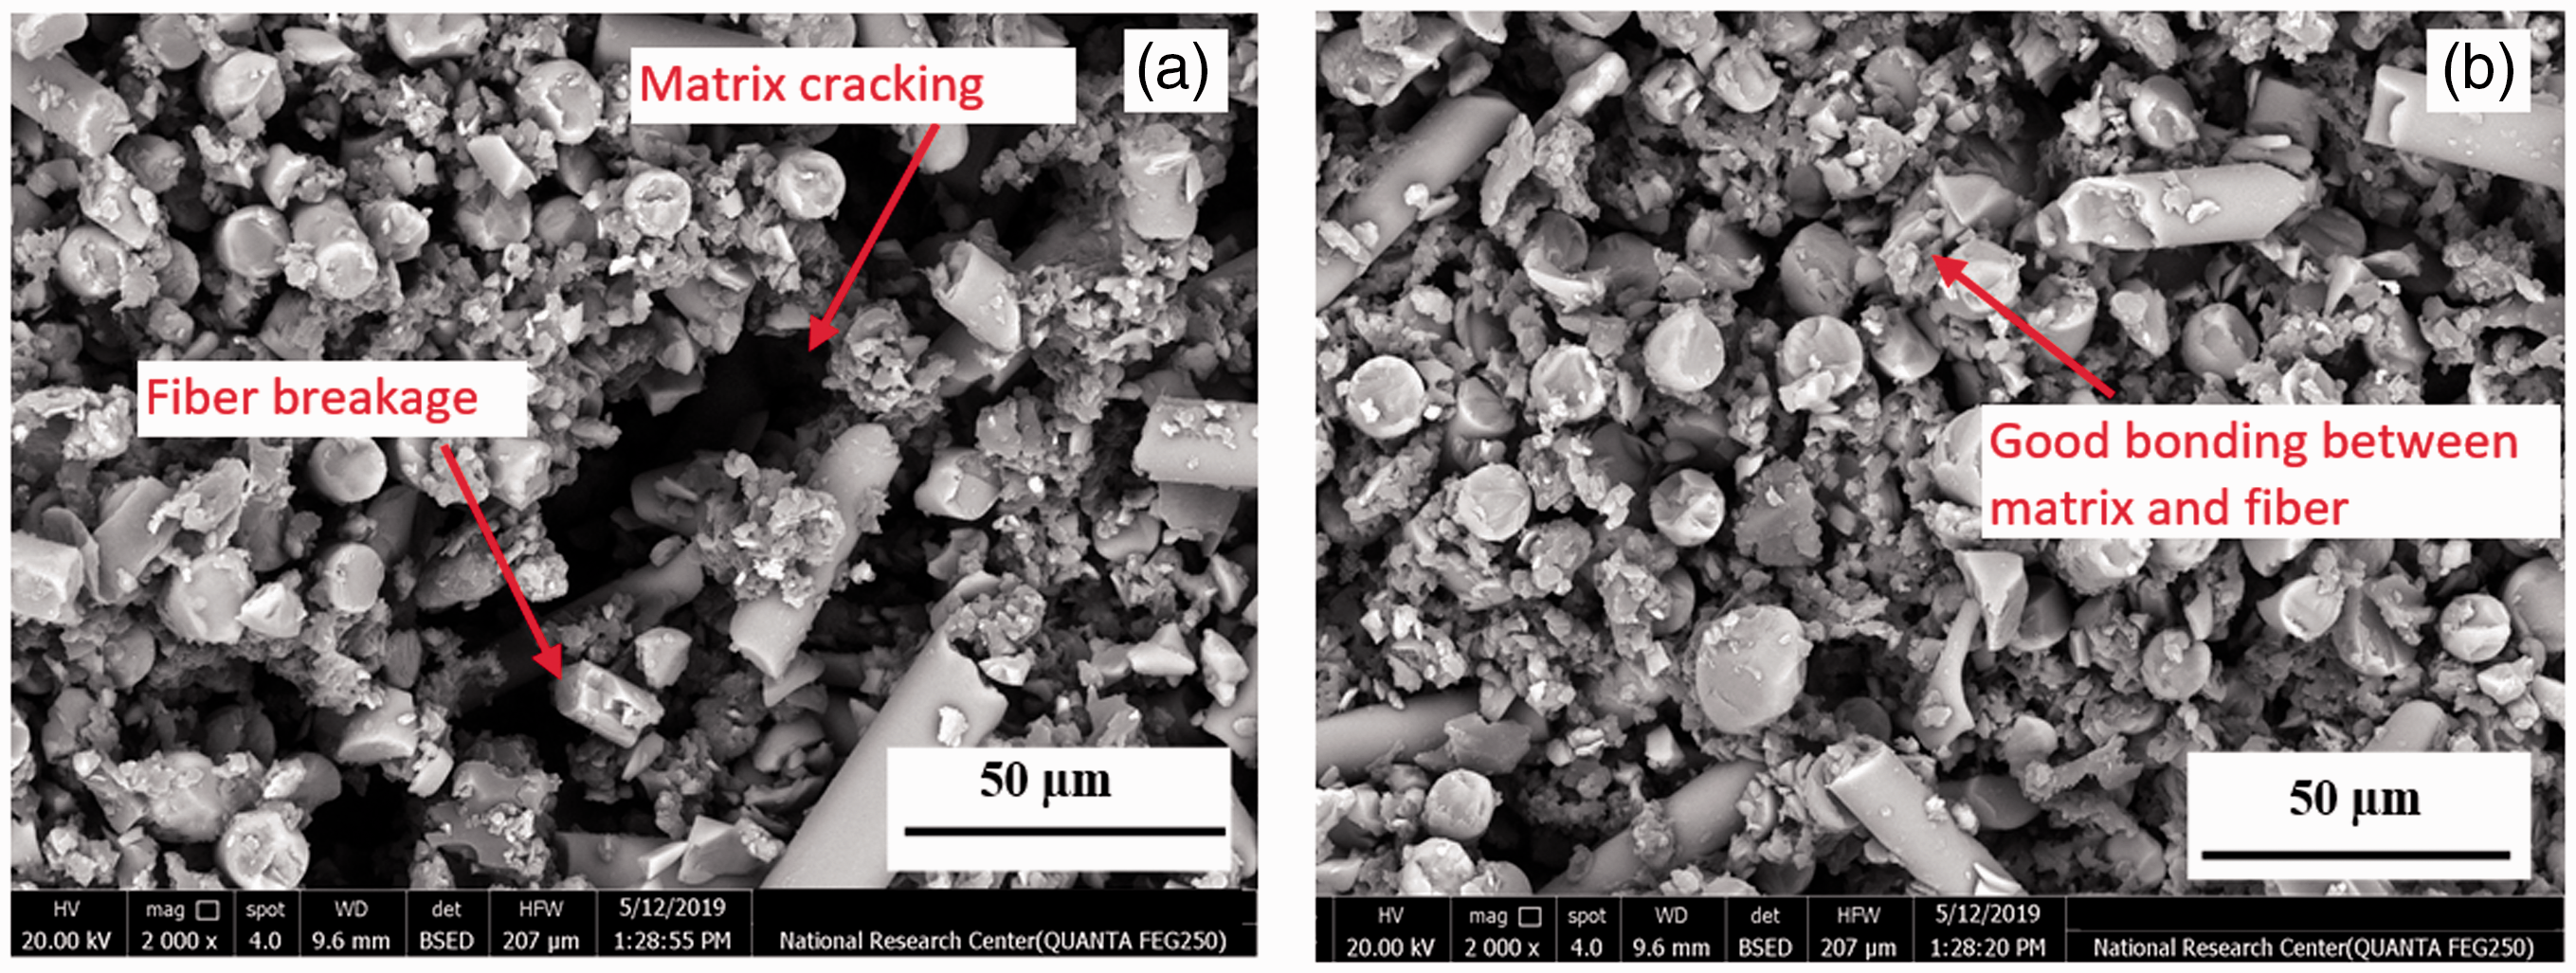
SEM of the tensile fracture surfaces of (a) neat GW (b) GT0.25E0.5.
Figure 19 shows the SEM of the flexural fracture surfaces of GW filled with 0.25 wt. % TiO2 nanoparticles and 1 wt. % ethanol. Fiber breakage, matrix failure, fiber pull out and matrix debonding can be noticed clearly in GT0.25E1. The weak bonding between glass fibers and modified epoxy resulted in worsening in the flexural strength as compared to GW.
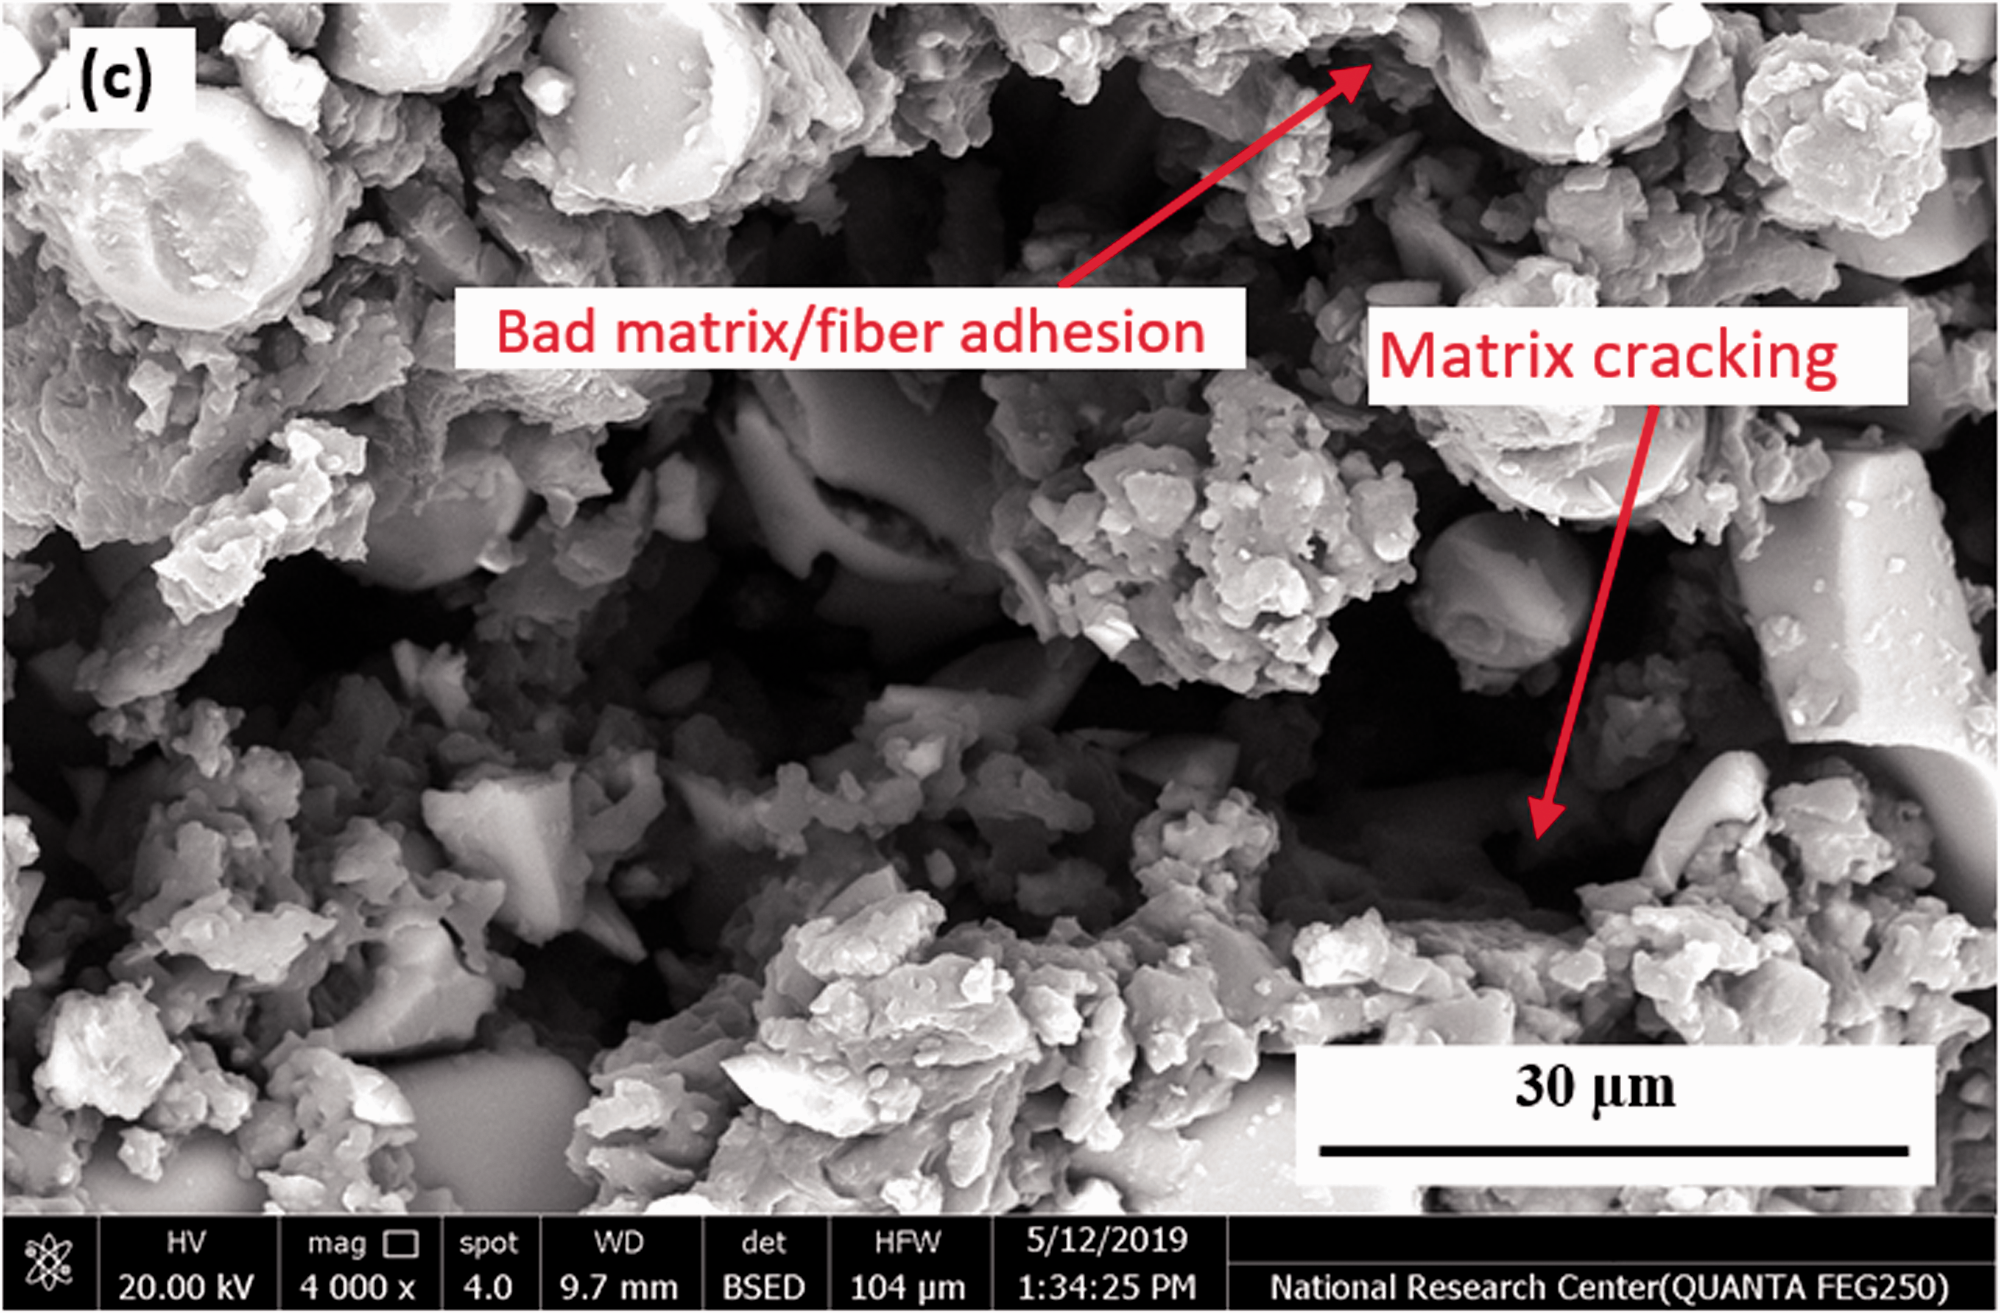
SEM of the flexural fracture surfaces of GT0.25E1.0.
Conclusion
The manufacturing of nanocomposites using the VRI process is a time consuming due to the high viscosity of nano-filled epoxy. This high viscosity can be reduced using a solvent such as ethanol. The mold filling time was investigated experimentally and numerically using ANSYS FLUENT simulation. From results, it was found that as the ethanol percentage increased, the resin viscosity decreased and consequently the processing time. Adding the best amount of ethanol enhanced the mechanical properties of the fabricated composites. A maximum enhancement of 30.9% and 72.3% in the tensile and flexural strength was attained with GT0.25E0.5.The gaps around the fibers reduce the filling time without affecting the mechanical properties. Adding 0.25 wt. % TiO2 nanoparticles and 0.5 wt. % ethanol into the epoxy matrix enhanced the adhesion between woven glass fibers and matrix in the interfacial zone thus the tensile and flexural properties were improved.
Footnotes
Declaration of conflicting interests
The author(s) declared no potential conflicts of interest with respect to the research, authorship, and/or publication of this article.
Funding
The author(s) received no financial support for the research, authorship, and/or publication of this article.