
Abstract
A lot of research has already been conducted on tissue engineering as it can have the potential for organ and tissue regeneration and repair. Research on the proliferation of cells on the scaffolds, which are material-based structures in the extracellular matrix, increased efficiency of 3D cultures. In this study, the stages of preparing a nanofiber scaffold with different ratios of three polymers of Polycaprolactone/Gelatin/Polydimethylsiloxane (PCL/G/PDMS) which is biodegradable, non-toxic and biocompatible are explained for tissue engineering and then fibroblast cells cultivation are discussed. The morphology, porosity and hydrophilicity of the prepared scaffolds were evaluated by scanning electron microscope (SEM), the liquid displacement method, water contact-angle measurements respectively. The cell growth and proliferation on scaffolds were counted by Digimizer© software. Then morphology, porosity and hydrophilicity of scaffolds and cell growth and proliferation on scaffolds were optimized by Response Surface Methodology (RSM). The results show that PCL/G/PDMS electrospun nanofibers can be used for tissue engineering applications. The purpose of this scaffold is design a scaffold for elastic tissue engineering, especially uterine tissue, which will be discussed in the following articles.
Introduction
One of the most effective methods for fabrication of nanofiber scaffolds with different properties is polymer blends in tissue engineering [1]. In tissue engineering, scaffolds like extracellular matrix (ECM), play a pivotal role in cell behavior controlling. Nanofiber scaffolds are suitable environment for cell adhesion and proliferation because of their similarity to the physical dimension of ECM [2–5]. Most polymers do not have all the necessary features for tissue engineering. The best method to achieve suitable properties such as morphology, porosity, hydrophilicity and cell adhesion is using polymer blends for tissue engineering [6]. Scaffolds increase cell migration and adhesion due to their high volume-to-surface ratio, and facilitate nutrients and oxygen transfer to the cells [7,8]. PCL nanofiber scaffold is architecturally similar to ECM but due to PCL hydrophobicity, cell migration and adhesion were reduced [9,10]. Hydrophilic gelatin polymer can cause adhesion, proliferation and migration of cells to the PCL polymer [1,11]. Also, PDMS polymer increases the PCL polymer mechanical properties in the composite scaffolds [12].
PCL/gelatin nanofibers used for Culture of fibroblast cells. PCL/gelatin composite scaffold is beneficial for the attachment and proliferation of fibroblast cells [13].
The PCL‐PDMS‐PCL copolymer microspheres and evaluate the influence of biophysical properties (i.e., microsphere size and elastic modulus) were studied on cardiovascular differentiation of embryonic stem cells [14].
Electrospinning is a fiber production method which employs electric force uses to draw charged threads of polymer solutions or polymer melts to fiber diameters in the order of some hundred nanometers [15]. When a sufficiently high voltage is applied to a liquid droplet, the body of the liquid becomes charged, and electrostatic repulsion is neutralized the surface tension and the droplet is stretched. Then at a critical point a stream of liquid erupts from the surface. This point of eruption is known as the Taylor cone. If the molecular cohesion of the liquid is sufficiently high, stream breakup does not occur (if it does, droplets are electrosprayed) and a charged liquid jet is formed [14,15]. As the jet dries in flight, the mode of current flow changes from ohmic to convective as the charge migrates to the surface of the fiber. The jet is elongated by a whipping process caused by electrostatic repulsion initiated at small bends in the fiber, until it is finally deposited on the grounded collector [16–18]. The elongation and thin of the fiber that are the result of this flexural instability leads to the formation of uniform fibers with nanometer-scale diameters [19]. The standard laboratory setup for electrospinning consists of a spinneret (typically a hypodermic syringe needle) connected to a high-voltage (5 to 50 kV) and it has direct current power supply, a syringe pump, and a grounded collector. A polymer solution is loaded into the syringe. The liquid is extruded from the needle tip at a constant rate by a syringe pump. Alternatively, the droplet at the tip of the spinneret can be replenished by feeding from a header tank providing a constant feed pressure. This constant pressure type feed works better for lower viscosity feedstocks [20]. The present study aim is fabrication a novel composite scaffold of PCL/G/PDMS by electrospinning as potential scaffolds for Tissue Engineering. Then, reports will be provided on the results of optimizing of morphology, hydrophilicity, porosity and cell adhesion on PCL/G/PDMS scaffolds with RSM. Strength, elongation, biodegradability, non-toxicity, morphology, porosity and hydrophilicity of scaffolds and cell number on scaffolds were considered as the targeted response. The results showed that the morphology, porosity, hydrophobicity of PCL/G/PDMS scaffolds, and the number of proliferating cells in the scaffolds were optimized with the RSM. Increasing the concentration of PCL and PDMS functional polymers in the mixture of three polymers increased the diameter of nanofibers and porosity of the scaffold and decreased the hydrophobicity and cell number on the scaffolds. Increasing the concentration of polymer G in the polymer solution resulted in nanofibers diameter and porosity of the scaffolds and increased hydrophobicity of the scaffolds and cell number on the scaffolds. This optimized elastic scaffold is designed for tissue engineering. The characteristics of PCL/G/PDMS hybrid scaffolds are tunable by altering the ratio of PCL, G and PDMS. Characterization of the produced scaffolds from the three polymers of PCL/G/PDMS has shown that these scaffolds may be suitable for tissue engineering applications, including elastic organs like uterus, blood vessels, bladder, trachea, heart valves, vein, vagina, and others.
Materials and methods
Materials
PCL, G, PDMS were purchased from Sigma-Aldrich® and Trifluoroacetic acid (TFA) (C2HF3O2) from Merck® companies. The fibroblast cells were obtained from Stem Cell Biology Research Center of Yazd Reproductive Sciences Institute. Dulbecco’s Modified Eagle Medium (DMEM), Collagenase Type I, Fetal Bovine Serum (FBS) and Pen- Strep were purchased from Gibco®. Phosphate-buffered saline (PBS, pH 7.4) were purchased from Inoclon®. Trypsin/ethylenediaminetetraacetic acid (Trypsin-EDTA) were acquired from Bio-Idea®. Glutaraldehyde, hematoxylin-eosin (H&E) were obtained from Merck® companies. Human fibroblast Cells (Yazd human foreskin fibroblasts; YhFF#8; passage 20) were provided by Stem Cell Biology Research Center of Yazd Reproductive Sciences Institute.
Scaffold fabrication
PCL/G/PDMS hybrid nanofibers were produced with various volume ratios according to Table 2 (Due to the lack of electrospinning, percentages of PCL = 0, G = 0, PDMS = 0 and PCL = 0, G = 0, PDMS = 30 is eliminated of Table 2). PCL/G/PDMS hybrid nanofibers was dissolved in TFA and stirred for 2 h. The homogeneous solutions were loaded into 2 ml plastic syringes fitted with a blunt 21-gauge needle. Then, the syringe was placed on a syringe pump and the needle was connected to the positive electrode of a high voltage power supply (Gamma High Voltage Research). To obtain the optimal values of the input parameters in electrospinning, the feed rate of the polymer solution, the applied voltage, tip to the collector distance and the speed of the collector were set at 0.1 mlh−1, 22 kV, 16 cm and 300 rpm respectively. Fibers were electrospun onto an aluminum foil. The hybrid nanofibers were assembled on the electrospinning machine collector.
Experimental design
The percentage of mixing polymers of PCL/G/PDMS for producing nanofibers can significantly affect parameters such as morphology, hydrophilicity, porosity and cell adhesion of polymers and efficiency. Therefore, a standard RSM design, i.e. central composite design (CCD), was used to identify the relationship between the response function (morphology, hydrophilicity, porosity and cell adhesion on scaffolds) and the process variables (percentage of mixing polymers of PCL/G/PDMS). The experimental range of the selected process variables with their units and notations was given in Table 1. The response variable (morphology, hydrophilicity, porosity and cell adhesion on scaffolds) can be expressed as a function of the independent process variables according to the following response surface quadratic model: [21]

Experimental range and levels of the independent variables.

Experimental Box-Behnken design runs and the corresponding results.

After the preparation of polymeric solutions, PCL/G/PDMS solutions had mixed weight ratios According to Table 1.
Morphologic characterization of scaffolds
Morphologies of the scaffolds were examined using a scanning electron microscope (SEM) (ZEISS® DSM 960 A Oberkochen, Germany) with an accelerating voltage of 8 kV. The samples of hybrid scaffolds containing gelatin with different percentages were prepared by fixing the samples in 4% glutaraldehyde [22–24]. The scaffolds were coated with gold before imaging. The diameters of the electrospun fibers were analyzed from the SEM images using an image analysis software (Image J, 1.41o software). The mean and standard deviation of the fiber diameter were calculated through 100 random measurements per image (three random images per sample).
Evaluation of porosity of the scaffolds
The total porosity of scaffolds was measured via the liquid displacement method [20,21]. A cylinder containing a predetermined volume of ethanol (V1) was used to immerse the samples. The specimens were stored in 96% ethanol for 24 h on a shaker to allow penetration into the pores. The total volume of ethanol with the immersed specimen was measured (V2). The scaffolds were removed from the cylinder and the residual volume of ethanol was measured (V3). The percentage of porosity (ɛ) was calculated by dividing the volume of pores (V1 − V3) by a total volume of a sample (V2 − V3) [25]:
Water content and water contact-angle measurements
Three droplets were dropped at different points of hybrid nanofibers, and flattening the droplets was recorded immediately after dropping using the video camera. The size of drops was set to 5 µL microliters per sample. Then, the rate of contact of water droplets with the horizontal surface of scaffolds was calculated using Digimizer © software.
Cell culture and count on scaffolds
The fibroblasts were cultured in DMEM supplemented with 10% FBS and 1% penicillin/streptomycin in 60 cm2 tissue culture Petri dishes (TPP, Biochrom AG®, Germany) in a standard humidified incubator at 37 °C temperature and 5% carbon dioxide concentration. The cells were washed with PBS, incubated with 0.05%/0.02% (v/v) trypsin/EDTA solution and pelleted by centrifugation at 200 g for 5 min. Fresh culture medium was added to the cell pellet obtained after centrifugation and the cell number was counted. After sterilization under UV light for 30 min, the electrospun fibers were placed in 24-well plates and were seeded with fibroblast cells at a density of 5 × 10³ cells per well. The cells were incubated in a humidified incubator at 37 °C with 5% CO2 and the medium was changed every 3 days [26,27]. Samples were harvested for H&E staining, and then the cells on the scaffolds were counted by Digimizer© software.
Infilterating the cells inside the scaffolds
For investigation of the infilterating the cells inside the scaffolds, a scaffold consisting of 10 layers of scaffolds was made so that the thickness of the scaffold was determined. Fibroblast cells at a density of 5 × 10³ cells/well were cultured on the scaffold. Then on the third day, the cells were fixed on the scaffold with 2.5% glutaraldehyde for 2 hours. The scaffold was cut transversely and cell infiltration was evaluated by H&E staining.
Results and discussions
Nanofiber diameter
One of the most important characteristics of nanofibers for tissue engineering is their size and morphological features. To obtain a model of nanofiber diameter, the RSM experimental design was used. PCL/G/PDMS blend ratio was considered as an independent variable. For the evaluation of 18 experiments, nanofiber diameter was investigated and the results are shown in Table 2.
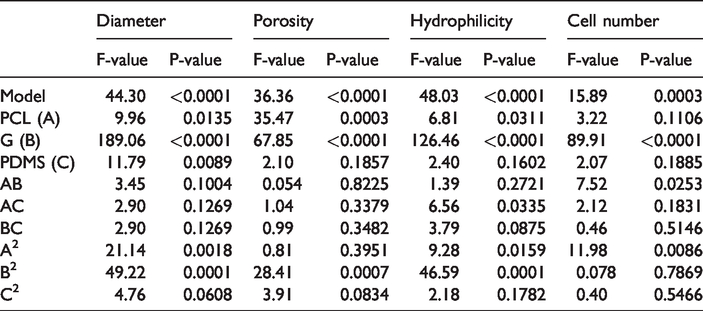
The variance (ANOVA) of quadratic models is shown in Table 3. The ANOVA shows that RSM-derived equations could be used to describe the diameter of the nanofiber in a wide range of operating conditions. For models, there was a lack of fit and good determination coefficient (R2> 0.95). The quadratic equation for the nanofiber diameter is as follows:
Analysis of the results of the variance of the manufactured scaffold characteristics.
Where A, B, and C capitals are PCL percentage, G percentage and PDMS percentage, respectively.
All P-values were less than the significance level of 0.05, except for AC, AB, BC and C2 (Table 3).
But the P-values for conditions were less than 0.05, so the diameter of the nanofibers has a quadratic relationship with the ratio of the mixing of the three polymers (PCL/G/PDMS). R2 and Adj-R2 were 0.98 and 0.96, respectively (Table 4) [21].
Model summary statistics results of the fitting the experimental data to proposal models.
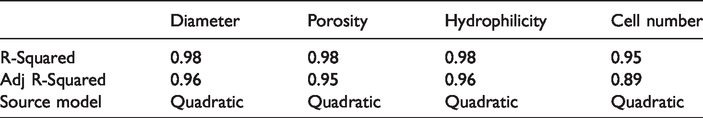
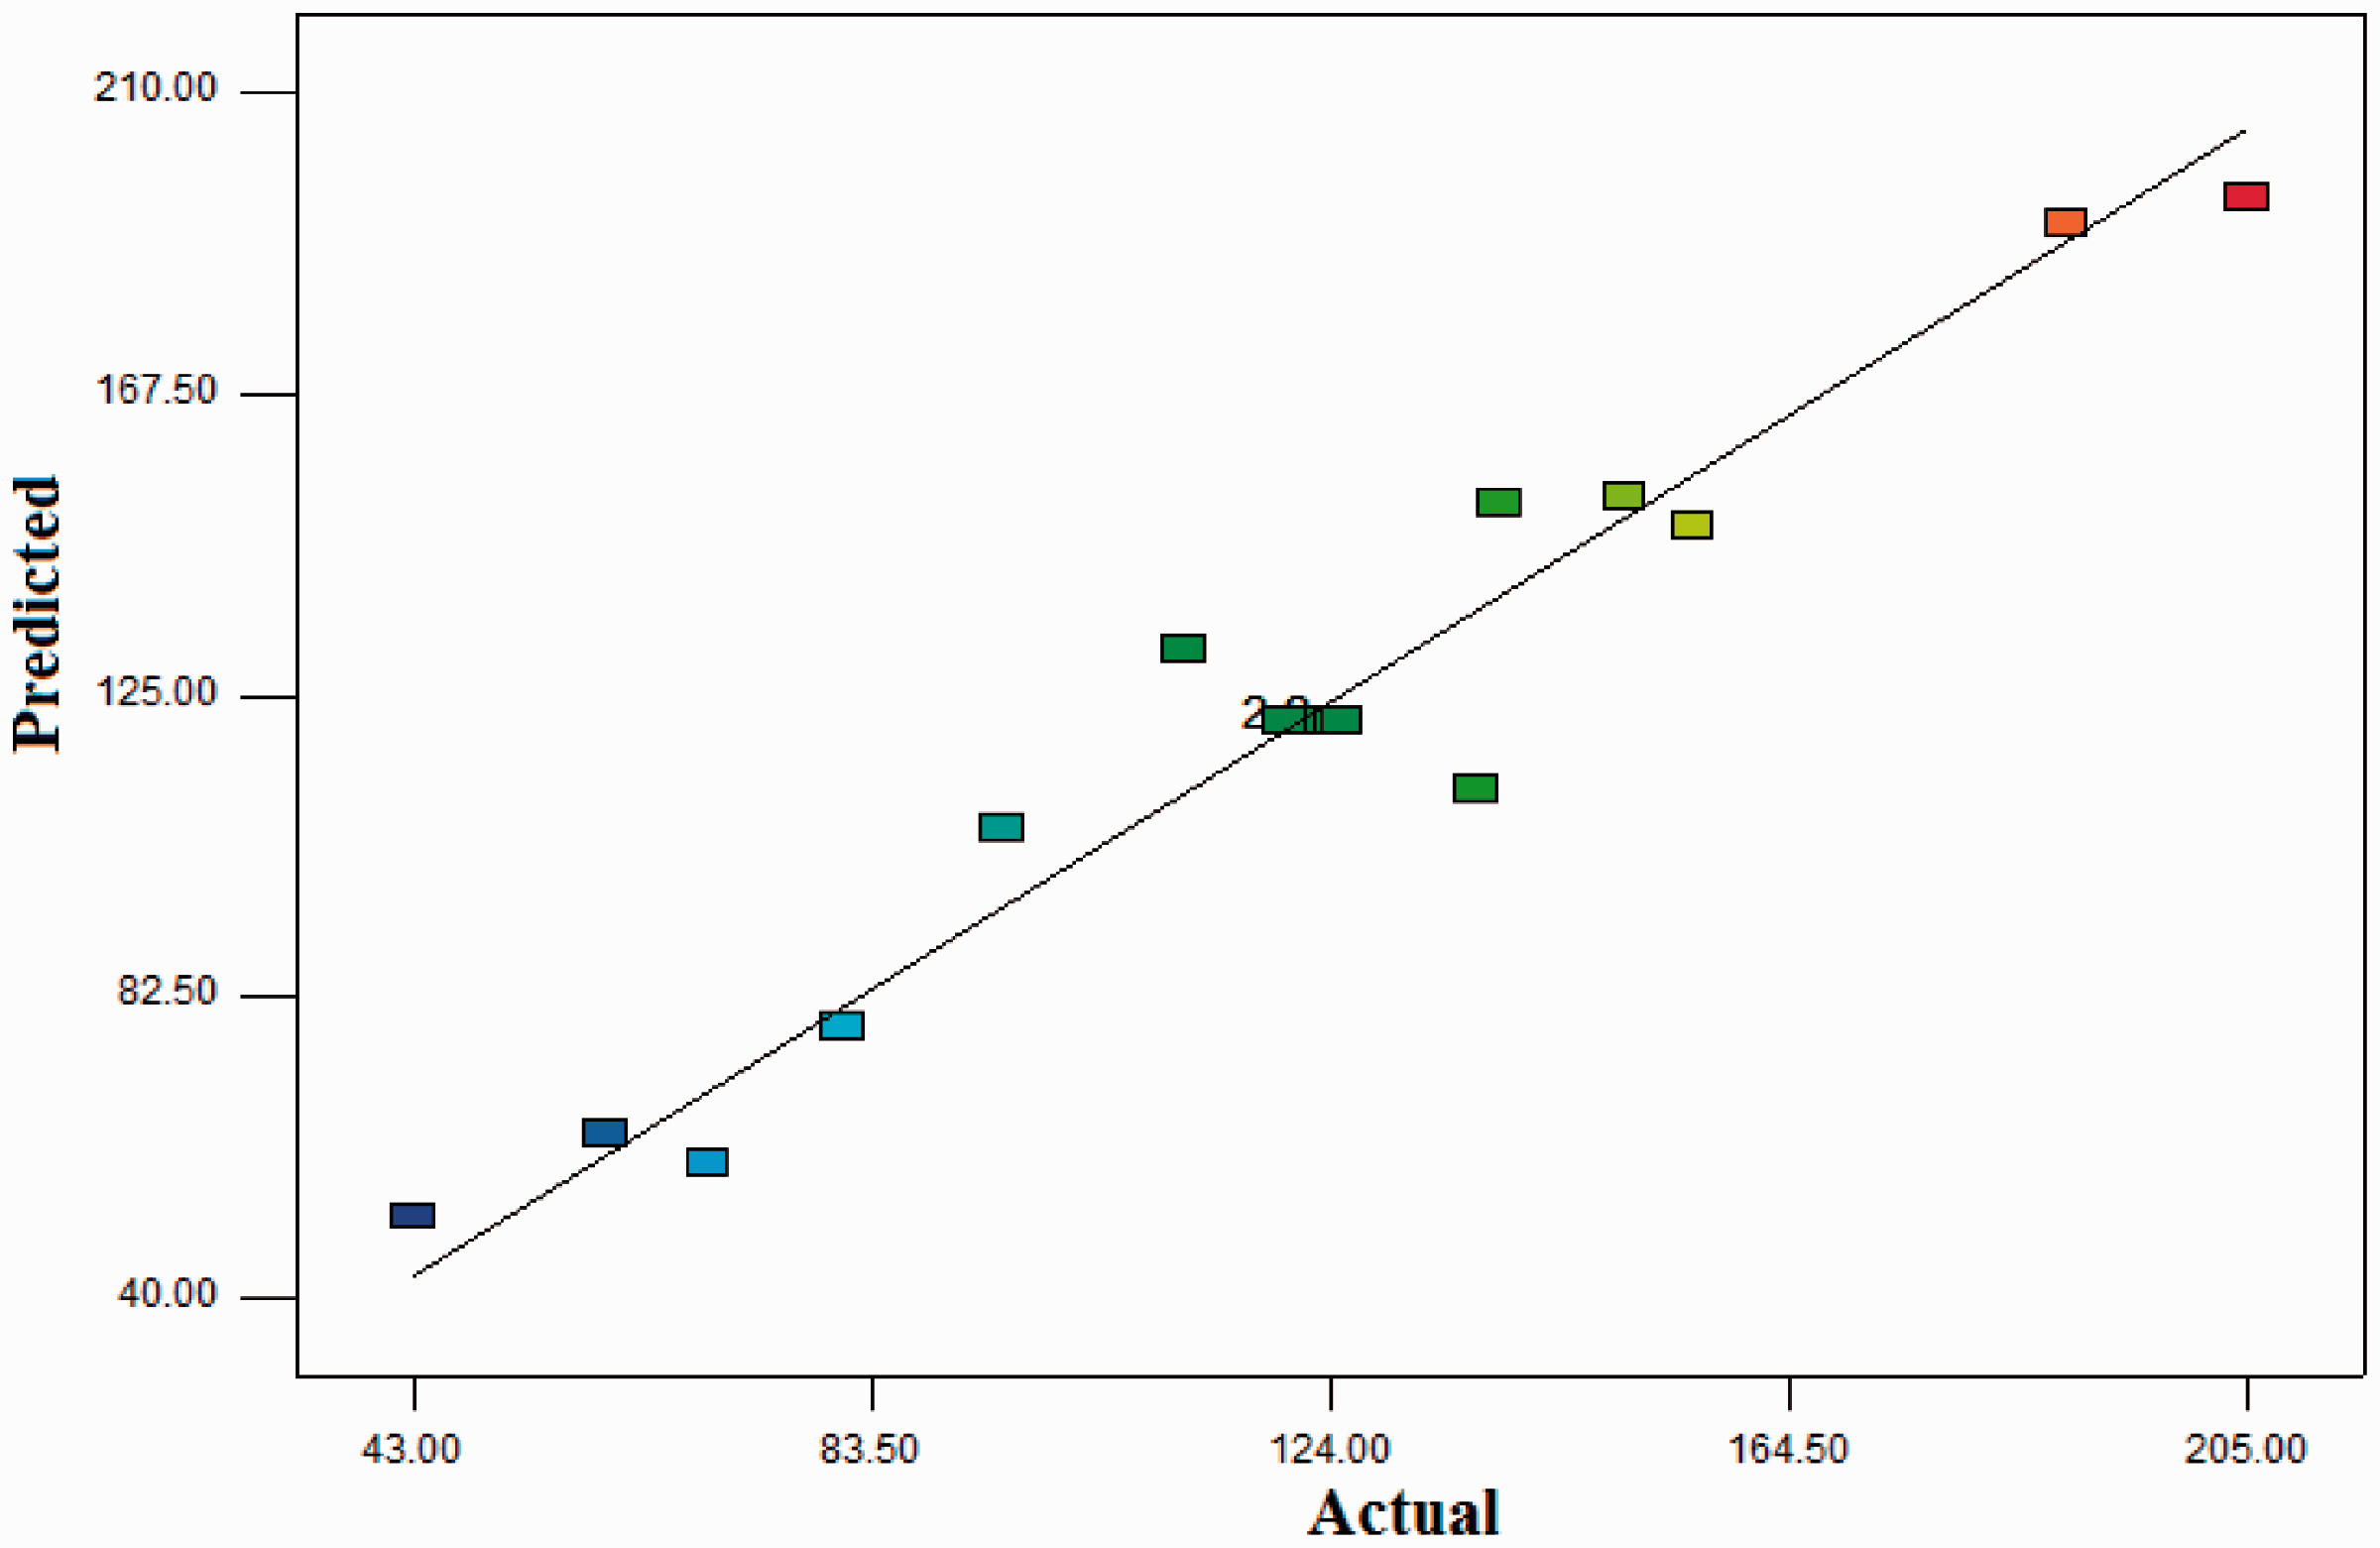
Figure 1 shows the predicted responses and observed responses. It indicates that the empirical models for diameter of nanofibers showed a good fit to the observed results.

Actual values versus predicted plots (diameter of nanofibers).
The effect of the combination of three polymers on the diameter of nanofibers is presented in Figure 2. Increases in nanofiber diameter were accompanied with lower gelatin percentage and higher PCL percentage in the fabricated nanofibers (Figure 2(a)). Also, Figure 2(b) and (c) show that with increasing of PDMS percentage, the nanofiber diameter increases as a share chart. Figure 2(b) shows that increases in both PCL and PDMS concentrations increased the diameter of the nanofibers, but the effect of PDMS on the diameter increase was more than of PCL.
Response surface of diameter of nanofibers: (a) PCL/G, (b) PCL/PDMS, (c) G/PDMS.
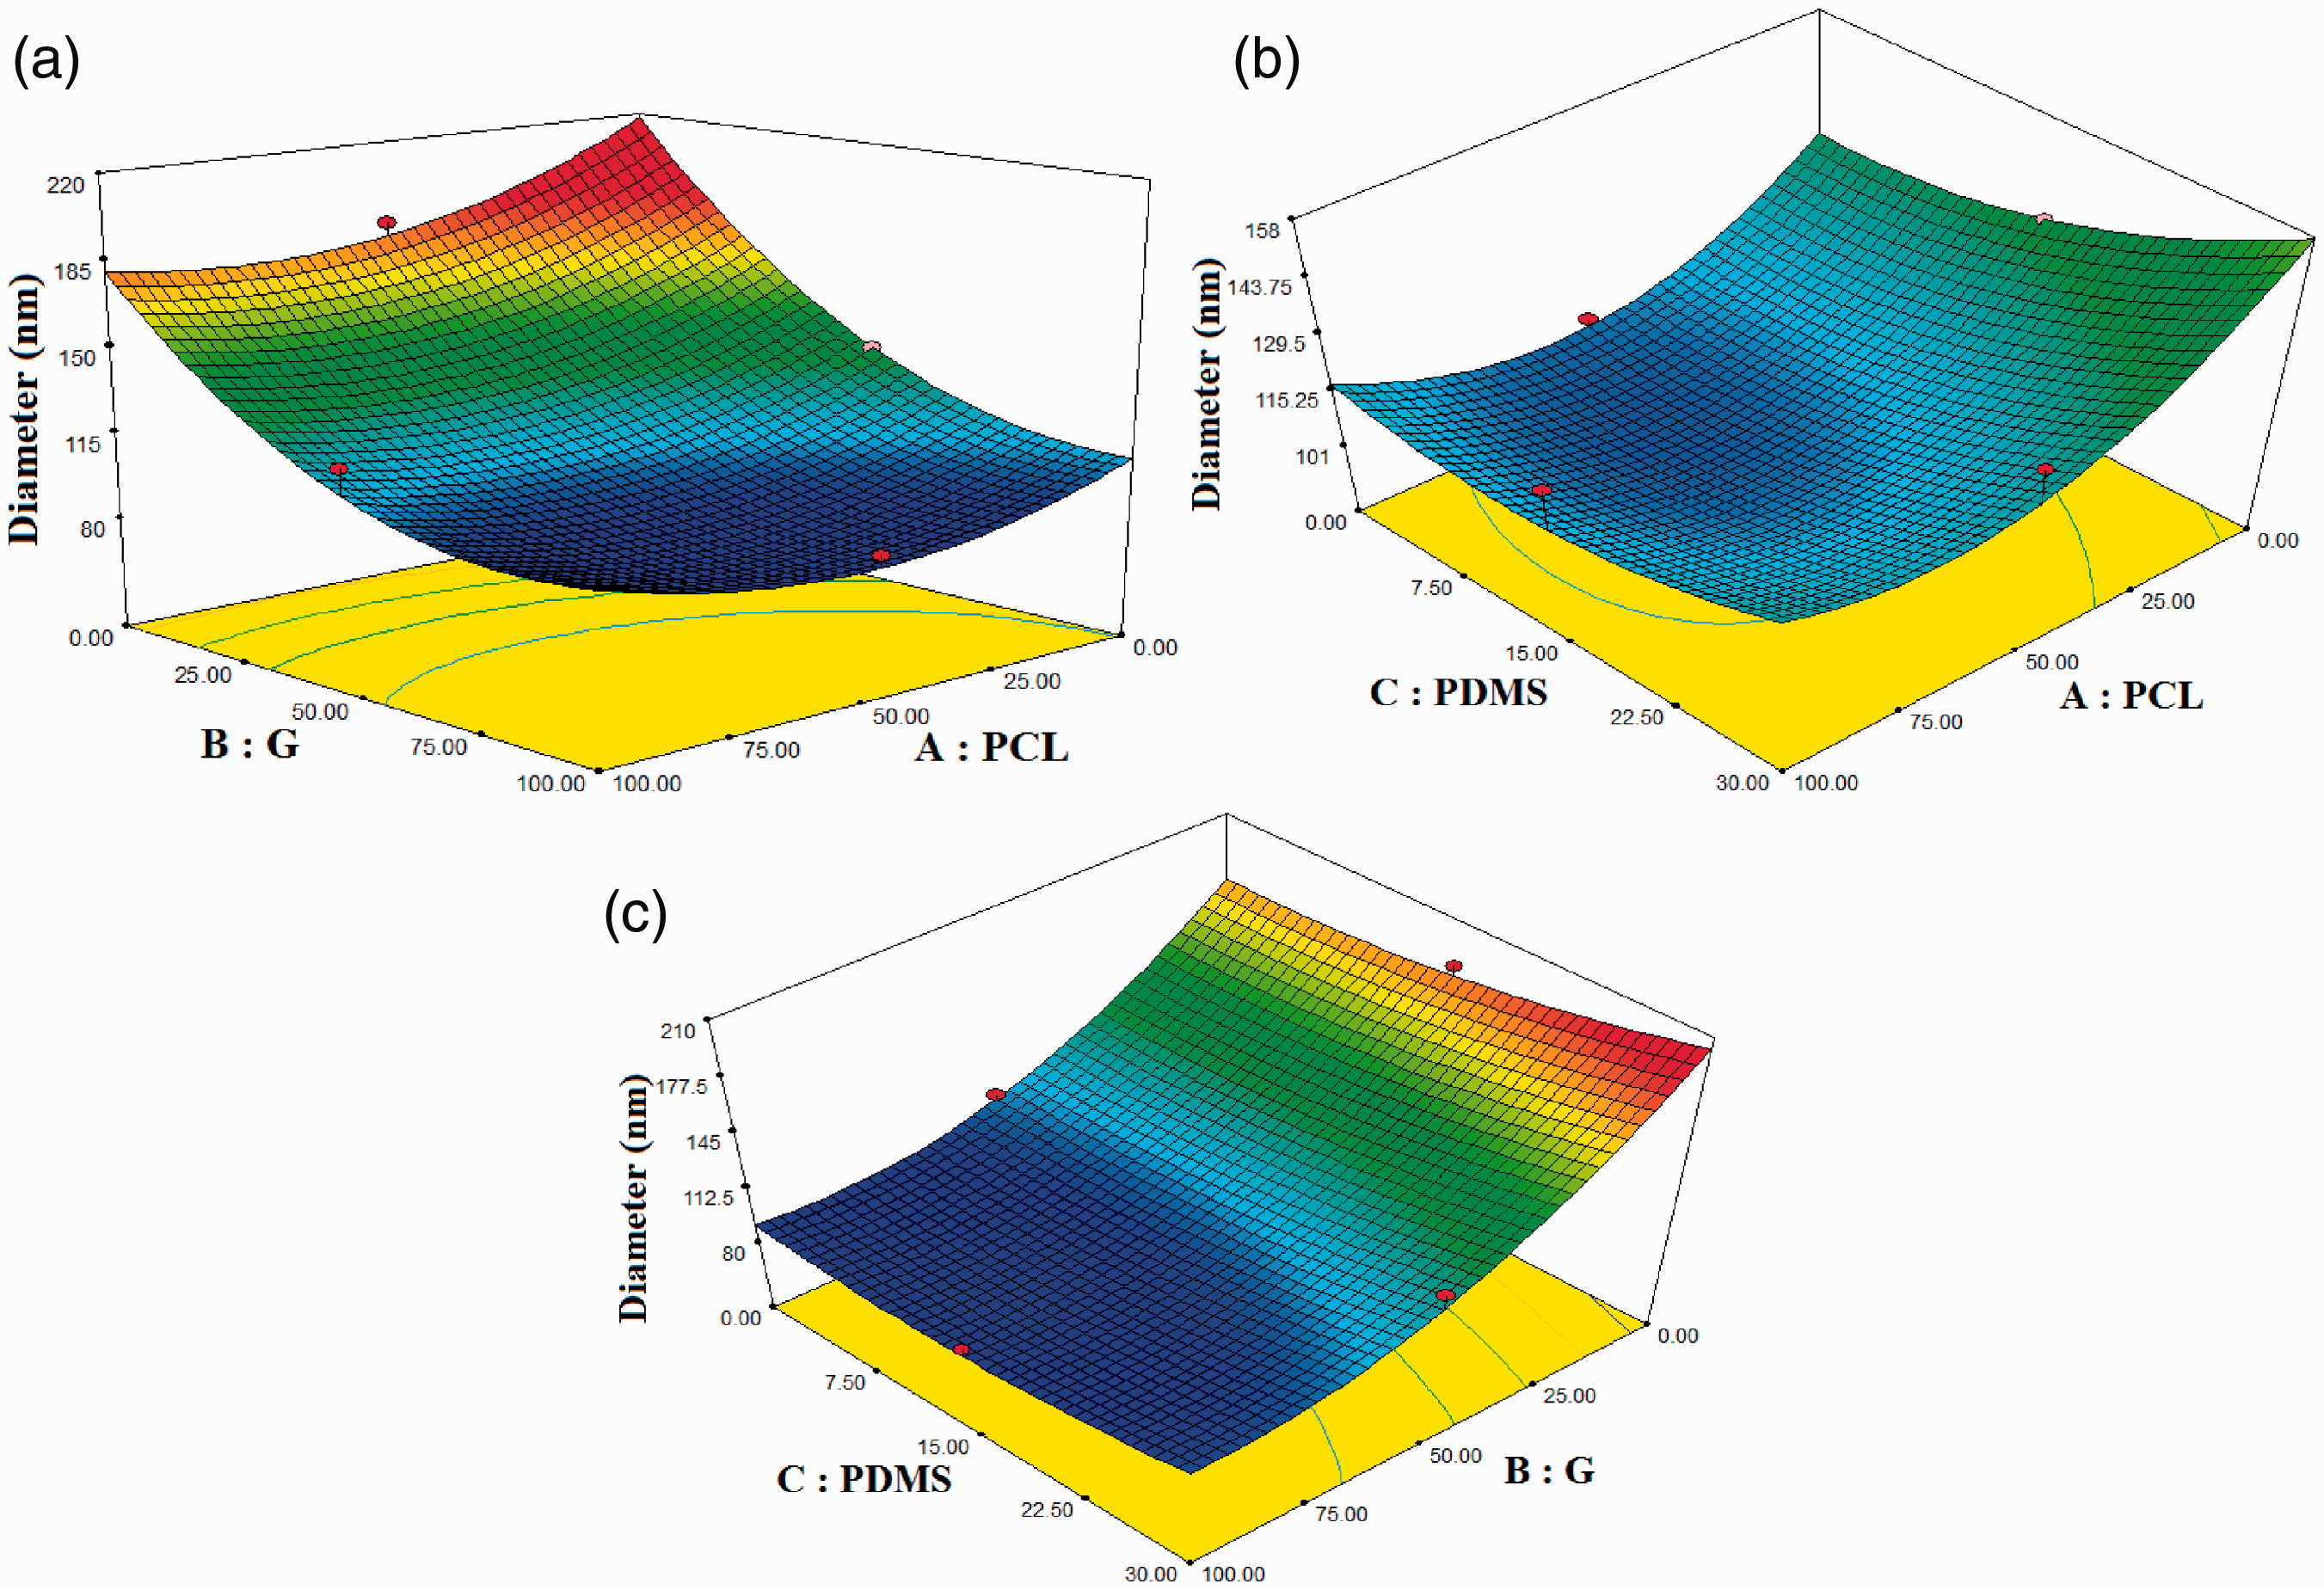
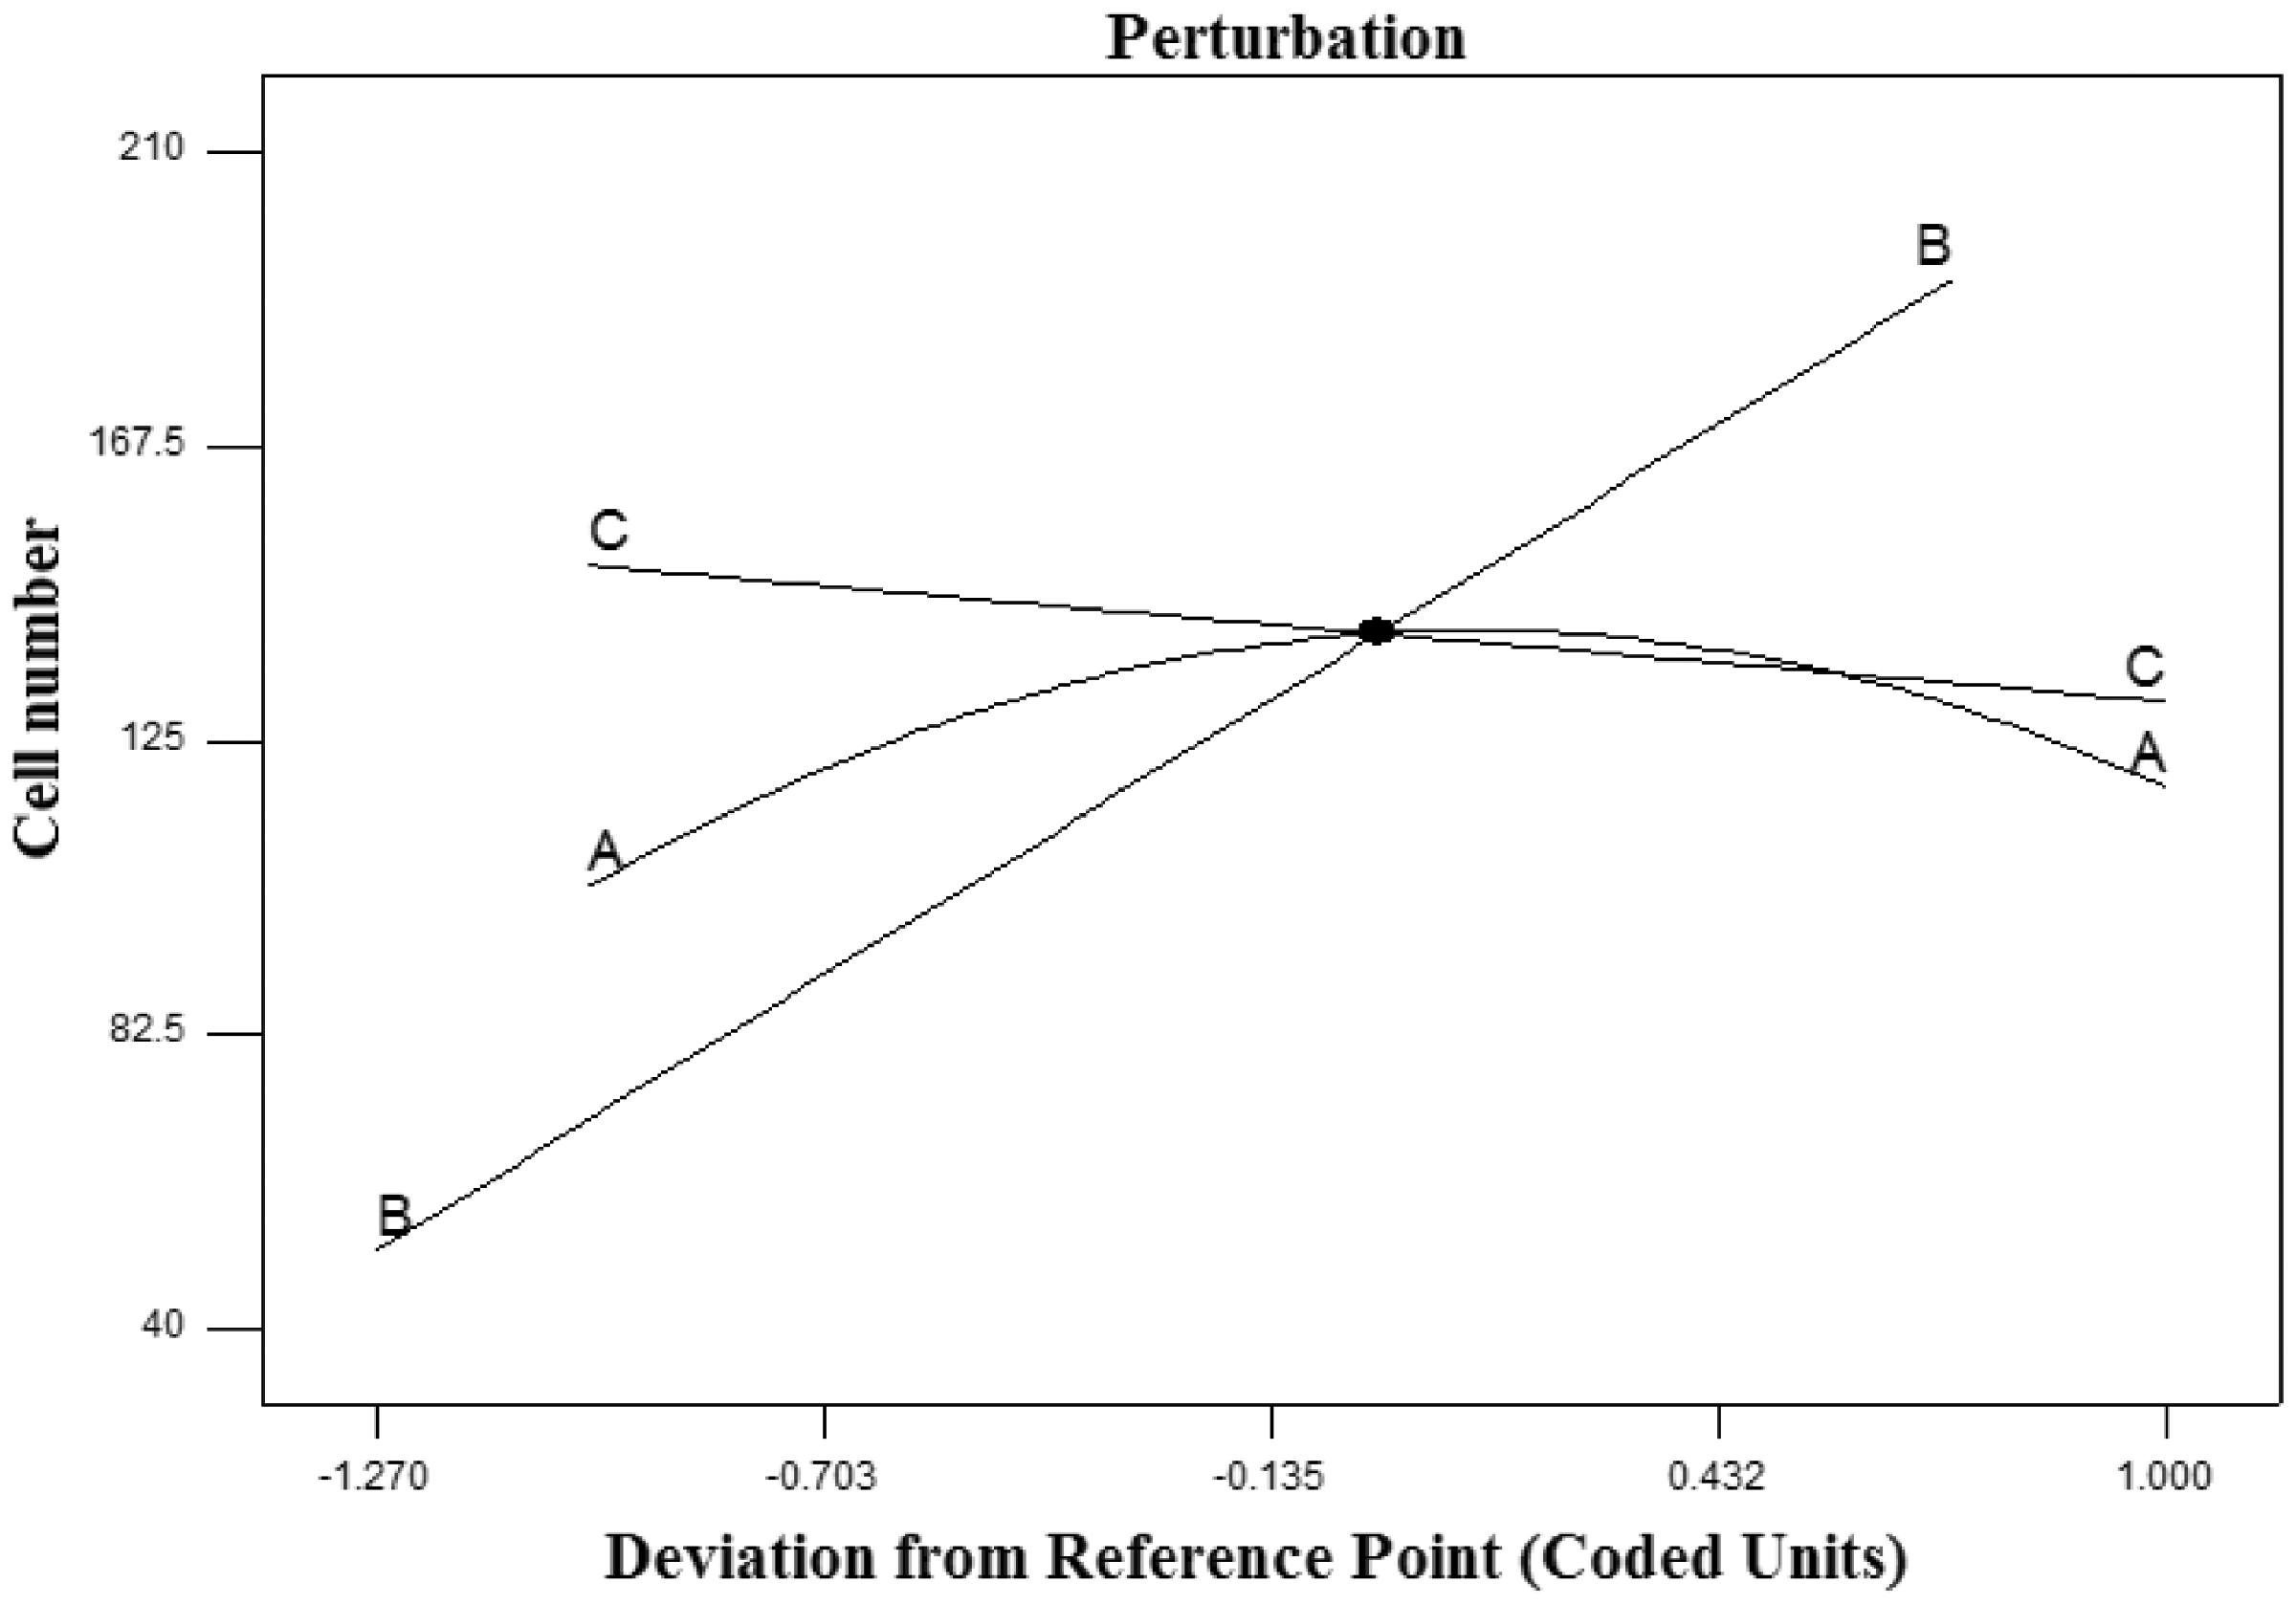
As shown in Figure 3, the increase in the percentage of G polymer in a hybrid solution from three polymers ranging from -1 to 1 was along with the increase of the diameter of nanofibers. This means that the percentage of G has a reverse effect on the diameter of the nanofibers. In addition, increasing the percentage of PCL and PDMS in the hybrid solution led to increasing diameter of nanofibers, but the effect of increasing diameter of nanofibers by increasing the PDMS percentage was higher than the increasing PCL percentage. Due to the function of quadratic behavior of the G percentage, as shown in Figure 2, the effect of G polymer on the diameter of nanofibers was higher than the PCL and PDMS polymers.
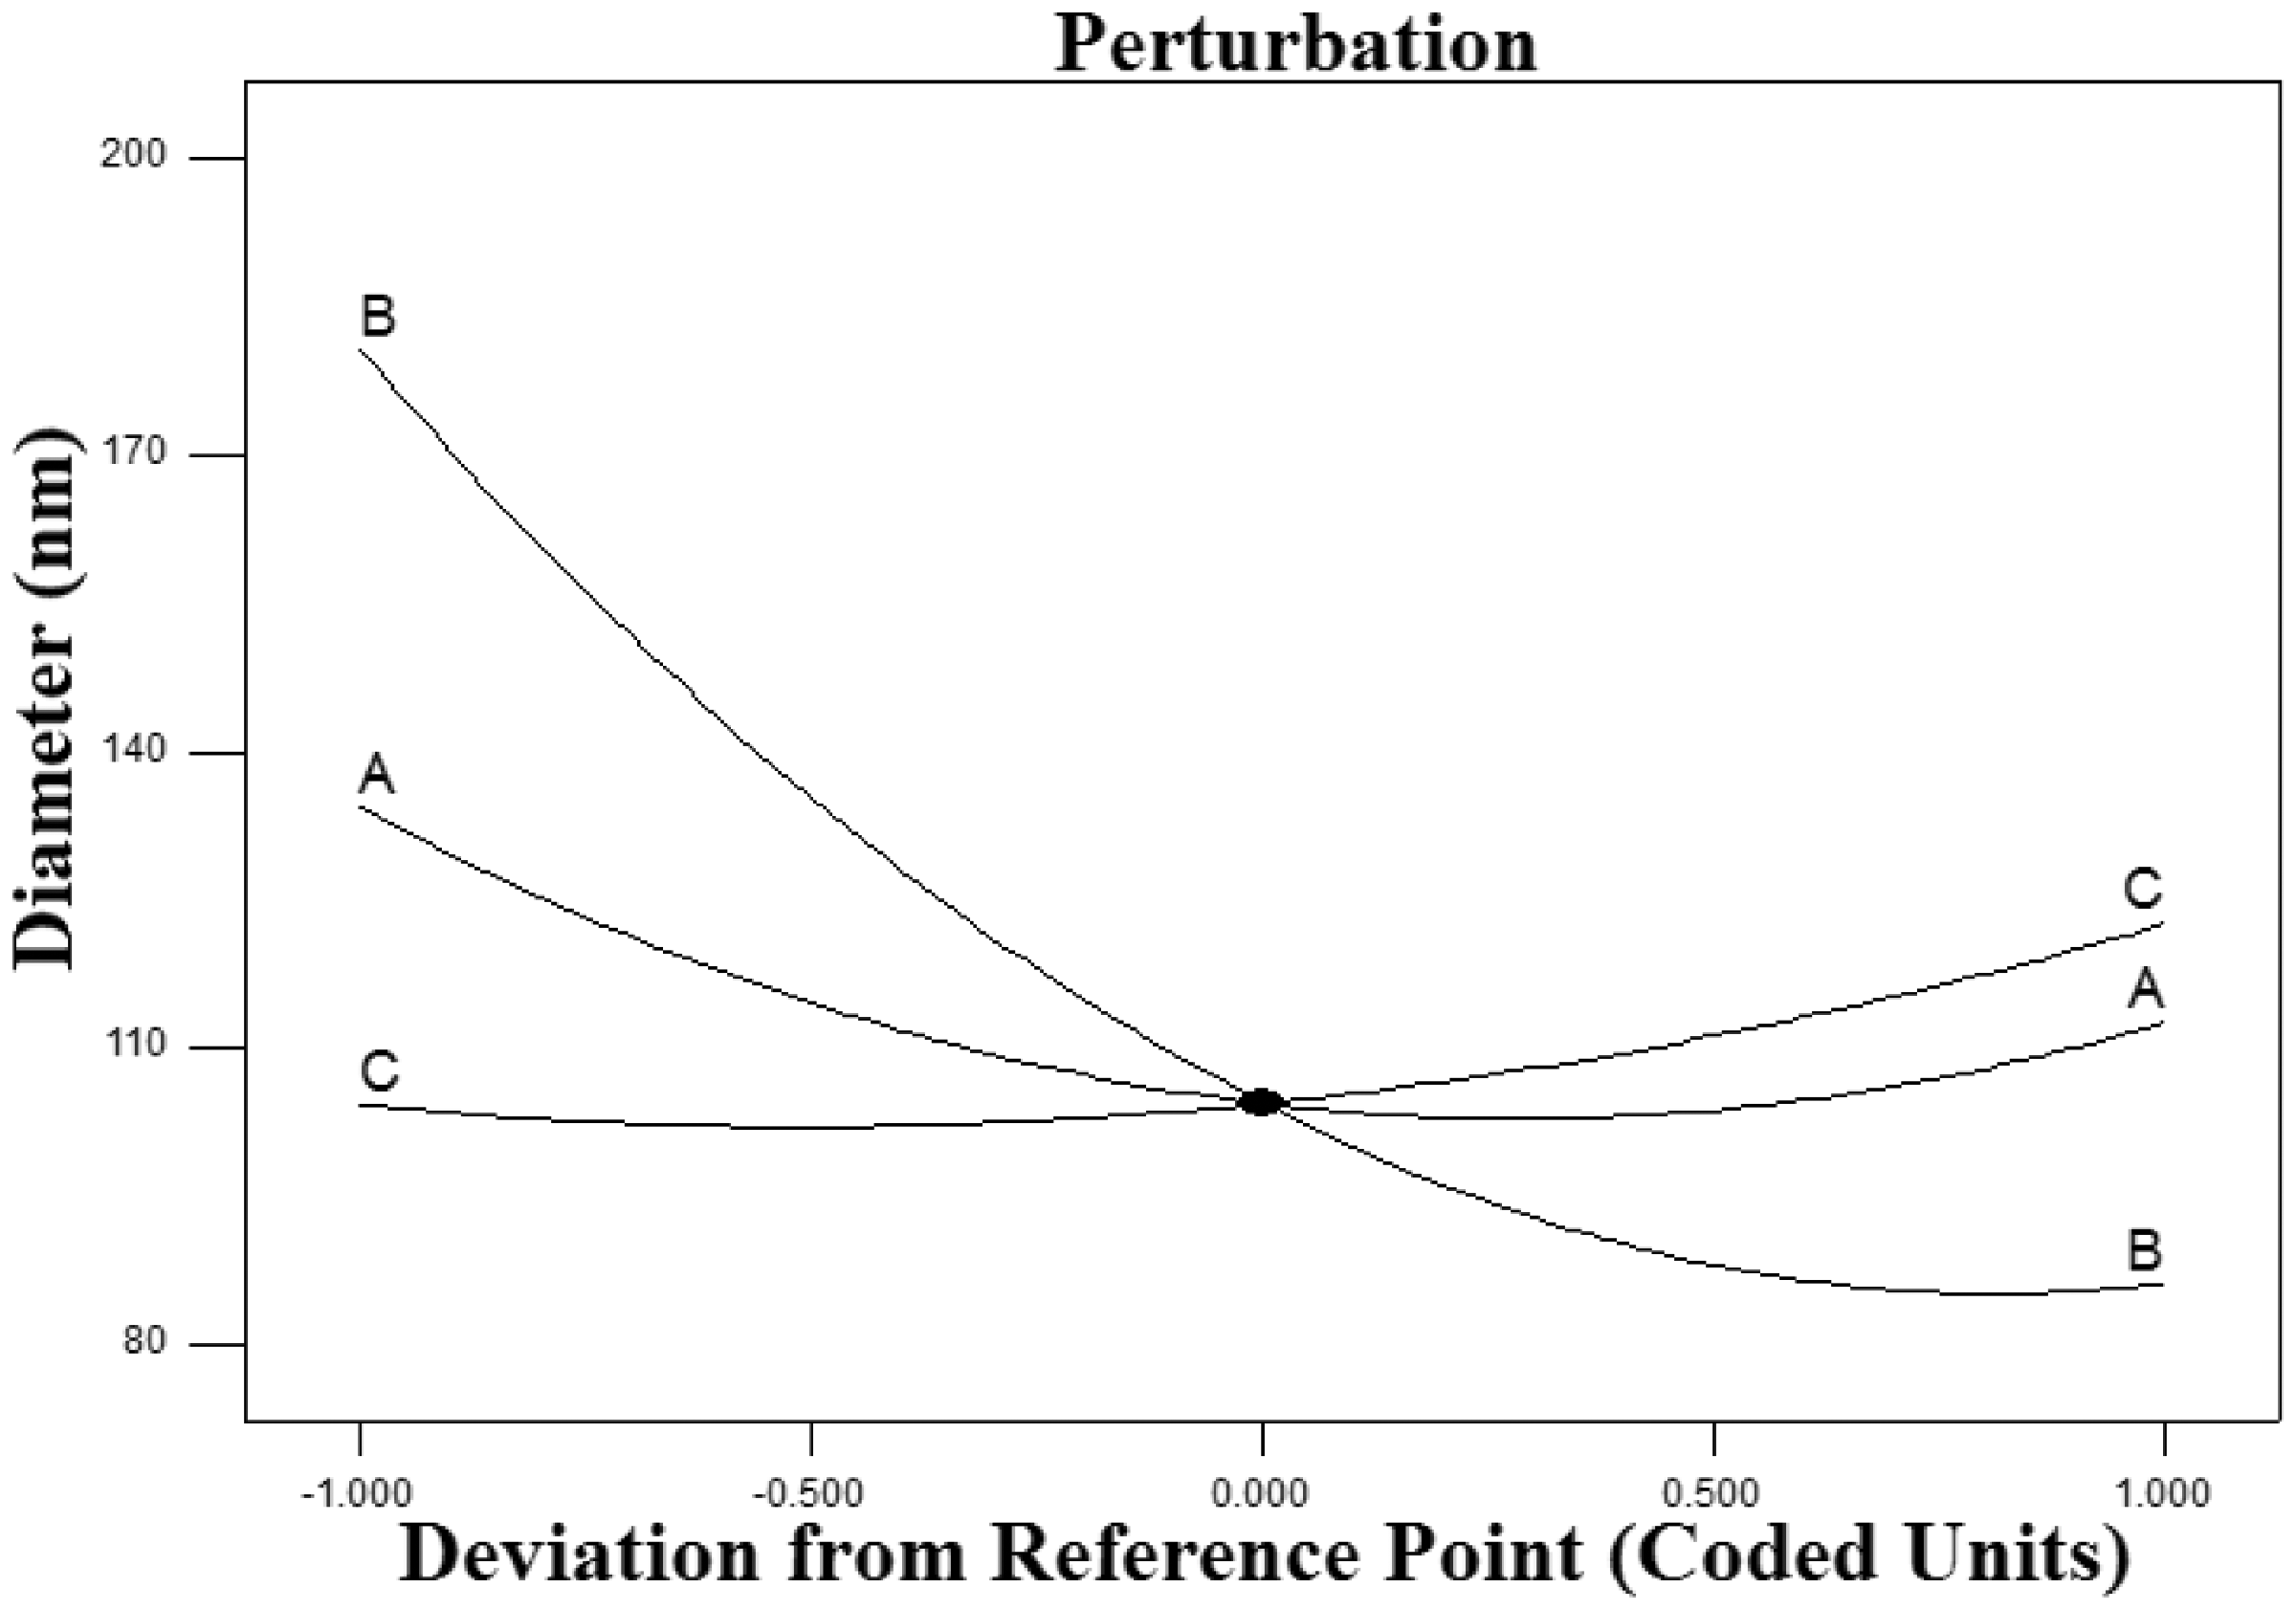
Perturbation diagram of diameter of the nanofibers.
Finally, increasing the percentage of G and reducing the percentage of PCL and PDMS in the composite scaffolds reduced the diameter of the nanofibers. In quadratic behavior, the ratio of the combination of three polymers to the diameter of the nanofibers, was reasonable (See Figure 2).
Nanofiber morphology
The scaffold of PCL/G/PDMS by electrospun with different weight ratios was fabricated. The Three images were taken at the different places of scaffolds. One hundred diameters were measured in each image, and the mean of diameters was analyzed with the origin. Figure 4 was shown SEM images of the different morphology of scaffolds at PCL, G, and PDMS different weight ratios in scaffolds. The runs in Table 1, which indicate the percentages of the three polymers, are illustrated below SEM images.
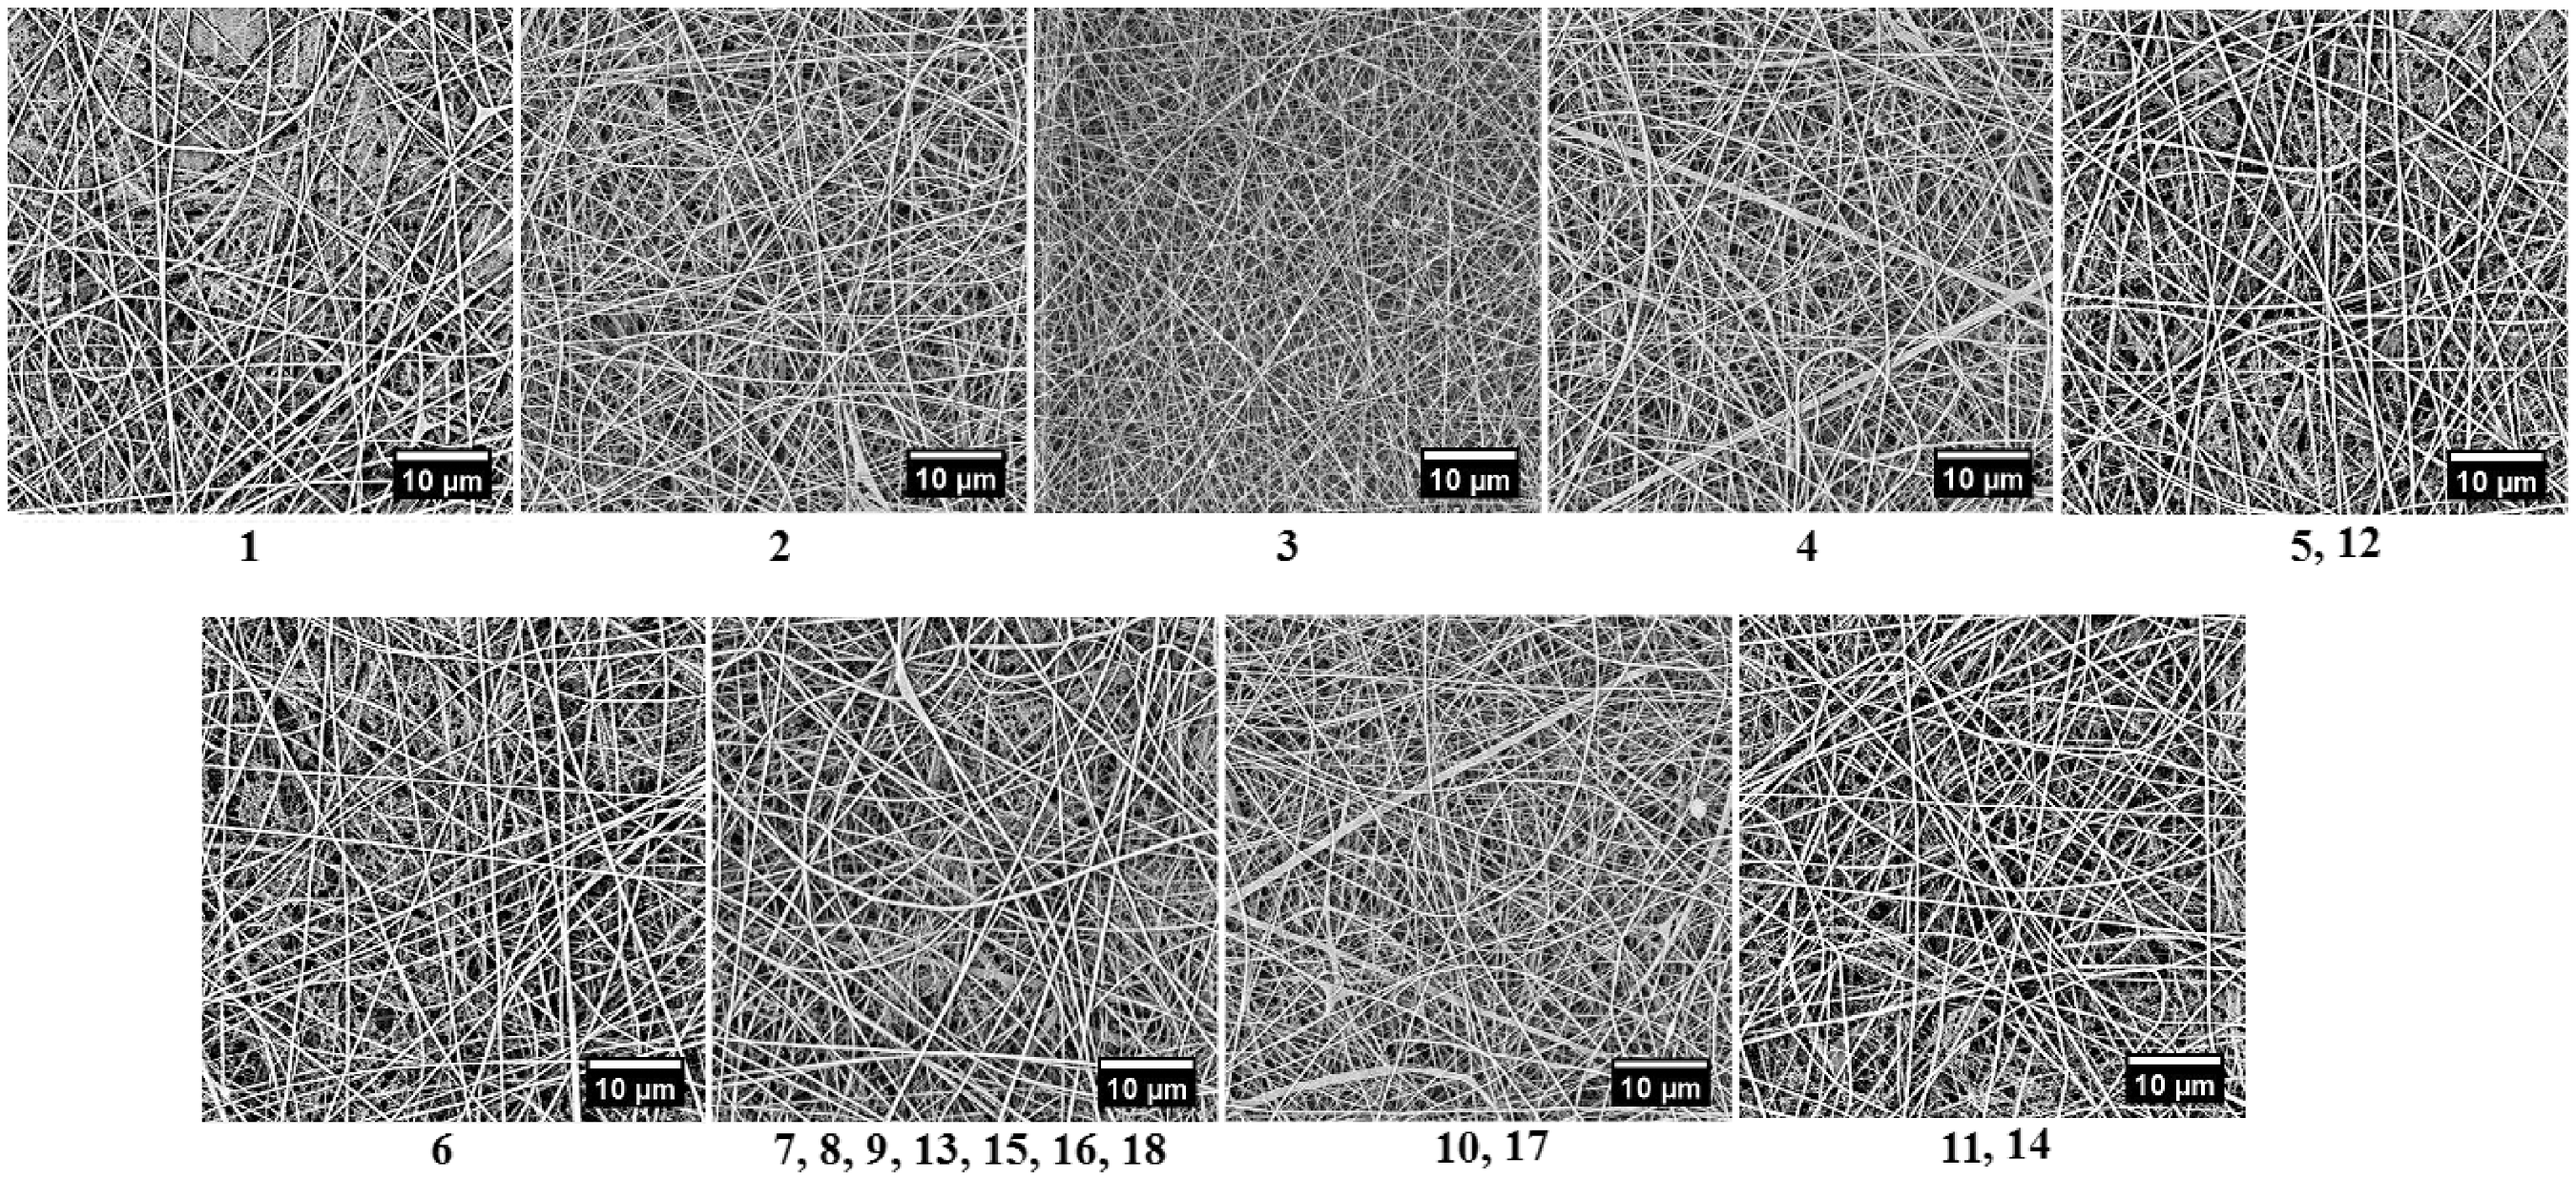
SEM images of the different morphology of scaffolds at PCL, G, and PDMS different weight ratios. The numbers below each image are correspond to the run in Table 1, which represent the three polymers in different percentages of PCL/G/PDMS.
It is clear from the SEM images that with increasing the concentration of gelatin, the amount of networks in the fibers increases. The surface of the fibers in Figure 4 was formed consists of fibers with a diameter of 100–250 nm with a small number of thin (networks, <100 nm) between the nanofibers. SEM images show that these networks consisted of thin nanofibers with diameters of <100 nm and thick fibers with diameters of about 200–300 nm. High viscosity solutions were composed form structures of smaller fibers between larger smooth fibers, forming the continuous web [28].
Scaffold porosity
Scaffold porosity was investigated and the results are shown in Table 2. The ANOVA indicates that the model equations derived by RSM could adequately be used to describe the scaffold porosity. These results predict a quadratic model for scaffold porosity as follows: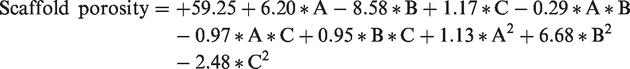
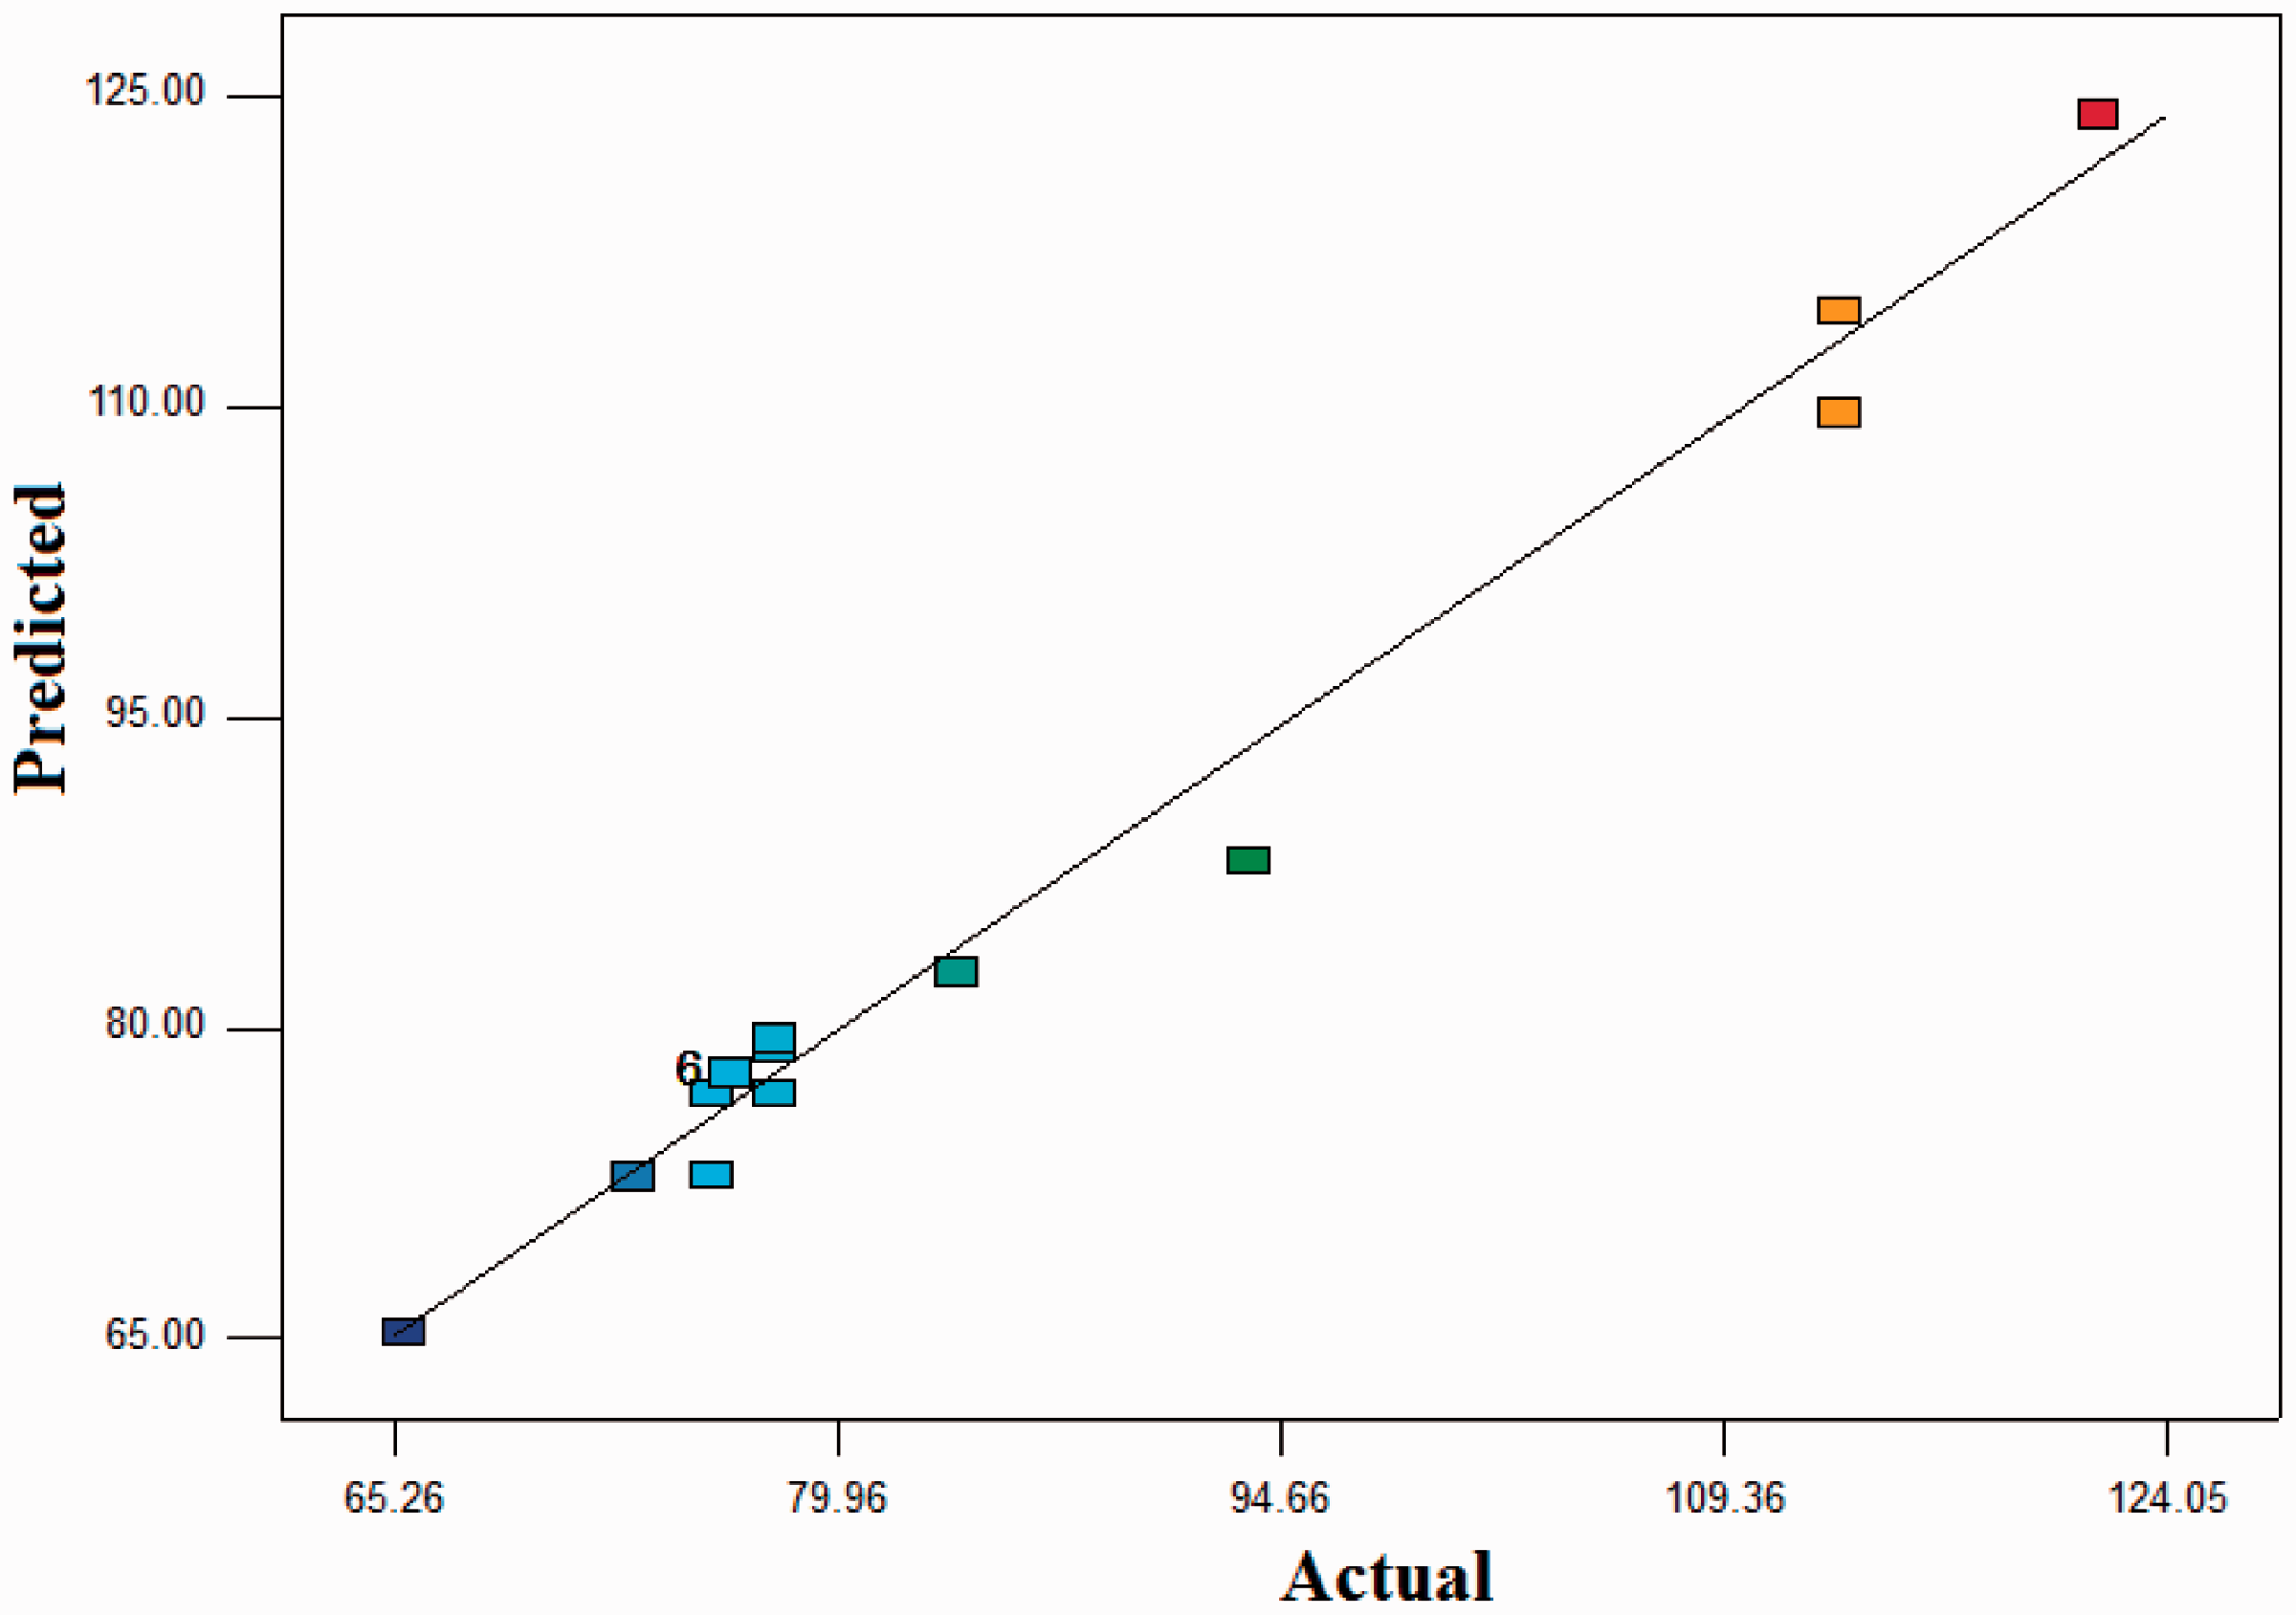
P-values of A, B and B2 were the significance level of 0.05 (Table 3), so the porosity of the scaffolds had a quadratic relationship with the ratio of the mixing of three polymers (PCL/G/PDMS). R2 and Adj-R2 were 0.98 and 0.95, respectively (Table 4). Figure 5 shows the predicted and observed responses, and specifies that experimental models are suitable for porosity of scaffolds.

Actual values versus predicted plots (porosity of the scaffolds).
The effect of the combination of three polymers on the porosity of scaffolds is presented in Figure 6. Increases in the scaffold porosity were in reverse relationship with G percentage and in direct relationship with PCL percentages in the fabricated scaffolds (Figure 6(a)). Figure 6(b) and (c) show that change in the percentage of PDMS polymer has minor effect on the porosity of the scaffolds. As shown in Figure 7, by reducing the percentage of G in a hybrid solution from three polymers ranging from –1 to 1, the porosity of scaffolds increased. This means that the percentage of G has a reverse effect on the porosity of the scaffolds. Also, increasing the percentage of PCL in the hybrid solution showed an increase in the porosity of the scaffolds. Due to the function of quadratic behavior of the G percentage in Figure 6(a), the effect of G polymer on the porosity of scaffolds was higher than the PCL.
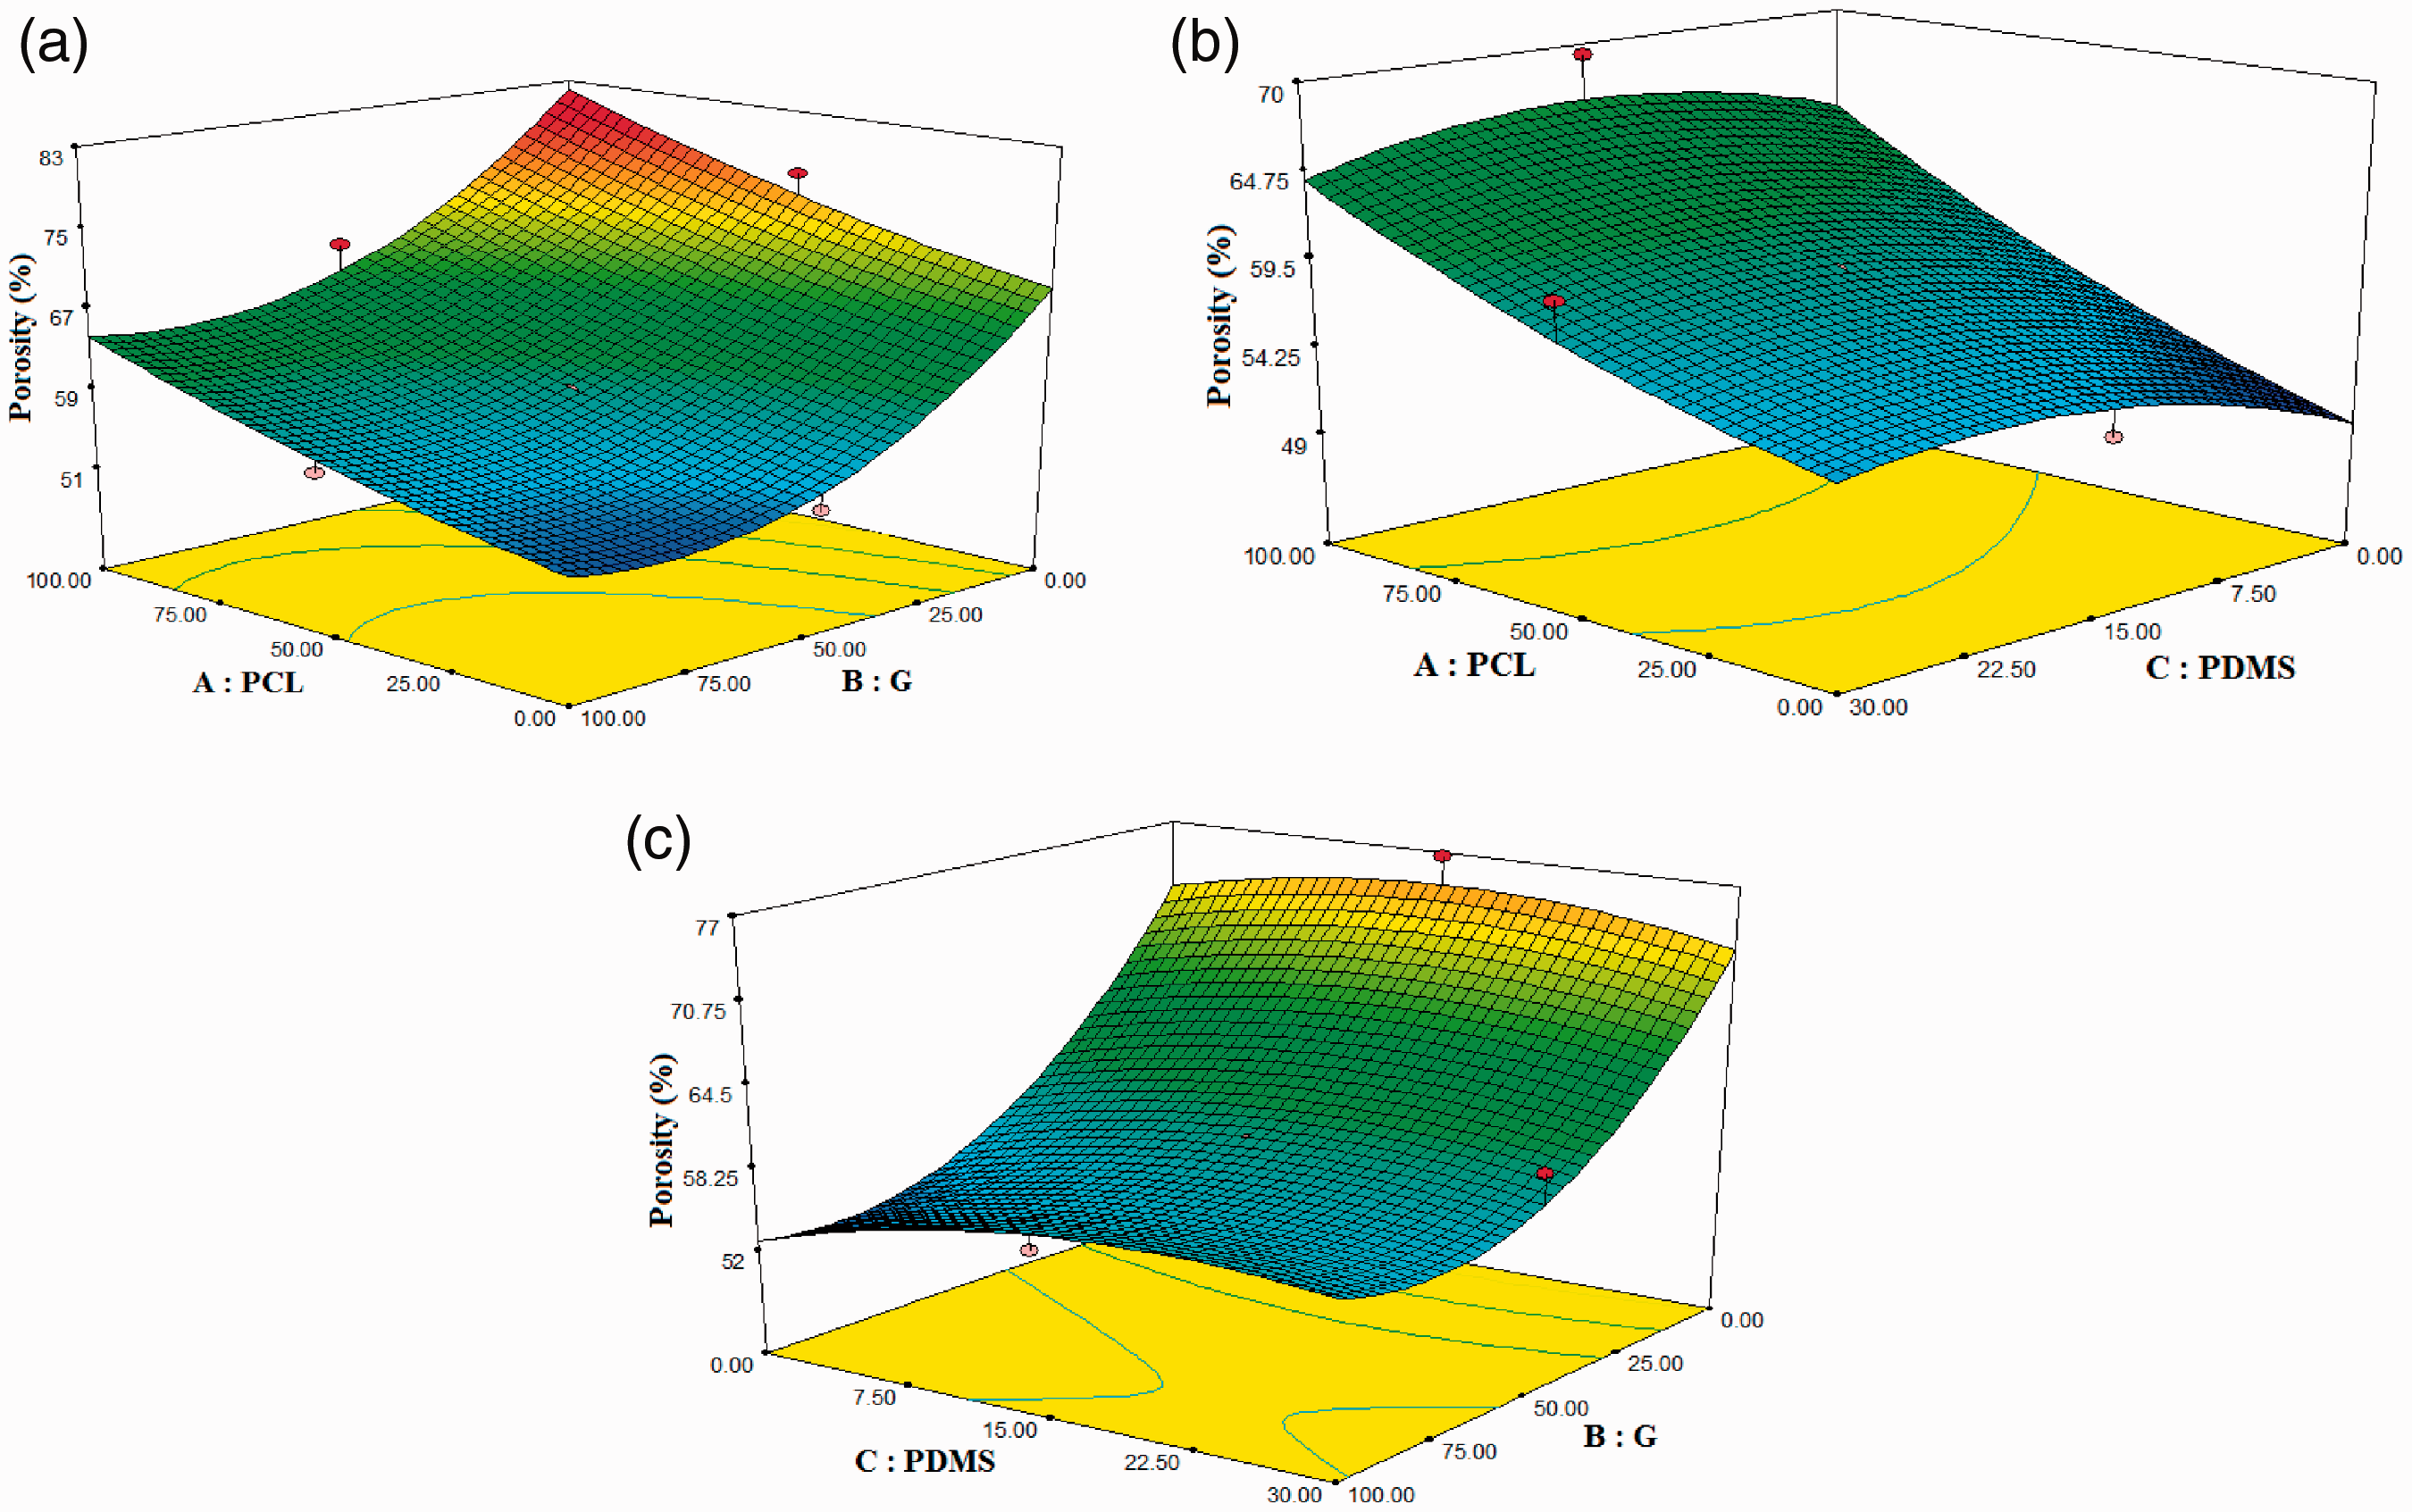
Response surface of porosity of the scaffolds: (a) PCL/G, (b) PCL/PDMS, (c) G/PDMS.

Perturbation diagram of porosity of the scaffolds.
Finally, increasing the percentage of G and reducing the percentage of PCL in the hybrid scaffolds reduced the porosity. The percentage of PDMS polymer was not effective on the porosity of the scaffolds. In quadratic behavior, the ratio of the combination of three polymers to the porosity of the scaffolds, was reasonable (Figure 6).
Water contact angle measurement
Scaffold hydrophilicity was investigated and the results were shown in Table 2. The ANOVA indicates that the model equations derived by RSM could adequately be used to describe the scaffold hydrophilicity. These results predict a linear model for scaffold hydrophilicity as follows:
Actual values versus predicted plots (hydrophilicity of the scaffolds).
The effect of the combination of three polymers on the hydrophilicity of scaffolds is presented in Figure 9. Increase in the amount of contact angle of water droplet with the horizontal surface of the scaffold was due to lower G percentage and more PCL and PDMS percentage in the fabricated scaffolds (Figure 9(a) to (c)). By increasing the percentage of G polymer in a hybrid solution from three polymers ranging from -1 to 1, the hydrophilicity of scaffolds increased (Figure 10). This means that the percentage of G has a reverse effect on the hydrophilicity of the scaffolds. Also, decreasing the percentage of PCL and PDMS in the hybrid solution increased the hydrophilicity of the scaffolds.

Response surface of hydrophilicity of the scaffolds: (a) PCL/G, (b) PCL/PDMS, (c) G/PDMS.

Perturbation diagram of hydrophilicity of the scaffolds.
Finally, increasing the percentage of G and reducing the percentage of PCL and PDMS in the hybrid scaffolds increased the hydrophilicity of their composite scaffold. Thus, linear behavior in the ratio of combination of three polymers to the hydrophilicity of the scaffolds was reasonable (Figure 9). The largest and lowest water contact angles on produced nanofiber scaffolds are shown in Figure 9.
Cell count on scaffolds
Cell growth and proliferation on scaffolds by cell count of scaffolds was investigated and the results are shown in Table 2. The ANOVA indicated that the model equations derived by RSM could adequately be used to describe cell number of scaffolds. These results predicted a quadratic model for cell count of scaffolds as follows:
P-values of B, AB and A2 were less than the significance level of 0.05 (Table 3), so the Cell number on scaffolds had a quadratic relationship with the ratio of the mixing of the three polymers (PCL/G/PDMS). R2 and Adj-R2 were 0.95 and 0.89, respectively (Table 4). Figure 11 shows the predicted responses and observed responses. It indicates that the empirical models for cell count on the scaffolds showed a good fit proportionate to the observed results.
Actual values versus predicted plots (cell count on the scaffolds).
The effect of the combination of three polymers on cell count on the scaffolds is presented in Figure 12. Increase in the number of cell on the scaffolds was due to more G percentage and lower PCL percentage as a parabolic chart and PDMS percentage as a linear graph in the fabricated scaffolds (Figure 12(a) to (c)). By increasing the percentage of G polymer in a composite solution from three polymers ranging from –1 to 1, the number of cell on the scaffolds increase (Figure 13).

Response surface of cell count on the scaffolds: (a) PCL/G, (b) PCL/PDMS, (c) G/PDMS.
Perturbation diagram of cell count on the scaffolds.
Finally, increasing the percentage of G and reducing the percentage of PCL and PDMS in the composite scaffolds increased the number of cells on the composite scaffolds.
Optimization of PCL/G/PDMS scaffold by RSM
RSM method was employed to investigate the morphology, porosity, hydrophilicity and number of cells attached on scaffolds for optimum scaffolds for tissue engineering. Nine optimal percentages of mixing of three polymers were obtained from 18 percent of the proposed model. Optimized points in different blend ratios are summarized in Table 5. The optimal conditions obtained in this study were used to prepare the scaffold for tissue engineering.
Optimized points in different blend ratio obtained by RSM.

The results of nanofiber diameter, hydrophilicity and cell number on scaffold of the first proposed model test of software (PCL percentage: 36.55 (24), G percentage: 84(56) and PDMS percentage: 30(20)) are shown in Figures 14 to 16, respectively.

Morphology of the scaffold using a scanning electron microscope (SEM) of the first proposed model of software.
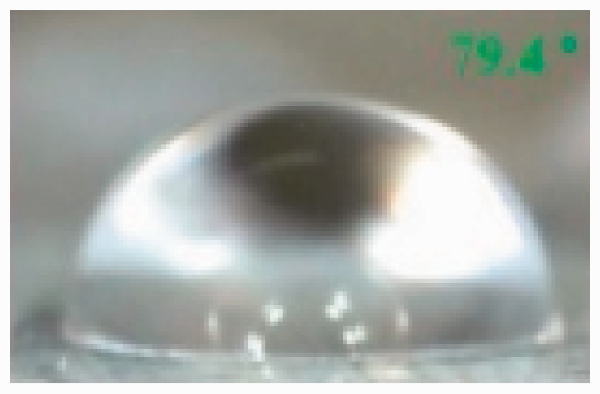
Water contact angle measurement of the scaffolds (79.4°) by the first proposed model of software.
Cell number on scaffold by the first proposed model of software.
The cell infilterating
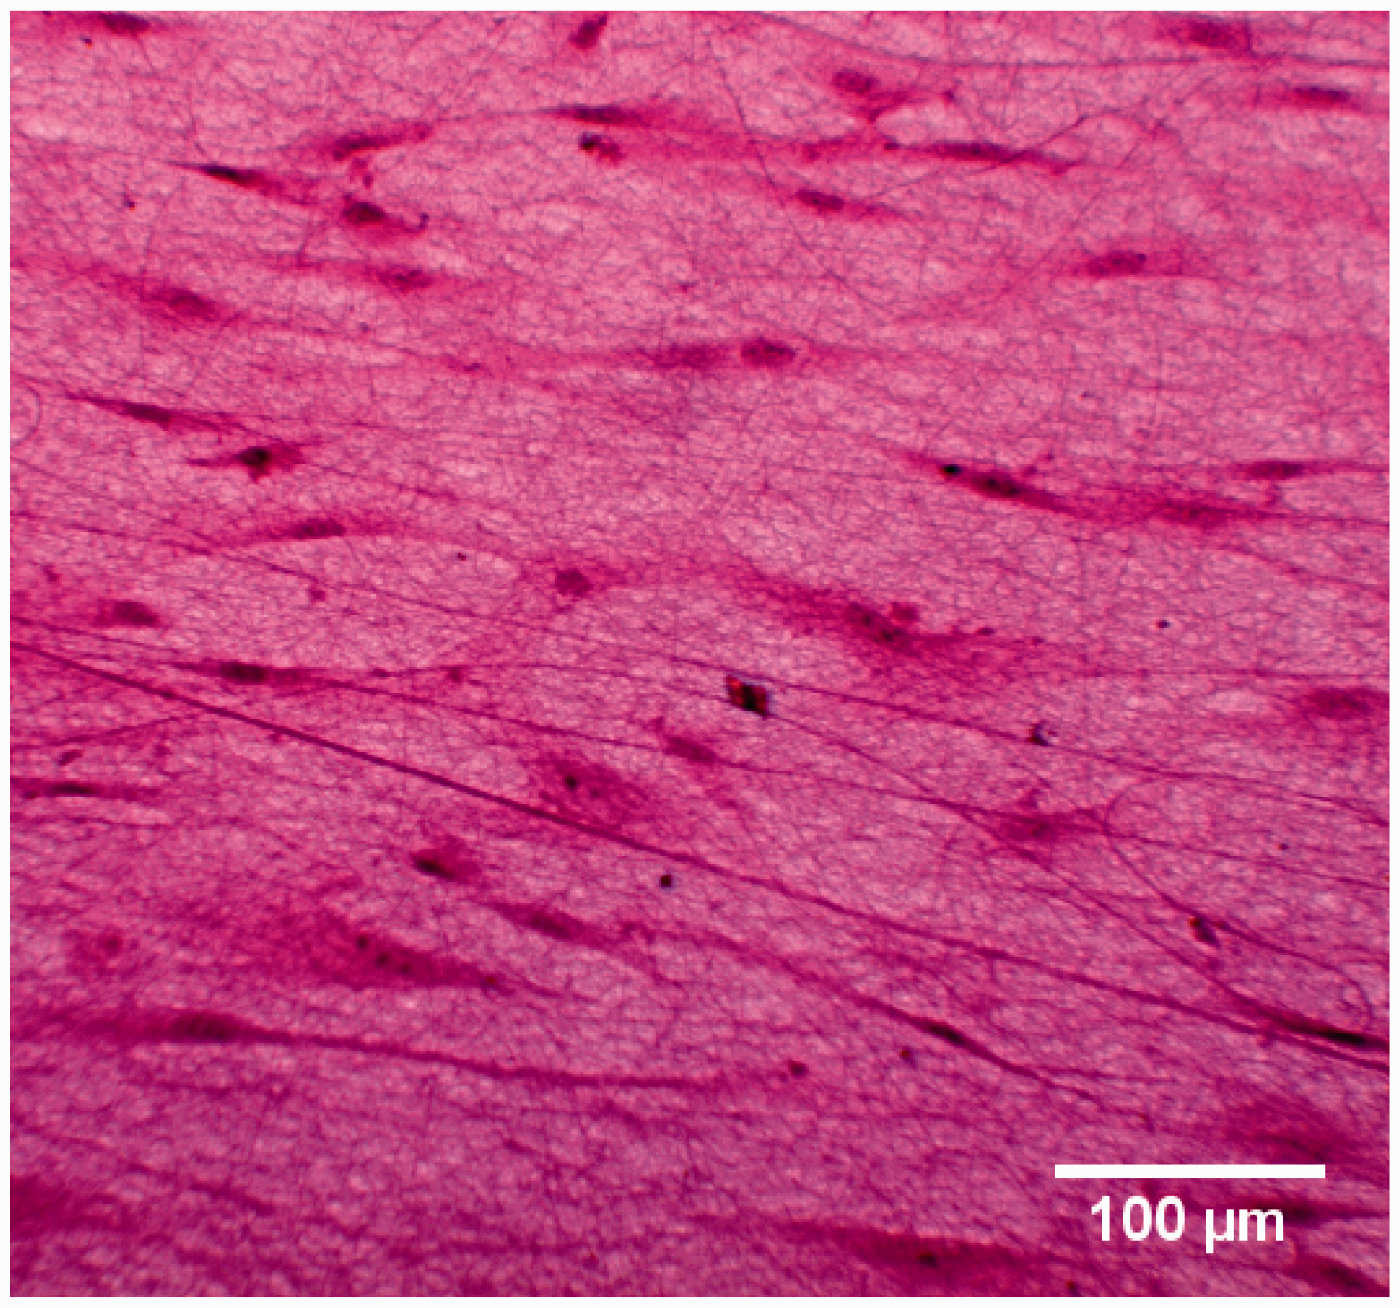
In order to investigate the penetration of cells inside the scaffolds, cell culture was performed on thick scaffold (the first proposed model test of software) containing 10 layers of scaffold, and three days after cell culture, the cut scaffolds transversely were stained by H&E. The Figure 17 shows that the cells have penetrated inside the scaffolds. The infilterating cells inside the scaffold are marked with an arrow in Figure 17. This indicates that the porosity of the scaffolds is suitable for cell infilterating.
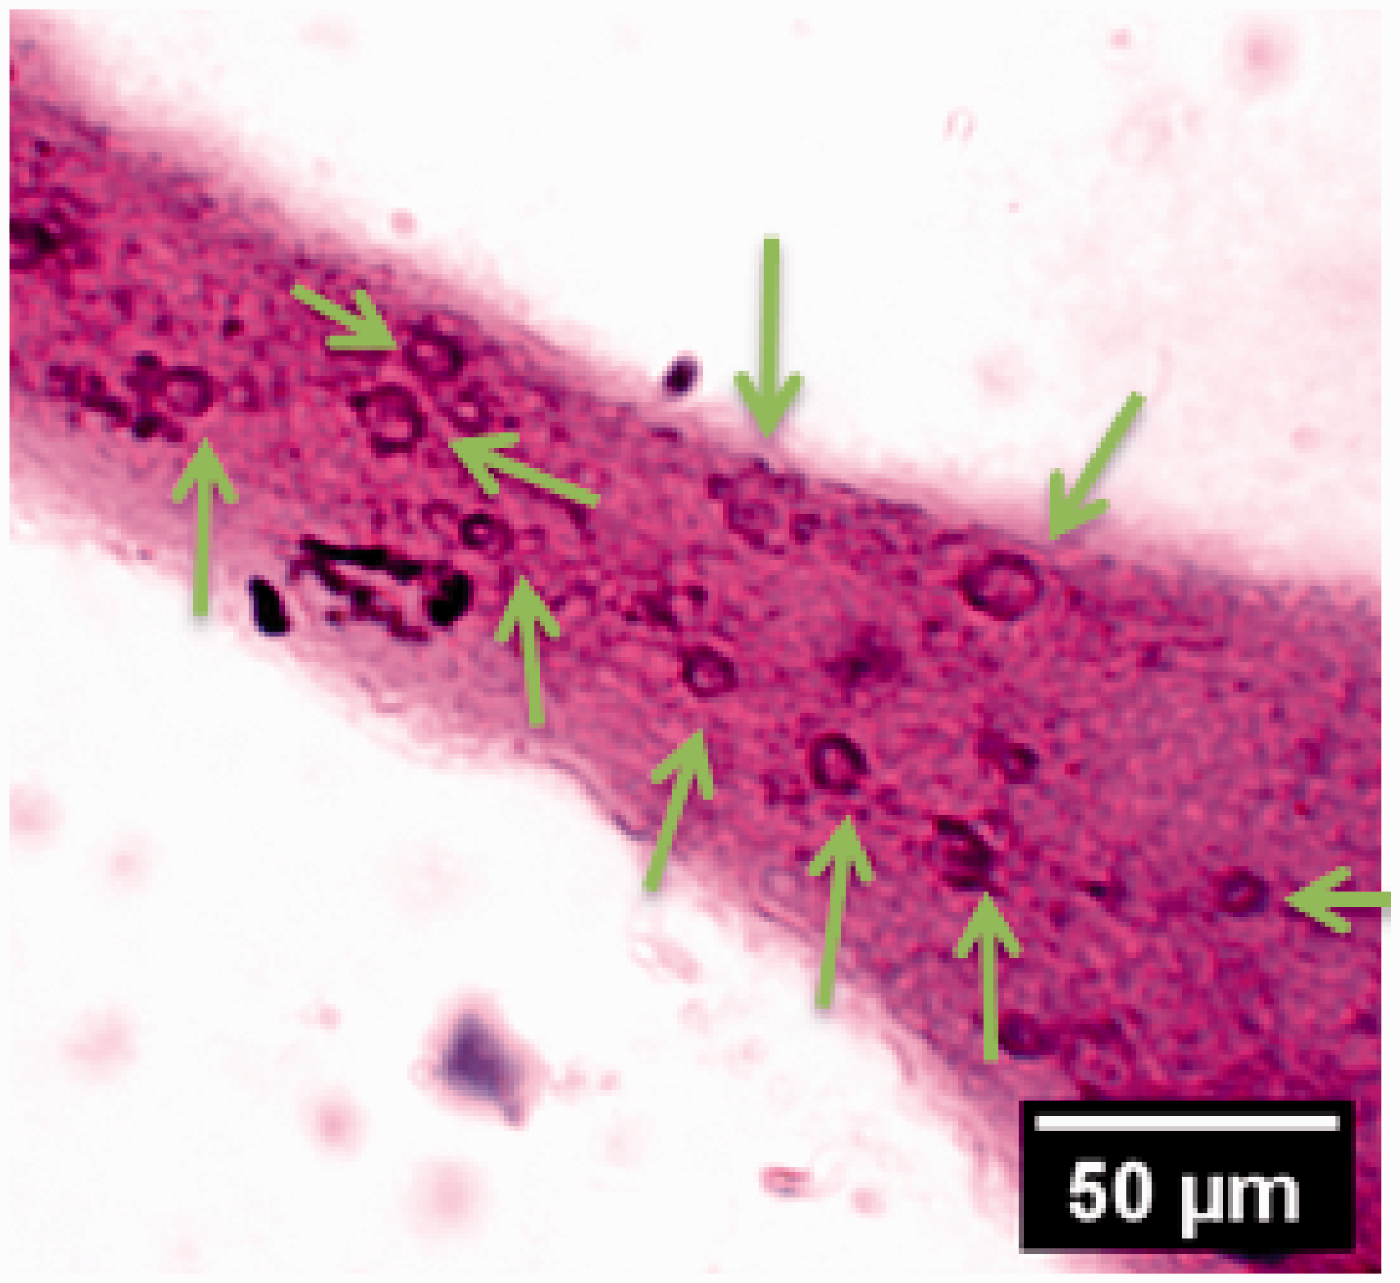
The infilterating cells inside the scaffold.
In general, the data obtained in this paper make it possible to select different percentages of three polymers in the hybrid scaffolds to support attachment and proliferation of fibroblast cells. Each of these three polymer percentages can be used for specific tissue engineering purposes, depending on the tissue.
Conclusion
In the present study, the morphology, porosity, hydrophilicity of the PCL/G/PDMS scaffolds and the number of proliferated cells on the scaffolds in 3 days were optimized with RSM. The RSM used central composite design to calculate the minimum diameter, the maximum porosity and hydrophilicity of scaffolds and the maximum proliferated cells on the scaffolds based on several experimental sets. Therefore, RSM screened the candidate material in each frequency and optimized the composition using 18 of the composites. The results showed that the morphology, porosity, hydrophilicity of the PCL/G/PDMS scaffolds and the number of proliferated cells on the scaffolds had a quadratic relationship with selected operational parameters. Increase in the concentration of applied PCL and PDMS polymers in the mixture of three polymers caused an increase in nanofiber diameter and scaffold porosity and a reduction on hydrophilicity and cell number on scaffolds. Increasing the concentration of G polymer in the polymer solution has reduced the diameter and porosity of the scaffolds and increased hydrophobicity of the scaffolds and the number of cells on the scaffolds. This optimized elastic scaffold is designed for tissue engineering.
Footnotes
Acknowledgements
The authors would like to thank Stem Cell Biology Research Center and Biotechnology Research Center of Yazd Reproductive Sciences Institute for their collaboration in this research.
Declaration of conflicting interests
The author(s) declared no potential conflicts of interest with respect to the research, authorship, and/or publication of this article.
Funding
The author(s) disclosed receipt of the following financial support for the research, authorship, and/or publication of this article: This work was supported by Iran national science foundation (No. 97014466).