
Abstract
Green composites have ecofriendly features that are technically and economically feasible while minimizing the pollution. It refers to the combination of degradable fibers mostly cellulosic materials and natural resins to develop green composites. Since mechanical performance of such structures is a concern for industry, by playing with the position and pattern of yarns in woven fabric, these properties can be optimized. This research focuses on the development and characterization of novel 3D woven jute/green epoxy composites having hybrid interlocking patterns. Four conventional derivatives of 3D woven fabrics i.e. orthogonal layer to layer (OLL), orthogonal through thickness (OTT), angle interlock layer to layer (ALL), angle interlock through thickness (ATT) and three novel 3D woven fabrics i.e. H1 (combination of OTT and ATT binder yarns), H2 (combination of OTT and ALL binder yarns), H3 (combination of orthogonal layer to layer warp and weft interlock called as bi-directional interlock) were developed using different binding patterns on dobby loom. Tensile, flexural, and short beam shear tests were performed to check the mechanical performance of the developed composites. OTT composite structure showed the highest values of tensile strength, modulus, and maximum force both in warp and weft directions as compared to the other 3D interlock structures, due to least interlacement/crimp of binder yarn. While ATT composite exhibited the highest value of flexural strength and modulus both in warp and weft directions due to through thickness angle binder yarns. H3 composite showed the highest values of force and short beam shear strength in warp direction.
Keywords
Introduction
Green composites are materials having ecofriendly attributes that are technically and economically feasible while minimizing the generation of pollution. In this context it refers to the combination of fully degradable fibers and resins to develop green composite materials [1,2]. Environmental awareness and protection are among vital factors that motivate several researchers to explore the potential of natural fibers as composite material in industries such as packaging, automotive and building constructions. Natural fibers are low cost, lightweight, available in abundance, and most important is their biodegradability features [3,4]. Depending upon the woven reinforcements, generally, natural fiber reinforced composites are of two types i.e. two dimensional (2D) and three dimensional (3D). 2D woven composites have certain disadvantages like delamination and poor through thickness properties. In certain high-performance application areas, 3D woven composites are preferred.
Three dimensional (3D) woven fabric architectures are described by the development of the binding warp yarns inside the fabric thickness joined with the number of weft yarns and place of binding warp yarns can be decided by the weave design [5]. Three dimensional (3D) woven composites got attraction in advanced structural applications due to their high strength to weight ratio, better through the thickness properties, compressibility, drapability, ease of handling, structural stability and integrity, ability to adapt complex geometries, resistance to delamination and higher resistance to elongation under strain as compared to the conventional laminated (2D) composites [6–10].
Depending the direction of interlacement of Z yarn, 3D woven structures are classified into two major categories: multilayer orthogonal interlock (OI) and multilayer angle interlock (AI) [11]. Each of these are further divided into layer to layer (LL) and through thickness (TT) structures [12–14]. Also, hybrid woven structures can be made by combining any of these different 3D structures and using stuffer yarns to get required mechanical performance depending upon the target applications [15–18].
Different researchers have compared the tensile strength and elongation at break of four different types of 3D woven composites and revealed that, to get a dimensionally stable and mechanically strong composite, straight arrangement of yarns/filaments would be preferred and hybrid material would also affect the effective stiffness and strength [19,20]. While binder yarn volume fraction would not have significant effect on in plane strength but increase in binder yarn volume fraction from 3% to 6% would affect the out of plane properties and increase the delamination resistance of 3D through thickness angle interlock during flexural test [21].
3D woven interlock composites showed superior impact resistance, knife penetration resistance, delamination resistance, compressive strength and DMA behavior as compared to the unidirectional and laminated counterparts [22–24]. 3D woven composites absorbed 25% more impact energy and 12-18% more breaking load as compared to the 2D woven composites [9]. Also, 3D woven composites showed higher storage modulus [25]. Yarn waviness could reduce the in-plane properties but straighter yarn had significant effect on the compressive strength of angle interlock composites [26]. During flexural test, 3D orthogonal composites showed significantly higher normalized flexural strength (42% higher) and moduli (32% higher) as compared to the laminated composites with similar fiber volume fraction [27,28].
The mechanical performance of 3D woven composites (orthogonal, OI; layer to layer, LL; angle interlock, AI) under on-axis loading principally depends on the yarn orientation and fiber volume fraction of warp and weft yarns. While these 3D composites exhibited the best performance (highest failure strain and failure strength) and the highest energy absorbed under off-axis loading due to interlocking mechanism of z-yarn. The interlocking pattern increased the rotation angle of both warp and weft yarns thus increasing the ability of yarn to bear off-axis strain [29]. Under soft impact no visible delamination was observed in 3D orthogonal carbon/carbon composites as compared to the laminated composite which showed prominent delamination and tensile fracture [30]. Also, voids and micro cracks of the composite in the fiber yarn were two major manufacturing defects in composites and with 0.51% void volume fraction, tensile strength of the 3D orthogonal composite was reduced to 13.2% as compared to the intact material [31]. Absence of crimp and minimal waviness in 3D through thickness orthogonal woven structures, would be the major advantages in quasi-static tensile strength [32].
During the 3-point bending fatigue test of 3D angle interlock composites, it was found that fatigue life was decreased with the increase of stress level and initial stiffness was decreased gradually with the increase in testing cycles [33]. 3D orthogonal interlock composite could carry more elastic bending load but carry shorter period of fatigue life under the specific stress level than 3D angle interlock composite [34]. In fully interlaced and semi-interlaced 3D structures, yarn to yarn spaces were higher as compared to the traditional 3D structures due to the directional interlacement [35]. Furthermore, with the increase in fiber volume fraction of z-binder yarns, fracture toughness and fatigue resistance were increased gradually. However, the steep angle caused the z-binder yarns bridging the delamination crack to deform and fail in shear and through-thickness tension, rather than in-plane tension which usually occurs in thick 3D woven composites [36].
3D woven composites were also used in different smart applications like in acoustic emission [37], these were used to check the in-plane tensile properties and damage progression in the structures. Similarly, polymer optical fibers were also embedded in 3D orthogonal composites as in-situ sensors to detect damage during impact, bending loads [38,39] and strain measurement [40], while piezoresistive fibrous sensors [41] were used for mapping of compression and traction at the top and bottom sides of reinforcement during bending test.
No relevant literature was found on the effect of hybrid binding patterns in the 3D woven composite structures with stuffer yarns on mechanical properties. In this study, novel 3D woven structures were produced with the hybrid interlocking patterns and converted into their corresponding composites using compression molding technique with green epoxy resin. The influence of the 3D interlocking patterns, and binder yarns on tensile, flexural, and short beam shear properties of the composite structures were studied.
Materials and methods
3D Woven fabric structures
Jute yarn was used to produce four layered 3D woven interlock fabrics/reinforcements, because jute is biodegradable, cheaper, and renewable/sustainable. Also specific tensile modulus and tensile strength [42] of jute is comparable with E-glass filament yarn. The linear density of jute yarn used was 8 lbs/spindle (278 tex). Yarn tensile strength tests (ASTM 2256) were conducted on Uster Tensorapid and average tensile strength of jute yarn was 99.44 cN/tex.
Seven different types of four layered 3D woven interlock fabric structures (Table 1) were produced on terry loom having dobby mechanism. Threads per centimeter were counted as per standard ASTM D 3775 for each sample as given in Table 1. Woven fabric samples were prepared with maximum width of 48 centimeters.
Woven fabrics/reinforcements specifications.
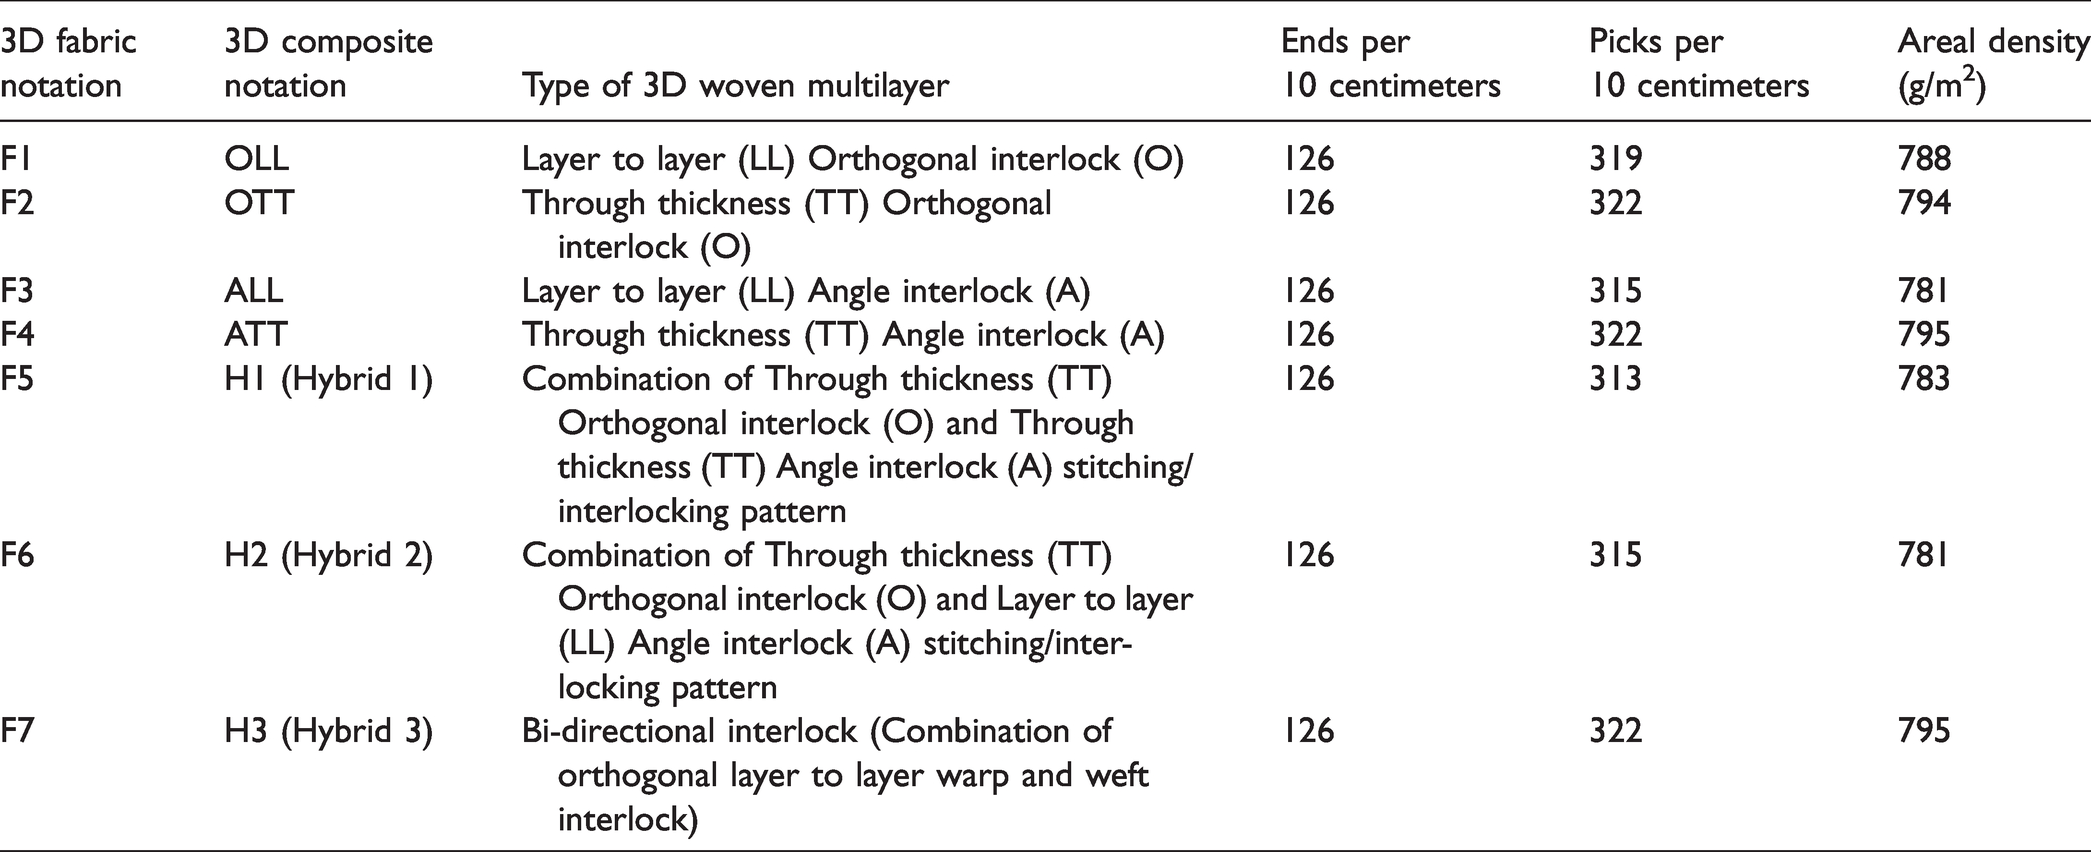
In F1, F2, F3, F4, F5 and F6 structures extra stuffer yarns were used in warp direction while in F7 structure, warp interlock structure was stacked over the weft interlock, and weft interlock was stacked over the warp interlock structure alternatively. F1, F2, F3 and F4 fabric/reinforcements were the four basic types of 3D interlock structures i.e. orthogonal layer to layer (OLL) and orthogonal through thickness (OTT) and angle interlock layer to layer (ALL) and angle interlock through thickness (ATT) with extra stuffer yarns in warp direction. While F5(H1) hybrid 1 and F6(H2) hybrid 2 with extra stuffer yarns, and F7(H3) hybrid 3 reinforcements were prepared using the combination of more than one stitching/interlocking patterns as given in Table 1. Cross sectional views of F1 to F6 and schematic view of F7 are shown in Figure 1.

Cross sectional views of F1 to F6 woven fabric structures and schematic view of F7 woven fabric structure.
Composite fabrication
3D woven fabric structures i.e. F1, F2, F3, F4, F5, F6, F7 were fabricated to their corresponding composites and named as OLL, OTT, ALL, ATT, H1, H2 and H3 respectively for composites. Green epoxy resin was applied using the hand lay-up technique and then this uncured composite plate was placed between the compression plates for 3 hours using 15 bar pressure for complete consolidation and curing of composite plate. The fiber volume faction of the produced composite plates was 32% ± 0.5. Thickness of seven different 3D woven composites i.e. OLL, OTT, ALL, ATT, H1, H2 and H3 was 3.73, 3.45, 3.68, 3.40, 3.76, 3.70 and 3.80 mm, respectively. Warp wise cross-sectional views of 3D woven composite samples are shown in Figure 2.
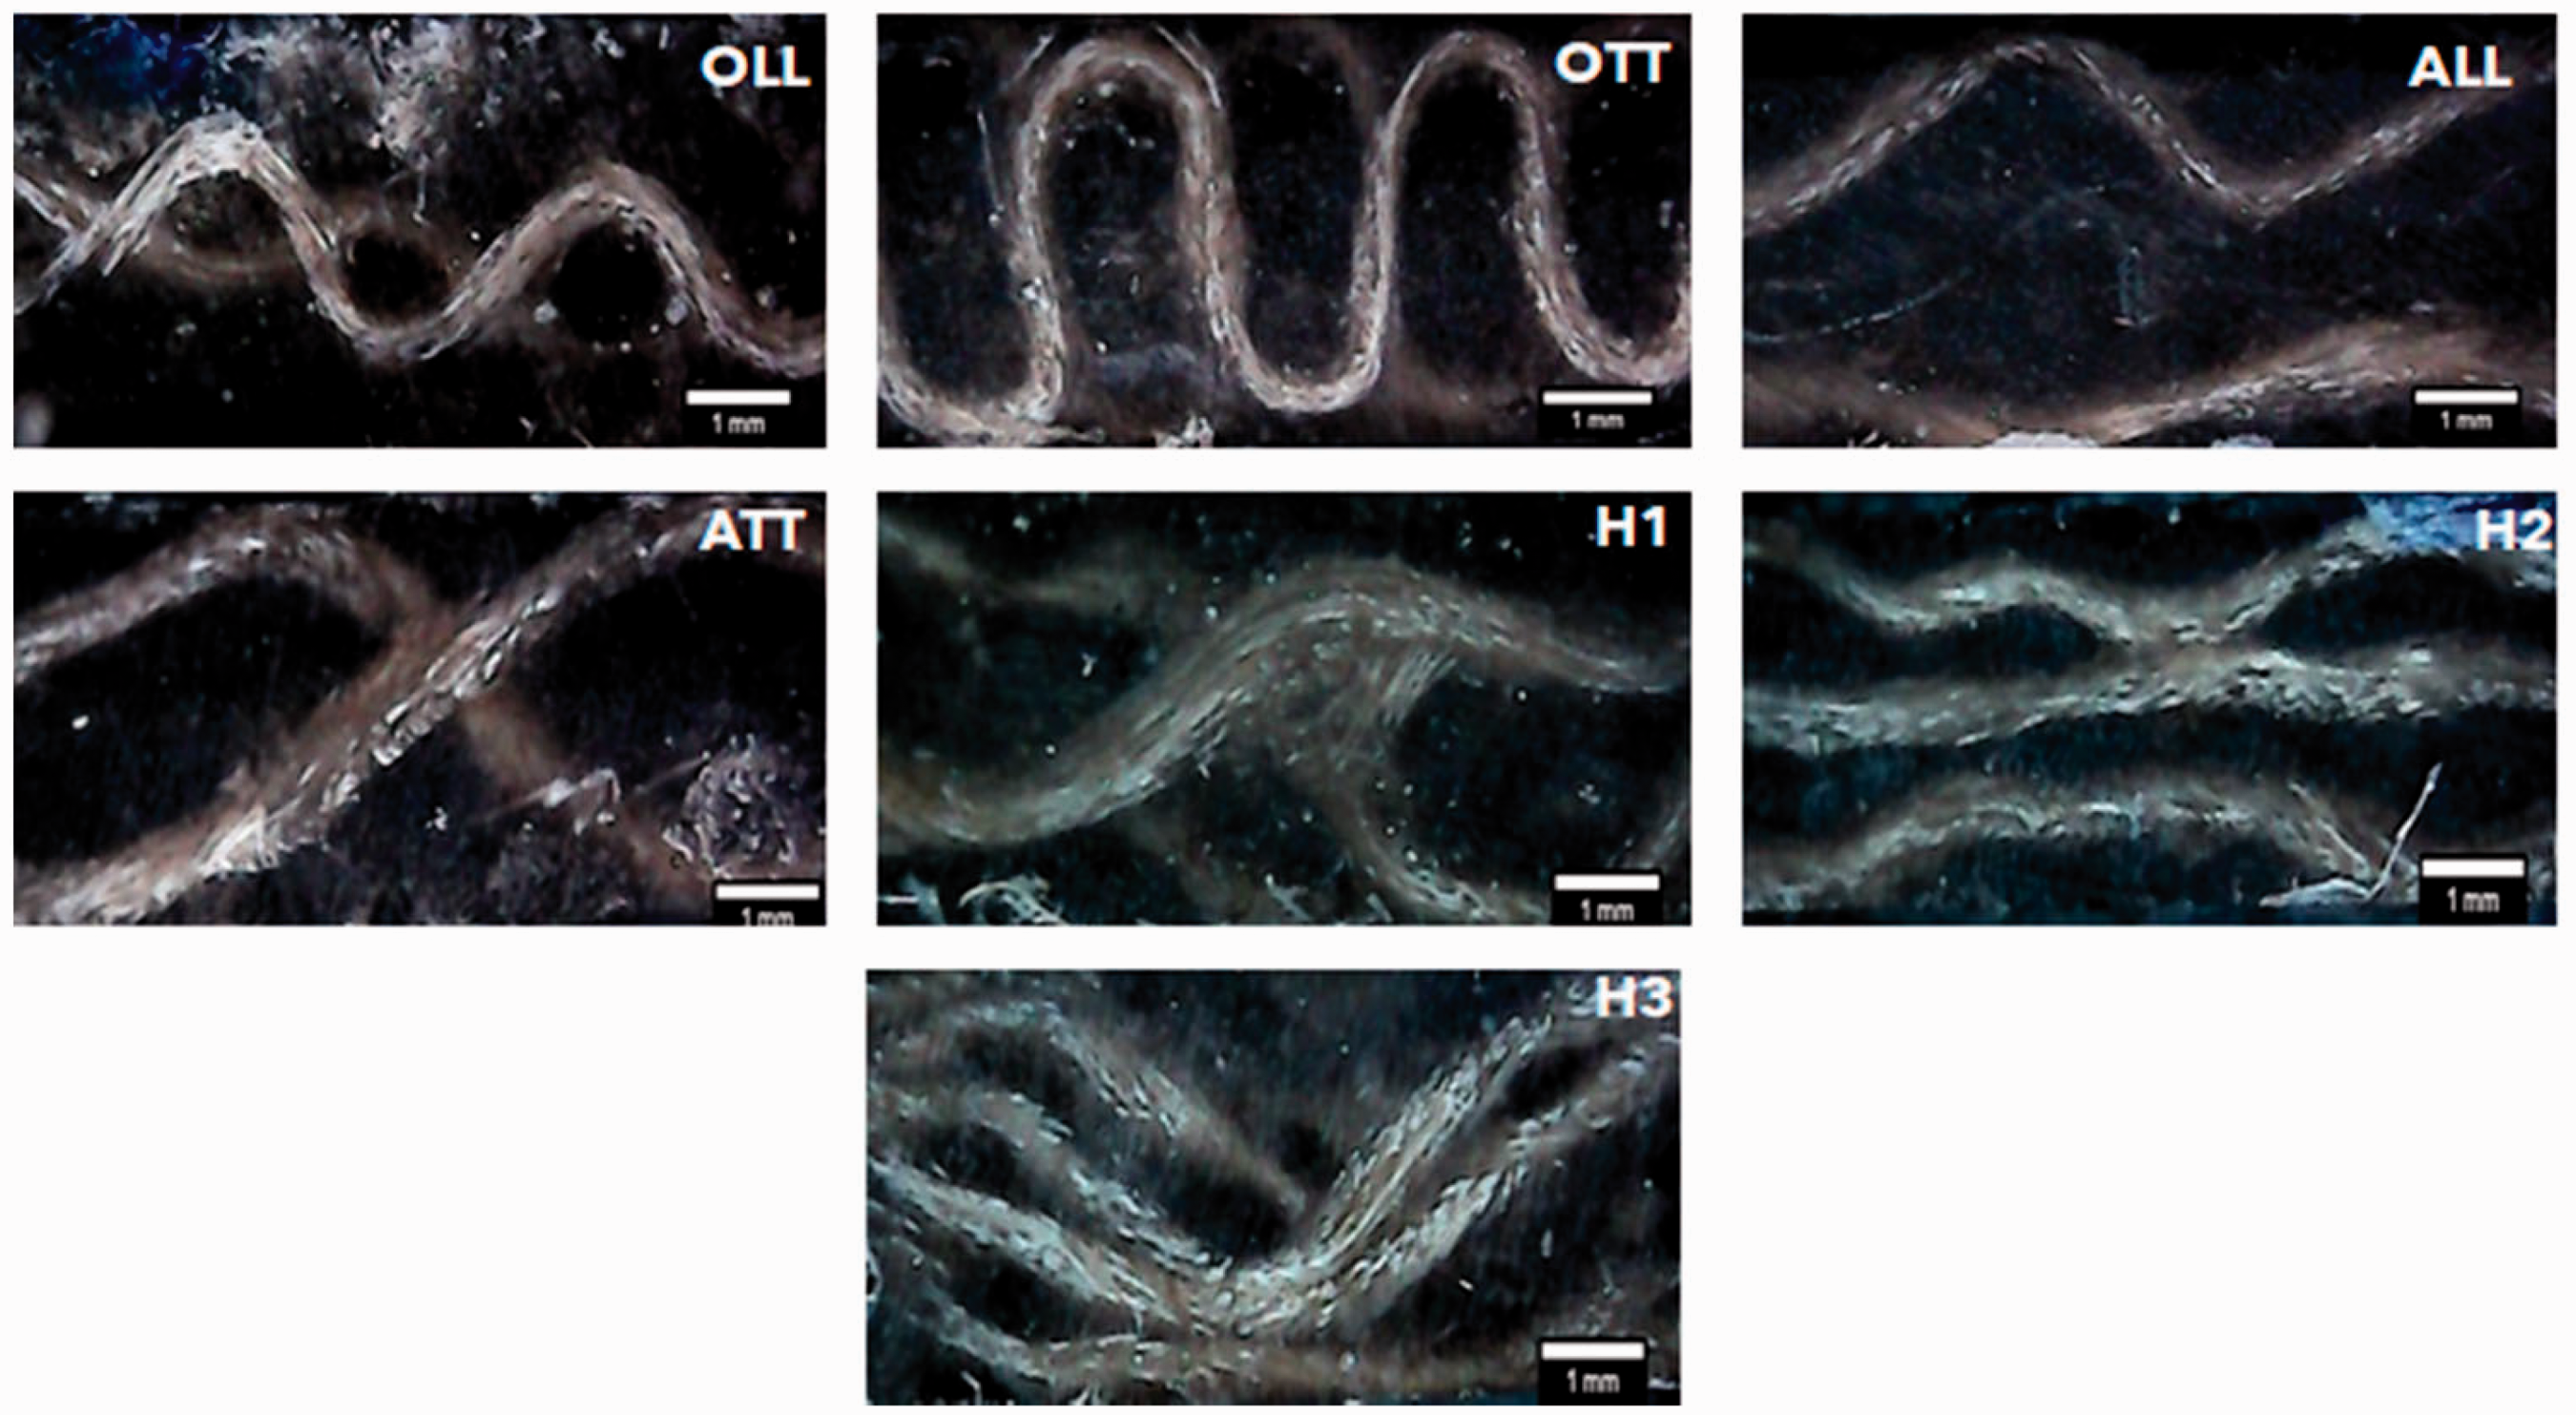
Warp wise cross-sectional views of 3D woven composites.
Two component green epoxy resin CHS-EPOXY G530 was used during composite manufacturing which was supplied by Spolchemie Pvt. Ltd Czech Republic. It was a universal un-modified liquid low molecular weight epoxy resin based on bisphenol A. As is known, green epoxy and jute yarn would degrade after certain time, so finally the composite structure would deform and would not harm the environment. Cycloaliphatic amine (Telalit 0600) was used as hardener. Resin and hardener were used with 3:1 ratio. Nowadays, bio resins are preferred in structural and automotive application [43-45]. Degradable content in the green epoxy resin was 28%. Also, fiber volume fraction for the composite was calculated using the equation (1).
Vf represents the fiber volume fraction, mf denotes the mass of fiber, mr represents the mass of resin while df and dr denote the density of fiber and resin respectively in the composite.
Characterization
The mechanical performance of the 3D woven composite structures was investigated by; tensile (ASTM D3039), flexural (ASTM D7264), and short beam shear (ASTM D2344) tests using the universal testing machine (Z100 All-round, Zwick Roell) having capacity 100 KN. Tensile properties were tested using the sample dimensions; 250 mm long and 25 mm wide, while flexural (3-point bending) properties with sample size; 120 mm long and 13 mm wide and short beam shear properties were tested with the sample dimensions; 30 mm long and 10 mm wide. The rate of loading for tensile, flexural, and short beam shear tests was 2 mm/min, 1 mm/min, 1 mm/min respectively [46-48]. Three repetitions of each test were performed, and average of the curves and results were reported. Statistical analysis was performed to check the significance of each testing result using the One-Way ANOVA (Tukey) technique. Minitab 18® software was used to perform the statistical analysis. Also, microscopic images of the samples were taken to highlight their cross-sections and fracture analysis. Testing fixtures of three performed mechanical tests are shown in Figure 3.

Testing fixtures of (a) tensile, (b) flexural and (c) short beam shear tests.
Results and discussion
Tensile properties
Tensile properties of 3D interlock composite structures were checked both in warp and weft directions to check the effect of binder yarns on the composite structures. Tensile stress versus extension (%) curves of seven different 3D woven composites in warp and weft directions are shown in Figure 4(a) and (b) respectively. In weft direction, maximum values of tensile stress and extension percentage values were higher as compared to the warp direction due to the higher number of weft yarns. All samples showed quasi-linear extension behavior leading towards brittle fracture at the end of each curve both in warp and weft directions. The difference was found in the maximum value of tensile stress (tensile strength) and extension percentages, which was due to the hybrid interlocking pattern of 3D structures. At the end of each curve sample reached to the brittle fracture point, composite was softening in a linear manner and failure occurred at 1.2–2% and 2–3% extension in warp and weft directions respectively as shown in Figure 4(a) and (b). In the natural fibers, the predominant failure mechanism are matrix crack and fiber failure in the absence of interlaminar delamination due to the 3D reinforcement. The composite broke with sharp crack (catastrophically) and did not spread to the larger area.
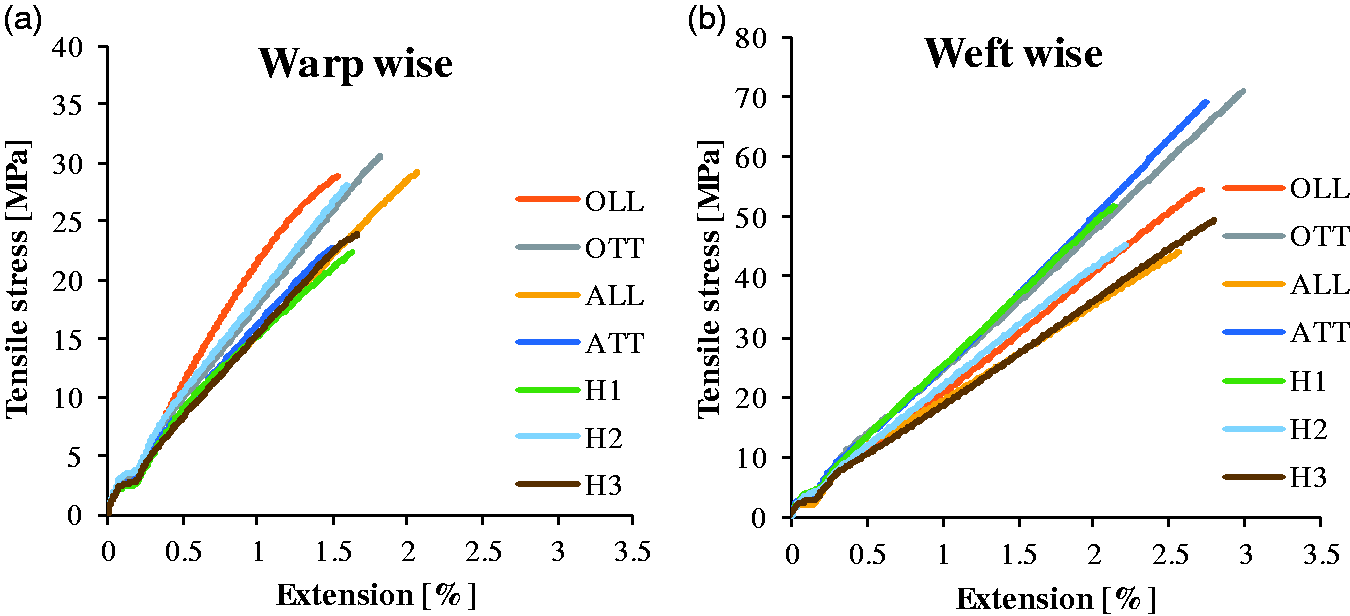
Tensile stress versus extension (%) curves of 3D woven composites (a) warp wise (b) weft wise.
In first six 3D warp interlock composites (OLL, TT, ALL, ATT, H1, H2), binder yarn passed over and under the weft yarns in thickness direction to hold the structure. The undulation, tension of the binder yarn induced some crimp in the structure. While in H3 composite sample binder yarns were in both warp and weft directions, resulting more and nearly equal crimp in warp and weft directions. Since, OTT gave lowest value of crimp in the warp yarns and revealed highest value of tensile strength in warp and weft directions [19,20].
In warp direction, tensile strength and extension percentage values were between 22–30 MPa and 1.2–2% respectively and all samples showed brittle fracture behavior. Tensile strength was more prominent in OTT and ALL samples after maximum extension level as compared to the other five samples. Tensile strength of all 3D composites in warp direction were lower as compared to the weft direction due to lesser number of warp yarns and more crimp of yarns i.e. both in warp and binder yarns [26]. When composite was stretched in warp direction, initially, warp yarns would tend to straight then leading towards the brittle fracture. Within the four basic types (OLL, OTT, ALL, ATT) of 3D woven composites, tensile strength value was highest of OTT composite sample followed by ALL, OLL and ATT samples in warp direction as highlighted in Figure 4(a). OTT weave design had least interlacement of binder yarns because in this structure, binder yarn passed over the first layer and under the last layer binding all the layers together instead of binding every layer, resulting lesser value of crimp. While within the three hybrid (H1, H2, H3) composite samples, H2 composite sample showed the highest value of tensile strength which has combination of orthogonal through thickness and angle interlock layer to layer stitching patterns followed by H1 and H3 samples. Furthermore, extension percentage was highest in ALL composite sample followed by OTT, OLL and ATT in warp direction. Orthogonal through thickness (OTT) composite samples exhibited highest value of tensile strength and second highest value of extension percentage in warp direction as compared to all other composite samples.
In weft direction, tensile strength (40–70 MPa) and extension percentage (2–3%) values were higher as compared to the warp direction due to the higher pick density and less crimp percentage in weft yarns as shown in Figure 4(b). Within four basic types of 3D woven composites (OLL, OTT, ALL, ATT), OTT composite sample showed highest value of tensile strength followed by ATT, OLL and ALL samples in weft direction. Also, extension percentage was highest in OTT composite sample in weft direction. Whereas, in three hybrid composite samples (H1, H2, H3), H1 showed the highest value of tensile strength and the lowest value of extension percentage followed by H2 and H3. Also, in hybrid samples (H1, H2, H3), there was no significant difference in tensile strength values. Overall, orthogonal through thickness (OTT) composite samples exhibited the highest value of tensile strength and extension percentage in weft direction as compared to the other composite samples.
Other tensile test properties of seven different composite samples in both warp and weft directions like tensile modulus and maximum force values are given in Table 2. In weft direction, tensile modulus and maximum force values were higher as compared to the warp direction due to less crimp and higher number of yarns in weft direction. 3D orthogonal through thickness (OTT) composite showed highest values of tensile modulus and maximum force both in warp and weft directions.
Tensile properties of 3D woven composites with ± range of results.

In warp direction, OTT composite sample exhibited highest value of tensile modulus and maximum force followed by ALL, ATT and OLL composite samples. However, within three hybrid (H1, H2, H3) composite samples, H2 composite sample showed highest values of tensile modulus and maximum force, which had combination of orthogonal through thickness and angle interlock layer to layer stitching patterns followed by H1 and H3 samples.
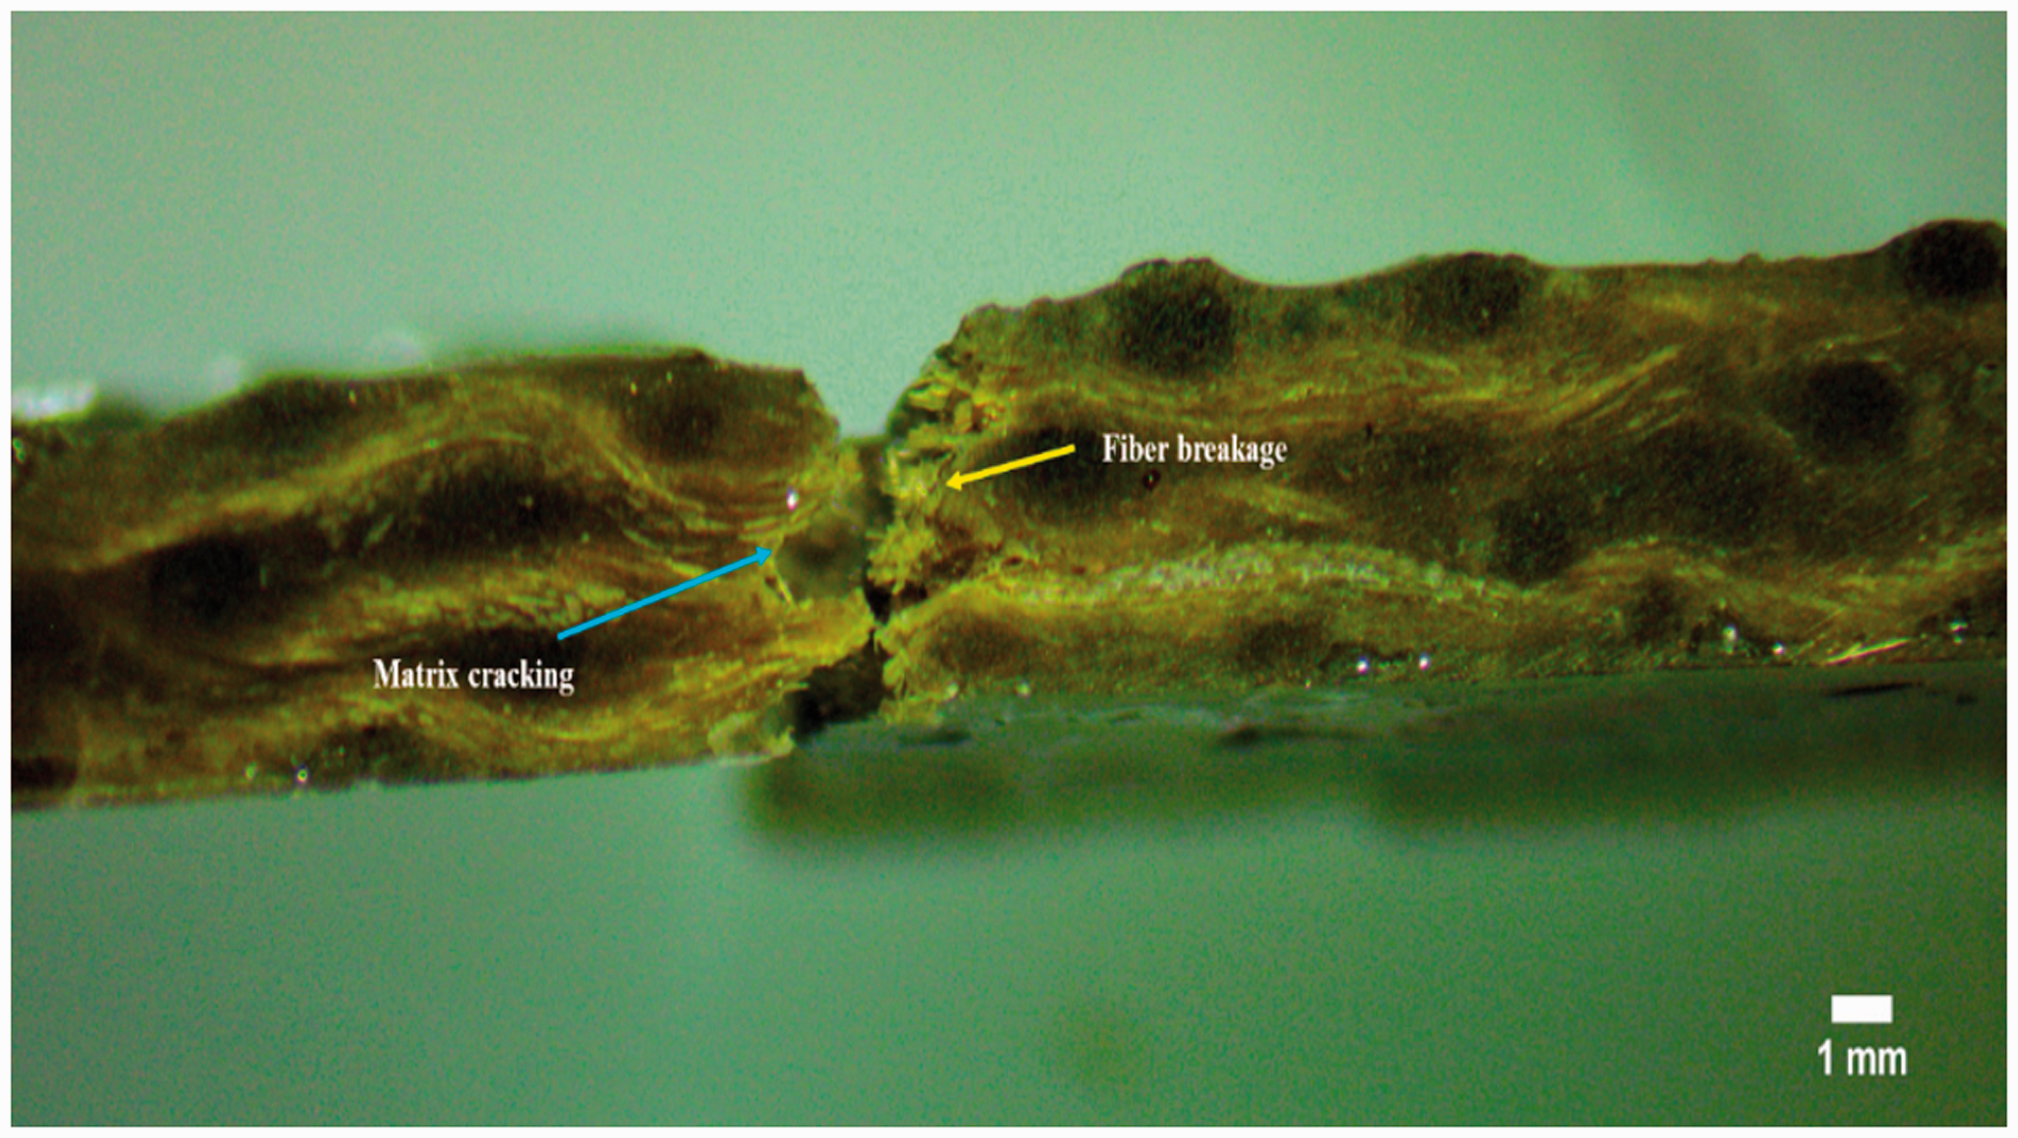
Similarly in weft direction, within four basic types of 3D woven composites (OLL, OTT, ALL, ATT), OTT composite sample also showed the highest values of tensile modulus and maximum force followed by ATT, ALL and OLL samples as given in Table 2. This was due to the greater number of weft yarns in the loading direction and less crimp in weft direction of the 3D woven structures. Whereas, in three hybrid composite samples (H1, H2, H3), H1 showed highest value of tensile modulus and maximum force in weft direction followed by H3 and H2 composite samples. All the composite samples showed brittle fracture behavior, Figure 5 highlights the matrix cracking and fiber breakage behaviour of OTT and H3 samples.

Fracture analysis of composite samples.
Statistical analysis
P-values, and model summaries (R-squares) of One-Way ANOVA (Tukey) statistical analysis for tensile testing in warp and weft directions are given in Table 3. Analysis was performed against each test result separately and outcomes were recorded. P-values showed that with the change of 3D woven structures, tensile testing results i.e. tensile modulus, tensile strength, and maximum force were also changed in both warp and weft directions. This change in the results was statistically significant because p-value for each response was less than 0.05. Furthermore, p-value for each tensile testing result was equal to zero which showed that effect of 3D woven structures on each testing result was highly significant both in warp and weft directions. Moreover, R-square (coefficient of determination) percentages against each result were more than 95% both in warp and weft directions. R-square is the percentage of variation in the response that is explained by the model. So, higher the percentage of R-square during statistical analysis, higher will be the accuracy and dependency of the model.
P-values and model summaries of tensile testing during One-Way ANOVA (Tukey) statistical analysis.

Interval and Tukey simultaneous plots for tensile modulus, strength and maximum force are shown in Figures 6 to 8, respectively. Interval plot showed the range of results for tensile test while Tukey comparison results are used to formally test whether the difference between a pair of groups is statistically significant. The Tukey plot showed that the confidence intervals for those difference between the means, which do not include zero in their range are significant. In warp wise tensile modulus, only four pairs include zero in the mean values of their confidence intervals as shown in Figure 6(b), which showed that the differences between the means of these pairs were not significant. All remaining confidence intervals did not include zero in the pair of means, which showed that the differences between the pair of means were significant. Similarly, in weft wise tensile modulus the confidence intervals showed that none of the pairs of means include zero in their difference as shown in Figure 6(d), which showed that the differences between all pairs of means were significant.
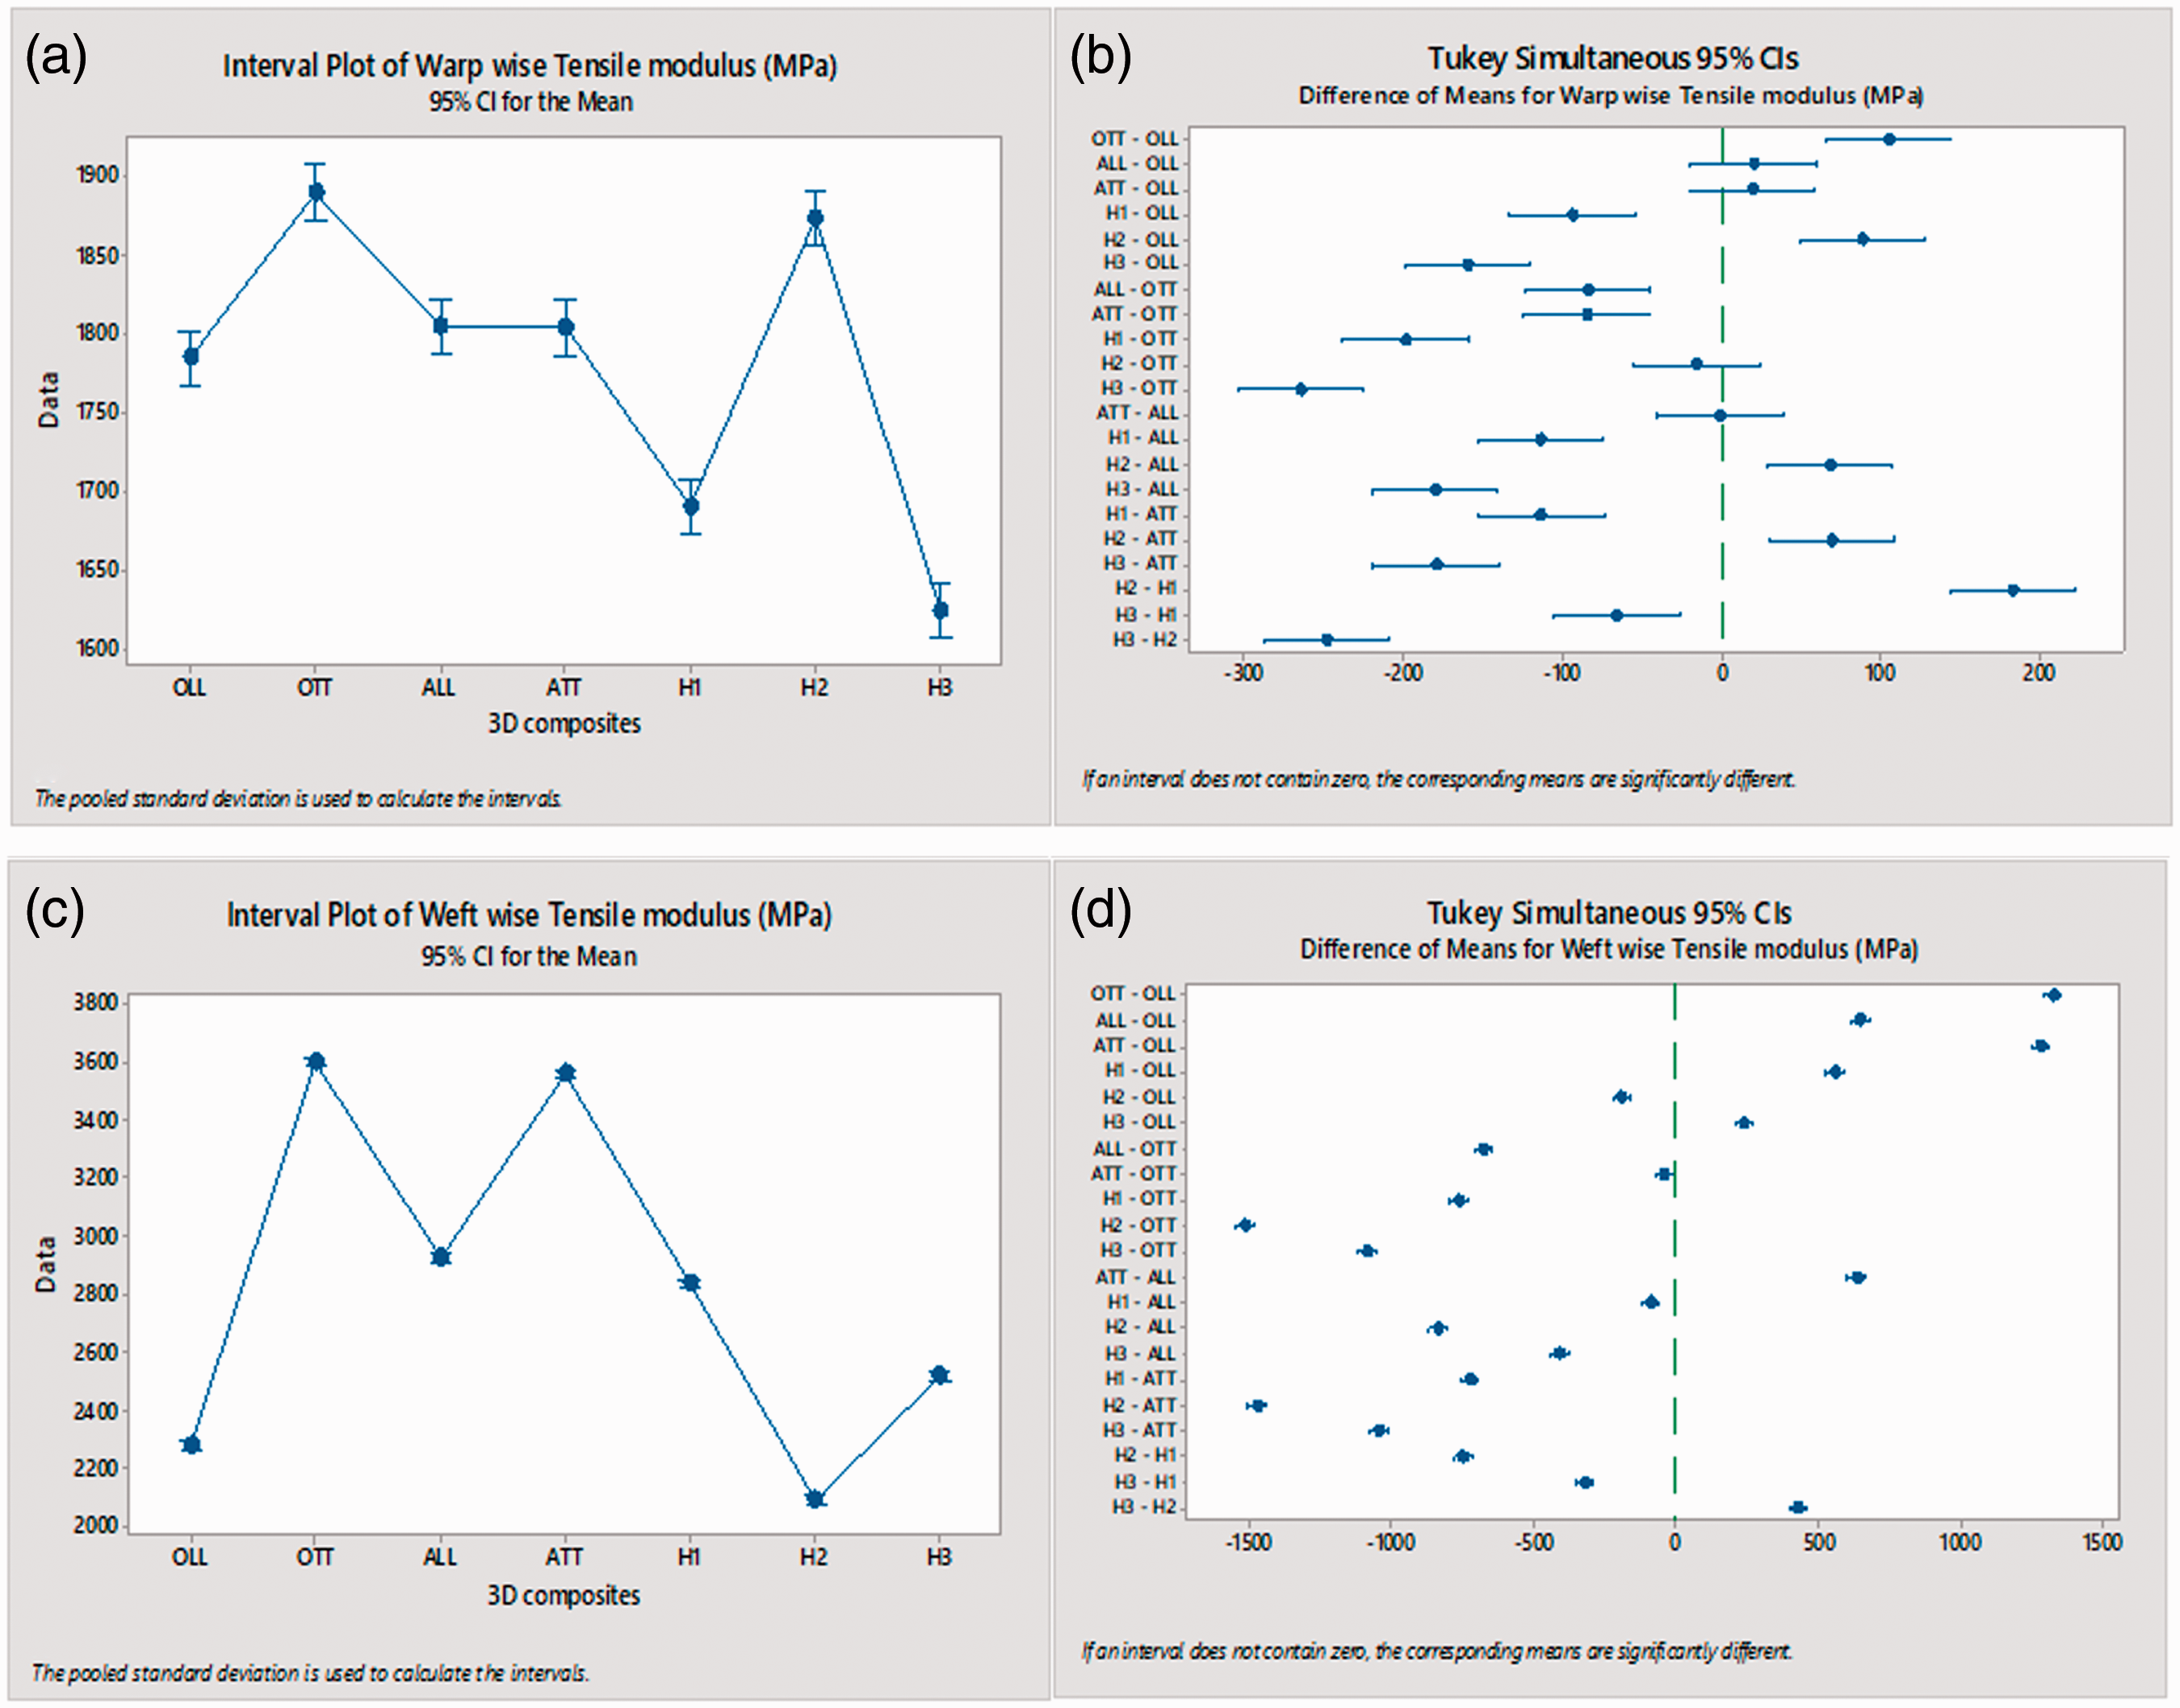
Tensile modulus: warp wise (a) Interval plot (b) Tukey simultaneous plot, and weft wise (c) Interval plot (d) Tukey simultaneous plot.
The interval plot for warp direction of tensile modulus showed that out of seven intervals; 1st (OLL), 3rd (ALL) and 4th (ATT) intervals, and 2nd (OTT) and 6th (H2) intervals overlap each other showing the differences between the means were not statistically significant. While 5th (H1) and 7th (H3) intervals did not overlap with anyone, therefore, the difference in their means were significantly different as shown in Figure 6(a). Similarly, the interval plot for weft direction of tensile modulus showed that none of the seven intervals was overlapping with each other highlighting the difference in means of all these intervals were significantly different as shown in Figure 6(c).
Furthermore, in Figure 7(b) and (d) Tukey simultaneous plots for tensile strength in warp and weft directions respectively, showed that only a few pair of means include zero in their range showing their differences of means were not significant. While maximum pairs of means did not include zero in their range highlighting their corresponding means were significantly different. The interval plot of the tensile strength in warp direction showed that only 2nd (OTT) interval did not overlap with any other interval, therefore its difference in means was significantly different as shown in Figure 7(a). Similarly, 1st (OLL) and 5th (H1) intervals, and 3rd (ALL) and 6th (H2) intervals overlap each other, while remaining three intervals i.e. 2nd (OTT), 4th (ATT), and 7th (H3) intervals did not overlap at any point for tensile strength in weft direction which showed that 2nd, 4th, and 7th interval means were significantly different as shown in Figure 7(c).

Tensile strength: warp wise (a) Interval plot (b) Tukey simultaneous plot, and weft wise (c) Interval plot (d) Tukey simultaneous plot.
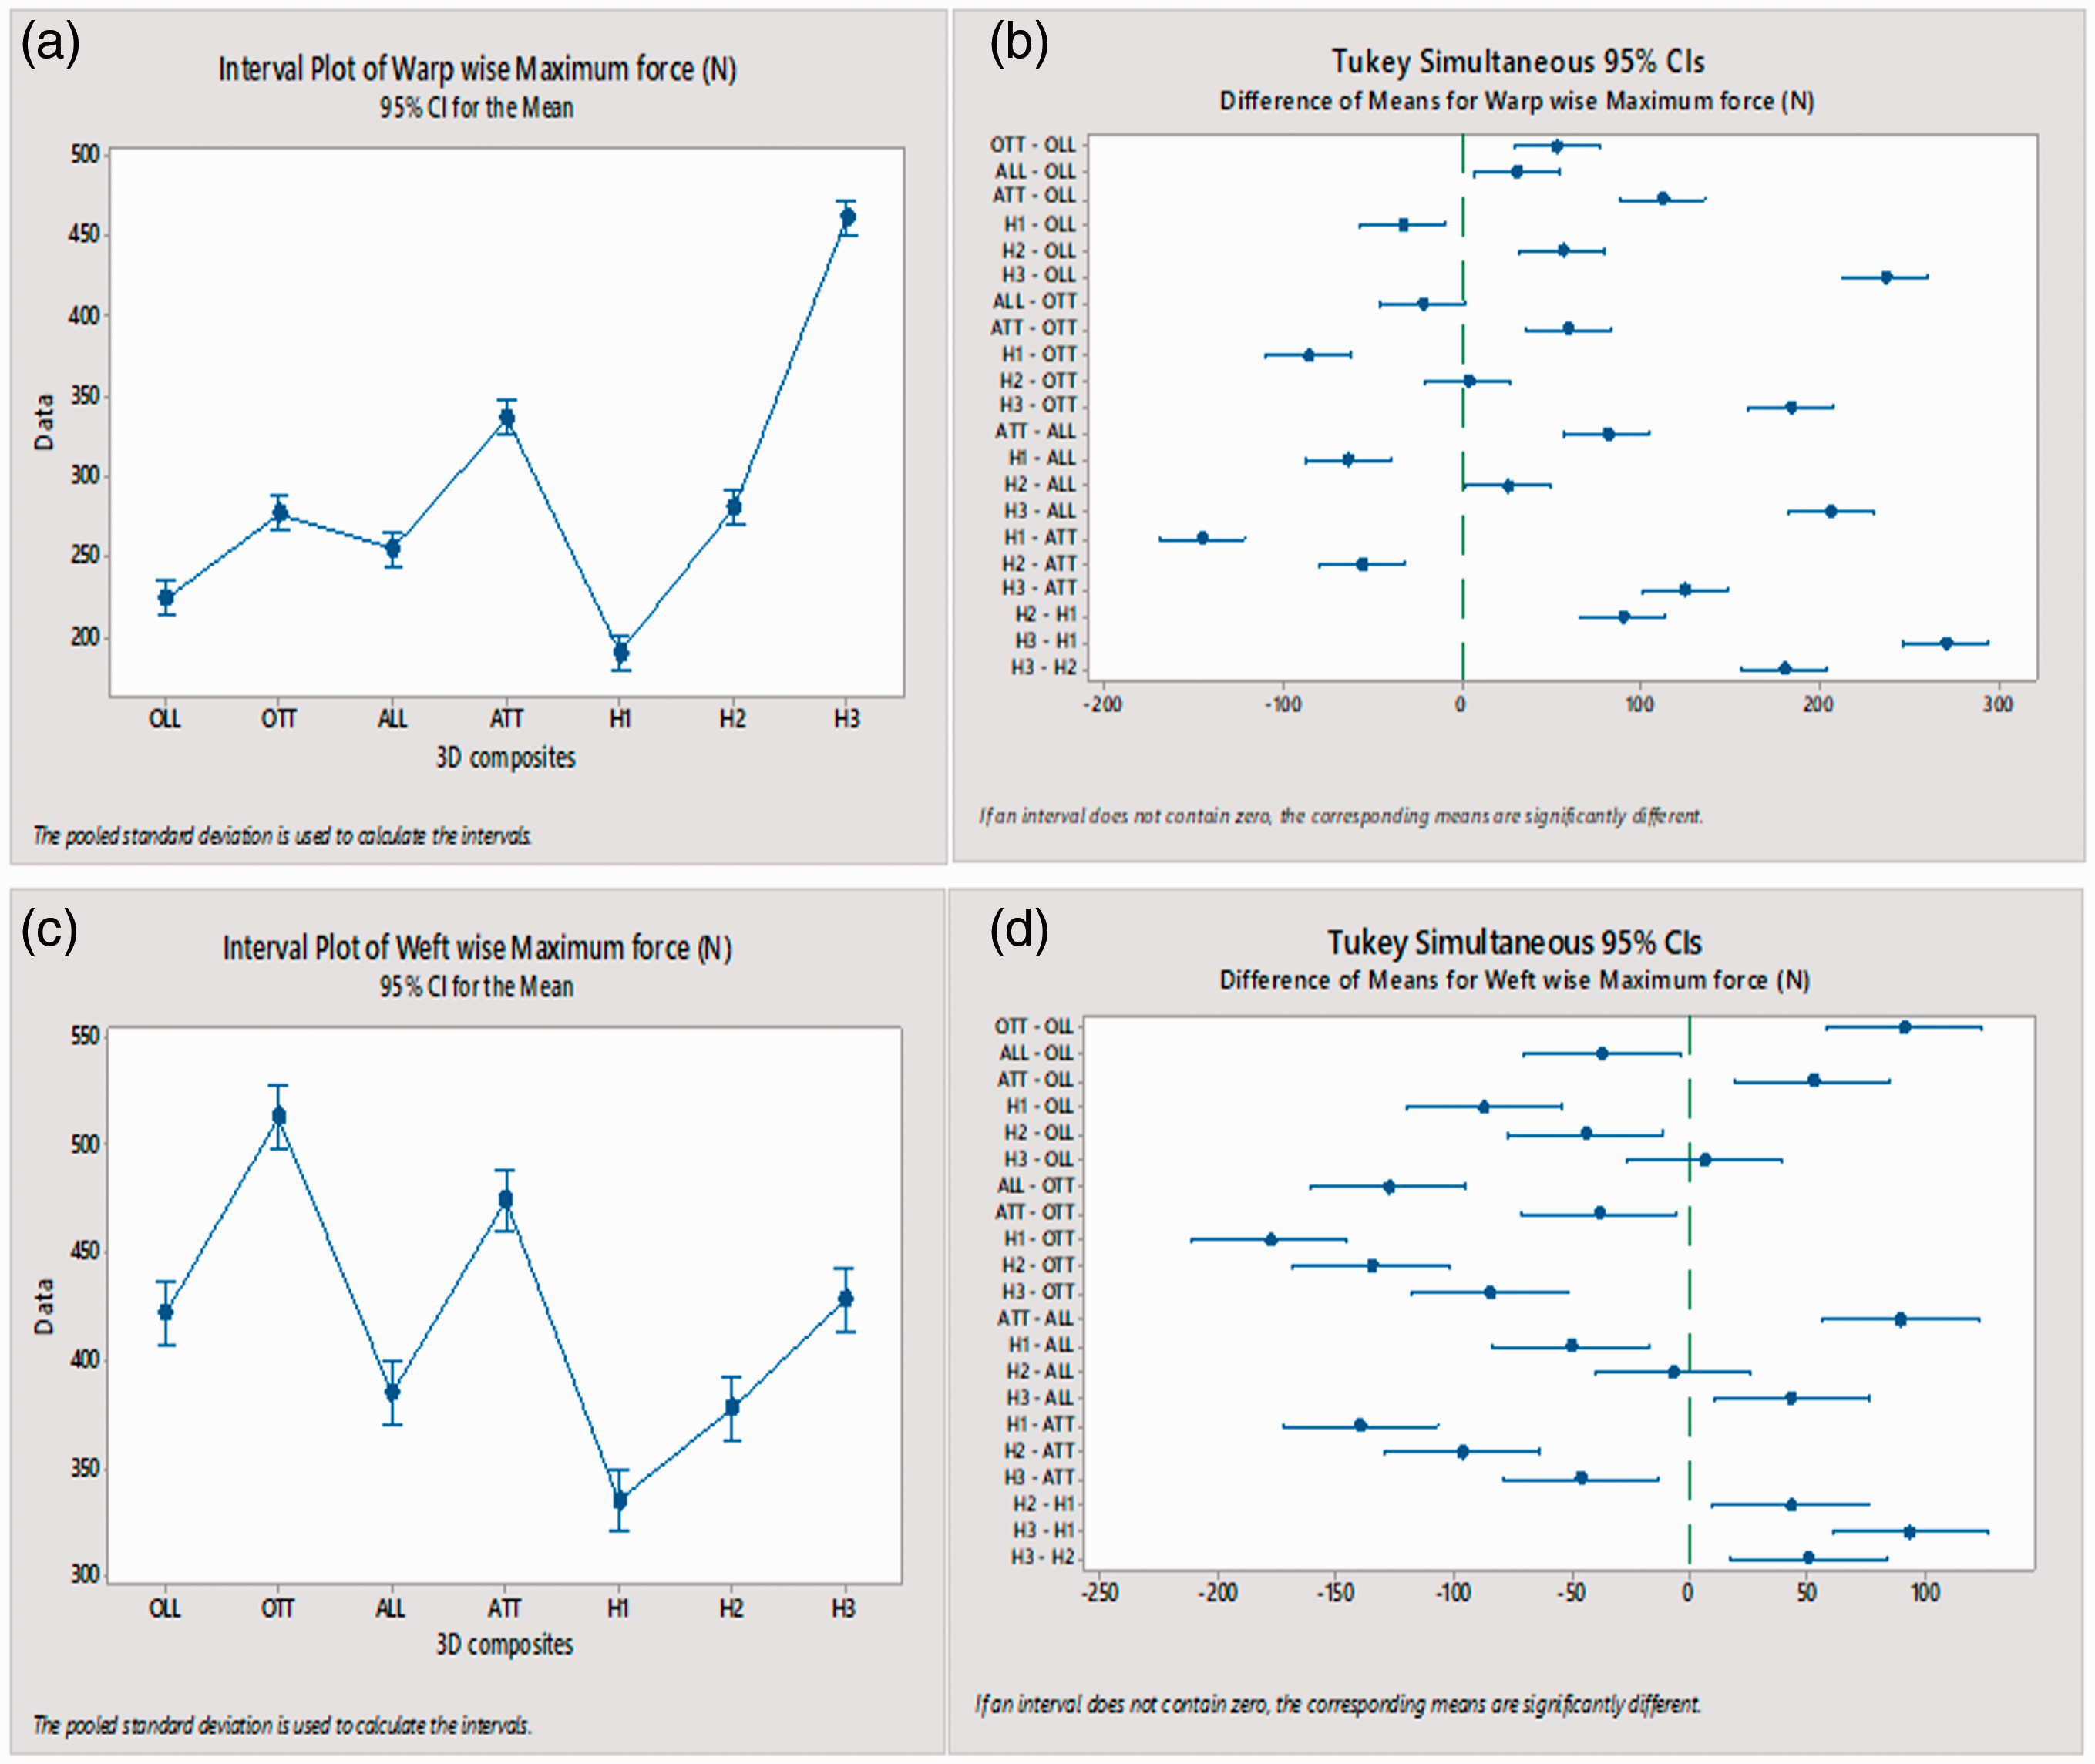
Also, in Figure 8(b) and (d) Tukey plots for maximum force showed that in warp direction two pair of means, and in weft direction only one pair of means include zero in their range showing their differences were not significant while all other pair of means in both directions did not include zero in their range highlighting the significance of their differences. The interval plot of the maximum force showed that in warp direction 2nd (OTT), 5th (H1), and 7th (H3) intervals, and in weft direction except 3rd (ALL) and 5th (H1) intervals, all other intervals did not overlap with any other interval showing their differences in means were significantly different as highlighted in Figure 8(a) and (c) respectively.

Maximum force: warp wise (a) Interval plot (b) Tukey simultaneous plot, and weft wise (c) Interval plot (d) Tukey simultaneous plot.
Flexural properties
The flexural (three-point bending) stress versus deformation (%) curves of the OLL, OTT, ALL, ATT, H1, H2, H3 in warp and weft directions are shown in Figure 9(a) and (b) respectively. In the elastic region, the stress was increased faster with increasing mid span deflection. Once the peak flexural stress value was reached, there was a sudden drop in the flexural stress for both weft and warp directions of all 3D composite samples. All the samples showed brittle fracture behavior in both warp and weft directions except OLL sample, which showed a little strain hardening region in the curve. In weft direction, maximum value of flexural stress (flexural strength) was higher as compared to the warp direction in all composite samples due to higher number of yarns in weft direction. The flexural strength was found to be highest in case of ATT sample in weft directions while in warp direction flexural strengths of ATT and ALL samples were highest and comparable.

Flexural stress versus deformation (%) curves of 3D woven composites (a) warp wise (b) weft wise.
In warp direction, flexural strength and deformation percentage values were between 20–45 MPa and 1.5–4.5% respectively. Flexural strength was more prominent in ATT and ALL samples after maximum deformation percentage as compared to the other five samples. The ATT form a cluster/pocket, which tend to resist maximum to bending and the ALL form the biggest pocket followed by ATT. While, OLL composite sample had least value of flexural strength in warp direction. In comparison of two orthogonal samples, orthogonal through thickness (OTT) sample showed more flexural strength as compared to the orthogonal layer to layer (OLL) interlock composite sample (D. 30; 50). A similar trend in maximum flexural stress was observed in two angle interlock composite structures i.e. through thickness angle interlock (ATT) had comparable value of flexural strength with layer to layer angle interlock (ALL). This trend was due to the vertical binding yarns in through thickness samples. Through thickness vertical binding yarn would resist more to the transversal force as compared to the layer to layer binding yarns.
In comparison of flexural strength of three hybrid samples (H1, H2, H3) in warp direction, H1 composite samples showed highest value of flexural strength followed by H3 and H2 samples. Because H1 sample contained orthogonal and angle through thickness binder yarns which would resist more to transversal direction and its flexural strength was comparable with ATT as shown in Figure 9(a). While H2 composite also has both angle layer to layer (ALL) and orthogonal through thickness (OTT) interlocking/binder yarns, that is why it showed more flexural strength value than OTT composite sample as shown in Figure 9(a). Furthermore, H3 sample contained binding yarns both in warp and weft directions and exhibited less value of flexural strength as compared to the H1 composite sample and more than H2 composite.
Similarly, in weft direction, flexural strength and deformation percentage values were between 30–90 MPa and 1.8–4.2% respectively. All samples showed brittle behavior and broke right after the maximum value of flexural stress was achieved except OLL composite sample which showed a little ductile curve. In the comparison of four basic 3D composite structures (OLL, OTT, ALL, ATT), in weft direction structures having through thickness binder yarns showed more value of flexural strength as compared to the structures with layer to layer binder yarn in both orthogonal and angle interlock structures as shown in Figure 9(b). Through thickness binder yarns would resist more to transversal force as compared to the layer to layer binder yarns. Also, angle interlock through thickness composite sample showed more flexural strength than orthogonal through thickness interlock composite [33]. Furthermore, in comparison of hybrid interlock composite samples (H1, H2, H3), H3 composite sample showed the highest value of flexural strength followed by H1 and H2. Also, H3 sample had comparable flexural strength with OTT composite sample. While H1 and H2 both showed least similar flexural strength.
Flexural modulus of seven different composite samples in both warp and weft directions are given in Table 4. In weft direction, flexural modulus values were higher as compared to the warp direction due to less crimp and higher number of yarns in weft direction. In warp direction, ATT composite sample exhibited highest value of tensile modulus followed by ALL, OTT and OLL composite samples [21]. In hybrid samples (H1, H2, H3), H1 showed the highest flexural modulus in comparison with other hybrid samples which was comparable with ATT composite sample in warp direction. Similarly, in weft direction, ATT composite sample showed the highest flexural modulus as compared to the ALL, OLL, OTT, H1, H2, H3 samples as given in Table 4. Also, angle interlock composite showed better flexural behavior as compared to the orthogonal interlock composite samples. While, within the hybrid composite samples in weft direction, H3 sample displayed highest value of flexural modulus as compared to the H2 and H3. Typical damage phenomenon during the flexural loading is shown in Figure 10.
Flexural modulus of 3D woven composites with ± range of results.

Typical damage phenomenon during flexural loading of 3D composites.
Statistical analysis
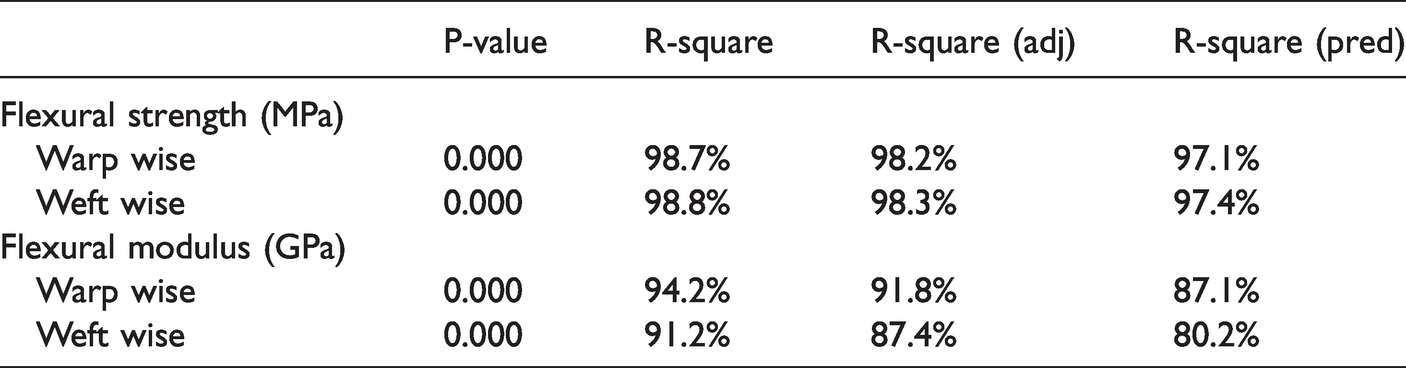
P-values, and model summaries (R-squares) of One-Way ANOVA (Tukey) statistical analysis for flexural testing results are given in Table 5. Analysis was performed against different results of flexural test separately and outcomes of statistical analysis were recorded. P-values showed that with the change of 3D woven structures, flexural testing results i.e. flexural strength and modulus were also changed in both warp and weft directions. This change in the flexural testing results was statistically significant because p-value for each response was less than 0.05. Since p-value for each flexural testing result was equal to zero as highlighted in the Table 5 showed that effect of 3D woven structures on each flexural testing results was highly significant in both warp and weft directions. R-square values of the flexural strength and modulus were more than 91% in both warp and weft directions, which showed higher dependencies of the models.
P-values and model summaries of flexural testing during One-Way ANOVA (Tukey) statistical analysis.
The Interval and Tukey simultaneous plots for flexural strength and modulus are shown in Figures 11 and 12, respectively. The confidence intervals of Tukey simultaneous graphs for flexural strength showed that in warp direction only three pair of means, and four pair of means in weft direction include zero in their range which showed their differences were not practically significant as shown in Figure 11(b) and (d). While Interval plots of flexural strength showed that in warp direction 1st (OLL), 2nd (OTT) and 4th (ATT) intervals, and in weft direction 1st (OLL) and 4th (ATT) intervals did not overlap with any other interval, therefore, differences in means of these intervals were significantly different as shown in Figure 11(a) and (c) respectively.
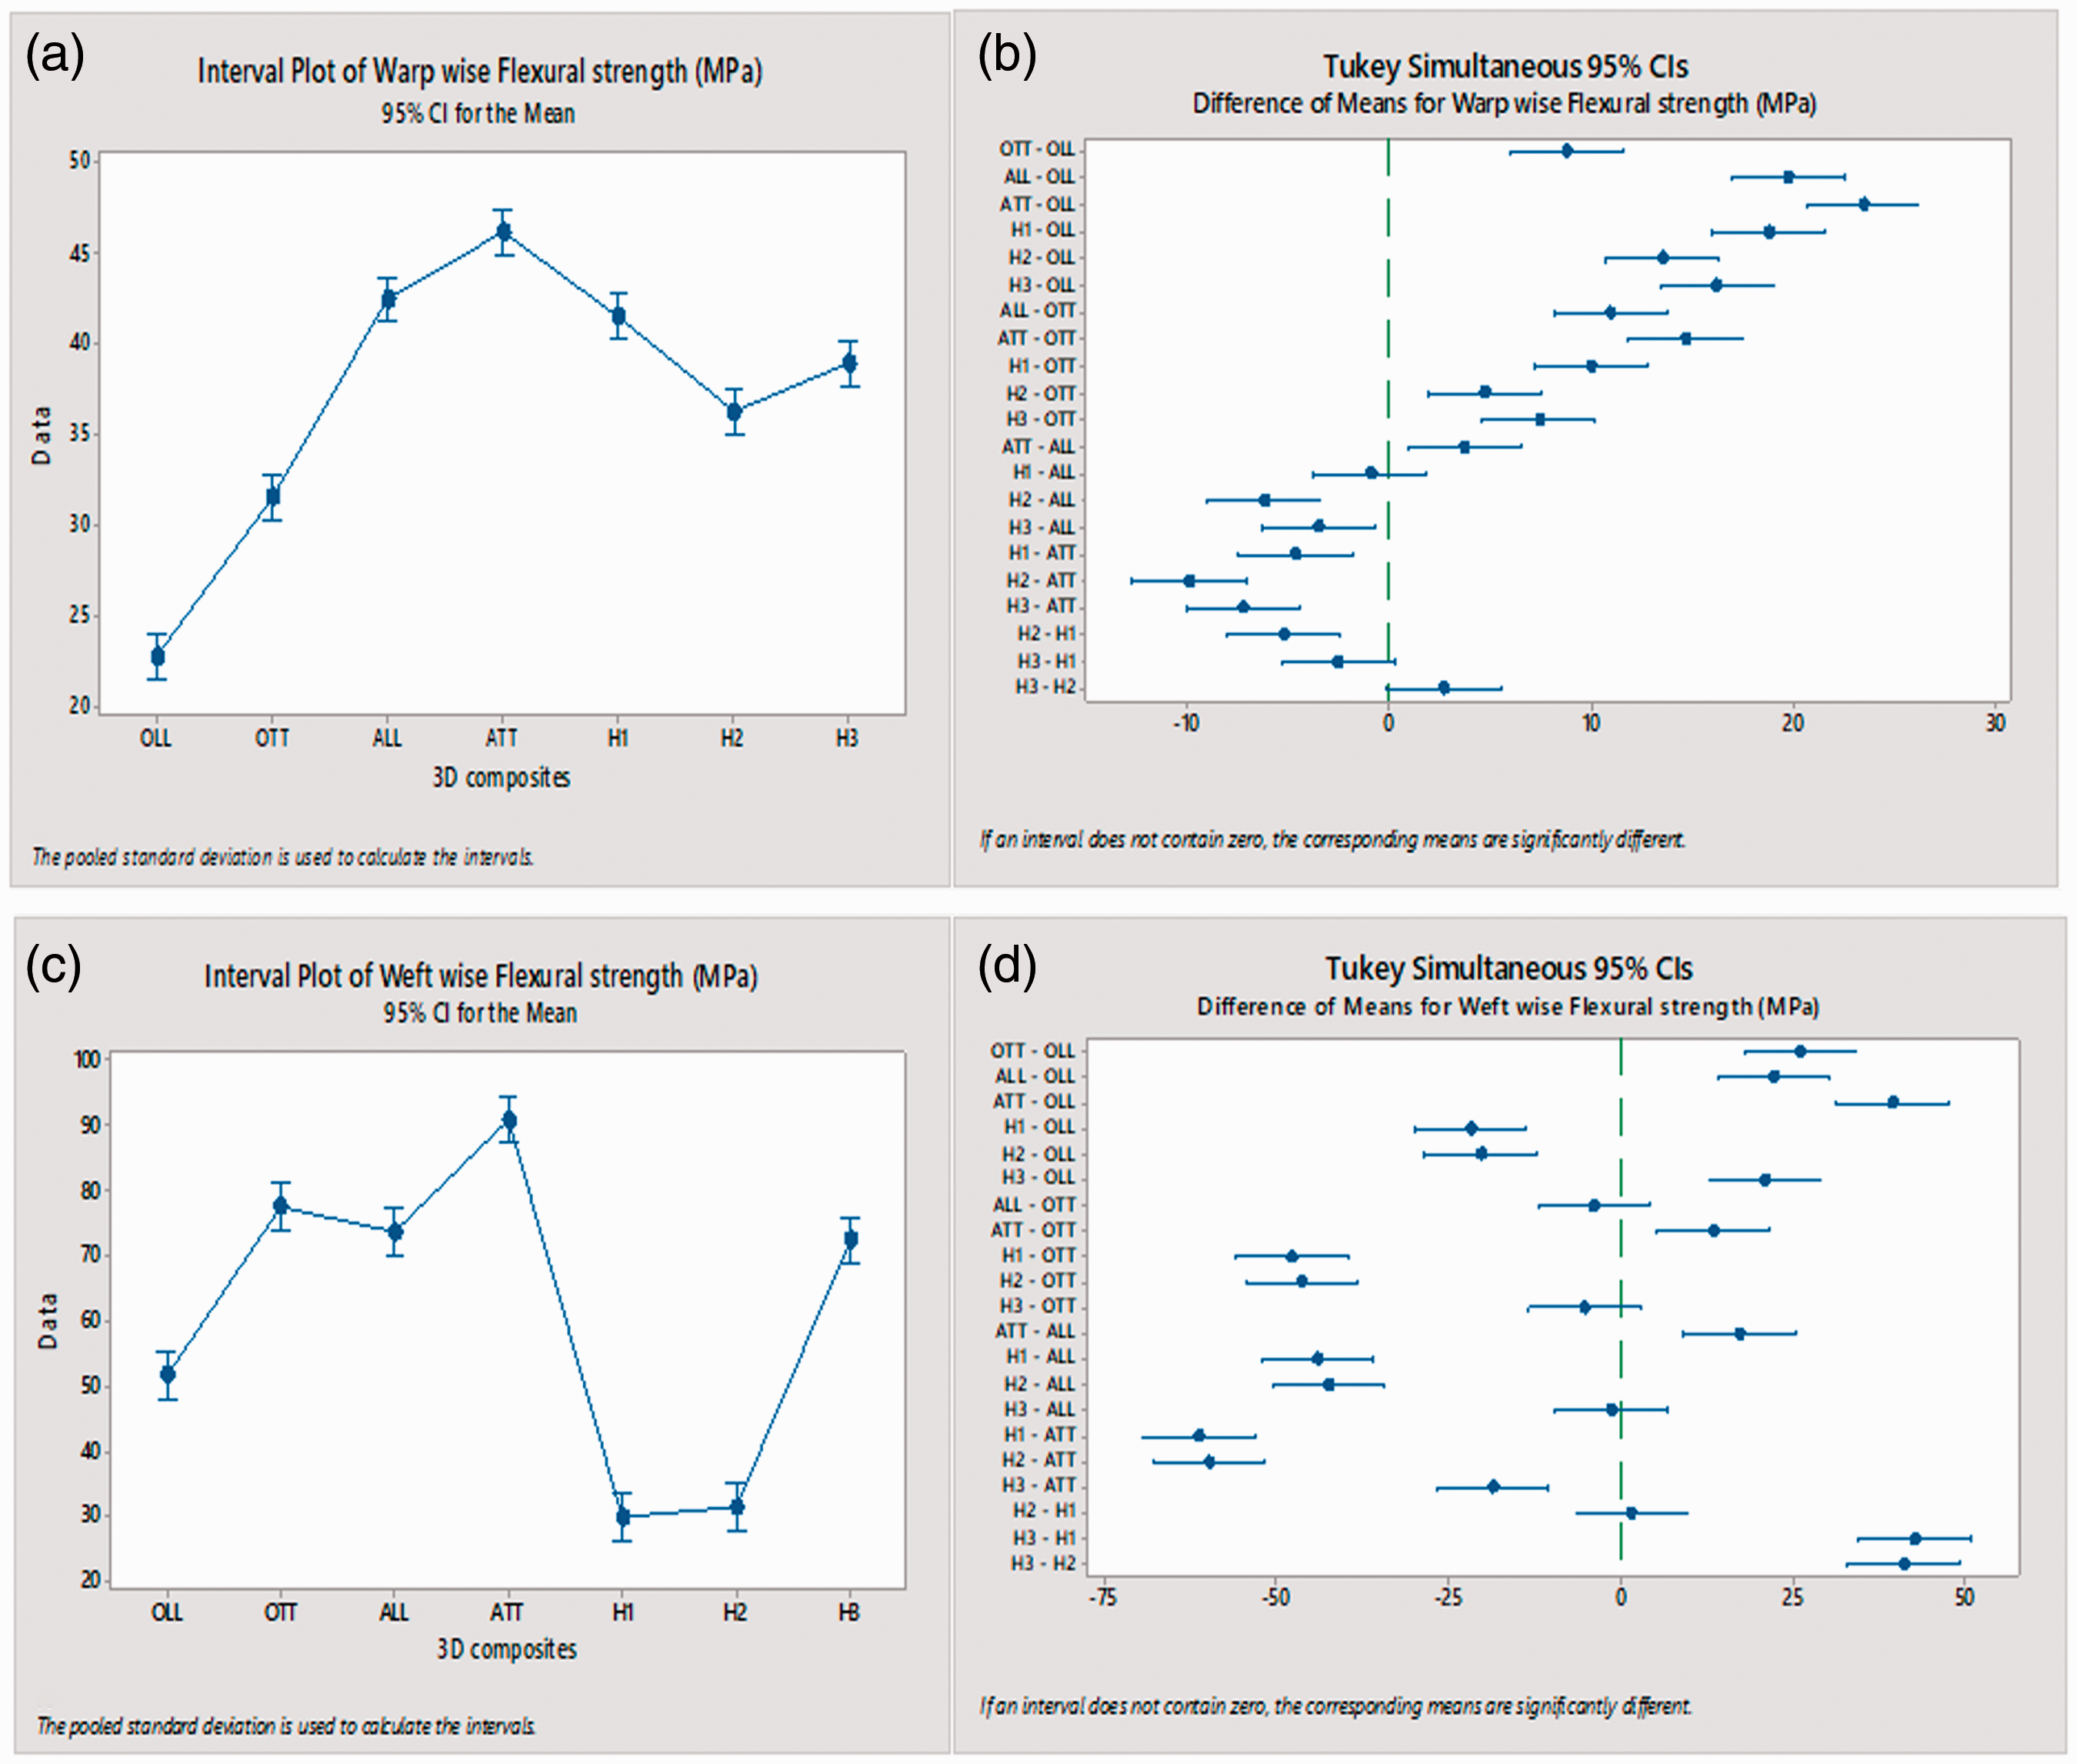
Flexural strength: warp wise (a) Interval plot (b) Tukey simultaneous plot, and weft wise (c) Interval plot (d) Tukey simultaneous plot.

Flexural modulus: warp wise (a) Interval plot (b) Tukey simultaneous plot, and weft wise (c) Interval plot (d) Tukey simultaneous plot.
Furthermore, the confidence intervals of Tukey simultaneous graphs for flexural modulus showed that in both warp and weft directions several pair of means include zero in their range showing their differences were not practically significant as shown in Figure 12(b) and (d). Similarly, Interval plots of flexural modulus in both warp and weft directions showed that all intervals overlap with any other interval except 4th (ATT) interval in weft direction, therefore, differences in means of these intervals were not significantly different except 4th interval in weft direction as shown in Figure 12(a) and (c) respectively.
Short beam shear properties
Short beam shear (SBS) is used to determine interlaminar shear strength (ILSS) of parallel fibers. The interlaminar shear strength is one of the most important parameters to determine the ability of a composite to resist the delamination damage. Three point bending (TPB) short beam shear test was performed to check the localized damage occurred under the beam [49]. The short beam shear test was performed just as flexural testing method. Although shear was the dominant in the method, internal stresses would be complex, and variety of failure modes could occur. During the SBS test of 3D woven composites, no delamination, inelastic deformation, or flexural breakage was observed in the samples but only samples showed a little bend from center highlighting shear as shown in Figure 13.

Deformation during short beam shear test.
Standard force versus deformation curves of the OLL, OTT, ALL, ATT, H1, H2, H3 in warp and weft directions are shown in Figure 14(a) and (b) respectively. Different behavior of maximum force against deformation curves was observed in warp and weft directions. Overall, standard force value was higher in weft direction due to higher number of yarns in weft direction and maximum deformation values were comparable in both directions. At the end of test, no delamination was found in any sample 3D woven composites.

Force versus deformation curves of short beam shear test of 3D woven composites (a) warp wise (b) weft wise.
In warp direction, within the four basic types of 3D interlock composites (OLL, OTT, ALL, ATT), through thickness interlock composites showed higher value of force than the layer to layer interlock composites for both orthogonal and angle interlock structures. While ATT composite structure showed the highest value of force among the four basic types of 3D woven structures. Because the through thickness binder yarn would resist more in transversal direction than layer to layer binder yarn. Furthermore, among the three different hybrid composites (H1, H2, H3), H3 composite sample showed the highest value of force followed by the H2 and H1. Among all seven different 3D woven composite samples, H3 composite showed the highest value of maximum force in warp direction.
While in weft direction, among the four basic types of 3D structures (OLL, OTT, ALL, ATT), similar trend of increase in force was observed like in warp direction i.e. through thickness interlock composites showed higher value of force than the layer to layer interlock composites for both orthogonal and angle interlock composites. But the value of force was higher in weft direction due the higher number of yarns in weft direction. This increasing trend of maximum force during short beam shear test was similar to the flexural properties as highlighted in Table 4 and Figure 9. While within the hybrid composite samples, H3 composite sample showed the highest value of force followed by H2 and H1. This increase in force in weft direction of hybrid samples was similar to the force increasing in warp direction of hybrid composite samples.
Furthermore, short beam shear strength of seven different composite samples in both warp and weft directions were calculated using Equation 2 and given in Table 6.
Short beam shear strength of 3D woven composites with ± range of results.
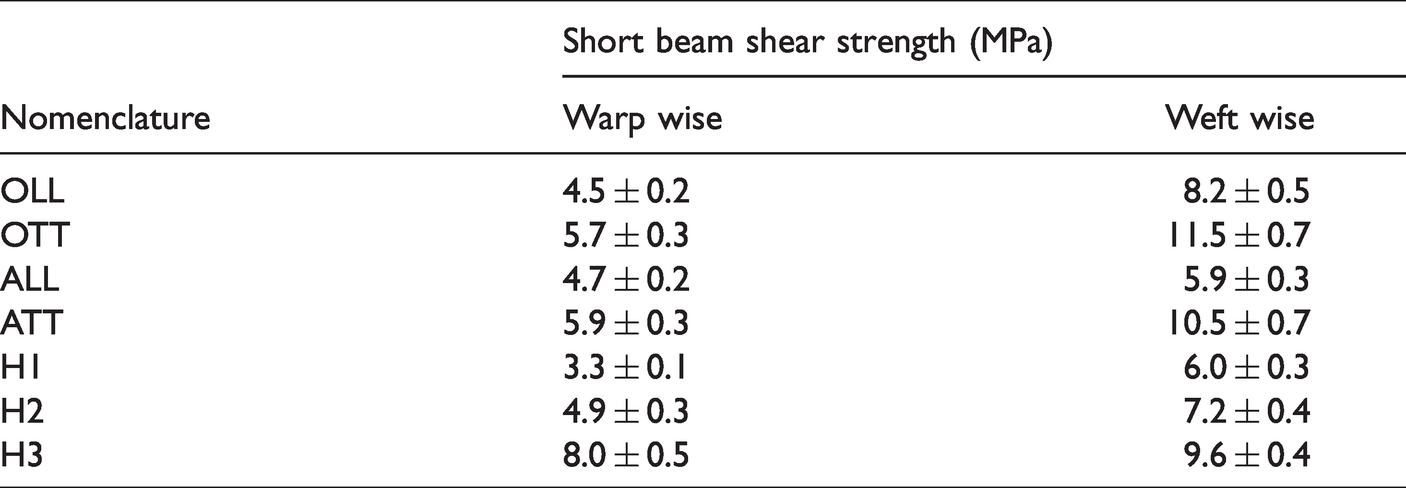
A similar increasing trend of short beam shear strength was observed in warp and weft directions likewise of standard force values. In warp direction, ATT sample showed higher value of short beam shear strength as compared to the ALL composite sample. Whereas within the hybrid samples, H3 showed highest value of SBS strength followed by H2 and H1 samples. Similar increasing trend of SBS strength values was observed in weft direction, but values were higher in weft direction due to higher number of yarns in weft direction.
Statistical analysis
P-values, and model summaries of One-Way ANOVA (Tukey) statistical analysis for short beam shear testing results are given in Table 7. Analysis was performed against different results (maximum force and SBS strength) of short beam shear test separately and outcomes of statistical analysis were recorded. P-values showed that the change of 3D woven structures in the composites, significantly affect the values of SBS strength and maximum force values in both warp and weft directions. The change in the SBS testing results was statistically significant because p-value for each response was less than 0.05. R-square percentages for maximum force signifies that 99.2% and 97.1% change in response can be explained by these different 3D woven structures in warp and weft directions, respectively. Similarly, R-square percentages for SBS strength indicates that 94.6% and 95.6% change in response can be explained by these different 3D woven structures in warp and weft directions, respectively.
P-values and model summaries of short beam shear (SBS) testing during One-Way ANOVA (Tukey) statistical analysis.

Interval and Tukey simultaneous plots for maximum force and short beam shear strength are shown in Figures 15 and 16, respectively. The confidence intervals of Tukey simultaneous graphs for maximum force showed that in warp direction three pair of means, and two pair of means in weft direction include zero in their range which showed their difference was not practically significant as shown in Figure 15(b) and (d). While Interval plots of maximum force showed that in warp direction 1st (OLL), 4th (ATT), 5th (H1) and 7th (H3) intervals, while in weft direction 2nd (OTT), 4th (ATT) and 5th (H1) intervals did not overlap with any other intervals, therefore, differences in means of these intervals were significantly different as shown in Figure 15(a) and (c) respectively.
Maximum force: warp wise (a) Interval plot (b) Tukey simultaneous plot, and weft wise (c) Interval plot (d) Tukey simultaneous plot.

SBS strength: warp wise (a) Interval plot (b) Tukey simultaneous plot, and weft wise (c) Interval plot (d) Tukey simultaneous plot.
The confidence intervals of Tukey simultaneous graphs for SBS strength showed that in warp direction several pair of means, and four pair of means in weft direction include zero in their range which showed their differences were not practically significant as shown in Figure 16(b) and (d) respectively. While Interval plots of SBS strength showed that in warp direction 5th (H1) and 7th (H3) intervals, and in weft direction only 2nd (OTT) interval did not overlap with any other intervals, therefore, differences in means of these intervals were significantly different as shown in Figure 16(a) and (c) respectively.
Conclusions
In this study, seven different types of 3D woven jute/green epoxy composites i.e. orthogonal layer to layer (OLL), orthogonal through thickness (OTT), layer to layer angle interlock (ALL), through thickness angle interlock (ATT), and three different hybrid interlock composites H1 (combination of OTT and ATT binder yarns), H2 (combination of OTT and ALL binder yarns), H3 (combination of orthogonal layer to layer warp and weft interlocks called as bi-directional interlock) were fabricated using compression molding technique. Three different types of characterizations (tensile, flexural, short beam shear) were done to check their mechanical performance and following conclusions were made. OTT composite structure showed the highest values of tensile strength, modulus, and maximum force both in warp and weft direction as compared to the other 3D interlock composite structures. Because of the least interlacement of the binder yarns in the whole structure. Also, within the 3D hybrid composites, H2 showed highest values of tensile strength, modulus, and maximum force in warp direction and H1 showed best results in weft direction. ATT composite showed the highest values of flexural strength and modulus both in warp and weft directions as compared to the other 3D composites due to presence of through thickness binder yarns at a certain angle. While, within the 3D hybrid composite samples, H1 showed the highest flexural strength and modulus in warp direction because of the presence of combined through thickness yarns i.e. orthogonal and angle interlock while, H3 showed best results in weft direction. 3D through thickness interlock composite samples showed higher value of standard force and short beam shear strength for both orthogonal and angle interlock composite structures within the first four basic 3D composite structures in both warp and weft directions. While, within the hybrid 3D composites, H3 showed higher values of force and short beam shear strength both in warp and weft directions due to the comparable crimp percentage both in warp and weft directions. One-Way ANOVA (Tukey) statistical analysis results showed that the change in the 3D woven structures had statistically significant effect on tensile, flexural, and short beam shear testing results because p-value was less than 0.05 for each test results.
Overall, during in plane testing (tensile), OTT composites sample behaved mechanically better due to the least crimp in binder yarn, while during out of plane characterizations (flexural, SBS), both through thickness structures (OTT and ATT) and hybrid 3 (H3) sample showed the highest and comparable results.
Footnotes
Declaration of conflicting interests
The author(s) declared no potential conflicts of interest with respect to the research, authorship, and/or publication of this article.
Funding
The author(s) disclosed receipt of the following financial support for the research, authorship, and/or publication of this article: This work is supported by Higher Education Commission of Pakistan.