
Abstract
One of the key issues of the 21st century is to reduce the rate of continuously increasing environmental pollution from waste generated by human beings. Use of recycled materials and environmentally friendly approaches to manufacturing can be a good way to deal with these challenges. Similarly, sound pollution has been increasing at an alarming rate due to industrialization and modernization. Use of acoustic insulation materials produced from recycled textile waste can play a vital role in reduction of sound pollution while simultaneously helping reduce municipal solid waste. The goal of this study was to evaluate the recycling of used apparels to produce commercially feasible sustainable products using nonwoven fabrication techniques with a biodegradable thermoplastic binder fiber for possible use as acoustic insulation panels. Recycled denim fibers were used with Sorona® or a PLA binder fiber to successfully produce sound insulation with good performance properties. Maximum transmission loss of about 24 dB and transmission coefficient close to zero at around 1000 Hz were observed. The data indicated that there is a direct correlation between loss of sound transmission with increase in thickness, areal density and decrease in air permeability. When compared with commercially available acoustic insulation material (gypsum board), these products had better insulation properties, indicating that recycled textile products can be used to produce such value-added materials, giving them another useful life before safely disposing in composting environments.
Introduction
Everyday there is increasing concern in the environmental sectors [1,2] due to the rapid increase in world population, their consumption rate, and increase in tendency to discard materials in landfill as waste before end of the products’ lifetime [3]. Noise is regarded as one of the worldwide biggest polluters [4]. It was reported by World Health Organization (WHO) that in USA, 40% of the population are exposed to road traffic with a sound pressure level of more than 55 dB [5]. Noise pollution is continuously increasing due to urbanization, industrialization, increased use of vehicles, electrical and mechanical appliances in home and industry, etc., and becoming a major health and environmental concern [2,6]. Several health effects including sensorial, stress, high blood pressure, coronary heart disease, and stroke are caused by noise pollutions [7]. A study reported that about 65% of European citizens are exposed to noise levels which may lead to several adverse effects on health [8]. In addition to the adverse effect on health, noise pollution hampers people’s work efficiency [9]. Using proper acoustic insulation materials can help minimize the adverse effects caused by noise pollution. Several European countries have passed regulations that buildings must install soundproof materials to reduce the harmful effects of noise [5].
Presently used acoustic insulation materials are produced from porous synthetic materials including glass fiber, rock wool, glass wool, polyurethane, or polyester [10]. These mineral or petrochemical-based materials have an adverse effect on human health and environment. Synthetic materials, due to their non-renewable and non-disposable properties can cause diverse harmful effects on the environment [11]. Also, petroleum-based synthetic fibers and silica-based glass fiber materials [10] have carcinogenic effects on the human body [12]. Certain glass wool fibers are inhalable and people who exposed to glass wool fibers may suffer with lung tumor and cancer [13].
Consciousness among public is rapidly increasing about the hazardous effect of synthetic materials which is leading people towards the use of environmental-friendly natural and recycled materials [14–16]. Several researchers are studying natural materials and fibers to develop acoustic insulation materials due to their positive environmental effect, low carbon footprint, and less harmful effect on health [17–20]. For example, Putra et al. used pineapple-leaf fibers [21] and Or et al. used oil palm fibers [22] to produce sustainable insulation materials. But some scholars questioned the true sustainability of some natural fibers as toxic chemicals and pesticides may be used during the cultivation of the natural fibers [23]. Hence, using recycled or waste textiles either natural or synthetic is a better option to produce sustainable sound insulation materials. Every year millions of tons of clothing and textile wastes are discarded to landfill which cause serious environmental pollution. Globally, nearly 20% of waste is generated by the fashion industry, about 15% of fabric intended for clothing ends up on the cutting room floor. Reports state that $240 million of scrap cotton denims are burned or buried annually [24]. In 2017, 16.9 million tons of textile waste was produced in the USA which was about 6.3% of total municipal solid waste (MSW). Among these huge amounts of textile wastes, only 2.57 million tons were recycled and 11.15 million tons were discarded to landfill [25].
The matter of great concern today to most industries, communities, and governments is the magnitude of waste that is generated and its negative impact on the environment. Textile waste that is landfilled, pollutes the environment by contaminating groundwater and forming greenhouse gases upon decomposition [26]. Along with the adverse effects on the environment by non-biodegradable and toxic nature of synthetic waste, biodegradable textile waste also pollutes the environment by producing methane, a powerful greenhouse gas, after decomposition [27].
Therefore, if it is possible to produce useful materials by using recycled textiles, it will bring multiple benefits. Acoustic insulation materials from recycled textiles can help get rid of environmental adverse effects due to landfilling of textile wastes, can help the reduction of fiber production by extraction or agricultural methods which contribute the highest amount of carbon footprint in apparel sectors [26], and can help minimize the deleterious effect of noise pollution. Waste for one sector would be a prospective reusable resource for another segment.
Materials produced from textile fibers are porous in structure that have the ability to absorb sound energy and are suitable to produce good insulation materials [28]. When sound energy enters the porous structure of materials, the kinetic energy of the sound is converted into heat energy as the sound strikes the surface of the fiber. Sound energy is reduced within the porous fibrous structure due to frictional losses, momentum losses, and generation of heat [29].
However, there are also some obstacles to use textile fibers especially waste textiles for value-added materials. One of the challenges for using recycled natural fibers in traditional textiles is its shorter fiber length. Nonwoven techniques can use short fibers and overcome this obstacle. Also, products produced by nonwoven techniques have very good acoustic properties in the mid and high frequency (around 2000 Hz) [30]. Another obstacle with natural fibers is their irregularity. Natural fibers have larger diameters, but cross-sections are more irregular compared to synthetic fibers. These irregularities and unevenness of fiber structure make them very difficult to develop accurate models for acoustic properties [31–33].
There have been some efforts to develop models to show the relationship between acoustic properties and different macro/micro-structural parameters of fibers [34,35] including fiber length, fiber diameter, porosity, bulk density, and thickness. Empirical models have been formed by some researchers using regression analysis or curve fitting procedures [36–38]. Delany and Bazley proposed of fibrous absorbent materials for predicting acoustical properties [39]. This model was developed over a specified frequency (f) range (10 < f/σ < 1000, σ is the specific flow resistivity) and with a porosity of the material close to 1. So, this model can be applied with the materials which have a high fraction of pores. Again, their model was prepared by measuring fibers whose diameters were between 1 and 10 µm. But some natural fibers’ diameters are around 20 to 50 µm [23]. Hence, this model has limitation for use with structures produced from thicker fibers [38]. Garai and Pompoli used thicker polyester fibers (20 to 50 µm diameter) and proposed a model modifying the Delany–Bazley model’s limitations, which gives more accurate results for predicting acoustical properties for fibers with larger diameters [23,38]. Still, it has some limitations as this model used synthetic fibers, for which shape and diameter are more uniform than those of natural fibers [40]. Hence, in order to produce a successful acoustic insulation product from natural textile waste, a model is required that can show the relationship between acoustic properties and the properties of natural fiber products including porosity, density, thickness, and fiber diameter.
Some researchers have already taken steps to develop acoustic insulation materials by using recycled textiles. Some materials are already present in the markets, and majority of the materials are in research or development stage [11]. Ricciardi et al. used recycled polypropylene fiber and paper to produce acoustic insulation materials. Although they produce good insulation materials, their products cause relatively large energy consumptions (267.7 MJ) and a high global warming potential (14.68 kg CO2eq) in comparison to similar synthetic insulation materials like EPS [41]. This may be due to the use of glue for binding fibers. Therefore, for producing sustainable insulation materials from recycled textiles, researchers may need to avoid external chemicals for binding. In this research work instead of using any chemical resin/binding, thermoplastic fibers (PLA or Sorona®) were used as binding agents. Polylactic acid (PLA) is a biodegradable and bio-based aliphatic polyester that is derived from renewable sources such as corn sugar, potato, and sugar cane [42]. PLA exhibits optical, mechanical and thermal properties that are comparable with some of the commercially available synthetic materials including polypropylene (PP) and poly (ethylene terephthalate) (PET), and may be able to replace the synthetic materials in a wide range of applications [43,44]. Sorona® fiber recently commercialized by DuPoint is derived from corn-based 1,3-propanediol [45]. Sorona® 3GT has unique stretch-recovery characteristics, excellent physical and chemical properties, dimensional stability, low moisture absorption, easy-care, good weather resistance, easy processability, and recyclability. Also, recycling of Sorona® is made much easier by the absence of heavy metals in the product, compared to that of PET and Nylon [45]. Some other researchers like Tiuc et al. mixed polyurethane foam with textile waste [46] and Trajković et al. used polyester apparel cutting waste to produce acoustic insulation materials [47]. However, the research is in very initial stages and present market is completely occupied by conventional synthetic acoustic insulation materials. Additional research is needed to make insulation materials that are lightweight, thin, cost-effective and have very good acoustic insulation properties [33,48,49].
The goal of this study was to demonstrate that the post-consumer textile waste is suitable to produce commercially feasible sustainable products for acoustic insulation by using nonwoven fabrication techniques. The plan was to use recycled denim fibers (mainly cotton) and a compostable thermoplastic binder fibers to successfully produce insulation materials. The relationship of sound transmission loss with several factors including frequency, air permeability, thickness, and density of the fiber-based composites was developed using a statistical regression model. Also, acoustic properties of the developed materials were compared with those of the commercially available materials.
Materials and methods
Materials
Composite samples were prepared by mixing recycled denim (cotton fibers) with Sorona® or PLA fibers at different ratios. Post-consumer denim waste fibers (cotton fibers) were obtained from Phoenix Fibers which is a textile-based recycling company [50]. Sorona® fibers were provided by DuPont Chemical Co., Wilmington, DE. PLA staple fibers were provided by Fiber Innovation Technology, Inc., Johnson City, TN. Both PLA and Sorona® staple fibers are derived from corn starch as the source. The properties of used Sorona® and PLA fibers obtained from the manufacturer are listed in Table 1.
Properties of PLA and Sorona® staple fibers.

Processing
Web formation by nonwoven techniques
Figure 1(a) to (d) shows different components of the web formation process. Fiber webs with uniform thickness were produced by the dry-laid process where the blended fibers were passed through a carding machine. At first, recycled denim fibers (Figure 1(a)) is blended with the thermoplastic binding fibers Sorona® (Figure 1(b)) or PLA at different ratio by weight. Then the blended fibers were fed into the laboratory carding machine (Figure 1(c)) where it is passed through different fine wire mounted rollers. Carding and stripping actions that occurs during this process open and clean the fibers and produce uniform fiber webs (Figure 1(d)).

Different components of insulation panel preparation: (a) recycled denim, (b) biodegradable binder fiber (Sorona®), (c) carding machine, (d) prepared blended fiber web, (e) hot press and (f) consolidated panel.
Composite preparation
Insulation panels were prepared by blending of recycled denim and the binder fibers at different ratios as given in Table 2. The carded webs were consolidated using a laboratory Carver hot press where the values of heat and pressure applied during the sample preparation could be controlled. Several layers of fiber webs produced from the card web were combined. These layers of fiber webs were placed between the two plates of a carver hot press (Figure 1(e)) and then formed into composite panels (Figure 1(f)). Based on initial trials and visual examination of samples, the temperature and pressure used in hot press were fixed, and they were different for the two binder fibers used due to differences in their melting temperature. Composite panels were produced by varying fiber compositions, temperature, pressure, number of layers, and the type of binders (Table 2). Sample one to three were produced with increasing Sorona® fiber percentage as binder content. The fourth sample had the PLA binder fiber and correspondingly lower bonding temperature was used. Also, more layers of webs were used in sample 4. PLA binder sample was added in this investigation to show that comparable panels can be produced at a lower temperature, which is probably desirable to reduce the chances of degradation of cotton.
Different parameters of composite samples.

Characterization
Determination of thickness and density
At first, samples were conditioned for 48 hours in a standard atmosphere i.e., (20 ± 2)°C temperature and (65 ± 2)% relative humidity. Thickness of samples was determined in accordance with the standard testing method of ISO 9073-2 [51]. Thinckness was measured using the progage thickness tester.
Samples were weighed using an electronic balance and area of the samples was measured. After that areal density, s (g/m2) was calculated by dividing weight over area. Bulk density, ρ (kg/m3) was calculated from areal density and thickness by using the following formula.
Multiple measurements were taken for each sample as per the standard, and average values of thickness, areal density, and bulk density were calculated.
Determination of air permeability
Air permeability is the rate of airflow passing perpendicularly through a known area of porous material under a certain air pressure difference [52]. Air permeability was measured using a Textest FX 3300 instrument following the standard method ASTM D737 [53].
Determination of porosity
Porosity is the ratio of the voids to the total volume of materials [54]. Porosity (ϕ) of composite panels were calculated by the following relation [18].
Determination of tortuosity
Tortuosity of a porous material is the ratio between the actual flow path length to the straight distance between the ends of the flow path [56]. Tortuosity (τ) were calculated using the following empirical formula [57].
Determination of mean flow pore pressure, diameter, and pore size distribution
Mean flow pore indicates the size of the pore that allows half of the full airflow through the materials. Porous materials Inc. (PMI), model no. CFP-100AEX, instrument was used to measure the mean flow pore pressure, pore diameter, and pore size distribution of different composite panels following the standard test method ASTM F316-03 [58].
Surface morphology of composite panels
A FEI Teneo field emission scanning electron microscope (FE-SEM) was used to analyze the surface of composite panels. Gold coating was done to each sample before capturing SEM pictures.
Determination of fiber diameter and distribution of fiber diameter
Some of the useful parameters that can influence the sound absorption are the fiber diameter and distribution of fiber diameter. Average fiber diameter and distribution of fiber diameter of composite panels were determined using ImageJ Software from SEM observations. In this case, cotton fibers were assumed to be round for approximation.
Determination of acoustic properties
Acoustic properties of a material can be determined by measuring several parameters including transmission coefficient, transmission loss and absorption coefficient. In this research, transmission coefficient and transmission loss were measured using four-microphone impedance tube.
Principle of measurement
Impedance tube with four microphones was used to measure the acoustic properties of composite panels. By using four microphones impedance tube several parameters including sound transmission coefficient (τ) and transmission loss (TL) can be calculated [59].
The schematic diagram of four microphone impedance tube is shown in Figure 2. A sound source and an anechoic termination were mounted on the left and right end of impedance tube respectively. One set of two microphones (1 and 2) was fixed in the upstream tube and another set of two microphones (3 and 4) was fixed in the downstream tube. A sample is placed between the two sets of microphones. Distance of four microphones from the front surface of sample is denoted as x1, x2, x3, and x4 respectively. A single frequency sound was generated from the sound sources and it was passed through the sample. A and B indicate the incident and reflected sound component in the upstream tube, and C and D indicate the transmitted and reflected sound component in the downstream tube respectively. Coefficient of A, B, C, and D can be determined using following equations [59].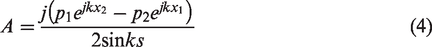


Schematic diagram of the impedance tube for measuring the sound transmission loss.
The transmission coefficient, τ and transmission loss, TL [59] can be calculated using the following equations

Test procedure: Figure 3 shows the actual four microphone impedance tube used to measure the acoustic properties of the composite panels. The instrument was developed and assembled as described in an earlier paper [60].

Four microphone impedance tube for measurement of acoustic properties.
A data acquisition (DAQ) instrument was attached with 4 microphones and a computer. BK precision signal generator was connected to a speaker which delivered different frequency to the sample. Fast Fourier Transform (FFT) spectrum analyzer was used to analyze the signal and measure the sound in decibel at different microphone points. International standard ASTM E2611 – 17 [61] was followed as guidance to complete the test procedure. Transmission coefficient and transmission loss were calculated using equations (8) and (9).
Statistical analysis and modeling of acoustic properties
Statistical analysis of different test results of the samples carried out. A statistical regression model of sound transmission coefficient and transmission loss was carried out using JMP software. Model is helpful to predict sound transmission loss at different frequencies. Comparison of measured and predicted sound transmission loss of composite panels at different frequencies was also carried out (using JMP software) to check whether there is any deviation between predicted value of sound transmission loss with measured value of sound transmission loss. Relation of transmission loss with respect to thickness, areal density, and air permeability are plotted.
Results and discussion
Physical properties
The acoustical properties of different samples are presented and discussed in the following sections. Physical properties of composite samples including air permeability, thickness, areal density, bulk density, porosity, and tortuosity are shown in Table 3.
Properties of tested sample.

From data in Table 3, it is obvious that the bulk density and porosity of the composite samples are high. All of the samples had comparable values of porosity and mean flow pore diameter. Density of sample A3 is comparatively higher and porosity is comparatively lower. The thickness of sample A3 is much lower than other samples due to better consolidation, but the areal density is lower, which may lead to comparatively higher air permeability of sample A3. Fabric thickness from sample A1 to A3 has been decreasing due to the difference in the structure of samples caused by increasing binder fiber content. Sample A3 has higher percentage of binder fibers which melted at high temperature. Similarly, thickness of sample A4 is much higher, mainly due to the fact that it had more layers of fibers, and its air permeability is much lower than that of other samples.
Analysis of composite surface
SEM pictures allow us to analyze the morphology of the prepared composite samples. The convolutions of cotton fibers are clearly visible in all samples (Figure 4). It is apparent that most of the binder fibers have melted and fused together at high temperature and pressure. It is also observed that melting and fusing occurred more at the surface than inner part of the composite materials. More amount of fusing and solid surface was observed in sample A3 where higher percentage of binder fiber was used. However, there was still enough porosity in the structure and thus air permeability was higher.

SEM image of four different composite samples (A1, A2, A3, and A4).
Fiber diameter and distribution of fiber diameter
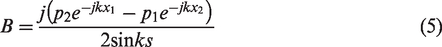
The distribution of fiber diameter is presented in Figure 5. Fiber distribution is unimodal and close to symmetrical. Most of the fiber diameters are within the range of 12 to 22 µm. The average fiber diameter of four different composite samples A1, A2, A3, and A4 are 16.3 µm, 16.8 µm, 16.2 µm, and 17.4 µm respectively which are almost similar to one another.
Distribution of fiber diameter of four different composite samples (A1, A2, A3, and A4).
Pore size distribution
The distribution of pore size is presented in Figure 6. Pore size distribution of composite samples is unimodal and asymmetrical. Sample A2 shows left-skewed pore distribution and sample A3 shows a little bit right-skewed pore distribution. All the pore sizes are within micro scale. Most of the pore size values of composite samples are between 10–25 micrometers and medians are located around 15–20 micrometers. Sample A3 has higher number of smaller pores within the range of 10–15 micrometers. This reduction in pore size is due to higher level of consolidation of the webs as discussed above due to higher amount of binder content used. Sample A4 has higher number of pores within the range of 15 – 20 micrometers, again an indication of overall better consolidation of the webs.
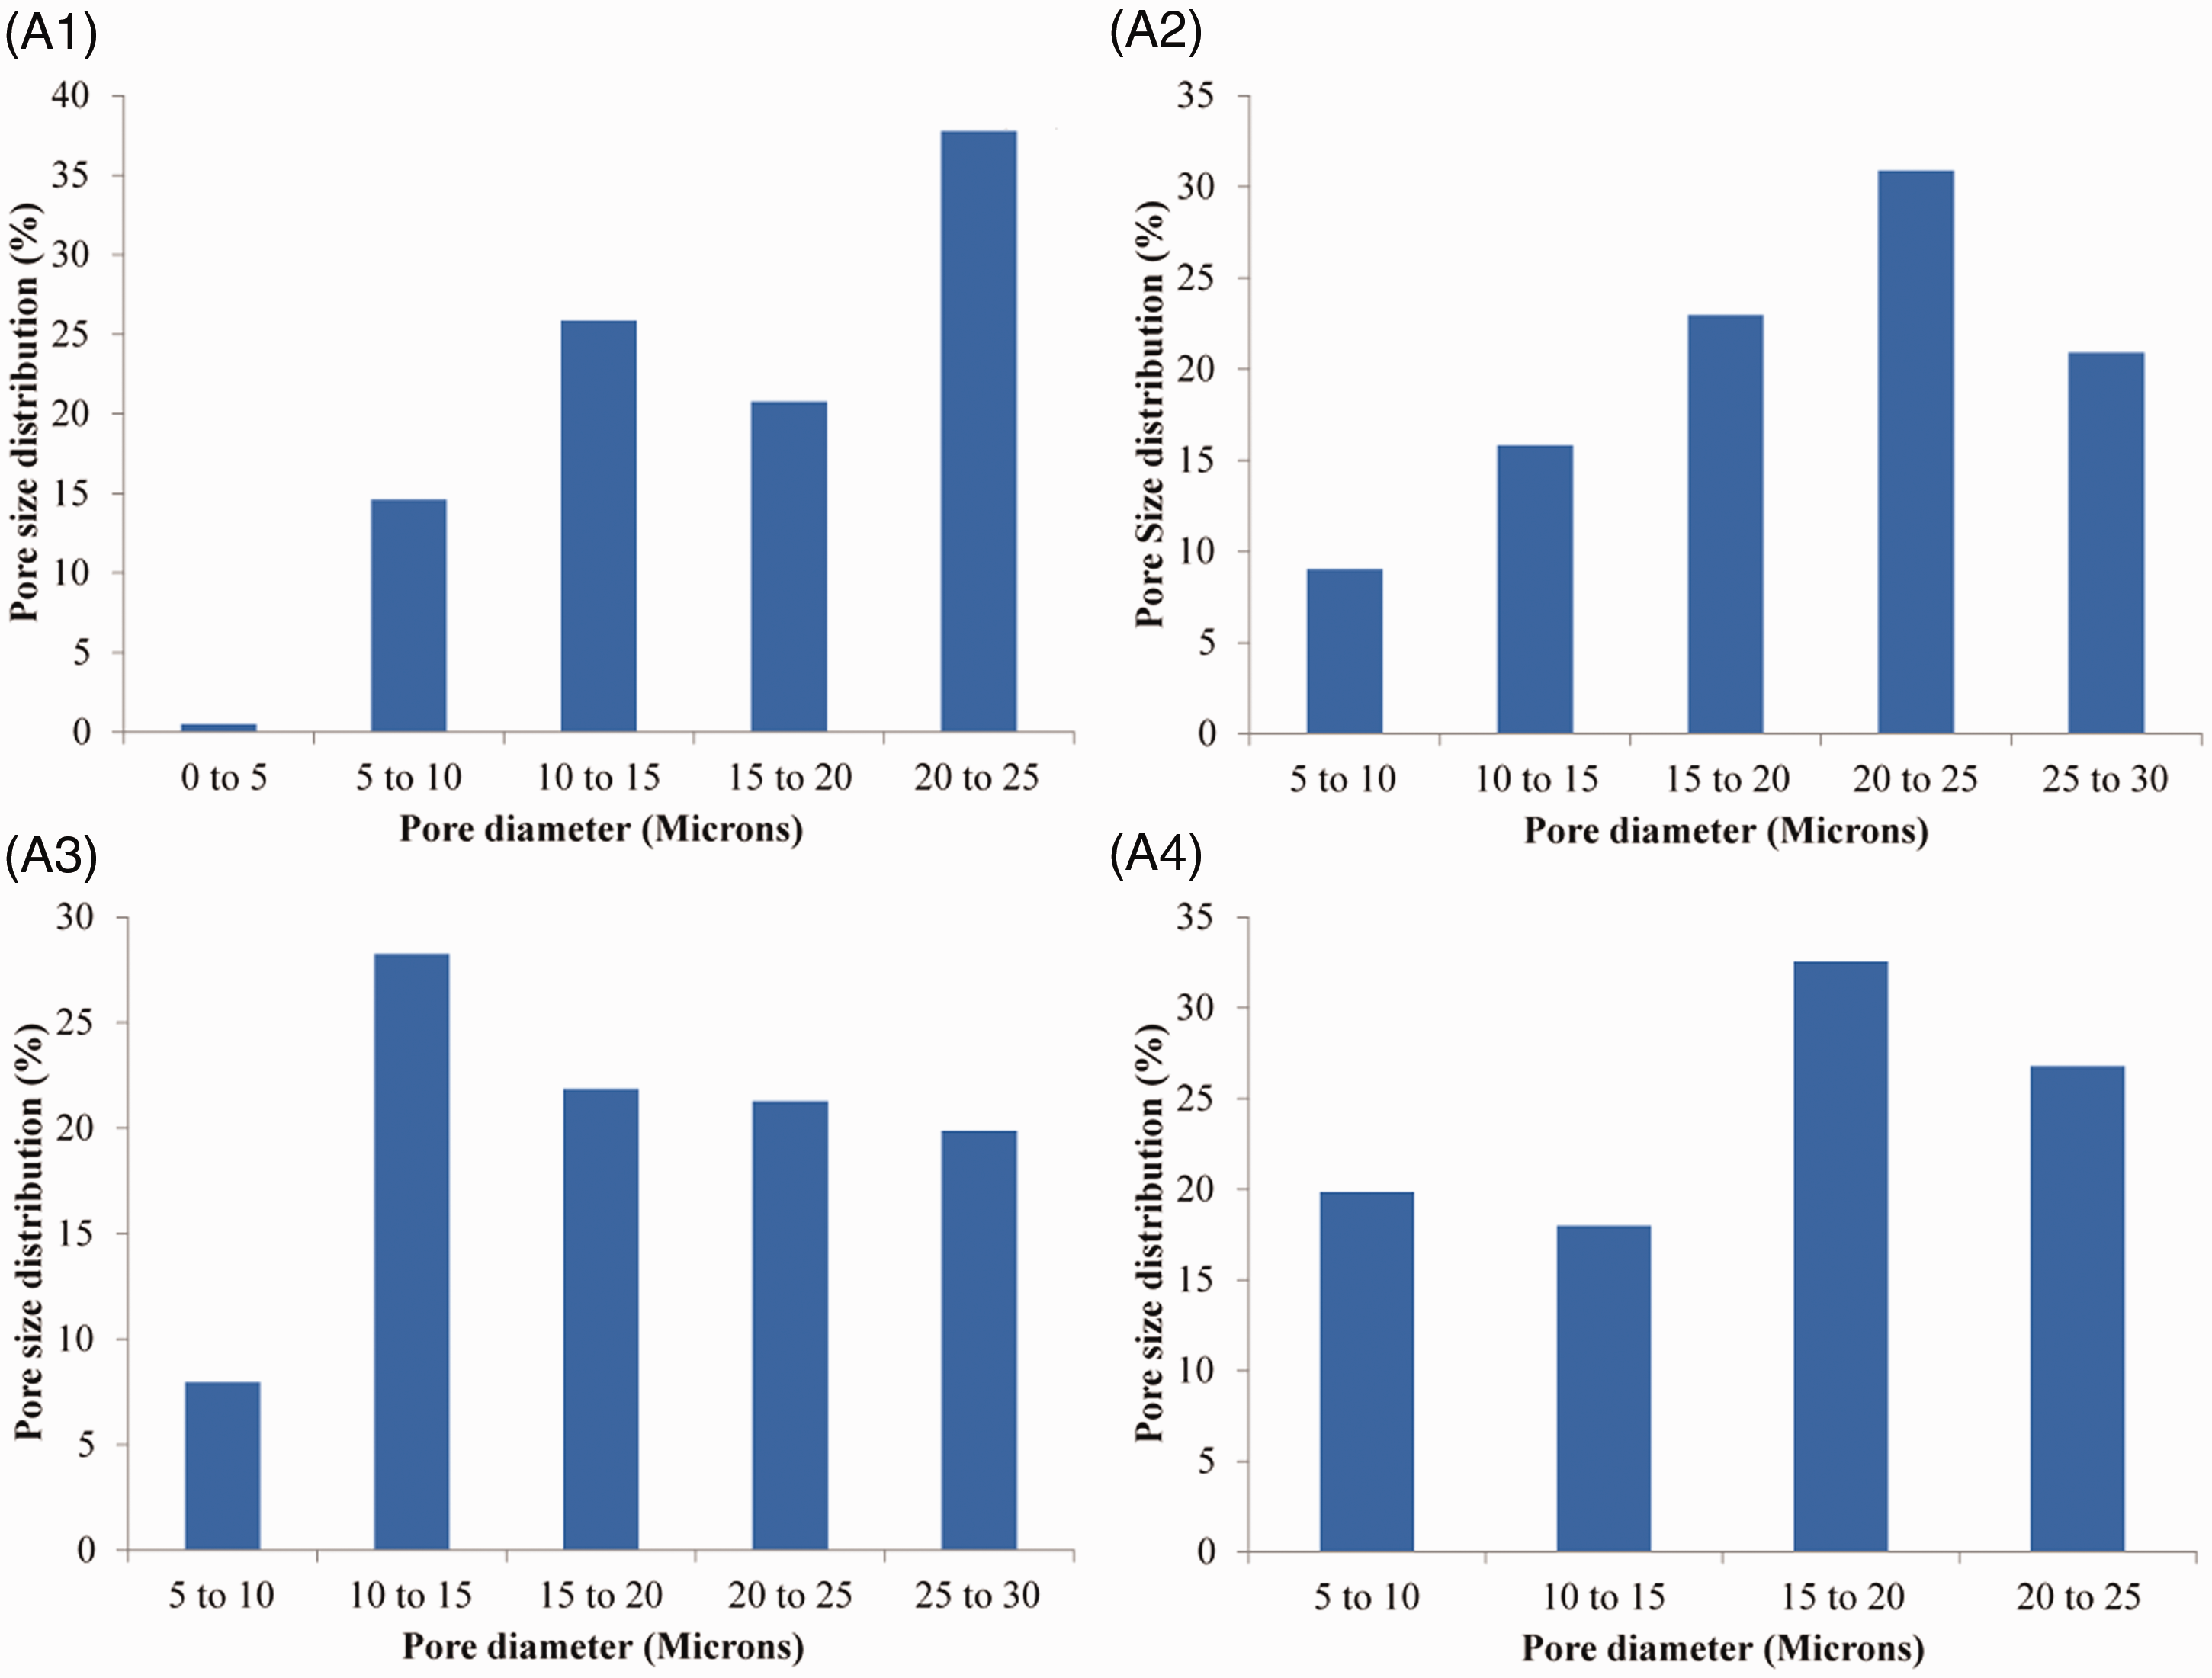
Pore size distribution of four different composite samples (A1, A2, A3, and A4).
Acoustical measurement
Transmission coefficient
Transmission coefficient is the fraction of incident airborne sound power that is transmitted through the material. Transmission coefficients of the four different samples at different frequencies are shown in Table 4.
Transmission coefficient (τ) at different frequency.

All of the samples showed similar trends. Transmission coefficient is very high at low frequencies and low at medium frequency, from 600 Hz to 1800 Hz. After 2000 Hz, transmission coefficient increases again. These observations are similar to those observed by other researchers for porous fiber-based insulation materials [5] and the phenomena were discussed in the following sections. Sample A3 showed higher transmission coefficient whereas sample A4 showed lower transmission coefficient.
The transmission coefficient observed seem to relate well to the differences in thickness and permeability of the samples. Sample that showed lowest transmission coefficient was the thickest and had the lowest permeability.
A regression analysis of transmission coefficient (Figure 7) was done to develop models which may be helpful to predict transmission coefficient at different frequencies.

Statistical model of sound transmission coefficient of four composite panels at different frequencies.
Transmission loss
Transmission loss is the loss of sound while passing through a material. Transmission loss of the four samples at different frequencies are presented in Table 5.
Transmission loss in dB of four composite panels at different frequencies.

Transmission loss of sound of four different samples also showed similar trends at different frequencies. This trend is exactly opposite to that of the transmission coefficient, as expected i.e. higher the transmission coefficient, lower the transmission loss and vice versa. Transmission loss is very low at low and high frequencies and transmission loss is very high at medium frequency range from 600 to 1800 Hz. Sample A3 exhibited comparatively lower transmission loss whereas sample A4 exhibited higher transmission loss. This may be due to the difference in the thickness, microstructure, and lower air permeability of the sample A4 compared to other samples. A regression model of transmission loss (Figure 8) was developed that may be helpful in predicting transmission loss at different frequencies.
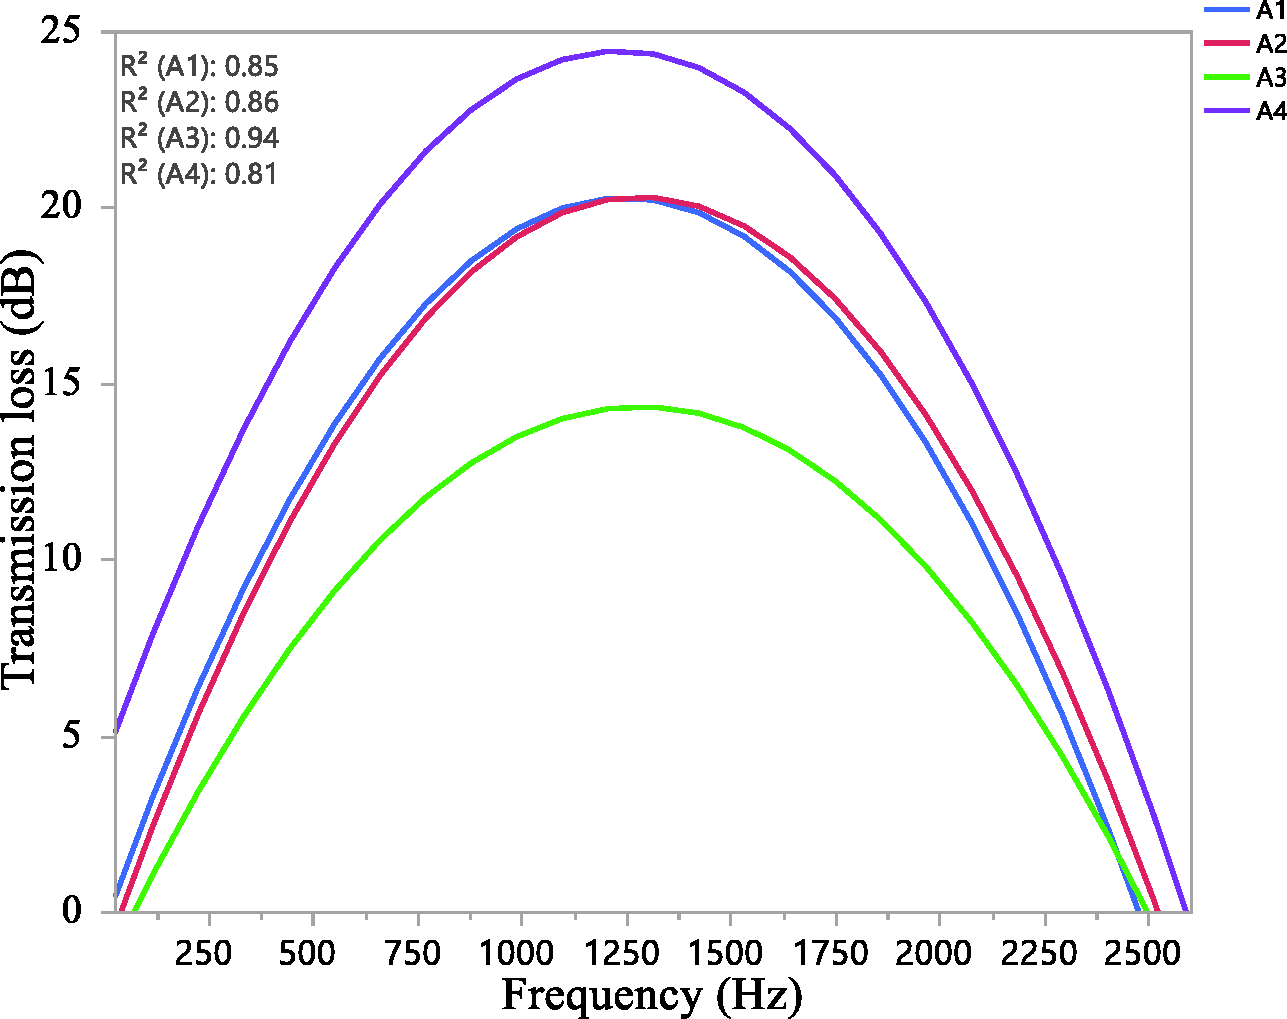
Statistical model of sound transmission loss (dB) of four composite panels at different frequencies.
Model was also compared with actual measured data of four composite panels (Figure 9). It was observed that the measured value of sound transmission loss is almost similar to the prediction line. There are some deviations at the lower frequency, but the deviation is very small.

Comparison of measured and predicted sound transmission loss (TL) in dB of four composite panels (A1, A2, A3, and A4) at different frequencies.
Several other researchers also observed similar trends of lower acoustic insulation properties for porous materials at low frequencies and higher acoustic insulation properties at medium frequency range [5]. When sound waves enter into porous materials, air molecules within the pores vibrate that transform sound energy into thermal and viscous heat [23,60]. At low frequencies, this energy is dissipated by the isothermal process (limited amount) but at high-frequency range, energy is lost by the adiabatic process [62]. As a result, a low amount of sound is absorbed in low frequency range, but absorption is higher at higher frequencies (resulting in low sound absorption coefficient at low frequencies). That’s why porous materials show good acoustic insulation properties at medium frequency range. On the other hand, energy of wave decreases with the increases of frequency. At very high frequency, sound energy is not strong enough to vibrate the air molecule. Therefore, transformation of sound energy to thermal and viscous heat is less and as a result transmission loss of sound is also less.
Effect of air permeability, thickness, and density on sound transmission
Influence of air permeability on sound transmission can be seen in Figure 10. It is obvious that air permeability has a profound effect on sound transmission loss. Air permeability is inversely related to sound transmission loss i.e. with the increase in air permeability sound transmission loss decreases. Due to high air permeability more sound energy passes through the materials. Less internal reflection of sound energy occurs within the porous structure, and as a result, less sound energy is converted and dissipated into thermal and viscous heat. In this study, sample A4 has low air permeability and higher sound transmission loss.
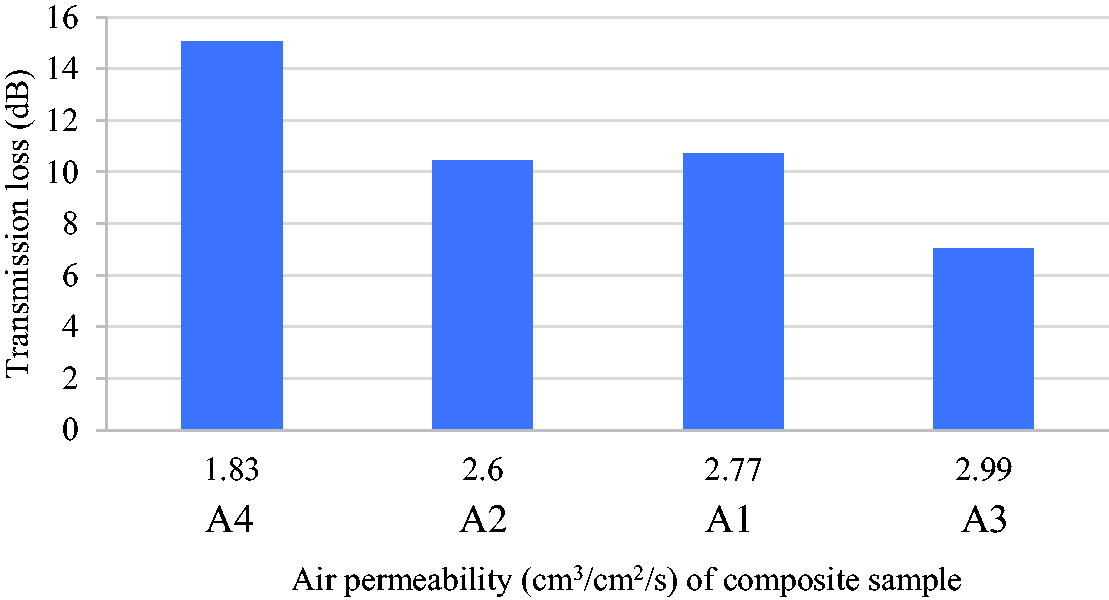
Relation of air permeability with sound transmission loss of four composite panels.
Thickness is one of the most important factors that influence sound transmission. Changes in sound transmission loss with thickness are plotted in Figure 11. Sound transmission loss increases with increases in thickness. Sound energy has to travel through a comparatively longer path when it passes through thicker materials. As a result, more sound energy is entrapped within the porous structure and converted into thermal and viscous heat.
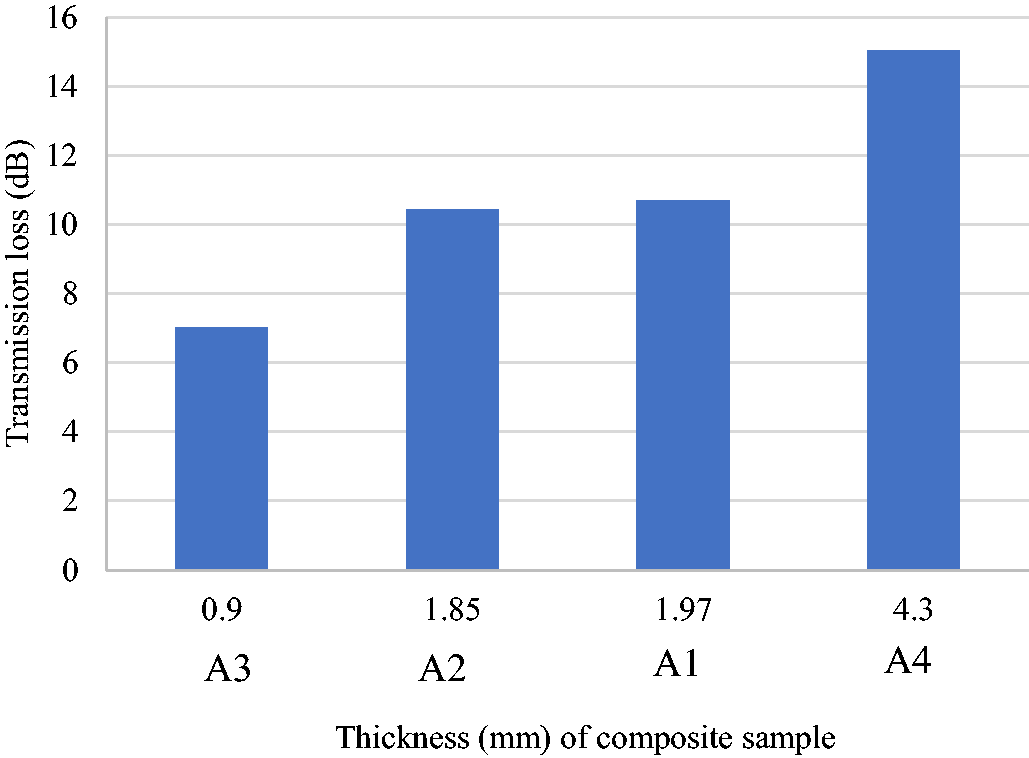
Relation of thickness with sound transmission loss of four composite panels.
Similar to thickness, areal density also has a significant impact on sound transmission loss. Sound transmission loss increases with increase in areal density of the composite panels (Figure 12) due to the larger distance the sound has to travel through longer path to pass the material successfully.

Relation of areal density with sound transmission loss of composite panels.
A similar relationship has been observed by some other authors. Koizumi et al. found that textile fibers with high density and thickness can increase the sound absorption properties at medium frequency ranges [63]. Liu et al. also observed that insulation properties of composite materials increased with the increase of no. of layers and thickness [64]. Küçük and Korkmaz explained that thicker materials have comparatively lower air permeability that increases the acoustic properties of the materials [65]. This research also shows an identical pattern for the composite materials produced from recycled fibers. Thickness of sample A4 is comparatively higher and results in lower air permeability and higher sound transmission loss.
A regression analysis was done to develop statistical model that is helpful to predict sound transmission loss with the variation of areal density, thickness, and air permeability. All three models are combined in Figure 13 to compare and predict the effect of areal density, thickness, and air permeability on sound transmission loss. It is shown from Figure 13 that r2 value of all three models is very high (close to 1) which indicates that almost all of the variation of sound transmission loss can be explained by the relation between transmission loss with areal density, thickness, and air permeability.

Statistical model of transmission loss (dB) with variation of areal density, air permeability, and thickness.
From the statistical model (Figure 13) it is clearly observed that the transmission loss of sound can be increased by increasing thickness and density and with the decreasing of air permeability of materials. But at the same time, air permeability decreases with the increases in thickness and density. For successful commercialization of a product, it is necessary to optimize all the properties. Based on this model (Figure 13) it may be concluded that in case of acoustic insulation panels produced from recycled textile fibers the optimum acoustic insulation properties may be found at the areal density of around 1125 (g/m2) and at the thickness of around 2.7 mm.
Comparison with commercially available acoustic insulation materials
One of the most commonly used building insulation material is gypsum board. The sound transmission loss of 15 mm thick gypsum board is 26.3 dB [5]. The thickness was normalized to unit mm and the sound transmission loss of gypsum board with our insulation materials were compared (Table 6). It is observed that the sound transmission loss of these insulation materials A1, A2, A3, and A4 are 5.43 dB, 5.64 dB, 7.81 dB, and 3.5 dB respectively which is higher than the sound transmission loss (1.76 dB) of gypsum board of comparable thickness, assuming the normalization holds good. This indicates that the recycled composite panels have great potential to be used as acoustic insulating materials.
Comparison of sound transmission loss of prepared composite panels with the sound transmission loss of commercially available insulation panels, gypsum board.

Conclusion
In this study, waste textiles were used to produce environmentally-friendly alternative acoustic insulation materials. Recycled denim and Sorona®/PLA binder fibers were blended at different ratios to produce four different composite panels. Several structural parameters were measured. It is observed that the composite panels are microporous and most of them are within the range of 10–25 micrometers. Similarly, most of the fiber diameters are situated within the range of 12 to 22 µm and the distribution of diameters is unimodal, close to symmetrical.
Samples produced from recycled denim and PLA blend (60% recycled denim and 40% PLA) show maximum transmission loss of over 23 dB at around 1200 to 1600 Hz. The effect of several structural parameters including air permeability, thickness, and areal density on sound transmission loss was analyzed. Sound transmission loss increases with increase in thickness and areal density but decreases with the increase of air permeability. Lower the percentage of biodegradable binder fiber (Sorona®) the better performance of sound absorption of composite panels. Statistical models were developed and compared with actual measured value. It is observed that the measured value and predicted value are almost similar. From the regression model, it can be predicted that composite materials with around 1125 (g/m2) areal density and 2.7 mm thickness give optimum acoustic insulation properties. A comparison of acoustic properties was done with commercially used insulation material gypsum board and it is noticed that composite panels produced from waste denim have better acoustic insulation properties.
The environmental benefits of produced composite materials are also very high and are not only limited to the reduction of harmful effects of noise pollutions. These composite panels will help get rid of the adverse environmental effects due to landfilling of textile waste as well as also help the reduction of fiber production by extraction or agricultural methods. These materials will also help to reduce the production of presently used synthetic insulation panels. This study demonstrated that recycled textiles can have another life as insulation materials before being safely disposed of in composting environment, where it can breakdown into simple chemicals. However, additional research work including life cycle assessment is necessary to get complete idea about the environmental effect of these acoustic insulation materials.
Footnotes
Acknowledgements
Authors are thankful to Cotton Incorporated for funding part of this project, and Edward Schut from GeoPellet for valuable discussions. Also, support by providing samples from DuPont Polymers, Wilmington, DE, FIT Fibers, Johnson city, TN and Phoenix Fibers, Chandler, AZ is acknowledged.
Declaration of conflicting interests
The author(s) declared no potential conflicts of interest with respect to the research, authorship, and/or publication of this article.
Funding
The author(s) disclosed receipt of the following financial support for the research, authorship, and/or publication of this article: This work was supported by Cotton Incorporated.