
Abstract
The present research aimed to investigate the influence of layer arrangement and composition ratio on tensile and transport properties in bi-constituent electrospun nanofibrous membranes composed of polyurethane nanofibers with a hydrophobic nature and poly(2-acrylamido-2-methylpropanesulfonic acid) with a hydrophilic nature. Different hybrid electrospun nanofibrous membranes were produced based on different layer arrangement and composition ratios. To evaluate the membrane performance, their tensile strength, wind, and waterproof performance were measured. By adding 50% poly(2-acrylamido-2-methylpropanesulfonic acid) to polyurethane, the pore size of the hybrid electrospun nanofibrous membranes decreased by 47.64%. As a result, compared with pristine polyurethane membranes, hybrid electrospun nanofibrous membranes showed a good (9.6 mm s−1) windproof performance. Adding poly(2-acrylamido-2-methylpropanesulfonic acid) nanofibers to the polyurethane resulted in a decrease in mechanical properties and waterproof performance. The results show that the volume fraction of the poly(2-acrylamido-2-methylpropanesulfonic acid) and the electrospinning scenarios have a great influence on the mechanical properties of the samples. The results also show that the mechanical properties of hybrid electrospun nanofibrous membranes can be predicted based on the geometrical properties of each component. Computational fluid dynamics were used to simulate air flow through a virtual medium and the results of simulation were compared with the experimental measurement and predicted permeability; then, the best models for predicting air permeability were determined. In addition, based on different types of use, duration of use, and relative humidity level, a bi-functional membrane can be obtained by regulating layer arrangement and composition ratios to suit various applications, for example, in medical disposable clothing, wound dressing, filtering industries, and protective clothing.
Keywords
Introduction
Breathable and water/windproof fabrics resistant to water and wind penetration and allow to water vapor permeation can protect the wearer from external heat, wind, and water while providing good breathability and comfort [1–4]. In the last few decades, several technologies have been developed and materials such as densely woven fabric, laminated and coated fabric have been produced. In these conventional waterproof breathable fabrics, there is usually an inverse relationship between comfort and protection level such that the more comfortable a fabric is, the less protective it is or vice versa. In other words, water repellency and water vapor permeability are two mutually contradictory functions [5–7]. In these materials, breathability is often ignored in favor of protectiveness. Little wonder, then, producing a material featuring both these properties has always proved a daunting task [1,7].
Recently, the porous membranes and polymer nanofiber mats with resistance to water and wind penetration and breathability properties have gained considerable attraction in fields such as tissue engineering [8], filtration engineering [9], medicine [10–15], and, specially, protective clothing [6,16,17]. These functional materials have now become an integral part of new products produced in the form of protective clothing. These membranes can be produced by a number of techniques such as template-based methods [18], biaxial stretching [19], and phase separation [20]. However, in view of some limitations inherent in these methods, for example, the difficulty in regulating the porous structure, they fail to obtain a membrane with an acceptable water/windproof and breathable performance [21]. Electrospinning, as an effective and promising technique in producing porous nanofiber membranes, has been widely applied in the fabrication of water/windproof and breathable membranes [16,21–23]. In the past decade, with the development of the traditional electrospinning techniques, many electrospinning methods such as melt electrospinning [24,25], needleless electrospinning [26], and bubble electrospinning [27–29] have emerged. Thanks to these methodologies, membranes with a fiber diameter both on the micro scale and the nano scale have been produced. These membranes have a very small pore size, which prevents penetration of water droplets; though its pore size is small, it is larger than that of a water vapor molecule so as to allow water vapor transfer from the body to the environment [16,30].
Many pioneering studies such as Gibson et al. [22], Lee and Obendorf [31,32], Gorji et al. [16], Shao et al. [33], Bagherzadeh et al. [34], Yang et al. [21], Kang et al. [35], Sheng et al. [36], Hwa Hong and Jin Kang [37], and Li et al. [38] have shown that electrospun nanofiber membranes have great potential for use in water/windproof breathable materials. The performance of the electrospun nanofibrous membrane (ENM) in protective clothing depends heavily on the polymer’s properties. Hydrophobic polymers such as polyurethane (PU) have good mechanical properties; however, their ability to absorb and transfer moisture is poor. Unlike hydrophobic polymers, hydrogels are capable of absorbing and transferring moisture which offer better cooling and comfort properties; however, their poor mechanical properties have proved a major limiting factor in their application. Some researchers such as Amini et al. [39], Gorji et al. [40], Gorji and Sadeghian Maryan [41], and Salmani Sangtabi et al. [7] have shown that a hybrid ENM composed of different polymers with different properties can be a promising solution to this problem, which can help produce a bi-functional water/windproof breathable membrane with desirable features such as good mechanical strength and high water vapor transmission.
In hybrid ENMs with bimodal nanofiber distribution, fine nanofibers feature a high windproof performance, and coarse fibers provide the required mechanical rigidity. Windproof performance is an important characteristic of protective clothing, and predicting pressure drop (permeability) in these structures for evaluating of windproof performance is of enormous importance. Little wonder, then, in the past few decades, so many experimental, analytical, and numerical studies have been done to predict the pressure drop of fibrous media. Examples of such studies are Spielman and Goren [42], Jackson and James [43], Clague and Phillips [44], Dhaniyala [45], Clague et al. [46], Chen and Papathanasiou [47], Wang et al. [48], Jaganathan et al. [49], and Hosseini and Tafreshi [50], resulting in the development of various well-known models to predict the permeability of unimodal media. Many authors such as Clague and Phillips [44], Brown and Thorpe [51], and Tafreshi et al. [52] have proposed different models to calculate an equivalent fiber diameter, req, in order to predict the permeability of bimodal fibrous media. Patel et al. [53] compared the results of experimental permeability in an ENM with calculated permeability predicted with the Kuwabara [54] model.
In this study, initially 2-D random fibrous geometries were generated, in order to solve the Stokes flow equation in the void space between the nanofibers. Furthermore, the newest pressure drop expressions and equivalent fiber diameter models with experimental data and simulation results were compared in order to choose the best expressions and models to predict the pressure drop of bimodal ENMs. Gorji et al. [40] and Gorji and Sadeghian Maryan [41] have shown that electrospun PU/(poly(2-acrylamido-2-methylpropanesulfonic acid) (PAMPS)-GO) nanofiber membranes are a good candidate for breathable membranes used in protective clothing. However, in their study, the effect of layer arrangement and volume fraction of PAMPS on membrane performances has not been examined. In our previous study [7], the effect of layer arrangement (structural geometry) and composition ratio (volume fraction of PAMPS) on breathability performance, wetting, and wicking properties of PU/PAMPS hybrid ENMs was examined. As a follow-up, the current study produced different PU/PAMPS hybrid ENMs based on different layer arrangements and composition ratios and went on to examine the effect of layer arrangement (in five levels) and the volume fraction of PAMPS (in three levels) on waterproof and windproof performance and mechanical properties.
Materials and methods
Materials and preparation of solutions
N,N-dimethylformamide (DMF) and tetrahydrofuran (THF) were purchased from Merck (Germany). 2,2-azobisisobutyronitrile (AIBN) was obtained from Sigma-Aldrich (St Louis, MO, USA). PU was purchased from Bayer, Leverkusen, Germany. The PU solution with a concentration of 6% w/w was prepared by dissolving thermoplastic polyurethane pellets in a THF and DMF mixture (60:40, v/v) by stirring with a magnetic mixer for 7 h at room temperature. 2-Acrylamido-2-methyl-1-propanesulfonic acid (AMPS, monomer) was obtained from Daejong Co. (South Korea). PAMPS was synthesized by free radical polymerization techniques according to the following steps, reported in detail in a previous work [55]. To begin with, 17.031 g of AMPS and 40.623 g of DMF were placed into a three-necked round bottomed flask (100 ml). Then 0.190 g of initiator AIBN was added into the solution in a dry nitrogen atmosphere. Next, the three-necked round flask was placed in a water bath and the solution was heated to 80°C and kept for 10 h. The mixture was stirred for 10 h to produce a 30% w/w PAMPS solution.
Electrospinning
The electrospinning conditions are summarized in Table 1. The optimum distance between the nozzle and the collector was obtained to be 140 mm for both nozzles. A voltage of 12 kV was applied for the first nozzle, which includes the PU solution with the feeding rate of 0.4 ml h−1. For the second nozzle, the feeding rate of the PAMPS solution was 0.1 ml h−1 with the voltage set at 16 kV. The rotational speed and transverse speed of the drum were 100 r min−1 and 200 mm, respectively. The solution viscosity was determined by a viscometer (LVDV II, Brookfield Co., USA). During the electrospinning process, the relative humidity and ambient temperature were kept at 30 ± 5% and 22 ± 2°C, respectively.
Electrospinning conditions for PU and PAMPS.

DMF: N,N-dimethylformamide; PAMPS: poly(2-acrylamido-2-methylpropane sulfonic acid); PU: polyurethane; THF: tetrahydrofuran.
Fabrication of hybrid PU/PAMPS ENMs
Different hybrid ENMs were fabricated based on different layer arrangements (varying in five levels) and volume fraction of PAMPS (changing in 33, 50, 66%), considered as independent variables. Descriptions of samples with different types of variables produced in this research are given in Table 2.
Sample description.

PAMPS: poly(2-acrylamido-2-methylpropane sulfonic acid); PU: polyurethane.
aA: PU, B: PAMPS, the number after the letters indicates the volume fraction of PAMPS.
bThe AA, BB, AB codes point to the simultaneous spinning of nozzles, and the sign “/” between the letters indicates the sequence of spinning.
cThe electrospinning order of layers in hybrid-sequential samples is from left to right.
Generally, electrospinning in hybrid samples is broken down into two modes: simultaneous and sequential. The simultaneous mode occurred in AA, BB, and AB electrospun samples. It was performed with two nozzles and both types of nanofibers were deposited on a collector and the final product was produced as a single layer. In the sequential mode, for example in the B/A sample, the electrospinning process was performed with one nozzle, where after the production of PAMPS layer the PU nanofibers were deposited on the PAMPS layer. In this case, the final product can be a two-layer (e.g. A/B, B/A) or three-layer structure (e.g. A/B/A, B/A/B).
Characterization and measurements
Morphology of layers
The morphology of ENMs was characterized using a scanning electron microscope (SEM, VEGA\TESCAN-XMU). The diameter of the nanofibers was determined for 50 randomly selected nanofibers using SEM images and ImageJ software (National Institute of Health, Bethesda, MD, USA), and average fiber diameter was reported. An image processing method has been utilized to calculate the average pore diameter as follows: first, based on the proper threshold level suggested by Ghasemi‐Mobarakeh et al. [56], the original SEM image of the sample was converted to a grayscale using ImageJ software; and second, the equivalent pore diameter (
Geometrical properties of ENMs
The thickness of the layers was measured using a micrometer (Dial Thickness Gauge, Mitutoyo, Japan) and the average of 10 measurements was reported as the web thickness. The weight of the sample was measured with a microbalance, and the average of 10 samples was reported. The solid volume fraction (SVF) of ENMs was calculated using the following equation
Tensile strength
The mechanical performance of ENMs was tested on a tensile tester (Instron 5560) with a load-cell of 0.1 N at room temperature. Crosshead speed was 25 mm min−1 and the membranes were cut into strips with a gauge length of 5 cm. Five samples were tested for each type of layer and the average of test results was calculated and reported.
Hydrostatic pressure
This test was done with a Shirley hydrostatic pressure tester according to AATCC 127 [59]. The hydrostatic pressure test measures the resistance of fabrics to water penetration under a certain pressure (0.5–2 cm of water). In this test method, specimens are clamped on the test head facing water and, once the test has started, samples are subjected to an increasing water (hydrostatic) pressure until three water droplets emerge. For the purposes of this study, five samples were tested and the mean value was reported for each sample.
Air permeability
The air permeability property of ENMs was measured according to the ASTM D737 [60] using the Shirley air permeability tester under a differential pressure of 50 Pa. This test determines the resistance of a sample to the passage of air through a known area under a constant pre-set air pressure difference between two surface samples. The amount of air flow passing from the side with the higher air pressure, through the layer, to the side with the lower air pressure is determined as air permeability. For the purposes of the present study, 10 samples were tested and the mean value was calculated for each sample.
Simulation
Generating a virtual fibrous medium
Except for a few minor changes, the method proposed by Hosseini and Tafreshi [61] was adopted and used for generating virtual nanofiber media. For generating a 2-D virtual fibrous medium with random fibrous geometries, we used COMSOL with MATLAB software, which can produce a 2-D fibrous structure with given fiber diameters, porosities, and thicknesses. The disordered 2-D fibrous medium generation process has been presented in Figure 1(a) as a flow chart [61]. By feeding the size of the square domain, porosity, and fiber diameters to the MATLAB program, the fibers are sequentially and randomly added to the square domain until the desired SVF is achieved. To avoid fiber–fiber overlaps and the contact of the fiber with the walls of the square domain, a minimum space of 1.1df (df as the fiber diameter) is applied between the fibers’ center-to-center distance, as well as between the center of the fibers and the walls of the square domain. The periodic boundary conditions are used for the upper and lower parts of the simulation box. The choice of periodic lateral boundary conditions is due to the fact that a part of the fibrous medium is modeled here and the fibrous medium environment is repeated in the upper and lower boundaries. Therefore, it does not affect the simulation results. It is assumed that air under the velocity-inlet calculated from the experimental data flows into the simulation domain and leaves it from a pressure-outlet boundary condition. In order to ensure attainment of a uniform flow, the inlet boundary conditions are 20df away from the fibrous medium and the outlet boundary conditions are placed at a distance of 5df from the media. The boundary conditions governing the simulation domains are summarized in Figure 1(b). At the end of the virtual medium generation process in MATLAB, the geometry is exported to the COMSOL Multiphysics software via connecting the former to the latter.

(a) Disordered 2-D fibrous medium generation algorithm [61] and (b) boundary conditions considered for the simulations. SVF: solid volume fraction.
Governing equations of fluid flow
In the present study, it has been assumed that air flow through a virtual medium is laminar, incompressible, and at a steady state. Proceeding with the findings of Wang et al. [62], it can be concluded that for the range of fiber size and flow conditions considered here, the inertial effects can be neglected. Air flow through our virtual fibrous media is governed by Stokes equations [50,52,61]

Mesh and size independence
In order to ensure that the simulation result is mesh-independent, one of the fibrous structures (A0) was meshed with a different mesh density. Figure 2(a) shows the result of our mesh independency study. The results show that when mesh density increases to 25 grid points (fine) around the fiber, the pressure drop per thickness remains constant. In this study, the number of grid points around the fiber was at 25 (fine).

(a) Effect of mesh density on pressure drop in A0 sample and (b) effect of the number of fibers in domain (domain size) on the pressure drop in A0 and AA0 samples.
The size of the simulation domain should be large enough such that the simulation results are independent of the size of the simulation domain. To this end, according to Figure 2(b), the effect of the number of fibers on the pressure drop per unit thickness of the media in A0 and AA0 samples has been investigated. The results show that if the number of fibers in A0 and AA0 samples is more than 222 and 267, respectively, the pressure drop per fibrous medium thickness remains constant. In this regard, the number of fibers in A0 and AA0 samples is 569 and 385, respectively; therefore, the simulation results in these layers are independent of the domain size. According to the studies carried out in other samples, the results show that in all the samples studied in this paper, the simulation results are independent of the domain size.
Evaluating experimental permeability
Pressure drop for an incompressible fluid flow across the thickness of the porous media on the transverse permeability was calculated using Darcy’s law [50,63,64]. The experimental permeability (kexp) was obtained using Darcy’s law
Calculating predicted permeability
Various well-known models based on empirical correlation (Davies [65], Ogorodnikov [66]), analytical studies (Sangani and Acrivos [67], Drummond and Tahir [68], Jackson and James [43], Brown [69]), and numerical studies (Hosseini and Tafreshi [50]) have been developed to predict the permeability (k) of unimodal fibrous media. In almost all of these models, the permeability is a function of the SVF of media and fiber radius, which can be expressed as [50,52]
Various well-known models for predicting the permeability of fibrous media.

Various well-known models for calculating the unimodal equivalent diameter for bimodal media.

Results and discussions
Morphology of ENMs
Figure 3 shows the SEM images and average nanofiber diameter of ENMs. Fine electrospun nanofibers with an average diameter of 216.7 nm and with a larger diameter of 543.5 nm were obtained from the PAMPS solution and the PU solution, respectively. The mean nanofiber diameter of PU and PAMPS produced via the simultaneous electrospinning mode (two opposite nozzles), as compared to the reference samples (Figure 3(a) and (b)), increased by 21 and 9%, respectively. This increase in the diameter of the nanofibers can be attributed to the effect of the opposite nozzle’s (e.g. PU nozzle) electric current on the other working nozzle (PAMPS nozzle), so that the electric repulsion created by the opposite nozzle reduced the electric field in the other working nozzle, as a result of which the diameter of the nanofibers increased. A further increase in the PU nanofiber can be attributed to the higher voltage of the opposite nozzle [7].
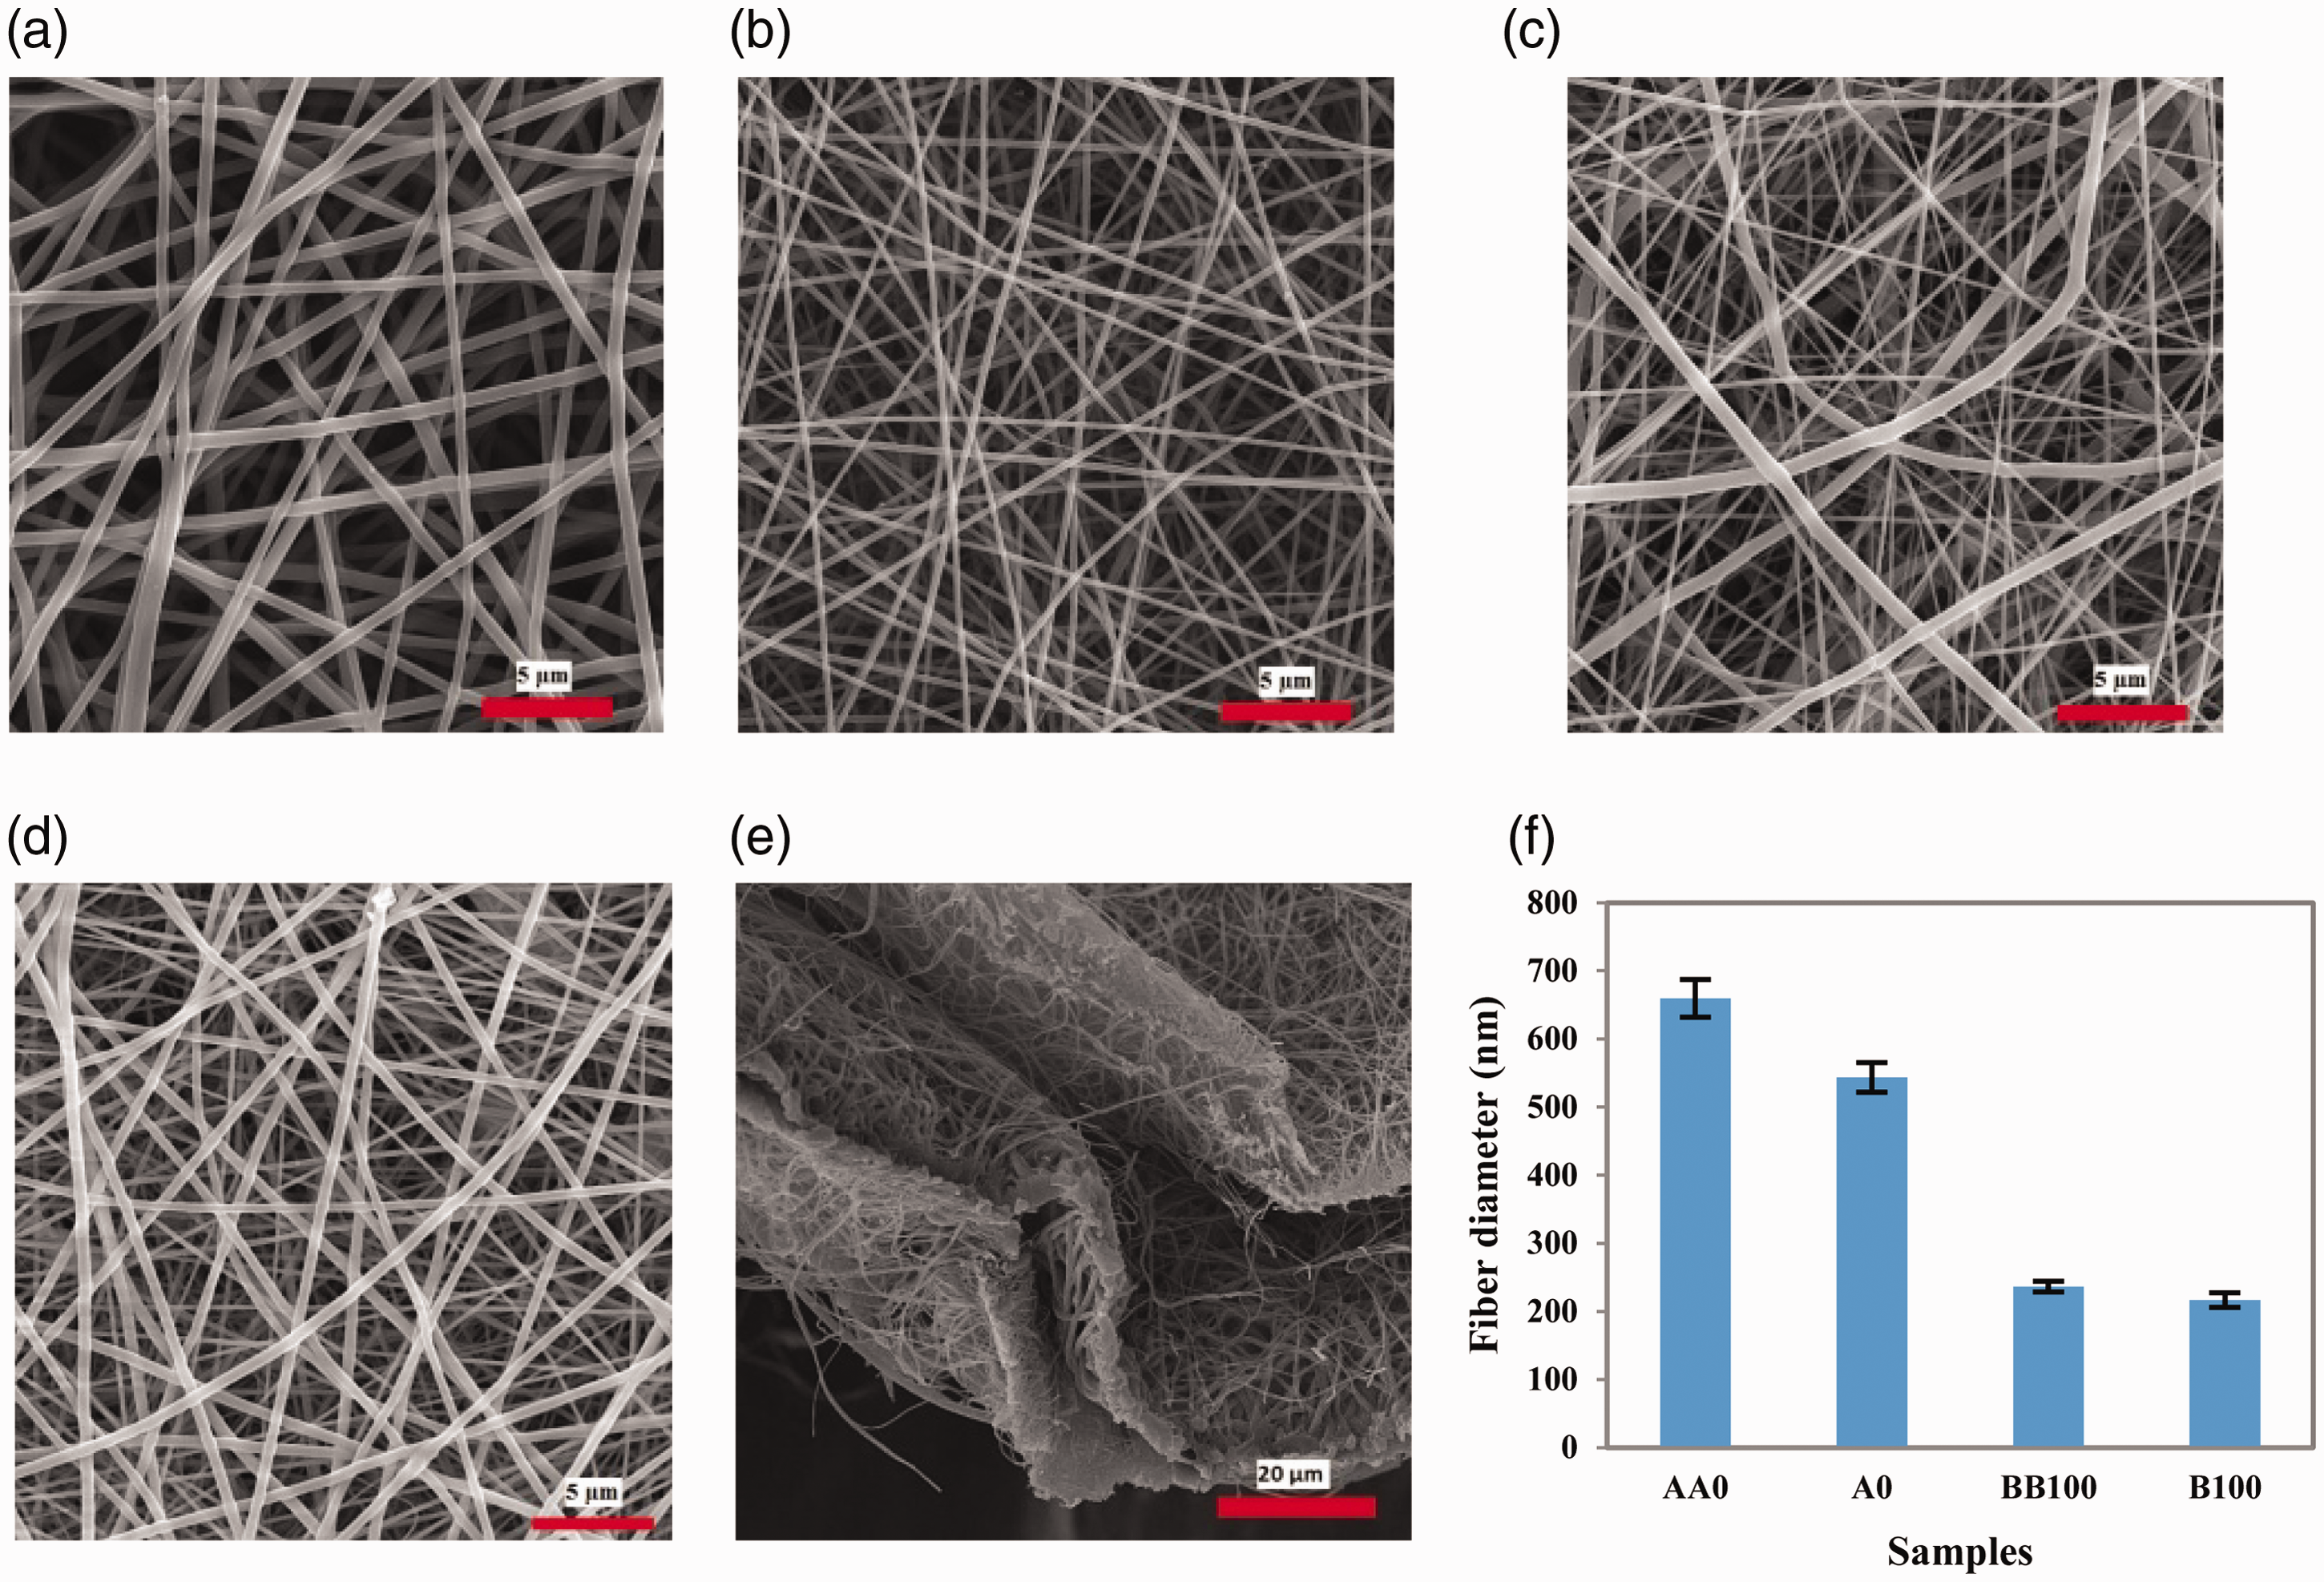
SEM images of different ENMs: (a) A0, (b) B100, (c) AB50, (d) B/A50, and (e) side view of B/A/B66 layer. (f) Average nanofiber diameter.
Geometrical properties
Weight per unit area, thickness, and SVF for different samples are presented in Table 5. The same CV% (Error) value range for the geometrical properties has been reported in a different study done by Gorji et al. [16] and Amini et al. [39]. ANOVA at 95% confidence level showed that there was no significant difference between the mean value of thickness and the SVF of the samples (Table 6). As also shown in our previous study [7], either in one-nozzle electrospinning or in two-nozzle electrospinning with half the electrospinning time duration for a single nozzle, a layer with a specific thickness is obtained.
Weight per unit area, thickness, and SVF of the samples.
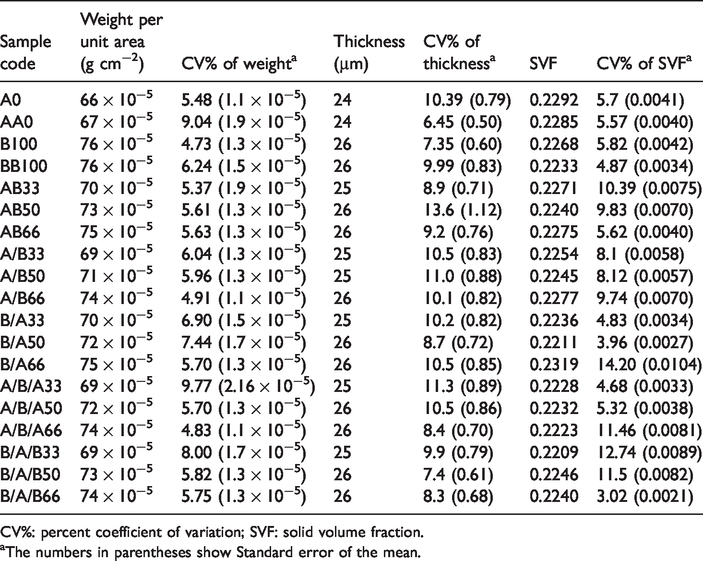
CV%: percent coefficient of variation; SVF: solid volume fraction. aThe numbers in parentheses show Standard error of the mean.
The results of the Duncan test for the thickness and SVF of the samples.
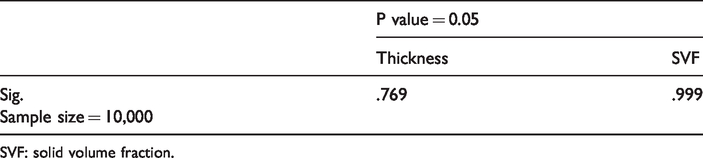
SVF: solid volume fraction.
Pore characterization
The pore diameter and its distribution have a great impact on membrane performance, for example in terms of its waterproof and windproof performance [36,38,70]. In this study, the image processing method was used to measure the pore diameter. As the image processing method is only capable of evaluating the initial layers of the surface, evaluating the pore specifications of sequential samples is plagued with some limitations. Therefore, in this study, only the pore specification of simultaneous and pure samples (AA0, A0, AB50, B100, and BB100) was considered. Figure 4 shows the result of the pore diameter and the number of pores in different samples. The results show that the AA0 and BB100 samples have higher pore diameters and a lower number of pores than the A0 and B100 samples, which can be attributed to the larger diameter of nanofibers in these samples. Adding PAMPS nanofibers to the PU did not change the porosities of the samples, while it increased the number of pores and decreased the pore diameter. Pore diameter reduction in hybrid-simultaneous membranes has far-reaching implications in terms of developing windproof clothing.
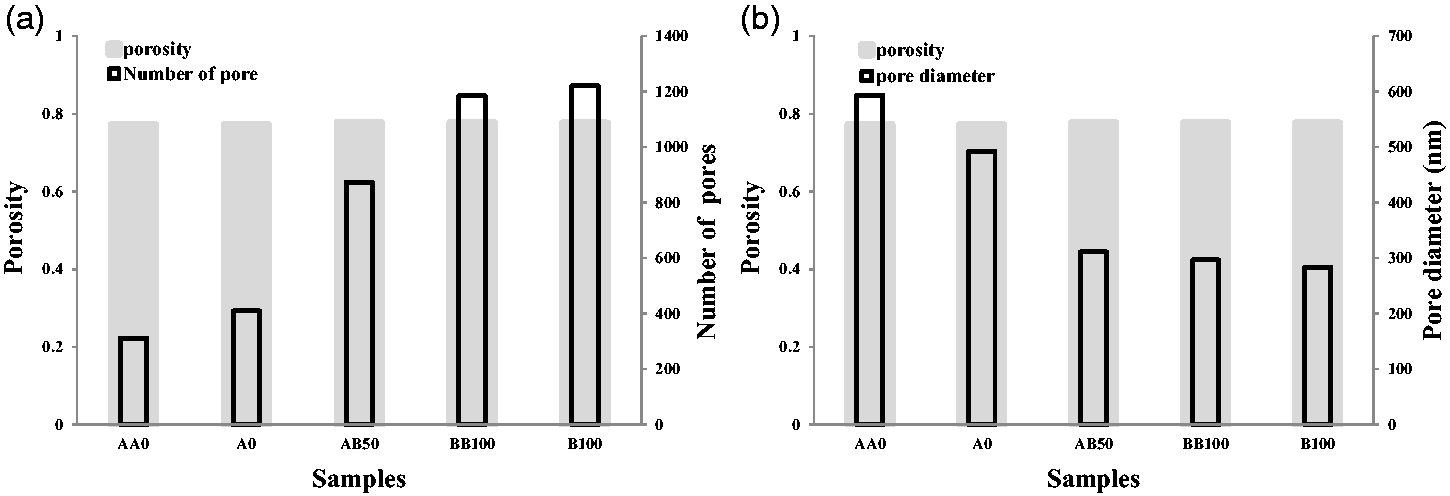
Pore diameter, number of pores, and porosity of the AA0, A0, AB50, B100, and BB100 samples.
Mechanical performance of ENMs
Tensile testing was used to evaluate the mechanical performance of the ENMs. Tensile strength is an important characteristic of the ENMs, with practical applications, for example, in protective clothing and tissue engineering [71]. Figure 5(a) and (b) shows a typical stress–strain curve of PU, PAMPS, and hybrid layers produced by sequential and simultaneous electrospinning modes, respectively. As can be seen, the PU ENMs show a ductile behavior during tensile loading, while the PAMPS ENMs show a brittle behavior during tensile testing. The mechanical behavior of the hybrid layers produced by the simultaneous electrospinning mode is close to the PAMPS layer, while the mechanical behavior of the samples produced by the sequential electrospinning mode is close to the PU specimen. As seen in Figure 5(a), delamination takes place in the hybrid layers produced by the sequential electrospinning mode. This can be attributed to the ductile behavior of the PU ENM with a high tensile strain and to the brittle behavior of the PAMPS ENM with a low tensile strain. The A/B/A sample shows a staircase form in the stress–strain curve. Staircase-shaped stress–strain curves occur when in a layer structure all layers do not fail at the same time. This behavior is triggered by the failure of the weak PU ENM as well as by delamination between the layers. The hybrid layers produced by the sequential electrospinning mode show a wavy curve section. During the tensile test, the load increases steadily until the PAMPS ENM fails. Furthermore, the transition of load from the PAMPS ENM to the PU ENM produces a flow region which lies between the upper and lower yield points. The load at which the PAMPS ENM fails is called the upper yield point and the constant load is called the lower yield point. Figure 5(c) presents the tensile stress and tensile strain of the electrospun membranes with different layer arrangements and volume fraction of the PAMPS.

Typical stress–strain curve of ENMs produced by (a) one-nozzle sequential electrospinning mode and (b) two-nozzle simultaneous electrospinning mode. (c) Tensile stress and tensile strain, (d) Young’s modulus and energy to break results of the ENMs (error bars are confidence interval at the level of 95%).
The PU ENMs showed higher tensile strength compared to the PAMPS ENMs and hybrid layers; consequently, in hybrid layers, as the volume fraction of the PAMPS increases, tensile strength decreases. This is attributed to the formation of bonding between PU nanofibers during the collection of PU electrospun nanofibers. During the electrospinning process, the solvent did not completely evaporate from nanofibers and the residual solvent led to the formation of bonding between PU fibers deposited on the collector [16,39].
The results from Figure 5(c) showed that the layers produced by the sequential electrospinning mode have a higher tensile strength than the samples produced by the simultaneous electrospinning mode. As shown in Figure 6(a), as the thickness of the PU layer increases, the tensile stress increases linearly, too. Increasing the thickness of the PU layer and, subsequently, increasing the number of fibers leads to more bonding between fibers, ultimately increasing the tensile strength. The layers produced by the sequential electrospinning mode show the highest tensile strain. As shown in Figure 6(b), the tensile strain of the hybrid-sequential layers is inversely correlated with the thickness of PU ENM, as the volume fraction of the PAMPS increases, so does tensile strain. In these layers, as the volume fraction of PAMPS decreases, the thickness of PU ENM increases and, consequently, the number of bonding points between the nanofibers increases and less slippage occurs during the tensile test, ultimately reducing the breaking elongation. The same results have also been reported in previous similar studies [39]. In the simultaneous electrospinning mode, the existence of PAMPS nanofibers among PU nanofibers reduced the chance of bonding formation between PU nanofibers, causing a decrease in tensile strength. As shown in Figure 6(c), in the hybrid-simultaneous samples, the tensile strength is directly correlated with the thickness of the PAMPS layer, while according to Figure 6(d), the tensile strain of the sample is inversely correlated with the thickness of the PAMPS layer such that as the volume fraction of PAMPS increases from 33 to 50% and 66%, the hybrid layer behavior changes from ductile behavior to brittle behavior, ultimately decreasing the tensile strain. The toughness of the electrospun membranes was evaluated by measuring the energy to break. Figure 5(d) presents the modulus and energy to break of the electrospun membranes. Figure 5(d) indicates that the PU ENM shows the highest energy to break. This can be attributed to the highest tensile stress with relatively high tensile strain compared to other specimens. The incorporation of PAMPS nanofibers into the PU nanofiber enhanced the modulus of the hybrid nanofibrous layers. As 2.51, 3.8, and 5.02 g m−2 of the PAMPS nanofibers are added to the PU ENM, the modulus of hybrid-simultaneous layers increases by 834, 1361, and 2026%, respectively. The statistical (ANOVA at 95% confidence level) results showed that there was no significant difference between mechanical performances such as tensile strength, tensile strain, modulus, and toughness of the hybrid-sequential layers (Table 7). As a result, layer arrangement has no effect on the mechanical properties of the specimens. As in the A/B and B/A samples, the mechanical properties of the layers are identical (in this study, the average results of these two samples are presented), while changing the electrospinning mode has a great effect on mechanical properties. For predicting the tensile performance of hybrid ENMs, some prediction formulae have been proposed (Table 8). As shown in Figure 7, the predicted results are close to experimental results. In order to quantitatively compare experimental data and the predicted results, we calculated the percentage of average value of relative error (AVRE) using the following equation [63,72]

Effect of the thickness of PU on (a) tensile stress and (b) tensile strain of electrospun membranes produced by the sequential electrospinning mode. Effect of the thickness of PAMPS on (c) tensile stress and (d) tensile strain of electrospun membranes produced by the simultaneous electrospinning mode. PAMPS: poly(2-acrylamido-2-methylpropane sulfonic acid); PU: polyurethane.
Significant difference among the mean tensile stress, tensile strain, energy to break, and modulus of sequential hybrid layers (A/B, B/A, A/B/A, and B/A/B).

PAMPS: poly(2-acrylamido-2-methylpropanesulfonic acid).
Predicting the mechanical performance of hybrid ENMs.
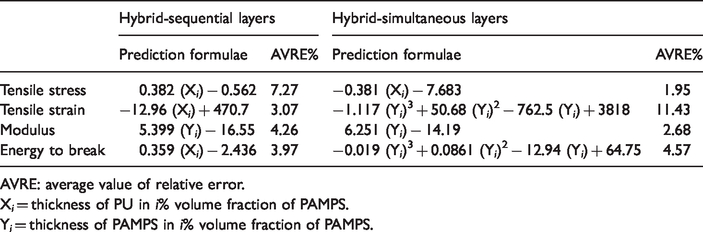
AVRE: average value of relative error.
X i = thickness of PU in i% volume fraction of PAMPS.
Y i = thickness of PAMPS in i% volume fraction of PAMPS.

Experimental results versus predicted results: (a) tensile stress, (b) tensile strain, (c) modulus, and (d) toughness.
Waterproof performance
The results of the hydrostatic pressure test are presented in Figure 8. PAMPS layers have the lowest hydrostatic pressure of nearly 0 cm, which is due to its super hydrophilic properties. The PU sample shows the highest water resistance, and waterproof properties of hybrid layers decrease as the volume fraction of PAMPS increases. The A0 specimen shows higher waterproof properties than the AA0 sample. This can be attributed to the increase in the pore size of the AA0 sample due to the higher nanofiber diameter of this sample compared to that of the A0 sample (see “Pore characterization” section). The waterproof behavior of the fibrous membrane can be explained by the Young–Laplace equation (equation (22)) [36,38]

Hydrostatic pressure results of different samples (error bars are confidence interval at the level of 95%): (a) one-nozzle sequential electrospinning mode and (b) two-nozzle simultaneous electrospinning mode.
Air permeability
Air permeability is an important factor in evaluating the windproof performance of fibrous membranes. Air permeability results of the electrospun membranes with a different layer arrangement and volume fraction of PAMPS are shown in Figure 9. The results show that the PU ENM exhibits a low windproof performance (16.4 mm s−1), while the PAMPS ENM shows a good windproof performance (6.4 mm s−1). As shown in Figure 9, the air permeability of the hybrid layers drops from 11.56 to 8.024 mm s−1 as the volume fraction of the PAMPS increases from 33 to 66%. According to equation (8), permeability of a fibrous material is affected by the SVF and fiber diameter [50,52]. Due to the uniformity of the SVF (porosity) of the samples, the air permeability of the hybrid layers is only affected by changes in the diameter of the nanofibers. Therefore, the low air permeability of the PAMPS and hybrid layers compared to that of the PU sample could be a result of the low PAMPS nanofiber diameter compared to that of the PU nanofiber, which shows a higher specific surface area, higher resistance to the passage of airflow, and lower air permeability.
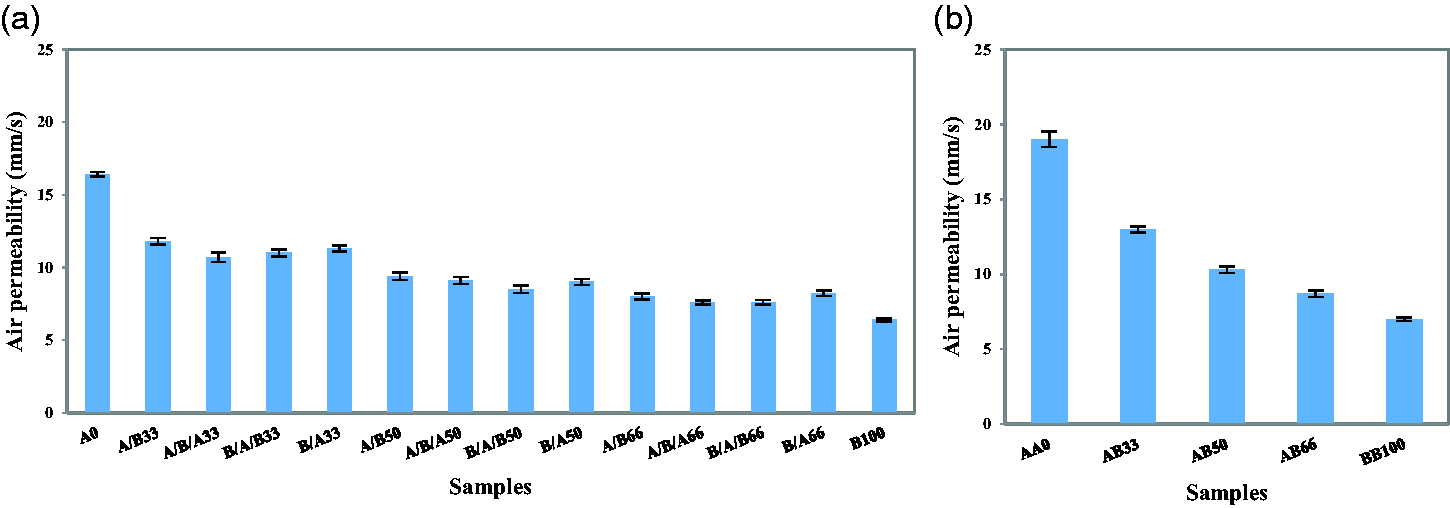
Air permeability results of different samples (error bars are confidence interval at the level of 95%): (a) one-nozzle sequential electrospinning mode and (b) two-nozzle simultaneous electrospinning mode.
The results of this test showed that the layers produced using the simultaneous electrospinning mode feature a lower windproof performance compared to the samples produced using the sequential electrospinning mode, which could be attributed to an increase in the diameter of the nanofibers, which is itself a result of electrical repulsion during the electrospinning process. Results showed (Figure 9) that while layer arrangement has no effect on the windproof performance of the specimens, changing the electrospinning mode can greatly affect the windproof performance of the layers.
Prediction of permeability results
Various well-known models, presented in Table 3, predict the pressure drop in unimodal media, so the appropriate model (among the models presented in Table 4) for calculating the equivalent fiber diameter (req) was determined.
Determination of the proper equivalent fiber diameter model
In this study, in order to determine a proper model for calculating the equivalent fiber diameter, the permeability of the hybrid ENMs has been calculated based on Jackson and James [43] model with different equivalent fiber diameter models (presented in Table 4), then, permeability results have been compared with experimental data. Figure 10(a) and (b) shows comparison of different equivalent diameters.

Comparison between five different equivalent fiber diameter models: (a) one-nozzle sequential electrospinning mode and (b) two-nozzle simultaneous electrospinning mode. Experimental permeability versus predicted permeability with different equivalent fiber diameter models (c and d), one-nozzle sequential electrospinning mode, and (e and f) two-nozzle simultaneous electrospinning mode. PAMPS: poly(2-acrylamido-2-methylpropane sulfonic acid; SVF: solid volume fraction.
As Figure 10(a) and (b) demonstrates, permeability obtained using volume-weighted resistivity, area-weighted average, and cube root relation is close to each other and almost independent of SVF. The same result had also been reported in another research done by Tafreshi et al. [52]. Figure 10(c) to (f) presents the comparison between experimental results and predicted permeability calculated by different equivalent fiber diameter models. The results show that the predicted permeability calculated by the cube root relation is close to the experimental data. Therefore, in this research, the cube root model was used to calculate the equivalent fiber diameter. In addition, Figure 10(c) to (f) shows that predicted permeability with the Jackson and James [43] model is not close to experimental measurements.
Determination of the best dimensionless permeability model
As shown in the previous section, the permeability results predicted by the Jackson and James [43] model are not close to the experimental results. Therefore, it should be determined which models are closer to the experimental results from among all models presented to predict the permeability.
Figure 11 compares experimental permeability and predicted permeability. As can be seen, the permeability results predicted by the expression of Drummond and Tahir [68] show the highest difference compared to experimental results. Therefore, this model clearly under-predicts the permeability of a real fibrous structure. The Drummond and Tahir [68] model is derived for ordered 2-D fibrous media. In a research reported by Tahir and Vahedi Tafreshi [64], it was concluded that ordered 2-D geometries tend to over-predict the pressure drop of a real medium. The performance of the empirical correlation of Davies [65], the analytical expression of Jackson and James [43], and the expression of Brown [69] are almost the same. The Davies [65] model is more accurate for fiber diameters close to or greater than 1000 nm. That is why the accuracy of this model is less than that of the other two models. The Jackson and James [43] model gives a higher value of dimensionless permeability than Davies [65] model, which can be attributed to its 3-D isotropic structure.

Experimental permeability versus predicted permeability: (a, b) one-nozzle sequential electrospinning mode and (c, d) two-nozzle simultaneous electrospinning mode. PAMPS: poly(2-acrylamido-2-methylpropane sulfonic acid.
As can be seen in Figure 11, among these three models, at higher fiber diameters (low volume fraction of PAMPS), the Jackson and James [43] model is closer to the empirical results, but in lower fiber diameters (high volume fraction of PAMPS), the Brown [69] model is closer to experimental results. Unlike the two previous models, in the Brown [69] model, as the fiber radius decreases, the accuracy of this model increases slightly. For small fiber diameters (smaller than 10 µm), slip flow occurs on the fibers’ surface [62,73]. In the Brown [69] model, the effect of the aerodynamic slip on pressure drop has been considered. That is why at a lower fiber diameter, the accuracy of this model increases. However, as this model was developed based on an ordered 2-D fibrous medium, despite taking into account the slip flow effect, the performance of this model is low. Real nanofiber membranes have a 3-D layered fibrous structure. Hosseini and Tafreshi’s [50] model developed in 2010 for 3-D layered fibrous structures, which takes into account the slip flow effect and is close to real media, provides a more accurate prediction. As can be seen, models taking into account the slip flow effect provide a more accurate prediction of permeability, which testifies to the great effect of the slip flow effect on the air flow in ENMs with a fine nanofiber diameter.
Simulation results
Figure 12 shows simulated pressure drop in different samples with different layer arrangements and composition ratios, which are obtained using the COMSOL Multiphysics software. The simulation results show that in a specific volume fraction of the PAMPS, the pressure drop in A/B, B/A, A/B/A, and B/A/B layers is identical, indicating that in the samples produced using the one-nozzle sequential electrospinning mode, the layer arrangement does not affect the pressure drop. As can be seen, they are in good agreement with experimental results.

Simulated pressure drop in the simulation domain: (a) A0, (b) B100, (c) AB33, (d) AB66, (e) A/B50, (f) B/A50, (g) A/B/A50, and (h) B/A/B50 samples.
Comparison of experimental results with simulation and predicted results
In Figure 13, experimental permeability values have been compared with predicted and simulated results. The results show that the pressure drop in all three experimental, predicted, and simulated results is independent of the structure geometry, while permeability dramatically drops as the volume fraction of PAMPS increases. Figure 13 shows that the experimentally obtained permeability in real media is higher than simulation and predicted values. Such a difference between predicted and experimental permeability has also been reported in other studies. Furthermore, similar results have been reported in a different study by Patel et al. [53]. Their results show that predicted permeability per thickness calculated by the Kuwabara [54] model is significantly smaller than that of the experimental values.

Comparison between experimental, predicted, and simulated permeability: (a) one-nozzle sequential electrospinning mode and (b) two-nozzle simultaneous electrospinning mode. PAMPS: poly(2-acrylamido-2-methylpropane sulfonic acid.
Similar to this study, the papers presented by Amini et al. [39], Yang et al. [21], and Patel et al. [53] show that the experimental permeability is higher than the predicted value. There are several different nonuniformities in real media that affect permeability. In real membranes, there are some beads and nanofibers with different diameters and shapes, while in theoretical and simulation models, it is assumed that the fibers are all cylindrically shaped with one diameter and factors such as distribution of porosities (packing densities), the variable aspect ratio of interfiber distances, and the polydisperse fiber diameter distribution cause a significant difference between experimental and predicted permeability [45,53]. Furthermore, in the theoretical models, it is also assumed that the flows through the pores are due to the pressure-driven flow, whereas the flows through very small pores may be driven by diffusion mechanisms [53].
Conclusion
This study aimed to fabricate and characterize different PU/PAMPS hybrid ENMs with a hydrophilic–hydrophobic behavior to investigate the feasibility of using these layers in breathable water/windproof protective clothing systems. The mechanical behavior of the hybrid layers produced using the simultaneous electrospinning mode is close to the PAMPS layer, while the mechanical behavior of the samples produced using the sequential electrospinning mode is close to the PU specimen. The results revealed that the layers produced using the sequential electrospinning mode have higher mechanical properties than the samples produced using the simultaneous electrospinning mode. The presence of PAMPS nanofibers in the hybrid layers resulted in a significant decrease in tensile stress, tensile strain, and energy to break of the hybrid layer, while Young’s modulus increases by at least 662%. The Young’s modulus of hybrid nanofibrous membranes rises from 35.85 to 80.43 MPa as the volume fraction of the PAMPS increases from 33 to 66%. Compared with PU membranes, the hybrid ENMs featured a good windproof (9.6 mm s−1) performance. In the one-nozzle sequential electrospinning mode, structural geometry has no effect on the windproof performance of hybrid samples. The results of the present study revealed that the layers produced using the sequential electrospinning mode have a higher windproof performance than the samples produced using the simultaneous electrospinning mode. Due to the super hydrophilic properties of the PAMPS nanofibers, hybrid layers exhibit a weak waterproof performance. The waterproof properties of the hybrid layers produced using the sequential electrospinning mode are higher than those of other layers. Comparison of the predicted permeability and simulated permeability to the experimental permeability results showed that the simulated and predicted results underestimate permeability. Our results indicated that among the different models examined for predicting air permeability of ENMs, Hosseini and Tafreshi’s [50] 2010 model provides a more accurate and reliable prediction.
Footnotes
Declaration of conflicting interests
The author(s) declared no potential conflicts of interest with respect to the research, authorship, and/or publication of this article.
Funding
The author(s) received no financial support for the research, authorship, and/or publication of this article.