
Abstract
In this study, cotton fabric was employed to achieve electronic textile by incorporating nano MnO2 and polyaniline as conductive materials. The treatment was accomplished via two consecutive steps, where different concentrations of MnO2 were initially applied by the ultrasound-assisted template method onto the cotton samples to synthesize nanoMnO2. The nano form of the metal oxides and polyaniline inclusion were demonstrated through a transmittance electron microscope. Thereafter, chemical oxidative polymerization of aniline over the nano metal oxide–loaded fabrics was performed. Structure, phase, and purity of as-treated fabrics were determined using X-ray diffraction and Fourier transform infrared spectroscopy. The thermal properties of the fabricated conductive samples were also tested. The electrical conductivity of the obtained (nano MnO2/polyaniline) modified cotton fabrics showed great enhancement by exposing the modified samples to gamma irradiation, as a posttreatment, to reach an optimum condition at 40 kGy, using 0.2 M MnO2. The recorded increment for electric conductivity was from 5.4 × 10⁻³ to 1.43 × 10⁻¹ Ω−1. m−1 for both unirradiated and 40 kGy irradiated samples, respectively. Pseudo-capacitance of cotton/MnO2/polyaniline fabric electrode was tested using a three-electrode system. The assumption of (nano MnO2/polyaniline) cotton fabric conductivity was verified through a designed pseudo-capacitor as an important yet simple form of an energy storage device.
Introduction
Textile-based electronic components have noticeable importance in the technology fields. Actually, increasing competition in the textile industry has been investigated after the introduction of the concepts “smart textiles.” Various materials were used to obtain conductive textiles, in which the incorporation of electronic components into these textiles shows a great promise for common everyday applications. The harvest and storage of energy in textile electronics are a challenge that needs further attention in order to enable complete approval of this technology in practical applications [1].
The market has recently focused on the use of the small electronic components for smart wearable device applications [2]. The integration of the electronic components into textile substrates provided a new electronic technology, which can be used in a variety of applications, including sensors [3], medical devices [4], and safety instruments [5]. Hence, the ideal wearable power device would incorporate a textile as a component [6]. From the different textile substrates, cotton fabrics can be preferred, due to its cheap, natural, highly hydrophilic [7], In addition, it is a light and biodegradable polymer [8].
The development of highly conductive textiles for interconnection is essential to minimize energy loss. Three types of materials have been explored for the fabrication of high-conductivity textiles: polymer-based, carbon-based, and metallic materials [1]. The electronic textiles can be achieved through the introducing of conductive polymers such as polyaniline (PANI) [9,10], polypyrrole (PPy) [11], polythiophene (PT) [12]; also, via electrochemical, or chemical polymerization processes [13,14]. PANI has been defined to be the first dispersible essentially conductive polymer readily accessible and stable in ambient conditions [15]. It has the skill to switch very quickly between insulating and conductive forms when exposed to an acidic or alkaline environment. It also has low cost and rather a simple chemical and electrochemical polymerization technique [16]. Also, transition–metal oxides such as RuO2, NiO [16,17], and MnO2 [9] are the most widely used electrode materials recognitions to their large capacitance, high surface area, and relatively good electrical conductivity. Matched to other transition metal oxides, MnO2 is the greatest promising one for the next generation of capacitors because of its ideal capacitor performance, good cycle stability, low cost, and environmental friendliness. Nevertheless, the poor electrical conductivity and densely packed structure limit its application in the development of high-performance capacitors [18].
Manganese oxide is a favorable material for pseudo-capacitor applications due to its high specific capacity and low cost, MnO2 electrodes suffer from their low electrical and ionic conductivities [19]. Pseudo-capacitors are based on the redox reactions of electrodes such as conductive polymers or transition metal oxides [18].
This study deals with the enhancement of electrical conductivity of the cotton fabric after covering by conductive polymer/metal oxide nanoparticle with different concentrations of MnO2. The identifications of the samples with Thermogravimetric analyzer (TGA) and XRD and Fourier transform infrared spectroscopy (FTIR) are included. The electrical conductivity of different samples was investigated. The possibility of using MnO2/PANI in conducting cotton fabrics as a pseudo-capacitor has also been studied.
Materials
Cotton fabric used as a substrate in this work was supplied by El-Mahalla Textiles Company, Egypt. The fabric was scoured and not subjected to any further finishing processes. The scouring bath contained 0.2 g/L, Na2CO3, and 0.1 g/L nonionic detergent for 1 h at boiling temperature. Aniline, hydrochloric acid (HCl, 37%), ammonium peroxydisulfate (NH4)2S2O8, and manganese acetate Mn(CH3COO)2 were obtained from (LoBA-Chemie). All chemicals were of analytical reagent grade and were used without further purification.
Experimental
Synthesis of MnO2 nanostructures on cotton fabric
In a distinctive experiment, different concentrations (0.1, 0.2, and 0.3 M) from Mn (CH3COO)2 put into 50 mL distilled water under stirring to form a homogeneous solution. The cotton fabric sample was dipped in the above solutions and then the mixture was driven under ultrasonic treatment (40 kHz, 150 W at 100% efficiency, KQ3200DB model, Kunshan, China) for 20 min at room temperature to make cotton fibers infiltrate fully. Afterward, 12 mL of ammonia solution (25%) was supplementary into the above solution drop by drop (pH = 8) and keep under ultrasonic treatment for 30 min. Then, 50 mL of NaOH solution (1 M) was dropped slowly into the mixed solution (pH = 12), then ultrasonic treatment was used for 1 h at 40°C. A heavy-duty brown color was regularly formed. After implementation, the reaction at the desired time, the achieved small pieces of treated cotton fabric were collected and washed with distilled water and ethanol several times to get rid of excesses of sodium hydroxide, and then they thermally cured in an oven at 130°C for 3 min.
Chemical oxidation polymerization of aniline on MnO2 nanostructures cotton fabrics
MnO2 nanostructures cotton samples were soaked in aniline solution (0.1 M) for 15 min, after that an aqueous solution of ammonium peroxydisulfate (0.1 M) was added dropwise. The polymerization process was started at a temperature of 0–5°C and kept under stirring for 4 h. As the polymerization proceeds, the fabric samples turn green color which is the color of PANI. After the achievement of the period of polymerization, the in situ polymerized PANI cotton fabric was washed in dilute HCl to remove unreacted chemicals and oligomers and then dried and weighed.
Characterization
X-ray diffraction (XRD) patterns were obtained by using XRD-6000 Shimadzu. X-ray diffractometer using CuKα radiation (λ = 1.54059 Å) in the range 2θ between (4° and 90°). The TGA was carried out by using a Shimadzu analyzer model TGA-50 in N2 atmosphere at a heating rate of 10°C/min up to a temperature of 600°C. The morphological structure of the Cotton/PANI and Cotton/PANI/MnO2 nanocomposite was examined by using scanning electron microscopy (SEM) model JEOL-JSM5400, JEOL, Japan with acceleration voltage of 30 kV. The DC conductivity was measured by the 2 point-probe method using a Keithley model 6517 A. The frequency dependence of the dielectric characterization was carried out using an LCR meter (model 3532, HIOKI, Ueda, Nagano, Japan), with a capacitance measurement ∼0.0001 pF and in a wide range of frequencies between (50 Hz and 5 MHz).
The samples were irradiated with 20 and 40 kGy using gamma radiations from 60Co source (Gamma cell model Excel 220 S. N. 117 R) at a dose rate during the work of 1.33 KGy/h.
The electrochemical performance of the cotton/MnO2/PANI textile was carried out with a Cyclic Voltammetry (CV) scan in the voltage range of (−0.2 to 0.2 V) with respect to Ag/AgCl to proof sample uses as a pseudo-capacitor device. Cyclic voltammetry and galvanostatic charge/discharge measurements were undertaken with Biologic SP300 by using three electrodes system. The as-synthesized textiles served as a working electrode against carbon rod and silver/silver chloride (Ag/AgCl) in KCl (3 M) as counter and reference electrodes, respectively. The electrochemical properties were evaluated in 0.5 M aqueous Na2SO4 solution was used as the electrolyte at room temperature and the electrochemical impedance spectroscopy (EIS) was measured over the frequency range from 0.1 to 103 Hz at open-circuit potential with an amplitude of 10 mV.
Results and discussion
XRD results
The XRD patterns of the pure cotton, cotton/MnO2 nanocomposites, and cotton/0.2 M MnO2/PANI fabrics are illustrated in Figure 1. Two peaks can be observed at about 15 and 23 corresponding to the cellulosic composition of cotton fabric. In addition to the possibility of observing small peaks at 25°, 28°, 36°, 39°, 42°, 50° characterizing of MnO2 nanoparticles, another peak at (220), (310), (400), (330), (301), and (411) have corresponded to the tetragonal structure of MnO2 nanoparticles and it is identified using standard data JCPDS no. 44-0141. While peaks are observed at 11°, 22°, 28°, 33° which characteristics peak of PANI. It is hard to judge the phase of the samples. The achieved values are in good agreement with the reported values [20]. The unit cell parameters of the MnO2 sample were observed values by a = 9.7847 Å, b = 9.7847 Å, and c = 2.863 Å and a = b = c = 900 [21].

XRD pattern of pure cotton, cotton/MnO2, and cotton/0.2 M MnO2/PANI nanocomposite.
Average crystallite size values of MnO2 nanoparticles and cotton/0.2 M MnO2/PANI nanocomposite were calculated according to the Scherrer equation, which they are 12.25 nm and 6 nm, respectively.
XRD studies was provided to study the structural effect of diffusion of PANI on the crystalline and amorphous regions of the fabric. The area under amorphous scattering is large, and the percent crystallinity is calculated by the method of area measurement by the formula [22].

When the fabrics are treated with PANI and MnO2 nanoparticle, there is a change in the diffraction pattern. The value of the percentage crystallinity is increased from 13% to 38% in the case of cotton/0.2 M MnO2/PANI. This indicates that diffusion of PANI and MnO2 nanoparticles in the fabric structure takes place and the crystalline region is affected slightly. It is predictable that most of the diffusion of PANI and MnO2 nanoparticles is in the amorphous region. The amorphous percentage is

FTIR analysis
The infrared spectra (FT-IR) of untreated cotton fabric, cotton/MnO2, and PANI/cotton/MnO2 fabrics are shown in Figure 2. All the characteristic peaks of pure Cotton fabrics are observed in the spectra. The absorption band at 3309 cm−1 is assigned to hydroxyl groups of cellulose and water. Absorption bands at 2901 and 1426 cm−1 are assigned to C–H stretching of CH2 and CH2 symmetric bending, respectively [23]. The peaks between (1600–1700) cm−1 in pure cotton spectra refer to the H2O absorbed from the environment. Absorption bands at 1246 and 1102 cm−1 are assigned to stretching and bending modes of hydrocarbons in cellulose backbone and to asymmetric bridge C–O stretching, respectively. Strong absorption bands from 990 to 1014 cm−1 with a maximum at 1029 cm−1 are a result of the overlaying bands attributed to functional groups of cellulose, namely the C–C, C–O, and C–O–C stretching vibrations [24]. After deposition of MnO2 nanoparticles on the surface of cotton fabrics the peaks appearing at 592 cm−1 belong to the Mn–O vibrations [25]. After polymerization reaction with PANI, the hydroxyl peak at 3309 cm−1 of cotton fabrics is disappeared and the characteristic peaks of PANI are instead observed in the spectra of the dark green color [26]. The absorption peak at 3270 cm−1 is assigned to N–H stretching. Absorption peaks at 1580 and 1499 cm−1 are assigned to stretching of 5-quinone ring and benzene rings in PANI, respectively [27]. The absorption band at 1306 cm−1 is assigned to the stretching of the C–N band of benzene ring [28]. The absorption band at 823 cm−1 is assigned to out-of-plane bending vibration of C–H band of para-substituted benzene ring. These observations indicate that after the reaction, PANI and MnO2 are successfully produced on cotton fabrics.
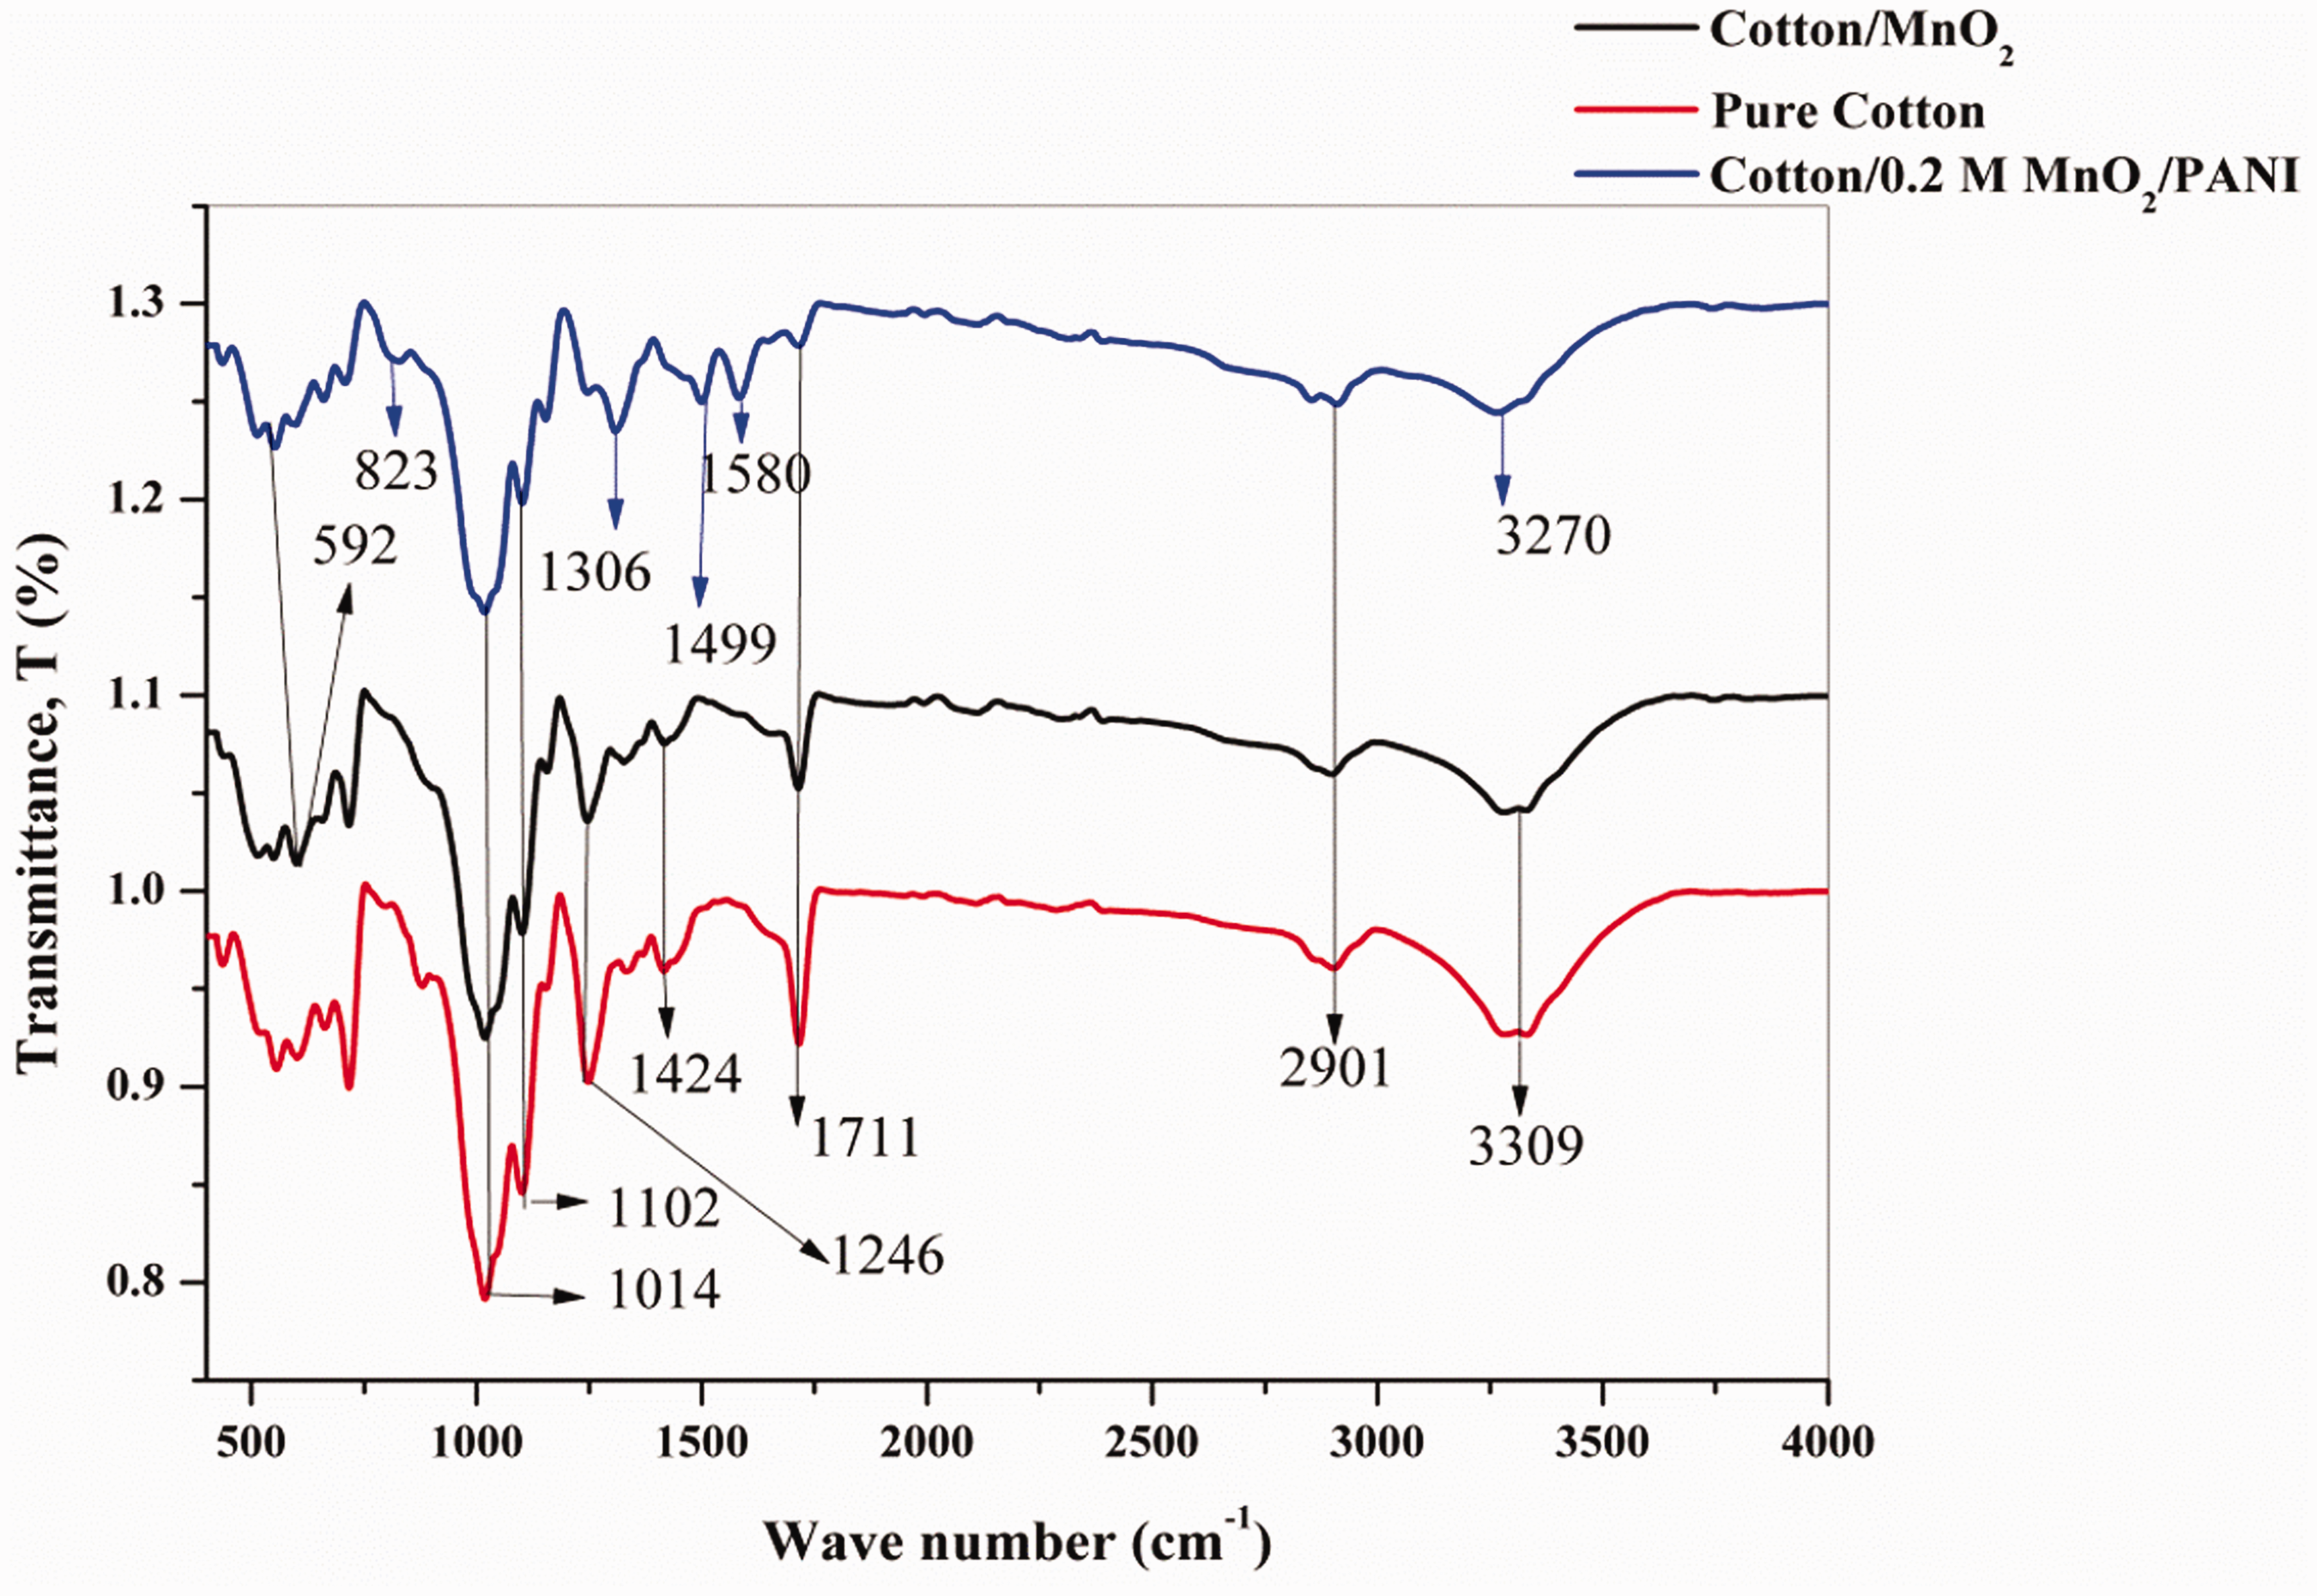
FTIR spectra of pure cotton, cotton/MnO2, and cotton/0.2 M MnO2/PANI.
Surface morphology studies
Figure 3(a) to (c) illustrates the surface morphology of pure cotton, cotton/MnO2, and cotton/0.2 M MnO2/PANI nanocomposite, respectively. The results of SEM show that the pure cotton is flat with a twisted ribbon-like structure is caused by spiraling of cellulose fibrils. The pure cotton fabric surface is described as a smooth fabric surface (Figure 3(a)). With the addition of 0.2 M MnO2, the SEM shows few deposits of metal oxide dispersing non-uniformly on the surface of cotton fabrics which not effects on weaving structure of fabrics (Figure 3(b)). After the polymerization of aniline, the cotton/MnO2 fabrics are covered and thicknesses with rough layers of copolymer deposits which dispersing nonuniform on the whole surface of the cotton fabric; the entire fabrics are also covered with polymer as a result of penetration and diffusion of monomer solution. Polymer fabric bridges are formed in some areas leading to bond individual fibers together (Figure 3(c)). This is indicating the successful polymerization reaction of aniline on the surface of cotton fabrics with an interconnected electrically conductive network.

SEM images of (a) pure cotton, (b) cotton/0.2 M MnO2, and (c) cotton/0.2 M MnO2/PANI nanocomposite.
The TEM study of MnO2 nanoparticle
The TEM image of the MnO2 nanoparticles is shown in Figure 4. The TEM image noticeably confirms the construction of nanoscale particles. The size distribution histogram reveals that such MnO2 particles range from 6 to 17 nm in size and mainly consist of nanoparticles with about 10 nm in diameter. Note that the formation of birnessite-type MnO2 polycrystalline nanoparticles [29].

TEM image of MnO2 nanoparticles.
Thermal properties
The thermogravimetric analysis technique provides a good acceptance of the thermal stability of materials. The TGA thermograms and the rate of thermal degradation (mg/s) of pure cotton, and cotton/0.2 M MnO2/PANI nanocomposite illustrated in Figure 5(a) and (b). The TGA thermogram indicates a three-stage weight loss profile [28]: The first stage of weight loss at approximately 300°C might be due to the combination of cotton fabric and the side chains or impurities of PANI. The weight loss is observed for the coated cotton fabric that might be related to the disruption of the intermolecular hydrogen bonds of fabric signifying the rearrangement of the macromolecular structure. The second stage of weight loss is occurred at approximately 420°C due to thermal-oxidative degradation of the main PANI chain. Since the thermal degradation is affected by structural parameters like molecular weight, crystallinity, and orientation, the obtained results are in accordance with these assumptions revealing a shift of temperature degradation for samples coated with PANI [29,30]. Thermal degradation and thermally stabilize demonstrate, that the PANI and MnO2 coatings act as protective barriers on the surface of cotton fabric.

(a) TGA thermogram of pure cotton, and cotton/0.2 M MnO2/PANI nanocomposites, and (b) the rate of weight losses (mg/s) for pure cotton, and cotton/0.2 M MnO2/PANI nanocomposites.
Electrical conductivity
DC electrical conductivity of the fabrics was dignified at room temperature using the two-point probe technique. The conductivity σdc of the fabric is given by [31].

The DC conductivity values of untreated and treated fabrics at different gamma radiation doses.
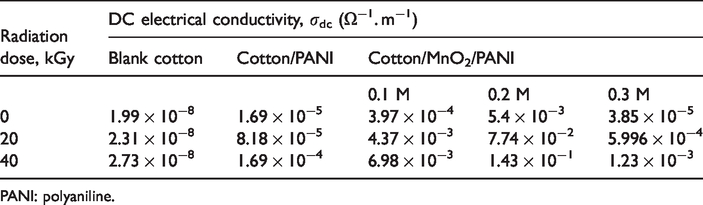
PANI: polyaniline.
There was a proportional relation between the molar volume of MnO2 and the conductivity. The height amorphous percentage is for the lower molarity of MnO2. This is confirming the conductivity results so that, the largest value of conductivity for MnO2’s molarity (0.2 M). The least of amorphous regions percentage of high molecular weight and highly crystalline cellulose prevent the forming of PANI and from penetrating into the fabric [32].
The responsible of conduction in AC conductivities are trapped polarons and ions such as H+, OH−, and so conductivity can be expressed according to [33]

AC conductivity depends on materials electron-transferring capacity. The conduction paths of conducting PANI will become more continuous, closer in the connection and shorter the distance between the interchains and hopping of charges [34,35].
Figure 6 illustrates that the conductivity increases with frequency was a polymeric semiconductor response, which due to the increase of the charge carrier mobility in PANI-treated cotton composites. The AC conductivities show independence of frequency up to 3 × 10⁶ Hz, which due to random diffusion of the charge of a carrier. The PANI- and MnO2-treated fabrics behave the same behavior, which due to charge motion enclosing isolated polarons in the amorphous region [32]. Additional doping agents use to developing the electrical performances of conductive polymer-coated fabrics. Increasing the conductivity confirms the semiconductor nature of the prepared material. Oxidization of polymer creates the radical cation and the delocalization of charge is not happens completely in the polymer, but it occurs only in the monomers. Radical cation with lattice distortion in the region of the charge was known as polaron, the polaron movement yields increase conductivity. Formation of bi-polarons happens due to the removal of a second unpaired electron from the chain which had a polaron. Due to an increase in conductivity observed in the high-frequency region. This confirms the charge transport nature of the prepared material.

AC electrical conductivity dependence of frequency for untreated and treated fabrics: (a) unirradiated and (b) irradiated by Gamma ray at 20 kGy.
When the material was exposed to an electromagnetic field, the electric field induced two types of electrical currents within the material, namely the conduction current and displacement current. The conduction current occurred due to the presence of free electrons, which provided the imaginary part of permittivity (ε1). The imaginary permittivity was called the “dielectric loss.” The displacement current ascended due to the bound charges and gives the real part of permittivity (ε2). The ratio of the imaginary to the real part (ε2/ε1) was the “dissipation factor,” which was represented by tan δ, where δ is called as the “loss angle,” indicating the angle between the voltage and the charging current. The dielectric constant depended powerfully on the frequency of the alternating electric field or the rate of change of the time-varying field. The real and imaginary components of permittivity corresponded to the storage and loss of energy in each cycle of the applied electric field [36–38].
It observes from Figure 7 that, the values of dielectric constant decreases with increasing frequency. The decreasing of dielectric constant with increasing frequency is predictable behavior in most dielectric materials, but the difference between the values at low and high frequencies is major in the case of conductive polymers [36]. The initial value of the dielectric constant of polar materials is high at lower frequencies. If the frequency began to increase, the dielectric constant started to drop and electric dipoles did not follow the field variations at higher frequencies. At higher frequencies, the polarization due to charge accumulation decreased, which led to a decrease in the value of the dielectric constant with increasing frequency [36–38]. A significant dielectric permittivity increases due to an increase in conductivity and dipole moment of coated fabrics. In addition, anion cotton fabrics with relatively high dielectric constants produce to increase the electric energy density for capacitor applications.

The relationship between frequency and dielectric constant for untreated and treated irradiated fabrics at 40 kGy.
Figure 7 observes that also the values of dielectric constant decrease with increasing frequency when untreated and treated fabrics are exposed to gamma radiation. Gamma irradiation of polymers caused structural and chemical variations, which led to variation in physical properties of the material so that, irradiation-induced modifications in molecular structure in polymers [39].
Characterization of conductive fabrics electrode for a pseudo-capacitor device
Figure 8 shows the CV curves of cotton/0.2 M MnO2/PANI measured various scan rates of 5, 10, 50, 100 and 200 mV/s. The rectangle shape appeared which indicates the stable and high chemical performance of the asymmetric pseudo-capacitors. The small redox peak was almost conspicuous. This gives an indication for promising pseudo-capacitance performance as the prepared textile electrode. Small anodic oxidation and cathodic reduction peaks are observed at 0.18 V and −0.17 V, respectively. The CV curve area is gradually enlarged with the increase of the voltage scan rate. This result indicates pseudo-capacitive behavior. The shapes of the CV curves are exhibited more or less pronounced redox waves. This behavior suggests that faradic phenomena occur during the charge-storage mechanism. This improvement method might be the most convenient and low cost for enhancing the capacitance of MnO2-based pseudo-capacitors. Figure 9 shows the relation between the time of charging and discharging and potential at applied current 1 mA.

The CV curve of cotton/0.2 M MnO2/PANI at varying scan rates of 5, 10, 50, 100, and 200 mV/s.

The relation between the time of charging and discharging and potential at applied current 1 mA.
Nyquist plot of the Cotton/0.2 M MnO2/PANI electrode is shown in Figure 10. The smaller diameter of the semicircle in the high-frequency region for the Cotton/0.2 M MnO2/PANI electrode specifies that the electrode owns smaller charge-transfer resistance, Rct [40–42]. Improved capacitive properties of the conductive textile electrode, i.e. large capacitance and rapid response, can be described by the reducing resistances and subsequently enhanced charge transfer as well as increased contact between the electrode and electrolyte. The phase angle of the cotton/0.2 M MnO2/PANI electrode is −77°, closer to the value of an ideal capacitor, −90°, compared to −62° for the cotton/MnO2 electrode.
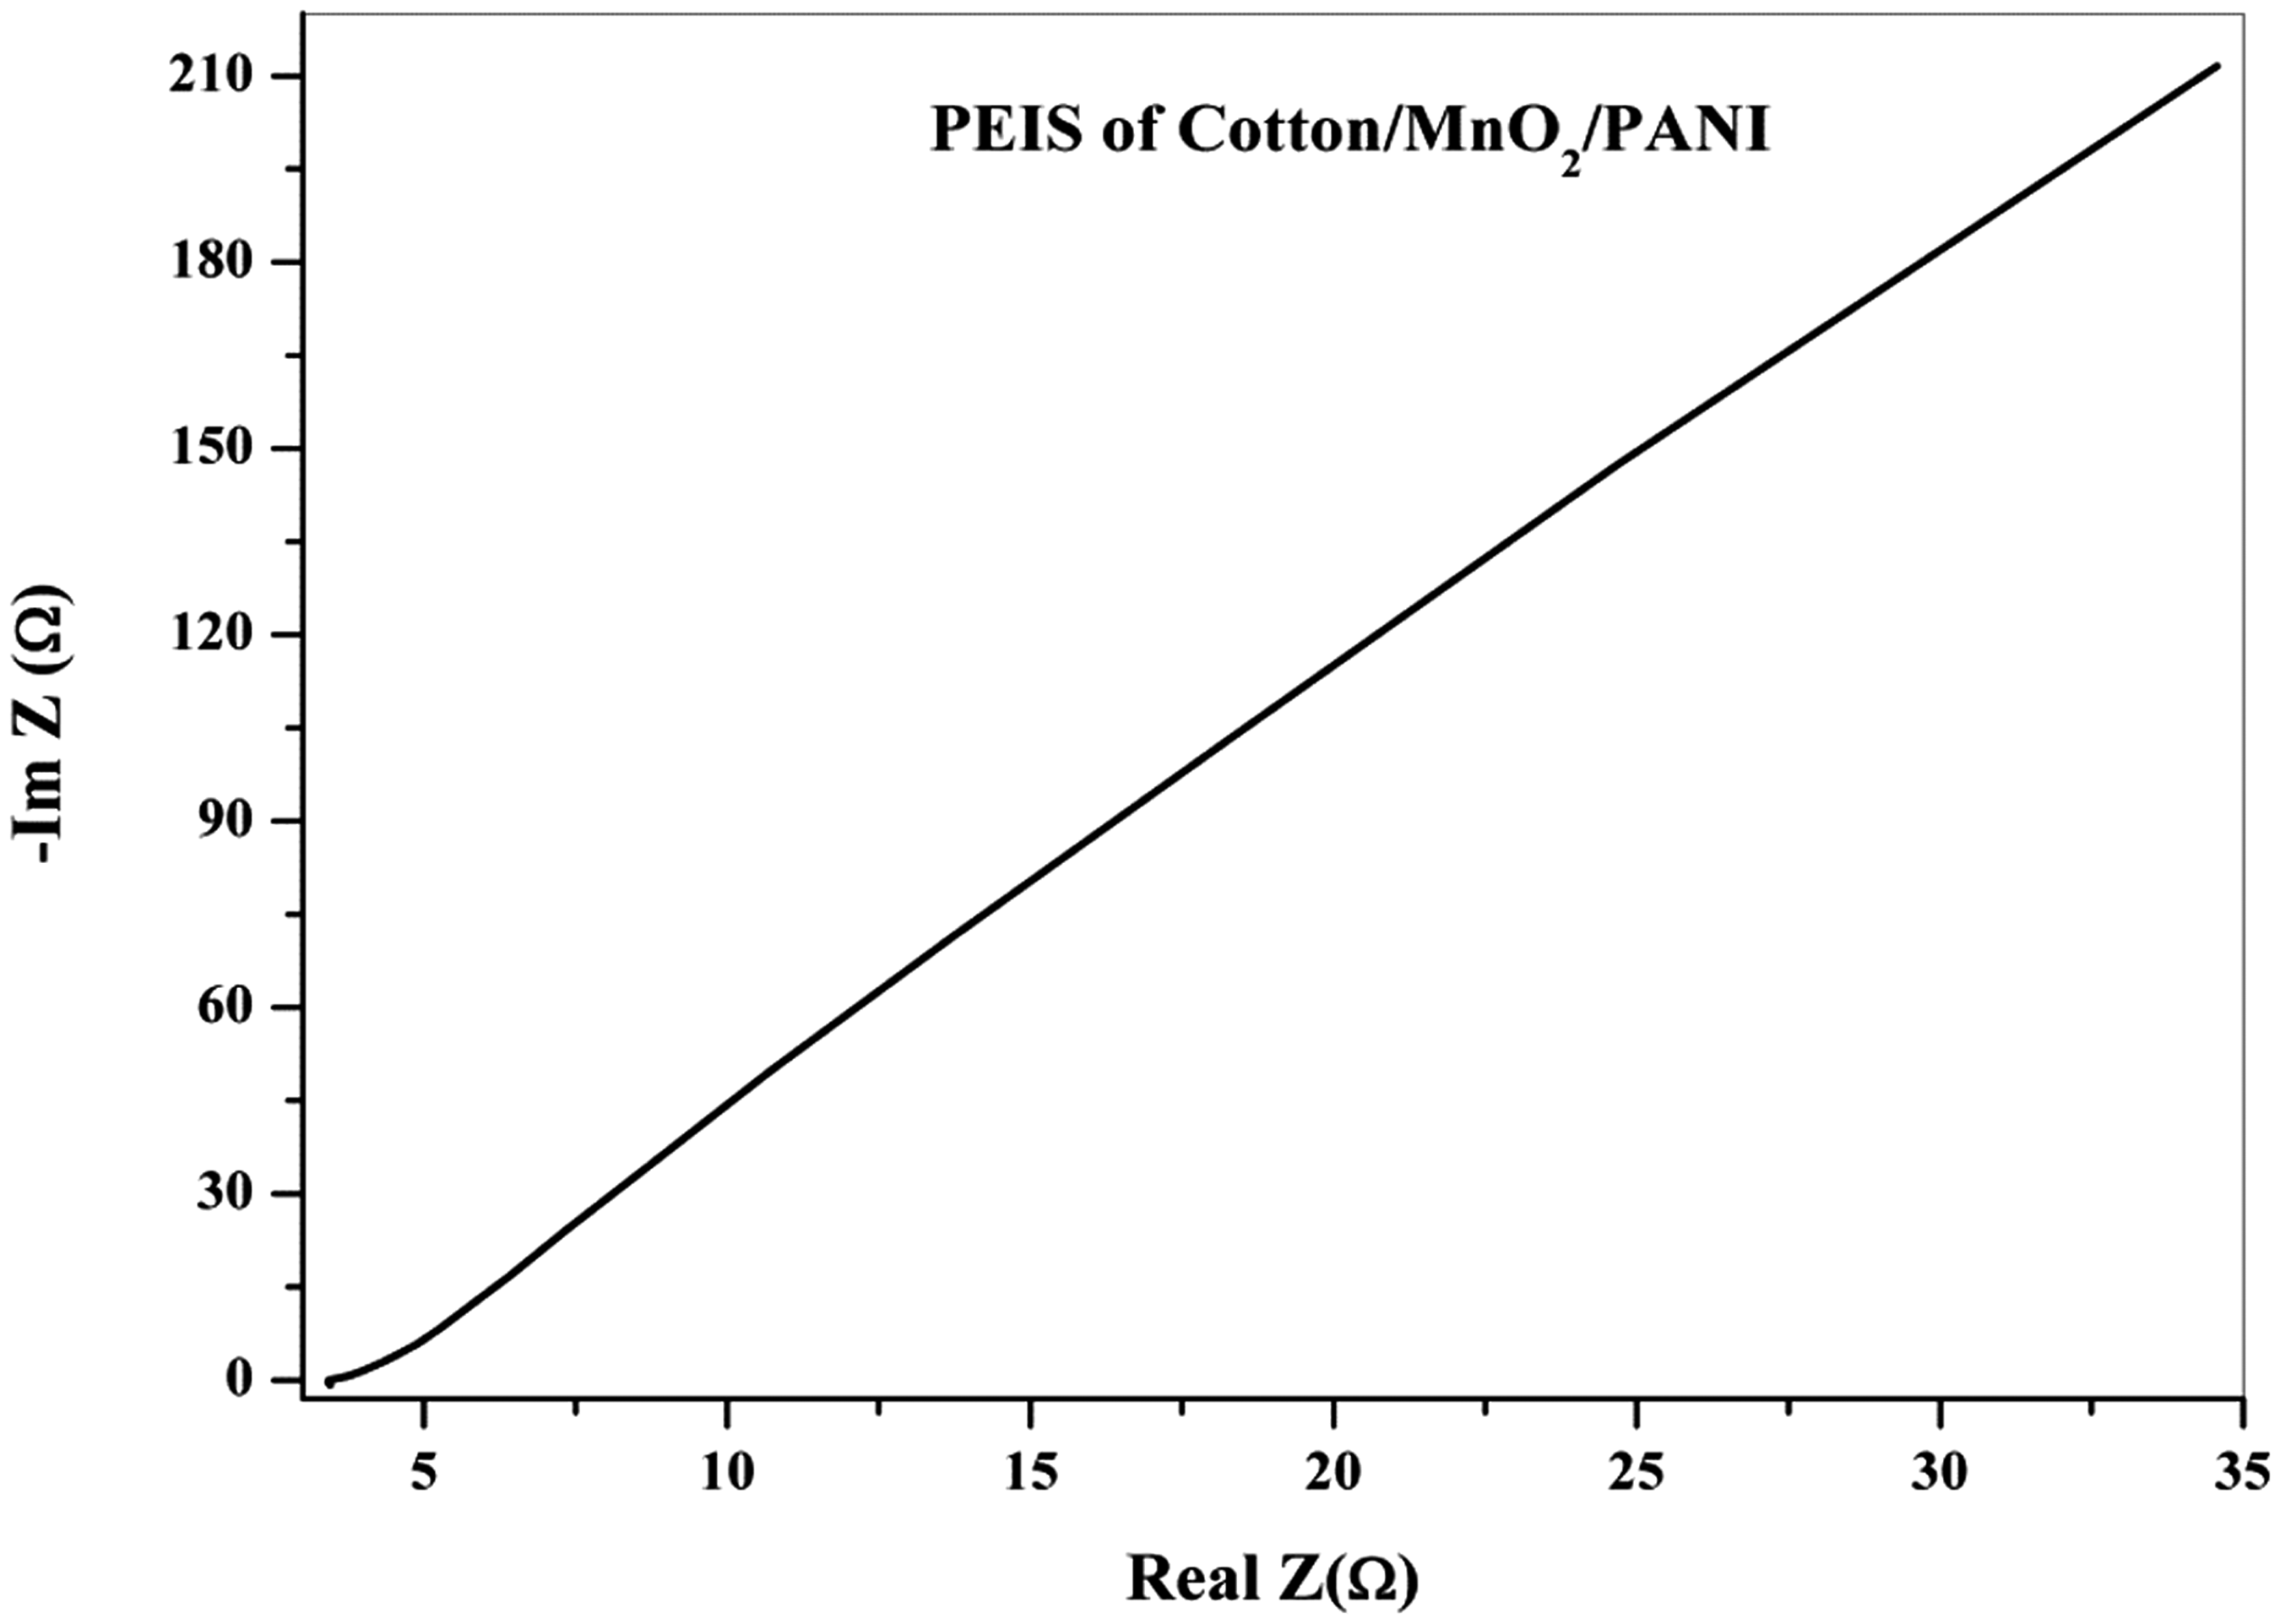
Nyquist plot of the cotton/0.2 M MnO2/PANI electrode.
The specific capacitance, Csp, was also calculated by the following equation

The relation between current and capacitance at applied frequency 1 kHz for cotton/0.2 M MnO2/PANI.
The energy content was proportional to the capacitance and to the square of the working voltage. Essentially the high dielectric constant was accompanied by high dielectric losses. The dielectric strength was also an important limit for the capacitor operation. The higher applied electrical field means that shorter lifetime. The main attribute of the capacitor was “energy density (E)” and “power density (P).” For both (E) and (P), the density could be calculated as quantity per unit mass or unit volume. The stored energy (E) was defined as [44]

From equation (7), it was clear that as resistance increased, the capacitor became less efficient providing lower power densities. Capacitors stored less energy per unit mass or volume, but the stored energy could be discharged rapidly to produce a lot of power, so their power density developed high. The values of energy density and power density were tabulated in Table 2 for Cotton/MnO2/PANI fabrics at different loaded of MnO2 nanoparticles (0.1, 0.2, and 0.3 M). From Table 2, it was noted that 0.2 M for MnO2 is the best pseudo-capacitor due to its higher power density and lower energy density.
The energy density and power density values of cotton/MnO2/PANI fabrics with different molarity MnO2 nanoparticle.

PANI: polyaniline.
Conclusion
The textile fabrics can be functionalized with conducting polymer and semiconducting materials to inculcate new electronic properties, which can be used in conjunction with or even, replace traditional textiles. Wearable electronics have novel properties such as flexibility, stretchability, and lightweight, which are difficult to be demonstrated by traditional electronic materials. All the results presented here reveal the benefits of cotton/0.2 M MnO2/PANI for the application to pseudo-capacitor electrodes. Such pseudo-capacitors can be recognized by low-cost materials and are promising for large-scale wearable energy storage. The key point of the design lies in cotton textiles into porous, mechanically flexible, and high accessible surface area. These findings prove that such environmentally friendly textiles can be a low-cost and green solution for textile-based energy-storage devices. Finally, we believe that these pseudo-capacitors will be critical components of wearable electronic devices and smart textiles.
Footnotes
Acknowledgments
We express our deepest gratitude and appreciation to Prof. Mohamed Ragaa Balboul of the National Center for Radiation Research and Technology, Egyptian Atomic Energy Authority (NCRRT-EAEA) in Electrical properties Lab., for helpful to measure the DC and AC electrical conductivity in his lab, for his external help as well as support in providing us with facilities needed for Electrical and electrochemical measurements. Also, we are thankful to Prof. Mahmoud Salah of the National Center for Radiation Research and Technology, Egyptian Atomic Energy Authority (NCRRT-EAEA) in Textile Lab., for helpful in preparation method, for his fruitful advice throughout this work.
Declaration of conflicting interests
The author(s) declared no potential conflicts of interest with respect to the research, authorship, and/or publication of this article.
Funding
The author(s) received no financial support for the research, authorship, and/or publication of this article.