
Abstract
Textile materials can be used as acoustic materials. In this study, the acoustic absorption coefficient of multilayer fabrics with 60 ends/cm and 15, 30, 45, and 60 picks/cm is measured when the fabric is added as a resistive layer on top of a polyester nonwoven, in order to study the influence of the fabric spatial structure in the acoustic absorption of the assembly. Five different fabric structures are used. Design of experiments and data analysis tools are used to describe the influence of two manufacturing factors on the sound absorption coefficient of the ensemble. These factors are the fabric weft count (picks/cm) and the thickness of the nonwoven (mm). The experimental conditions under which the maximum sound absorption coefficient is achieved are found. The influence of each factor and a mathematical model are obtained. Results of statistical and optimization analysis show that for the same fabric density, sound absorption coefficient increases as the number of layers decreases.
Introduction
Many human activities are developed indoor, like working, attending classes, visiting shopping centers, restaurants, etc., and these environments are often noisy. The continuous exposure to high levels of noise can cause different health problems, and many efforts are done to reduce these problems [1,2]. Acoustic absorption reduces the sound pressure, helping to achieve acoustic comfort. There are many types of acoustic absorbers, like resonators, porous, or combined absorbers [3]. Textile materials are included in the group of porous fibrous materials.
Sound absorbing properties of porous fibrous materials have been widely studied [4,5]. The resistive layer of this material is a multiple cloth fabric, characterized by a microstructure in which there are two main phases: one solid phase, or frame formed by the yarns with their fibers, and one gas phase formed by the air in the pores. One characteristic of porous absorbers is that they show some resistance against air flow through their pores. This produces a difference of pressure at both sides of the pore. This pressure drop is mainly caused by the friction of air particles in the pore with the frame but is only noticeable when these pores are very narrow. When a sound wave impinges on the fabric, its flow resistivity depends on the shape and size of the fabric pores. A highly resistive fabric with small pores and lower porosity produces a high flow distortion, while a fabric with a higher open porosity produces a low flow distortion. In this case, the thermo-viscous effects responsible of an important part of the sound absorption of porous materials, like the one being studied, are less important, causing a decrease in the absorption. The Johnson Champoux Allard model explains this matter, and other authors apply it to textiles [6–10].
Nonwovens can be obtained through various processes and from different natural fibers like kenaf, wood, hemp, coconut, cork, cane, cardboard, and sheep wool [11–13] kapok and milkweed [14], jute [15], etc. Synthetic mineral fibrous materials like glass or rock wool [16] have also been studied. Synthetic polymeric materials, like polyester [17], a combination of polypropylene and polyester [18], Kevlar [19] as a flame retardant, and recycled materials like polypropylene and polyester from bottles [20,21] are suitable for sound absorption.
The acoustic characteristics of textile fabrics have been studied in the form of tufted carpets [22], curtains [23–27], warp and weft knitting [28–33], and also using honeycomb 3D weave [34]. Some works study fabrics based on fiberglass [35], or micrometric mesh based on polyester and polyamide monofilament yarns [36]. In these cases, the surface of the threads is smooth and regular.
Multilayered materials are widely used to improve the efficiency of fibrous absorbers [37–39]. When in combination of a woven fabric layer and a nonwoven, the fabric acts as a resistive layer that modifies the absorption of the obtained composite material [40–42]. Besides, it has been observed that in double porosity absorbent materials, the hole profile has a strong influence so a progressive decrease of the meso-porosity as the wave penetrates inside the material increases the absorption coefficient in a wide frequency band [43].
Numerical methods like multiple regression analysis have been conducted on woven fabrics [44] and design of experiments, on thermo-compressed recycled end of life tyres (ELT) [45]. In this work, design of experiments and data analysis tools are used to describe the influence of two manufacturing factors on the sound absorption coefficient of the composite material formed by a multiple cloth fabric with different configurations and a polyester nonwoven. The fabric is used as a perforated facing, and the nonwoven is used as a porous material. The result is a lightweight, easy to handle, flexible, and easy maintenance material.
Experimental
Materials
The studied material is formed by a multilayer fabric placed on top of a polyester nonwoven, without glue.
Fabric general characteristics.
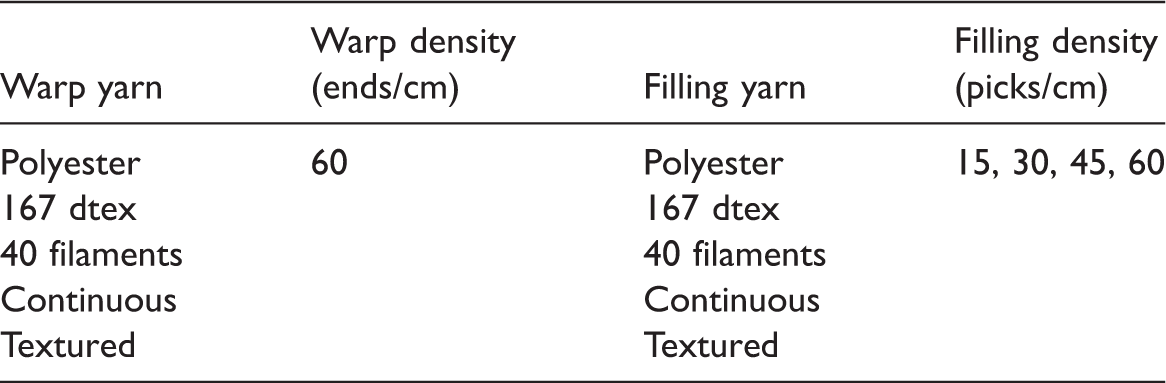
Samples are produced with a Smit GS 900 weaving machine 190 cm wide, with a Stäubli DX-100 electronic Jacquard machine. The filling density is electronically controlled. Fabrics are used as they are produced at the loom without any further treatment.
Plain weave–based multiple cloths, with evenly spaced stitching points, are designed and woven with different warp and weft ratios and filling densities. They are named according to Table 1.
Classification and schematic view of fabrics.

Characteristics of nonwoven.

Methods
Fabric surface density and thickness
The fabric surface density is determined following the procedure described in the standard UNE-EN_12127 = 1998_ Determination of the Mass per Unit of Surface of Small Samples, except that only three specimens are taken with respect to five that indicates the standard. This is done by checking that the standard deviation is very low (less than 4), and not being the factor of decisive importance.
Thickness is measured using a material thickness gauge.
Normal incidence sound absorption coefficient
In order to perform the measurements of the absorption coefficient of the different samples, the method described in ISO 10534-2 is followed: Determination of Acoustic Absorption Coefficient and Acoustic Impedance in Impedance Tubes, Part 2: Transfer Function Method. By means of this method the acoustic absorption coefficient for the normal incidence is obtained using a tube of standing waves, two microphones and a digital system of signal analysis. A source of noise generates flat waves in the tube. By measuring the acoustic pressure in two positions with microphones mounted on the wall, the decomposition of the interferential field is performed. Next, using a Matlab function designed for this purpose, the complex acoustic transfer function of the signals in the two microphones is determined, from which the absorption coefficient at normal incidence is deduced.
The impedance tube is a narrow, rigid, and airtight duct that must meet the characteristics described in the mentioned standard.
To perform the test, the sample is placed at one end of the impedance tube (Figure 1), without air cavity. The fabric is placed on the face closest to the sound source. In the case of unbalanced fabrics, the face of less density is the one that is placed on the side of the sound source. The specimen must fit well to the sample holder without being unduly compressed or adjusted so firmly that it is bulged.
Scheme of the apparatus used to measure the sound absorption coefficient, where: (1a) sample: fabric side; (1b) sample: nonwoven side; (2) the two microphones (microphones G.R.A.S. model 40AO); (3) the data acquisition system (NI-9233); (4) the PC, and (5) the sound source.
The reflection coefficient is determined by the following equation

And the acoustic absorption coefficient for normal incidence is determined by the equation

Design of experiment
Experimental and response factors.

SAC: sound absorption coefficient.
Results and discussion
Fabric surface density
Surface density of the obtained fabrics (60 ends/cm).

VC: variation coefficients.
Thickness of the obtained fabrics.

Thickness of nonwoven
By increasing the thickness of the nonwoven, the resistive layer is separated from the rigid wall, which causes a decrease in the frequency of maximum absorption. It is observed that there is an increase in the sound absorption coefficient, produced by adding a fabric layer to the nonwoven. Otherwise, as the thickness of the nonwoven layer increases this effect is less important.
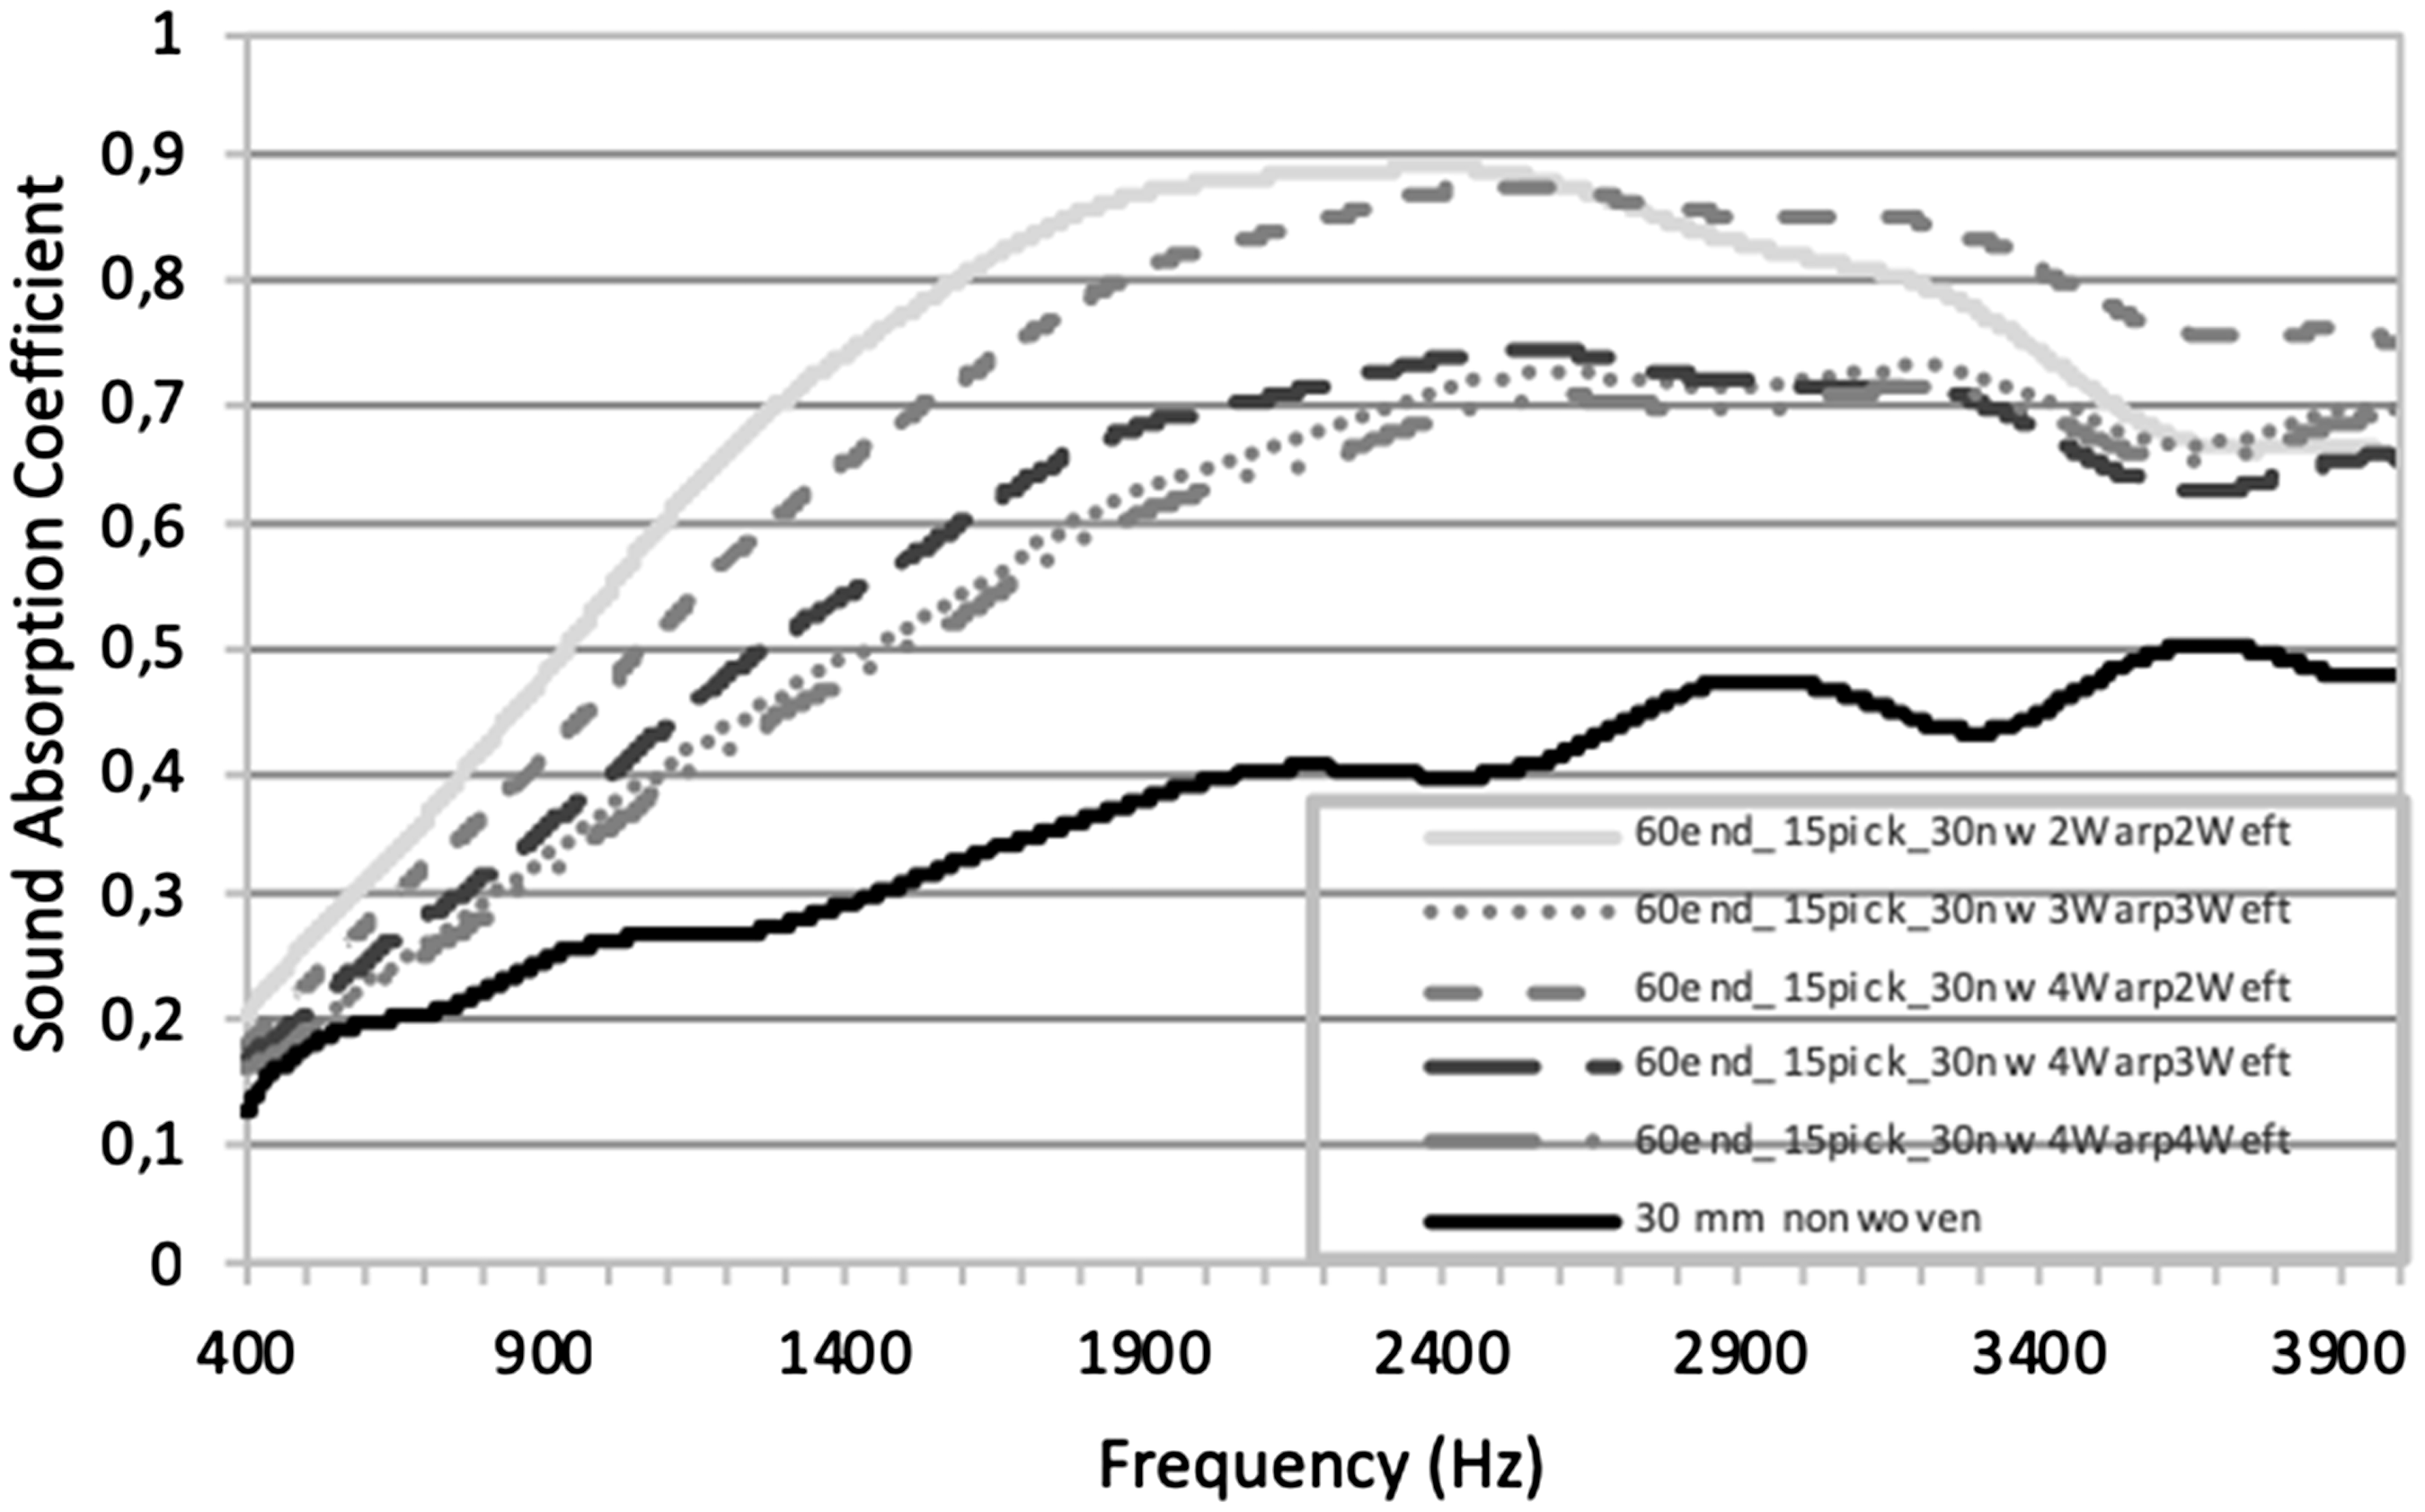
Figure 2 shows the sound absorption curve of a 15 mm nonwoven and the effect of overlaying different fabrics on it, with a low weft density of 15 picks/cm, as an example. Figures 3 and 4 show sound absorption curves of the same configurations, with nonwoven thickness of 30 mm in Figure 3, and 45 mm in Figure 4.
Sound absorption coefficient of multilayer fabrics with 15 picks/cm facing plus 15 mm nonwoven backing. Sound absorption coefficient of multilayer fabrics with 15 picks/cm facing plus 30 mm nonwoven backing. Sound absorption coefficient of multilayer fabrics facing with 15 picks/cm plus 45 mm nonwoven backing.
Maximum absorption coefficients of the combination of a 60 ends/cm and 15 picks/cm fabric with 15, 30, and 45 mm nonwoven.

For all studied thicknesses of nonwoven, fabrics that produce the highest absorption values are those formed by two layers, then those formed by three layers and finally those formed by four layers. Within the two-layer fabrics, those formed by balanced double cloths produce a slightly higher absorption than those formed by unbalanced double cloths. This difference varies in a nonlinear way, according to the thickness of the nonwoven layer, being greater in the case of using 30 mm of nonwoven than in cases where 15 and 45 mm of nonwoven are used. Within the three-layer fabrics, the opposite occurs: absorption is generally better when the warp ratio is 1–1–2. This effect is lower in the case of adding 45 mm of nonwoven and is inverted in the case of 30 mm of nonwoven at frequencies above 2938 Hz.
Fabric density
The sound absorption coefficient increases with the increment of fabric density for all fabric structures, except for the 2Warp2Weft samples. In these fabrics, which reach a maximum absorption coefficient of 0.97 at 1204.83 Hz with 45 picks/cm, if the weft density is increased to 60 picks/cm, there is an alteration of the curve, with two maxima: from 0.87 to 814.21 Hz and from 0.88 to 1851.80 Hz. In addition, a lower coefficient of absorption is obtained than the one presented by nonwoven without facing, between 2907 and 3741 Hz.
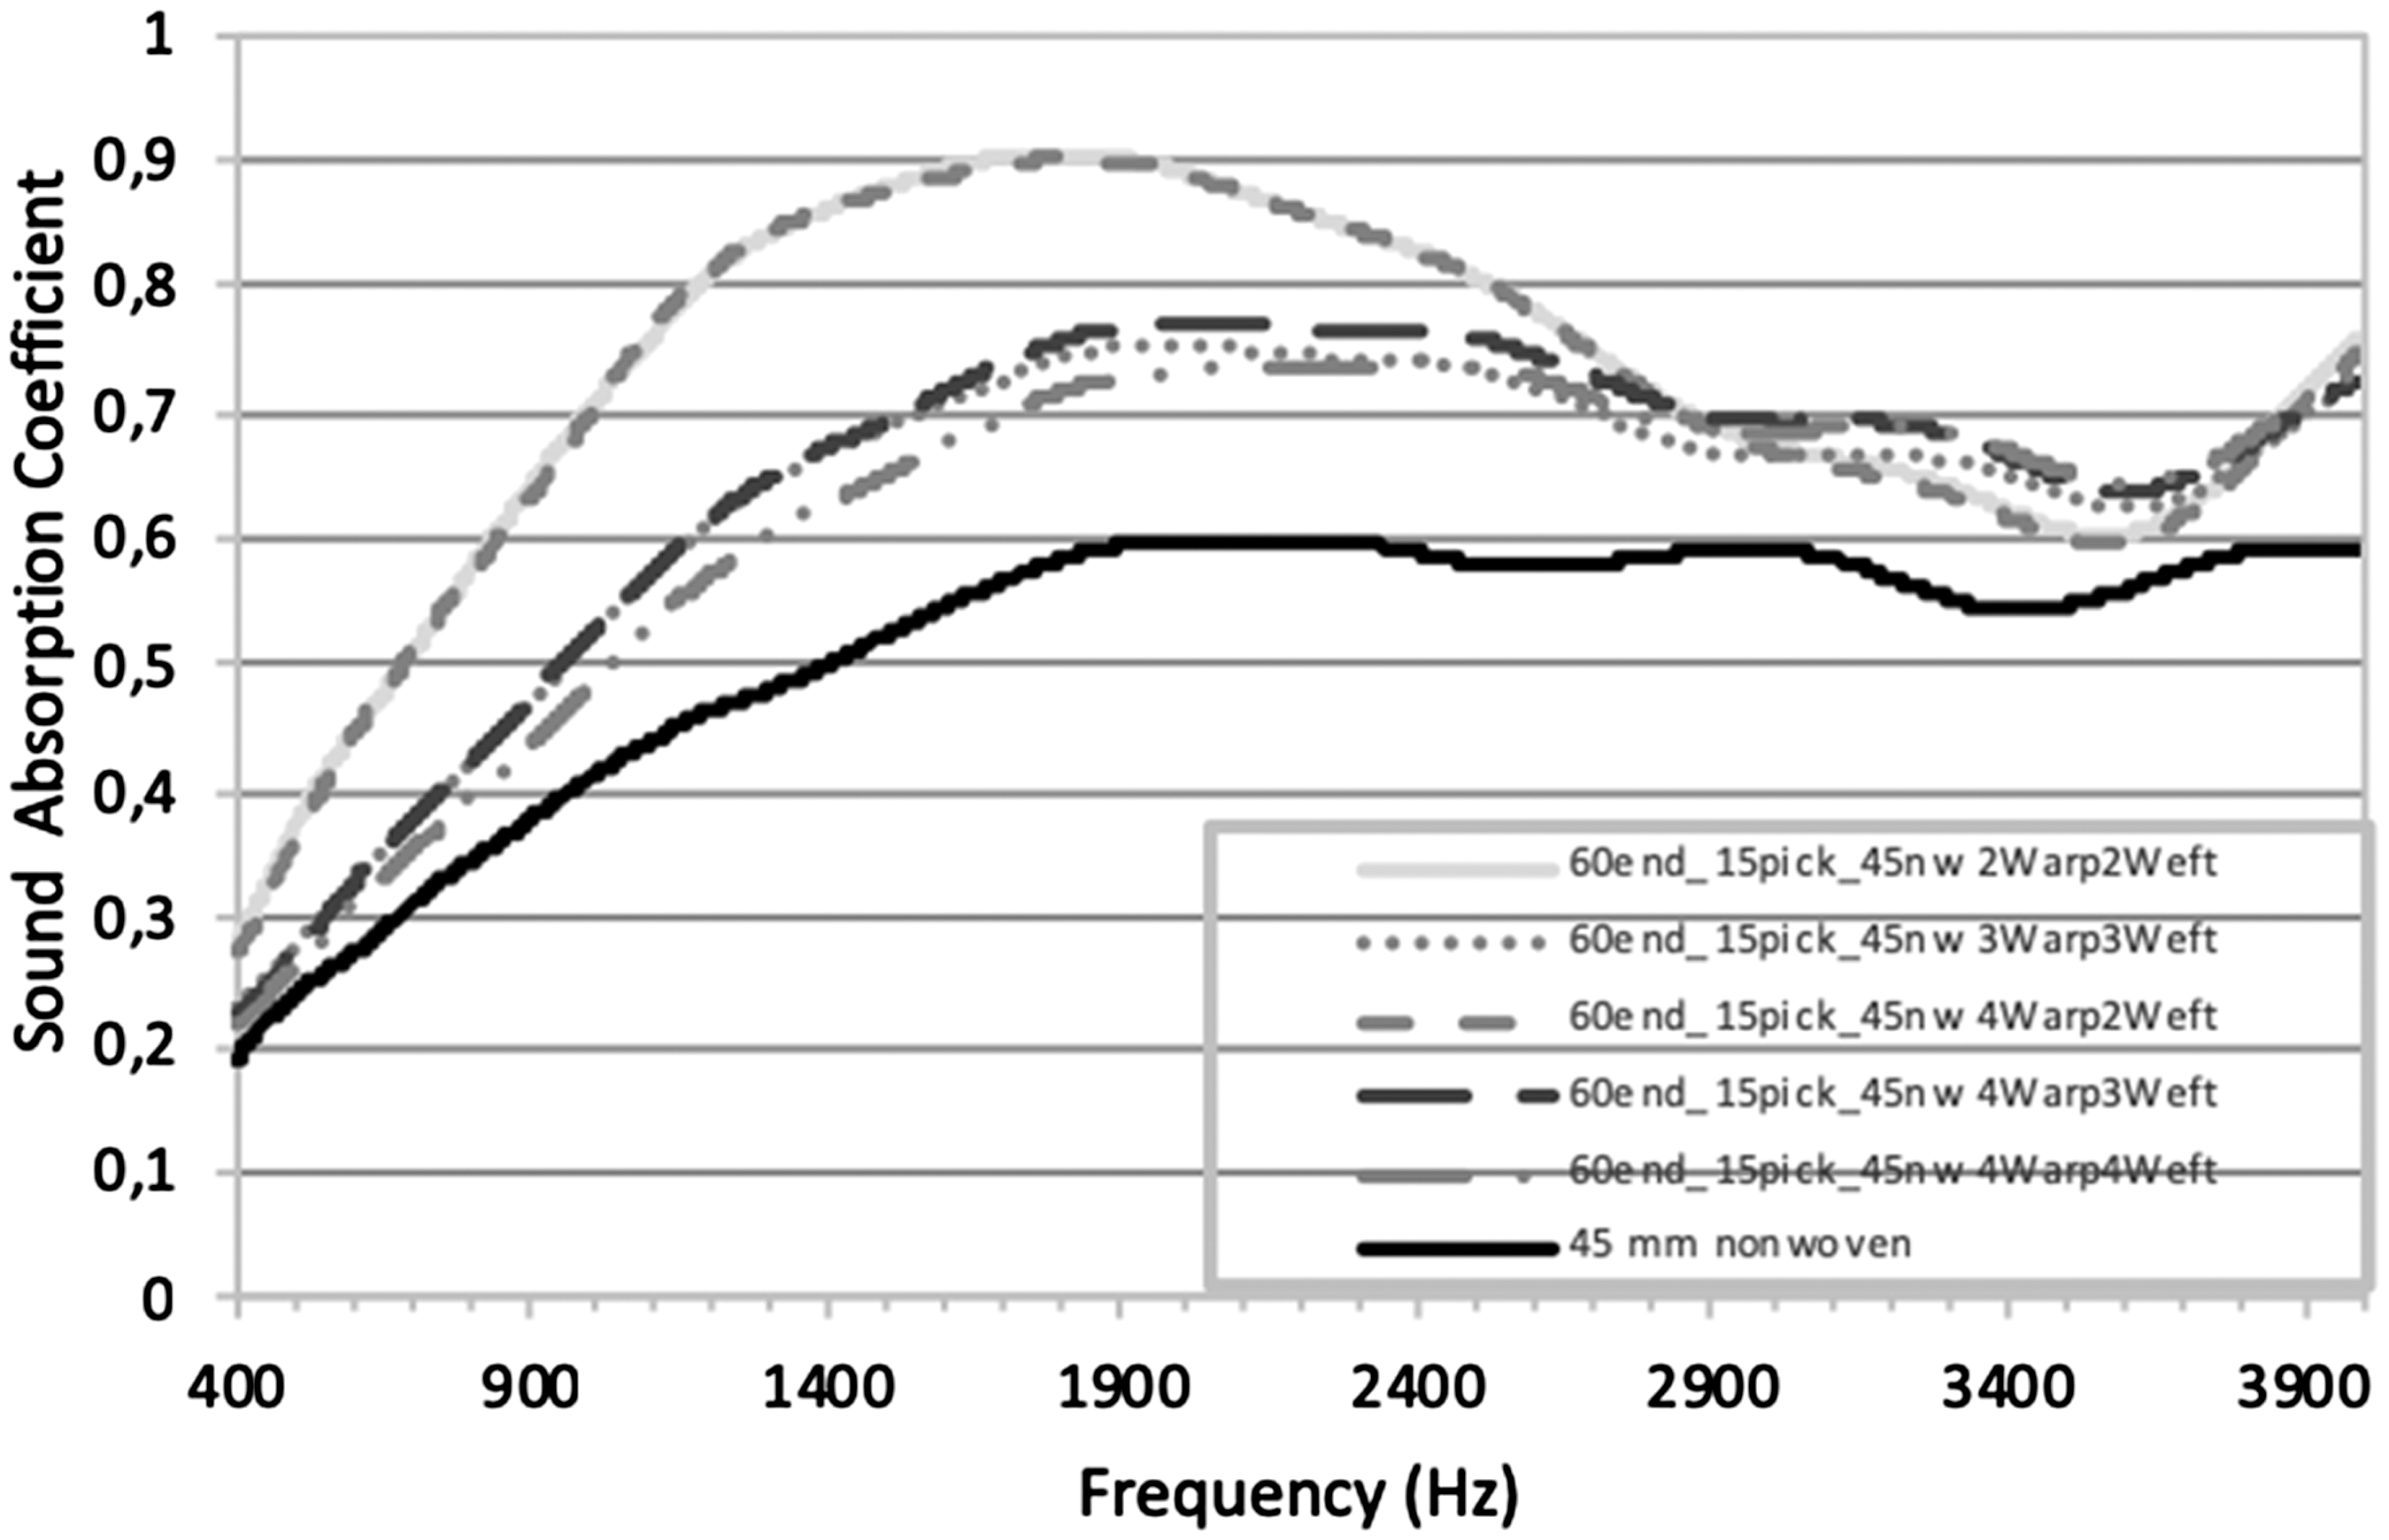
Figure 5 shows the sound absorption curve of a 45 mm nonwoven and the effect of overlaying a 30 picks/cm fabric on it, as an example. Figures 6 and 7 show sound absorption curves of the same configurations, but with a weft density of 45 picks/cm in Figure 6, and 60 picks/cm in Figure 7.
Sound absorption coefficient of multilayer fabrics with 30 picks/cm plus 45 mm nonwoven backing. Sound absorption coefficient of multilayer fabrics with 45 picks/cm plus 45 mm nonwoven backing. Sound absorption coefficient of multilayer fabrics with 60 picks/cm plus 45 mm nonwoven backing.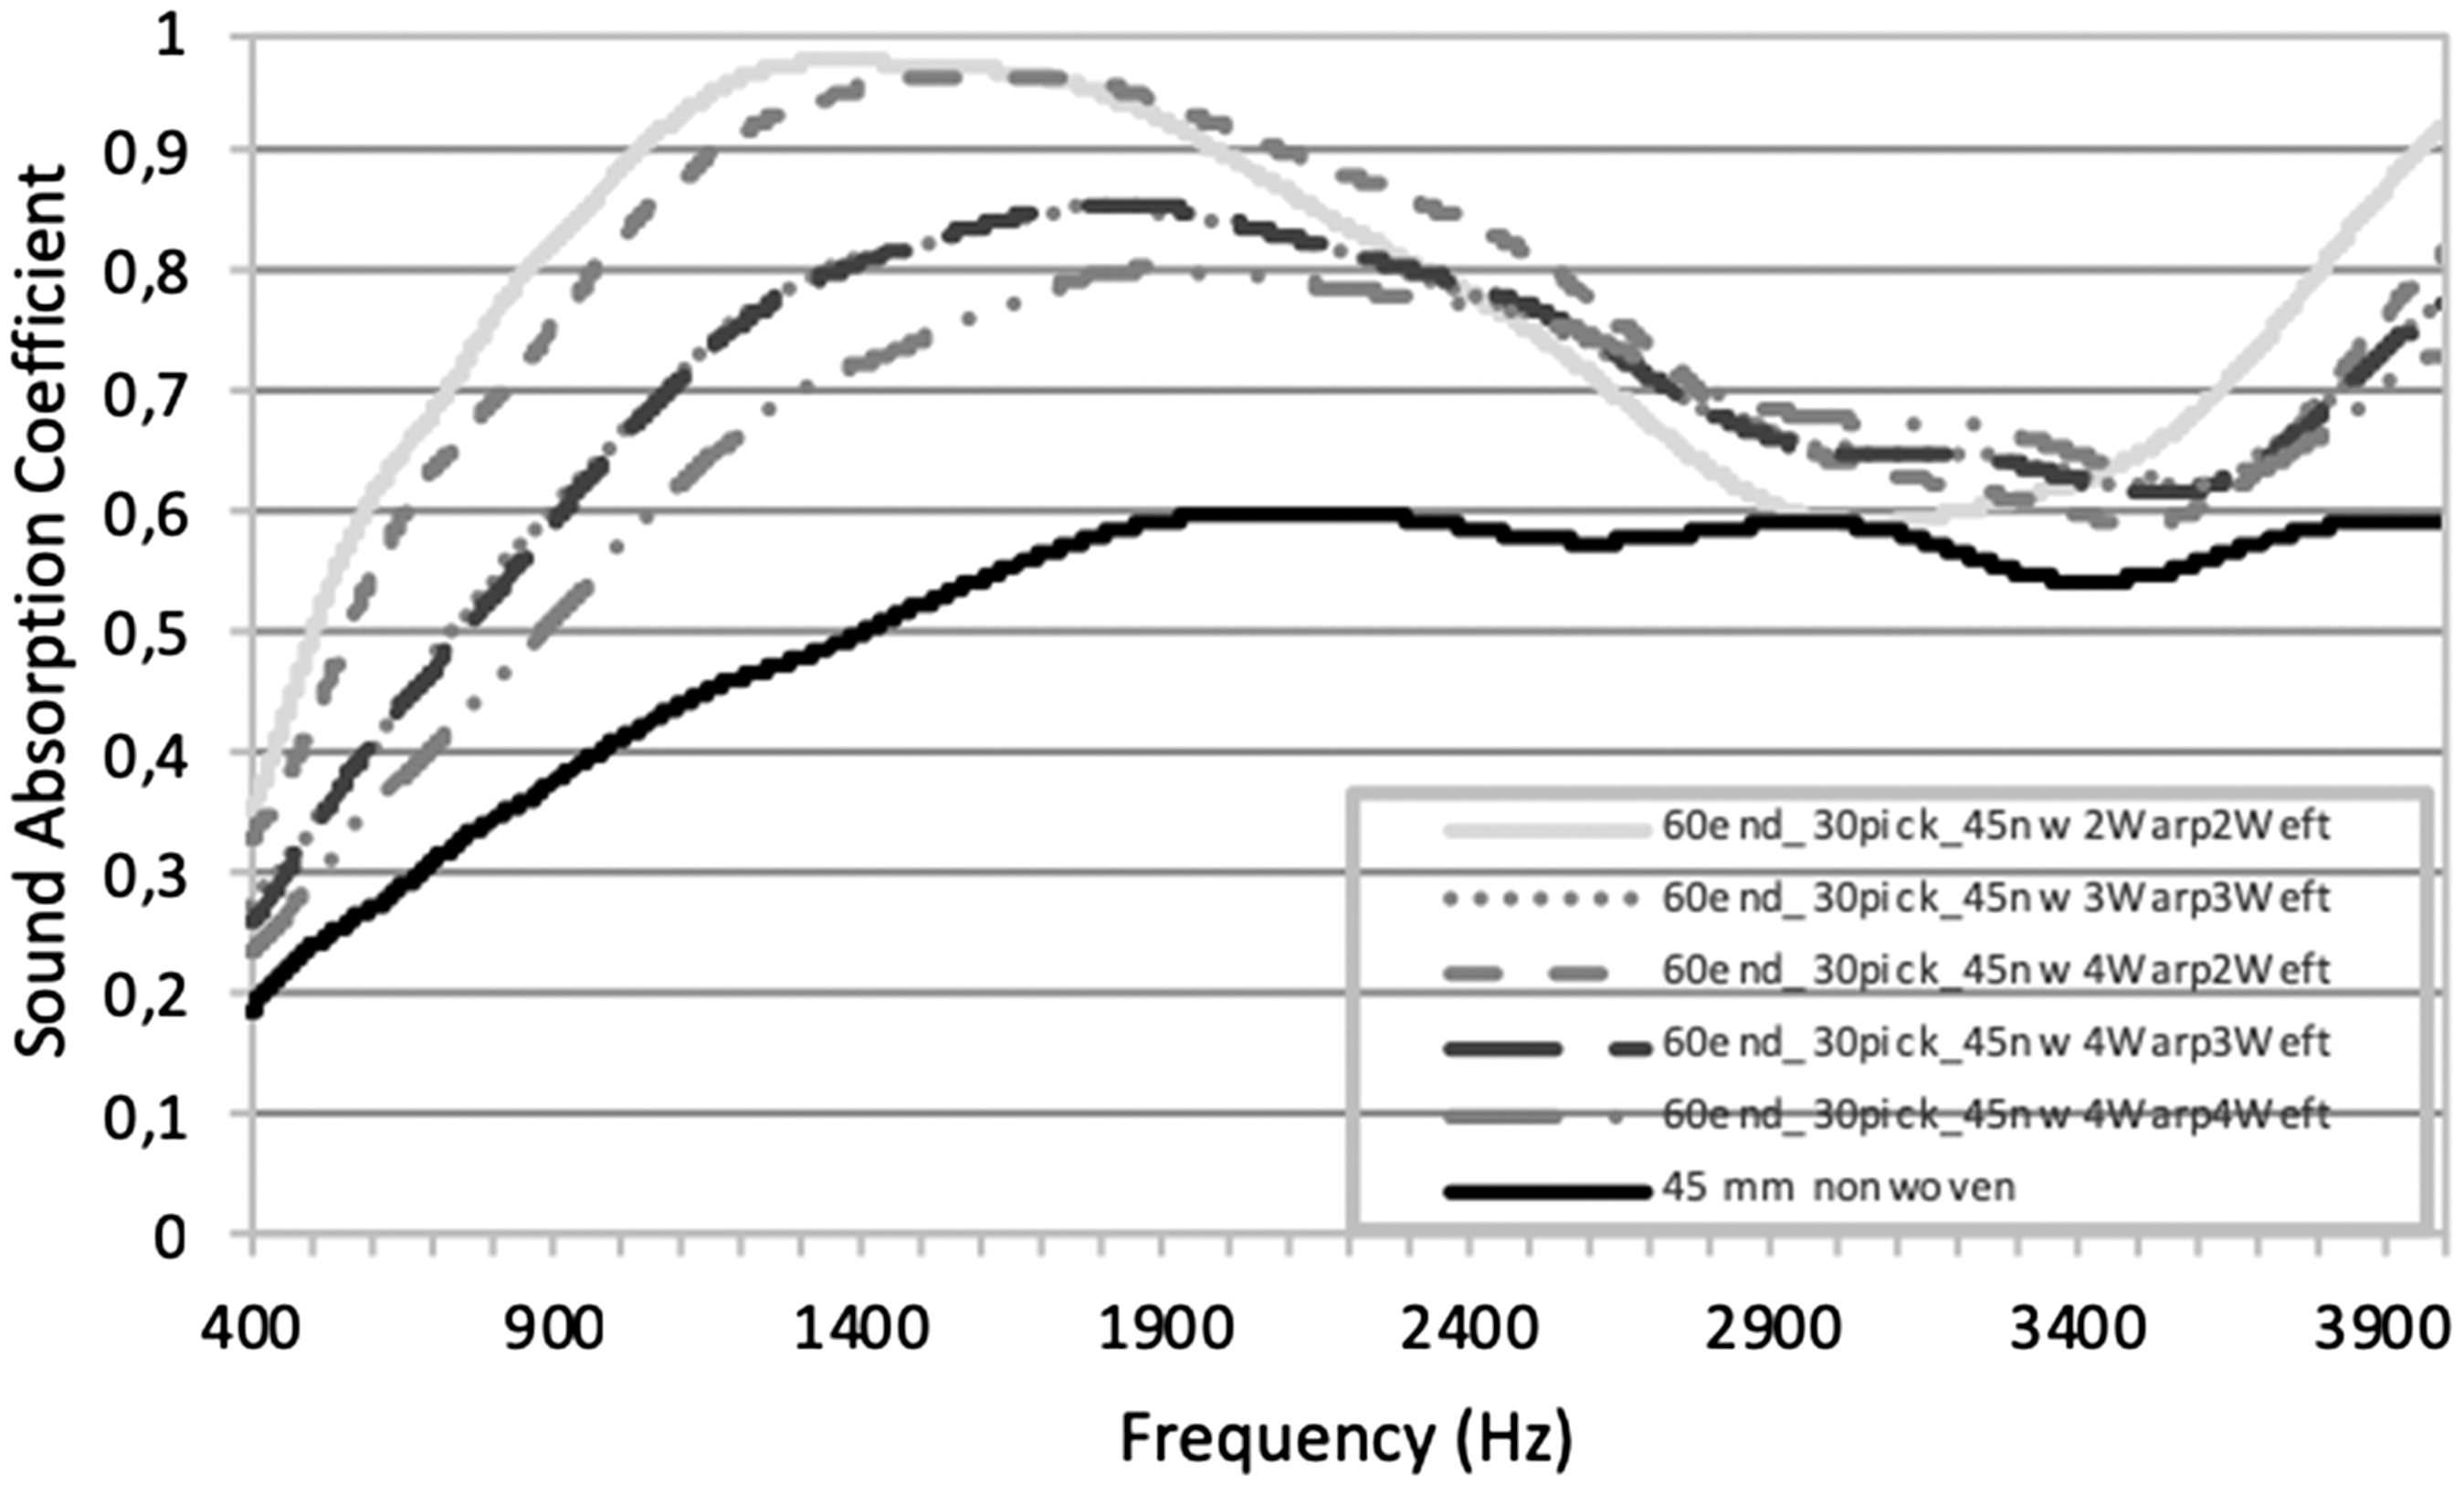
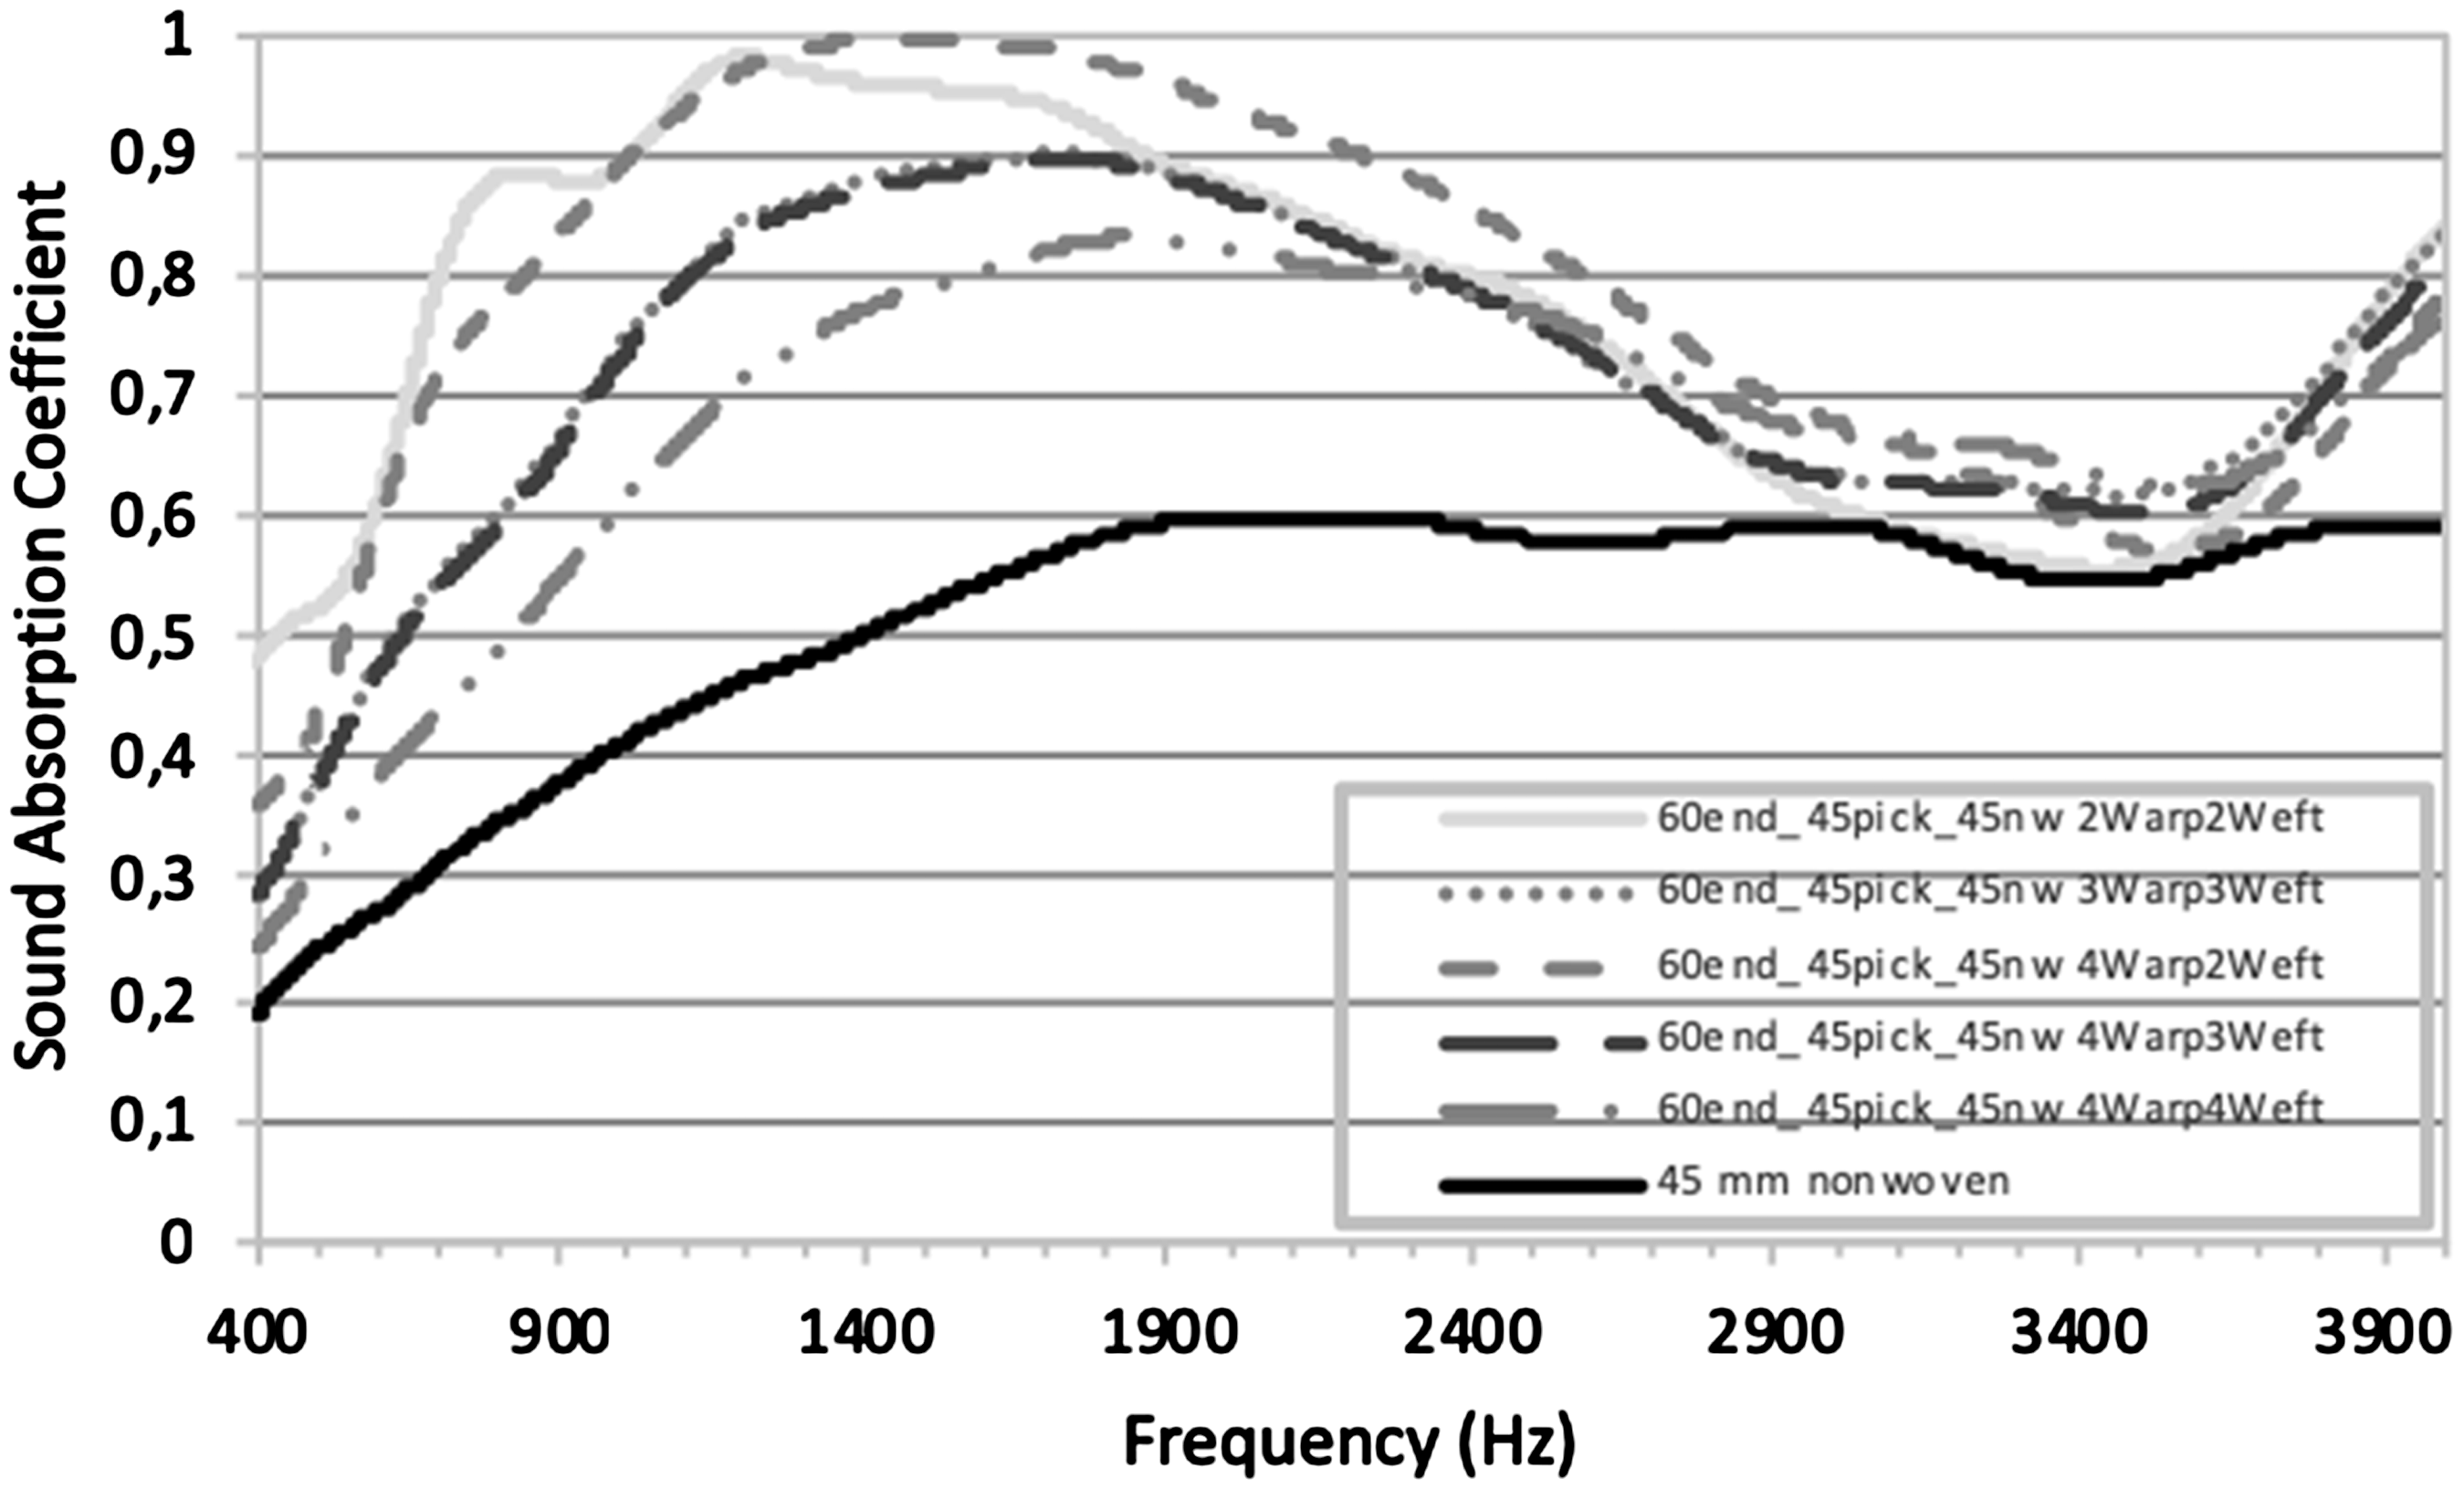

By increasing the weft density of the fabric, and therefore its mass, the size of the generated inter-yarn pores decreases. This also produces some narrowing of sound absorption curves which indicate an increase in the selectivity of the absorbed sound.
Fabric balancing
Comparing balanced cloths, with equalled sized pores in their layers, with unbalanced cloths, with smaller sized pores in the top layer, curves of sound absorption coefficient are very similar. There is an exception in the case of double fabrics with 60 picks/cm. In this case, it is observed that while the unbalanced fabric follows the expected curve, the balanced fabric exhibits a different behavior. It seems that there is a limit value between 30 and 60 picks/cm from which the balanced double cloth structure begins to decrease its beneficial effect on absorption at some frequencies. This may be because the size of the pores is reduced so that the fabric begins to work as a nonporous membrane. This confirms that the application of a resistive layer on a nonwoven does not always improve the sound absorption of the ensemble.
Design of experiment
Terms that contribute most to the variability in the response
Relative magnitude and statistical significance of the main effects and of their interaction.
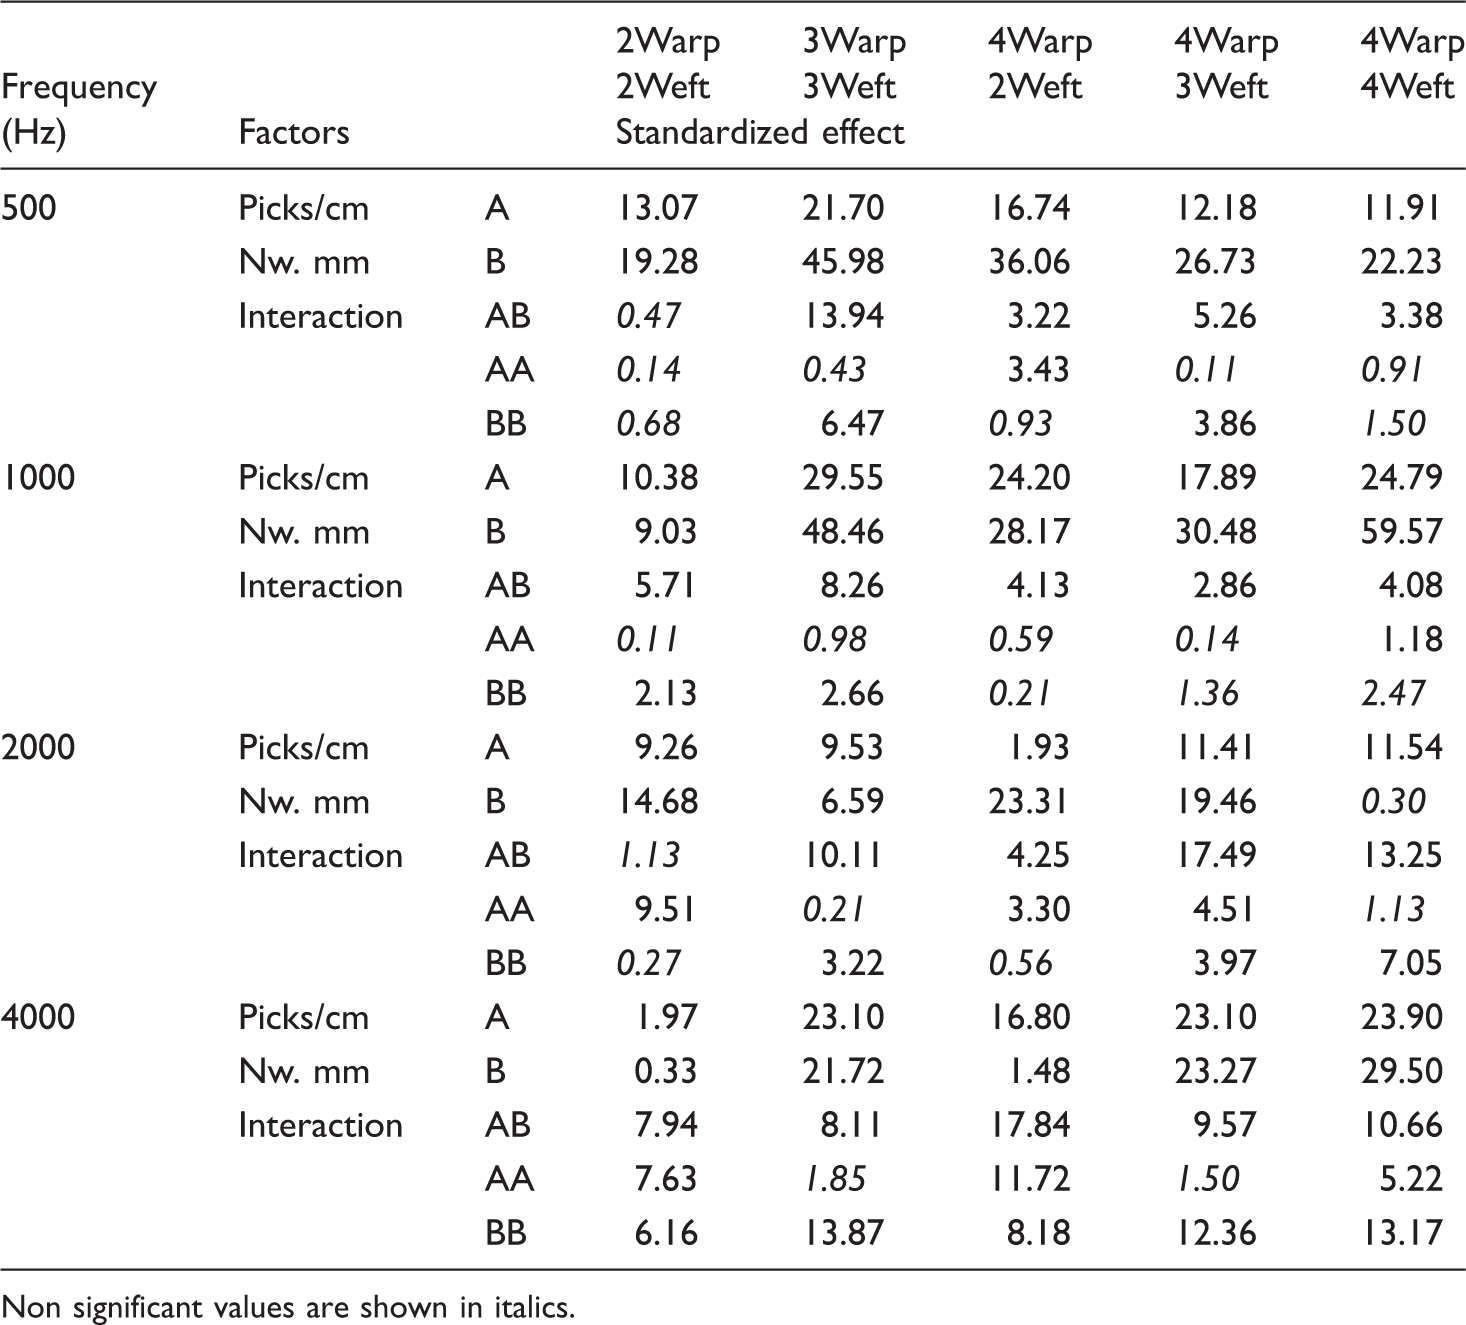
Non significant values are shown in italics.
Terms with statistically significant effects on the response
Analysis of variance for SAC500.

R-squared = 96.0843%. R-squared (adjusted for d.f.) = 95.7943%. Standard error of Est. = 0.0290558. Mean absolute error = 0.0234244. Durbin–Watson statistic = 1.65047 (P = 0.1371). Lag 1 residual autocorrelation = 0.13601.
Analysis of variance for SAC1000.

R-squared = 90.9838%. R-squared (adjusted for d. f.) = 89.5412%. Standard error of est. = 0.0558919. Mean absolute error = 0.0412814. Durbin–Watson statistic = 2.12449 (P = 0.6411). Lag 1 residual autocorrelation = −0.0885422.
Analysis of variance for SAC2000.

R-squared = 94.5211%. R-squared (adjusted for d.f.) = 93.8889%. Standard error of est. = 0.0303084. Mean absolute error = 0.0224874. Durbin–Watson statistic = 1.88751 (P = 0.2967). Lag 1 residual autocorrelation = 0.0167054.
Analysis of variance for SAC4000.

R-squared = 89.304%. R-squared (adjusted for d.f.) = 87.0757%. Standard error of est. = 0.0278139. Mean absolute error = 0.0181709. Durbin–Watson statistic = 1.97491 (P = 0.4583). Lag 1 residual autocorrelation = −0.00646337.
Equations of the regression model adjusted to the data
The underlying model takes the form of a multiple linear regression model. The response variable is expressed as a linear function of the two main effects, the two-factor interaction represented by a cross product of weft density and nonwoven thickness, the quadratic terms, and the error term. The quadratic effect causes the estimation of the response surface to show a curvature.
Regression equations corresponding to the sound absorption coefficient of the composite material when the fabric structure 2Warp2Weft is used.

Optimization
Multiple response optimization.

Maximum sound absorption coefficients are shown in boldface.
Optimization of experiments has helped to find the values of weft density and nonwoven thickness that lead to the highest sound absorption coefficient in a wide range of frequencies, for each fabric structure. It is found that it is not necessary to use a large nonwoven thickness, neither high values of weft density to achieve a high absorption. The optimum nonwoven thickness is 34.28 mm for the material with 2Warp2Weft fabric and 28.94 mm for the material with 4Warp2Weft fabric.
Conclusions
The influence of the fabric spatial structure in the acoustic absorption of a layered material made up of a multiple cloth fabric in combination with a nonwoven has been studied. High levels of sound absorption in some frequencies have been achieved.
A mathematical model is obtained based on regression equations. The main factors that cause variation in the sound absorption coefficient are obtained. These factors have different influence at each frequency, and for each fabric structure.
Optimization of experiments has permitted to compare the five different fabric structures and their influence on the sound absorption coefficient of the layered material. Double cloth structures result to be the ones that achieve higher sound absorption coefficient, with lower weft density and smaller nonwoven thickness. Results of statistical analysis coincide with previous observations of sound-absorbing curves, whereas the number of layers decreases, for the same fabric density, absorption increases. This may be due to the decrease in inter-yarn pores size, and the consequent increase in viscous friction.
For future studies, design of experiments is considered as a helpful tool in order to improve textile composite sound-absorbing materials design.
Footnotes
Declaration of conflicting interests
The author(s) declared no potential conflicts of interest with respect to the research, authorship, and/or publication of this article.
Funding
The author(s) received no financial support for the research, authorship, and/or publication of this article.