
Abstract
The current study deals with the effective usage of Portunus sanguinolentus shell, which is a solid waste in the seafood industry. This Portunus sanguinolentus shell waste was powdered and used as untreated fillers in jute fabrics reinforced epoxy composites. Then Portunus sanguinolentus shell waste powder was treated with chemicals to perform fat removal, deproteination, decarbonization and deacetylation to obtain treated Portunus sanguinolentus shell filler. Three different composites were developed with traditional hand layup process consisting of four layers jute fabrics that were filled with 10 wt% untreated Portunus sanguinolentus shell filler, chemical treated 10 wt% Portunus sanguinolentus shell filler and unfilled one. The thermo-mechanical and fracture morphologies were assessed by tensile, flexural, compression, shear, impact, hardness thermogravimetric analysis, Fourier-transform infrared spectroscopy and scanning electron microscopy analysis. The results showed an increase in the thermo-mechanical property of chemical-treated Portunus sanguinolentus shell powder-filled jute fabrics-based epoxy composite. This phenomenon is due to the increase in the chitosan, mineral contents and decrease in the organic content in the Portunus sanguinolentus shell powder due to chemical treatment, thus enhancing the bonding between the filler and fiber matrix with reduction of the void. A showcase stand was developed with the best performer, as an attempt in the perfection of application. The application is then analyzed using ANSYS to predict the deformation behavior when subjected to 0.25 kg, 0.5 kg and 1 kg loads.
Introduction
Polymers reinforced with fibers, namely glass and aramid, increase several properties like stiffness, toughness and better strength-to-weight ratio when compared with the addition of fillers, namely wood, and many types of fillers alone. Though the addition of glass and aramid increases several properties, the cost associated with it is very high, and it has disposal problems too. On the other hand, the interest among the natural fiber reinforced polymers has increased due to the environmental impact and increase in several properties of polymers [1–3]. The increase in mechanical strength of natural fiber reinforced polymers has gained interest among certain researchers and industrial sectors [4]. Broad research has been carried out in the area of polymers reinforced with jute fibers, coir fibers, rice husk and straw, seashells and many more fillers, which have also been proved to be a vital reinforcement in both types of plastics (i.e. thermosets and thermoplastics) [5–8]. Even now the effect of waste filler and its surface treatment needs more focus. Some of the literature related to it are discussed below. Boopalan et al. [9] manufactured hybrid epoxy composites based on jute and banana fibers and tested for mechanical, water absorption characteristics. From the results, the mechanical and resistance to absorption characteristics were the best for the 50/50 weight ratio composites. The fillers were added to the jute and banana fibers, which showed better improvement in their mechanical properties. Thus, the addition of fillers boosted good strength-to-weight ratio. Prabhakar et al. [10] reinforced waste peanut shell powder on epoxy composites and studied their thermo-mechanical characteristics. It was reported that the thermo-mechanical properties of epoxy composites were higher when alkali-treated fillers were used compared to untreated powder. Li et al. [11] developed polypropylene composites based on waste shellfish shell bio-filler and calcium carbonate filler. It was proved that the addition of shellfish shell bio-filler to polypropylene increased mechanical properties when compared to the addition of calcium carbonate. Sathiyamurthy et al. [12] investigated the influence of different fiber length and addition of filler on calcium carbonate-filled coir fiber composites on various mechanical properties. From the results, it was proved that the optimized fiber length and filler contents would increase the desired properties. Athith et al. [13] studied the effect of tungsten carbide on the mechanical and tribological properties of jute/sisal/E-glass fabrics reinforced natural rubber/epoxy composites. It was observed that the filler loading with an optimal percentage (10%) increased the mechanical properties and decreased the wear rate. Agarwal et al. [14] manufactured chopped glass fiber reinforced in epoxy matrix composites and chopped glass fiber epoxy composites filled with SiC. From the results, it was shown that the addition of SiC by 10 wt% improved tensile and flexural properties while the addition of SiC by 15 wt% showed better impact and hardness characteristics. Vijay et al. [15] reinforced Azadirachta indica seed powder and spent Camellia sinensis powders as fillers in jute epoxy composites; the results revealed 10 wt% of azadirachta seed powder showed increase in mechanical properties and 10 wt% of spent Camellia sinensis fillers in composites showed better thermal stability due to the inorganic constituents present in it. Vinod et al. [16] studied the thermo-mechanical behavior of calatropsis gigantea powder-filled jute-epoxy composites and found that 10 wt% of the fillers-based composites showed enhanced thermal stability and mechanical properties. Pawar et al. [17] studied the mechanical properties of granite powder-filled jute fiber-based epoxy composite. It was found that an increase in filler percentage more than 10 wt% caused a decrease in the ultimate tensile strength and ultimate flexural strength properties of the composites. Raghavendra et al. [18] studied the effect of fly ash filler loading wt% on the mechanical and erosive characteristics of Woven Jute/Glass Hybrid Polymer Composite. It was found that 10 wt% of fly ash-based hybrid composites showed better flexural, tensile and erosive resistance characteristics. From the literature survey, it was found that there are many works related to the natural fiber reinforced with epoxy composites, mostly 10 wt% of fillers produced good performance due to the prevention of agglomeration when mixed in the matrix. Less number of works have been reported with different shell reinforced composites and there is no work reported with the use of Portunus sanguinolentus shell powders and chemical treated shell powders in the epoxy composites. Thus, in this study, the jute fabrics-epoxy composites were developed by reinforcing treated and untreated Portunus sanguinolentus shell powder with 10 wt%. For comparison purposes, jute fabrics-based epoxy composites without reinforcement were also developed. The developed composites were characterized for their mechanical behavior viz. hardness, tensile, flexural, impact, compression strength and thermal stability using thermogravimetric analysis (TGA). The morphology of the tested composites was studied using scanning electron microscope (SEM).
Materials and methods
Jute fibers are abundantly found in the Bengal regions of India and Bangladesh. The fibers are separated from the stem of the jute plant using manual retting process followed by dehydrating in the air. Jute fibers used in the present study are fabrics (bi-woven fiber mat). The fabric used was 300 × 300 mm. It has ∼ 126 threads longitudinally and latitudinally, possessing 160 GSM. It possesses tensile strength ranging from 647 MPa, cellulose and lignin contents 62% and 13%, respectively, and having a density of 1.32 g/cc [16]. The epoxy resin with grade LY556 usually called as Bisphenol A Diglycidyl Ether and Hardener possessing HY951 grade called as tri-ethylene tetramine was used as matrix. They were mixed in 10:1 ratio for enhancing the adhesion and strength [16]. Portunus sanguinolentus belongs to the Portunus crab family commonly known as Blood-spotted Swimmer Crab (three spot crab) in the coastal regions of Chennai, South India (Latitude 13° 04′ N, Longitude 80° 17′ E). Its shell is a solid waste which is thrown after consuming the Portunus sanguinolentus as eating. This shell was procured from a local seafood dealer and was thoroughly washed in the distilled water, ground in a mortar and sieved to 150–200 microns. Generally, Portunus sanguinolentus bouligand structure comprises the cuticle, the outer non-cellular layer, comprising three sub-layers namely endocuticle, which is the inner and thickest layer made up of chitin and arthropodin, a soft, colorless and flexible layer. Exocuticle layer is the middle layer, which is much thicker, dark and rigid due to the chitin and sclerotin composition. The outer thinnest layer is the epicuticle. This layer is subdivided into inner epicuticle which contains wax filaments, while the outer epicuticle makes contact with cuticulin. Cuticulin is the non-chitinous polymerized lipoprotein layer, and the wax later presents consisting of closely packed molecules to prevent desiccation and the cement layer which forms the outermost layer protects the wax layer. The cuticle mainly constitutes chitin which is the main constituent of cuticle made of Nitrogenous polysaccharide and polymer of N-acetylglucosamine, which is insoluble in water but soluble in dilute acids, alkalis and organic solvents. The Arthropodin is an untanned cuticular protein soluble in water. Sclerotin is a tanned cuticular protein that is insoluble in water [19]. Figure 1 explains the presence of protein, chitin fibers and the overview of the bouligand structure. The Portunus sanguinolentus consist of bouligand structure which comprises chitin fibers that are covered with protein. Upon chemical treatment chitin gets converted to chitosan.
Shell structure of Portunus sanguinolentus and chitosan formation from chitin.
To remove protein and other ingredients, the following procedure was followed. In order to eliminate the fat content, sieved shell powders were treated with a solution of chloroform and methanol (ratio 2:1) at room temperature for 1 h. Followed by deproteination by immersing in 5 wt% of sodium hydroxide solution for 24 h and then decarbonization of the samples was done using 4 wt% of hydro chloric acid solution for 1 h. Deacetylation was done with 50% sodium hydroxide solution at 100℃ for 4 h to get chitosan-based shell powder. At last, filtration was done to remove the solution and dried at normal environmental conditions to get desired treated powder filler, the percentage of chemicals was considered as per the literature findings [20,21]. The photographic images of untreated Portunus sanguinolentus shell powder, Treated Portunus sanguinolentus shell powder and Biwoven Jute fiber mat (fabrics) are shown in Figure 2(a) to (c) and SEM image of treated Portunus sanguinolentus shell powder is shown in Figure 2(d). The alkali treatment breaks the chitin to form chitosan as shown in Figure 1. Figure 2(d) shows that the treated Portunus sanguinolentus shell powder which has a rough surface since it is treated with chemicals thereby removing protein and other organic matters from its surface.
Photographic images of (a) untreated Portunus sanguinolentus shell powder; (b) treated Portunus sanguinolentus shell powder; (c) Biwoven jute fiber mat; and (d) SEM image of treated Portunus sanguinolentus shell powder. SEM: scanning electron microscope.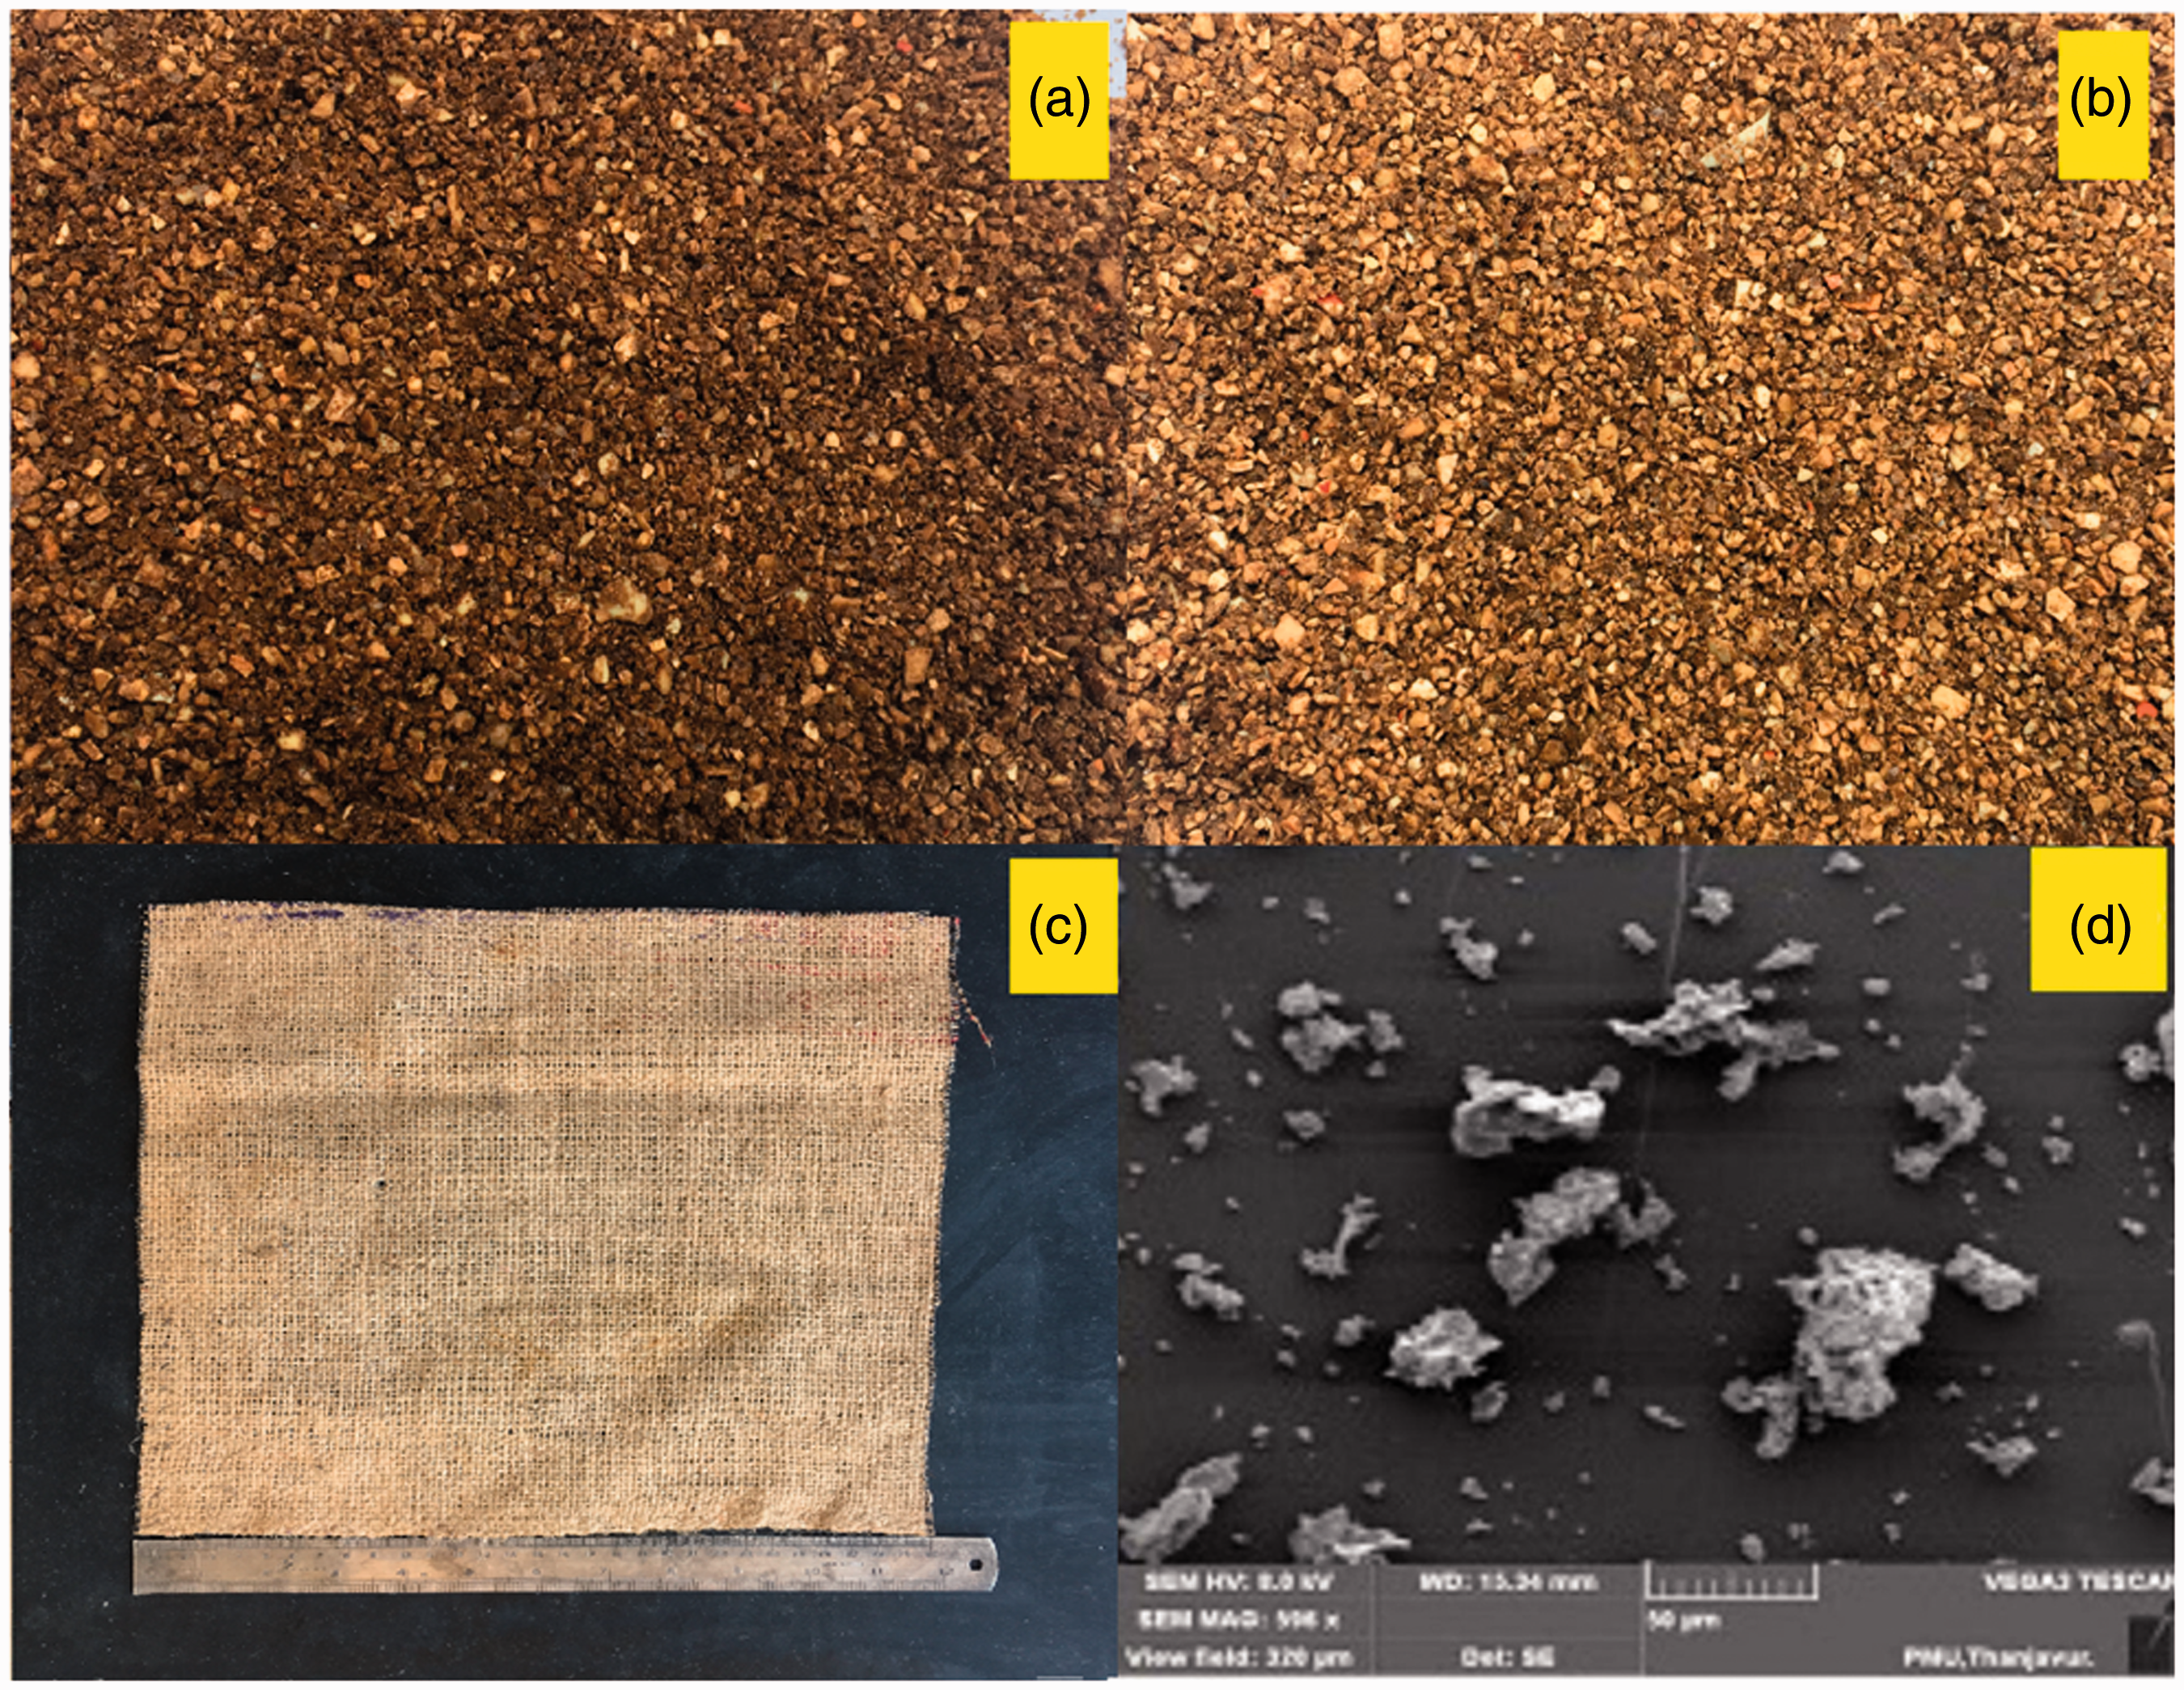
Manufacturing of composites
The overview of the manufacturing process of the developed laminates is given in Figure 3. A conventional hand layup method was used for fabricating the composite material in this present study. Jute fibers were purchased in the form of bi-woven mats and kept in a hot air oven for 1 h at 60℃ to remove the traces of moisture, though it was dried in the hot sun for 24 h. The flat and smooth surface of size 300 mm * 300 mm was considered and coated with a layer of wax, followed by wiping with a soft cloth. A layer of polyvinyl alcohol, a releasing agent, was applied for easy removal of the cured composites. Then, the coated surface was left in the hot sun for drying and setting. In order to make filler-based composites CF-2 and CF-3, 10 wt% of untreated and treated Portunus sanguinolentus shell powder fillers were mixed with 90 wt% of resin and hardener mixture. The fillers were added to the resin and mixed using mechanical stirrer until it gets dispersed properly. Then vacuum processes were used to remove the entrapped air. After that hardener was added and mixed manually. Again, vacuum processes were used to remove the entrapped air. Then a layer of resin-hardener and filler mixture was applied to the necessary dimensions, and a layer of bi-woven mat jute fiber was placed as shown in Figure 3(a), followed by a layer of resin hardener and filler mixture, over which a jute fiber mat was placed as shown in Figure 3(b). A coat of resin, hardener and filler was given with the roller, and again jute fiber mat layer positioned as seen in Figure 3(c). Finally, a layer of jute fiber mat was placed, and a final coat of resin-hardener and filler mixture was given as shown in Figure 3(d). Rollers were used to remove the air traps from the laminates during stacking. For proper distribution in the developed composites, a 25-kg per square feet of the load was applied in order to attain good distribution of matrix and better packing. It was kept untouched for 24 h in an ordinary environmental situation [15,16]. Care was taken to ensure that there were no air traps. In the case of CF-1 composite, 100 wt% of resin and hardener were used to develop the composite with the similar procedure stated above, and no filler was used. The designation and composition of the developed composites are given in Table 1.
Overview of the manufacturing of the composites. (a) First jute fabrics layer followed by application of Portunus sanguinolentus shell powder-based matrix mixture; (b) second jute fabrics layer after application of filler-matrix mixture; (c) stacking of third jute fabrics layer over the previous layer; and (d) fourth jute fabrics layer and finished composite. Designation and composition of the developed composites.

Characterization of manufactured composites
The experimental density (ρ
ex
) of the developed laminates was measured using a simple water immersion method. Distilled water was used for this test. Five measures were carried out for each sample, and average values were recorded [13]. To find out the theoretical density (ρ
th
), the following equation (1) is used

The fraction of void content (ν
c
) was determined from the theoretical and experimental densities of the composites using equation (2). Where ρth is the theoretical density and ρex is the experimental density

Weight, volume and densities of the materials used in developed composites.

Fourier transform infrared (FTIR) spectroscopy was used to find the functional groups present in the treated and untreated Portunus sanguinolentus shell powder and the constituent that corresponds to the functional group. The IR spectrum was recorded using Perkin Elmer/Spectrum 2 (Diamond UTAR). The spectrum was captured from 4000 cm–1 to 400 cm–1 with a resolution of 2 cm–1 signal-to-noise ratio at the rate of 32 scans per minute. In order to perform various mechanical tests, the developed laminates were cut using a saw cutter as per required dimensions. The mechanical properties were analysed for the laminated composite specimen according to the ASTM. Each test was performed at room temperature. The three specimens were tested, and consistent results were reported for each test. Tensile tests were conducted using the servo-hydraulic universal testing machine (Model No.: UTES-40, Make: Fuel Instruments & Engineers Pvt. Ltd.) with maximum capacity 400 kN according to the ASTM D 638-14 with a loading rate of 2 mm/min. The specimen was cut to the dog-bone-shape having dimensions 165 mm × 19 mm, and the mid-span length was 57 mm. The samples were held between grippers of the UTM, and the load was increased until a fracture occurred. Flexural tests were carried out according to the ASTM D790-10 using the universal testing machine with model and make as stated above with a loading rate of 2 mm/min. The dimensions of the specimen are 165 mm × 19 mm. Three-point bending mode was applied for measuring the ultimate flexural load and strength, with rollers of diameter 30 mm. The application of load was made until the fracture occurred. The compression tests were carried out according to the ASTM D695-15. The dimensions of the compression specimen are 55 mm × 55 mm. The compression tests were carried out in the universal testing machine at room temperature until a fracture occurred. The machine is fixed with a pair of compression plates, with diameter 120 mm for compressing the sample. The variations of stress with response to strain are obtained graphically for all the above tests. The double shear test was performed according to ASTM: D5379 in Universal Testing Machine. The dimensions of the specimen are 76 mm × 20 mm, with notch angles of 90° on either side held in a fixture, and load was applied till the material fracture. The energy absorbed was measured as per the ASTM D256-10 in a Charpy impact testing machine (Model No.: IT-30 (D) and Make: Fuel Instruments & Engineers Pvt. Ltd.) using a notched specimen. The dimensions of the impact specimen are 76 mm × 20 mm, with a notch angle 90°. Three specimens were prepared for each test, and the best value (consistent) was reported. The hardness was measured using Shore-D hardness tester (Model No.: Type D VT-10D) as per the ASTM: D2240-15e1, tester possessing an indenter 1.25-mm diameter with a conical point having 30° angle and radius tip 0.1 mm with 4.550 kg applied load. Five readings were taken down for each specimen, and the average was noted. TGA (Model: TGA4000; Make: PerkinElmer) was used for finding the thermal stability in a nitrogen environment using 5 mg of sample weight with temperature ranging from normal room temperature to 800℃ with 10℃/min heating rate with the gas flow of 20 mL/min. The crucible used was made of ceramic. The fractured interface (specimen) was cut into 15 mm × 15 mm using a diamond cutter, sputtered with conducting material (gold) and then analyzed in SEM of Tescan VEGA 3LMU, the Czech Republic, to study the various morphologies of the tested specimen. The tensile, flexural, impact and compression tested samples are shown in Figure 4(a) to (e).
Tested specimens of developed composites: (a) tensile; (b) flexural; (c) impact; (d) compression; and (e) shear.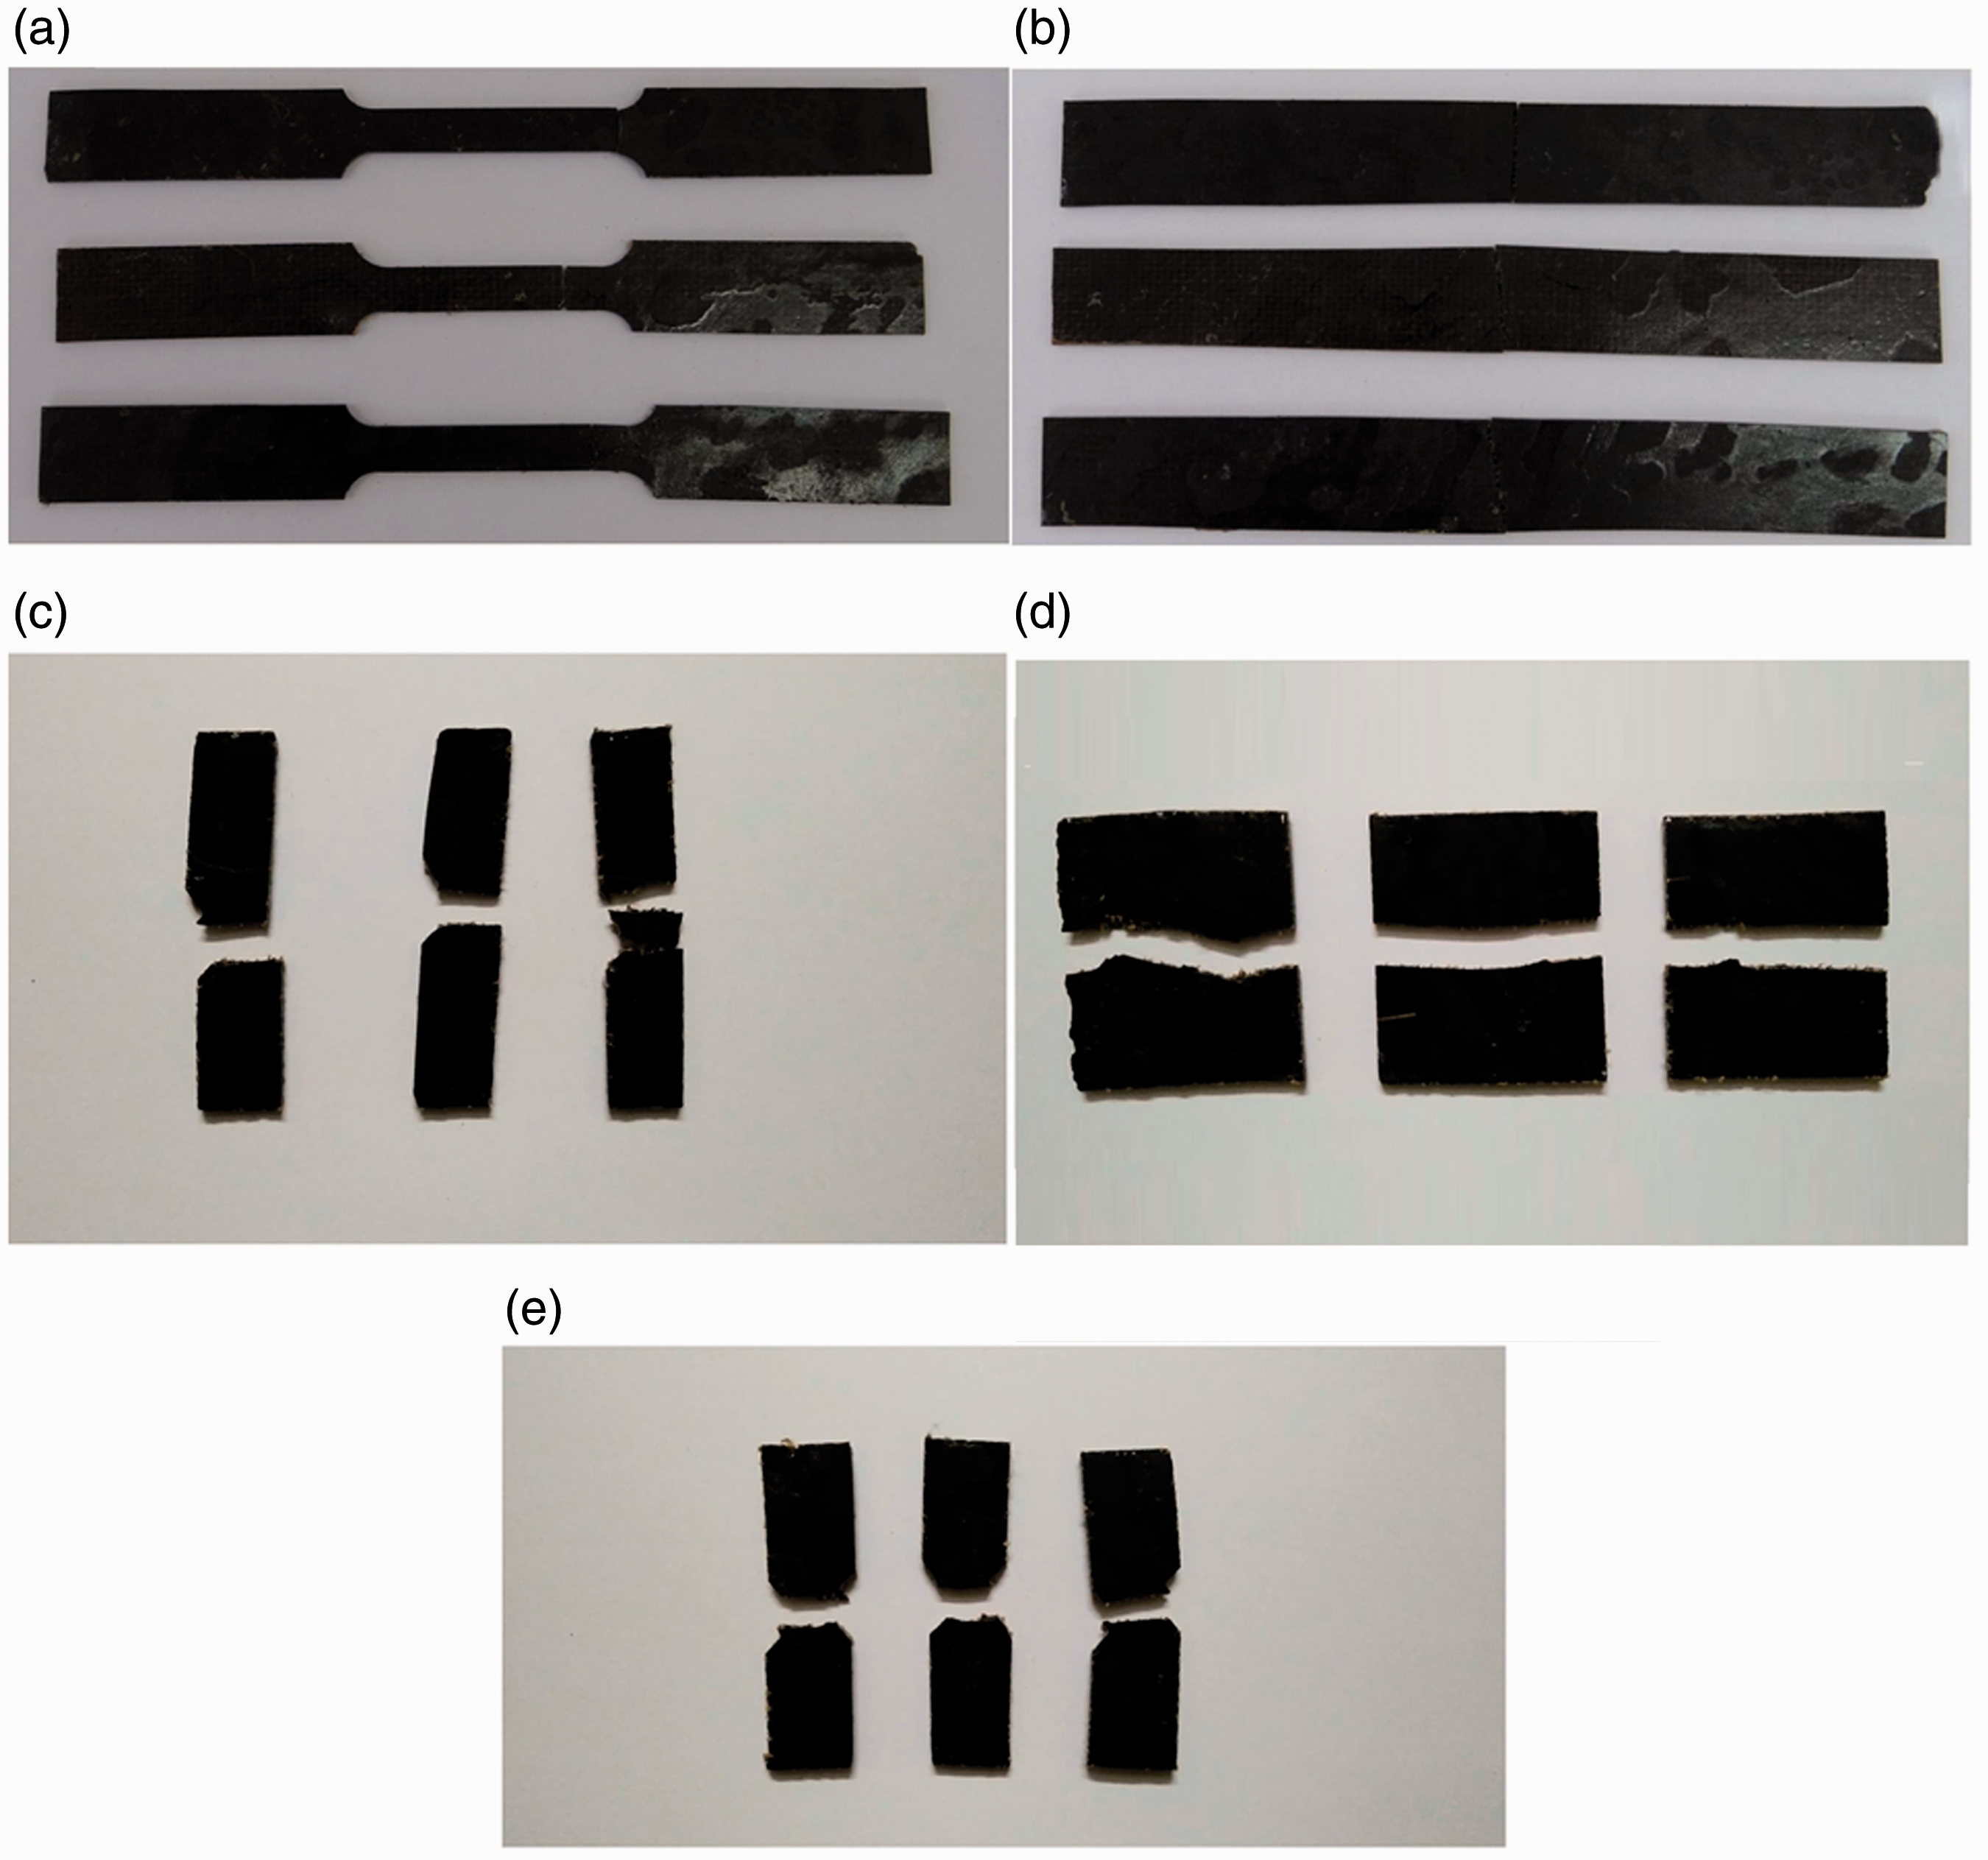
The complete methodology involved in this work is given in the form of the flow chart in Figure 5.
Work methodology flow chart.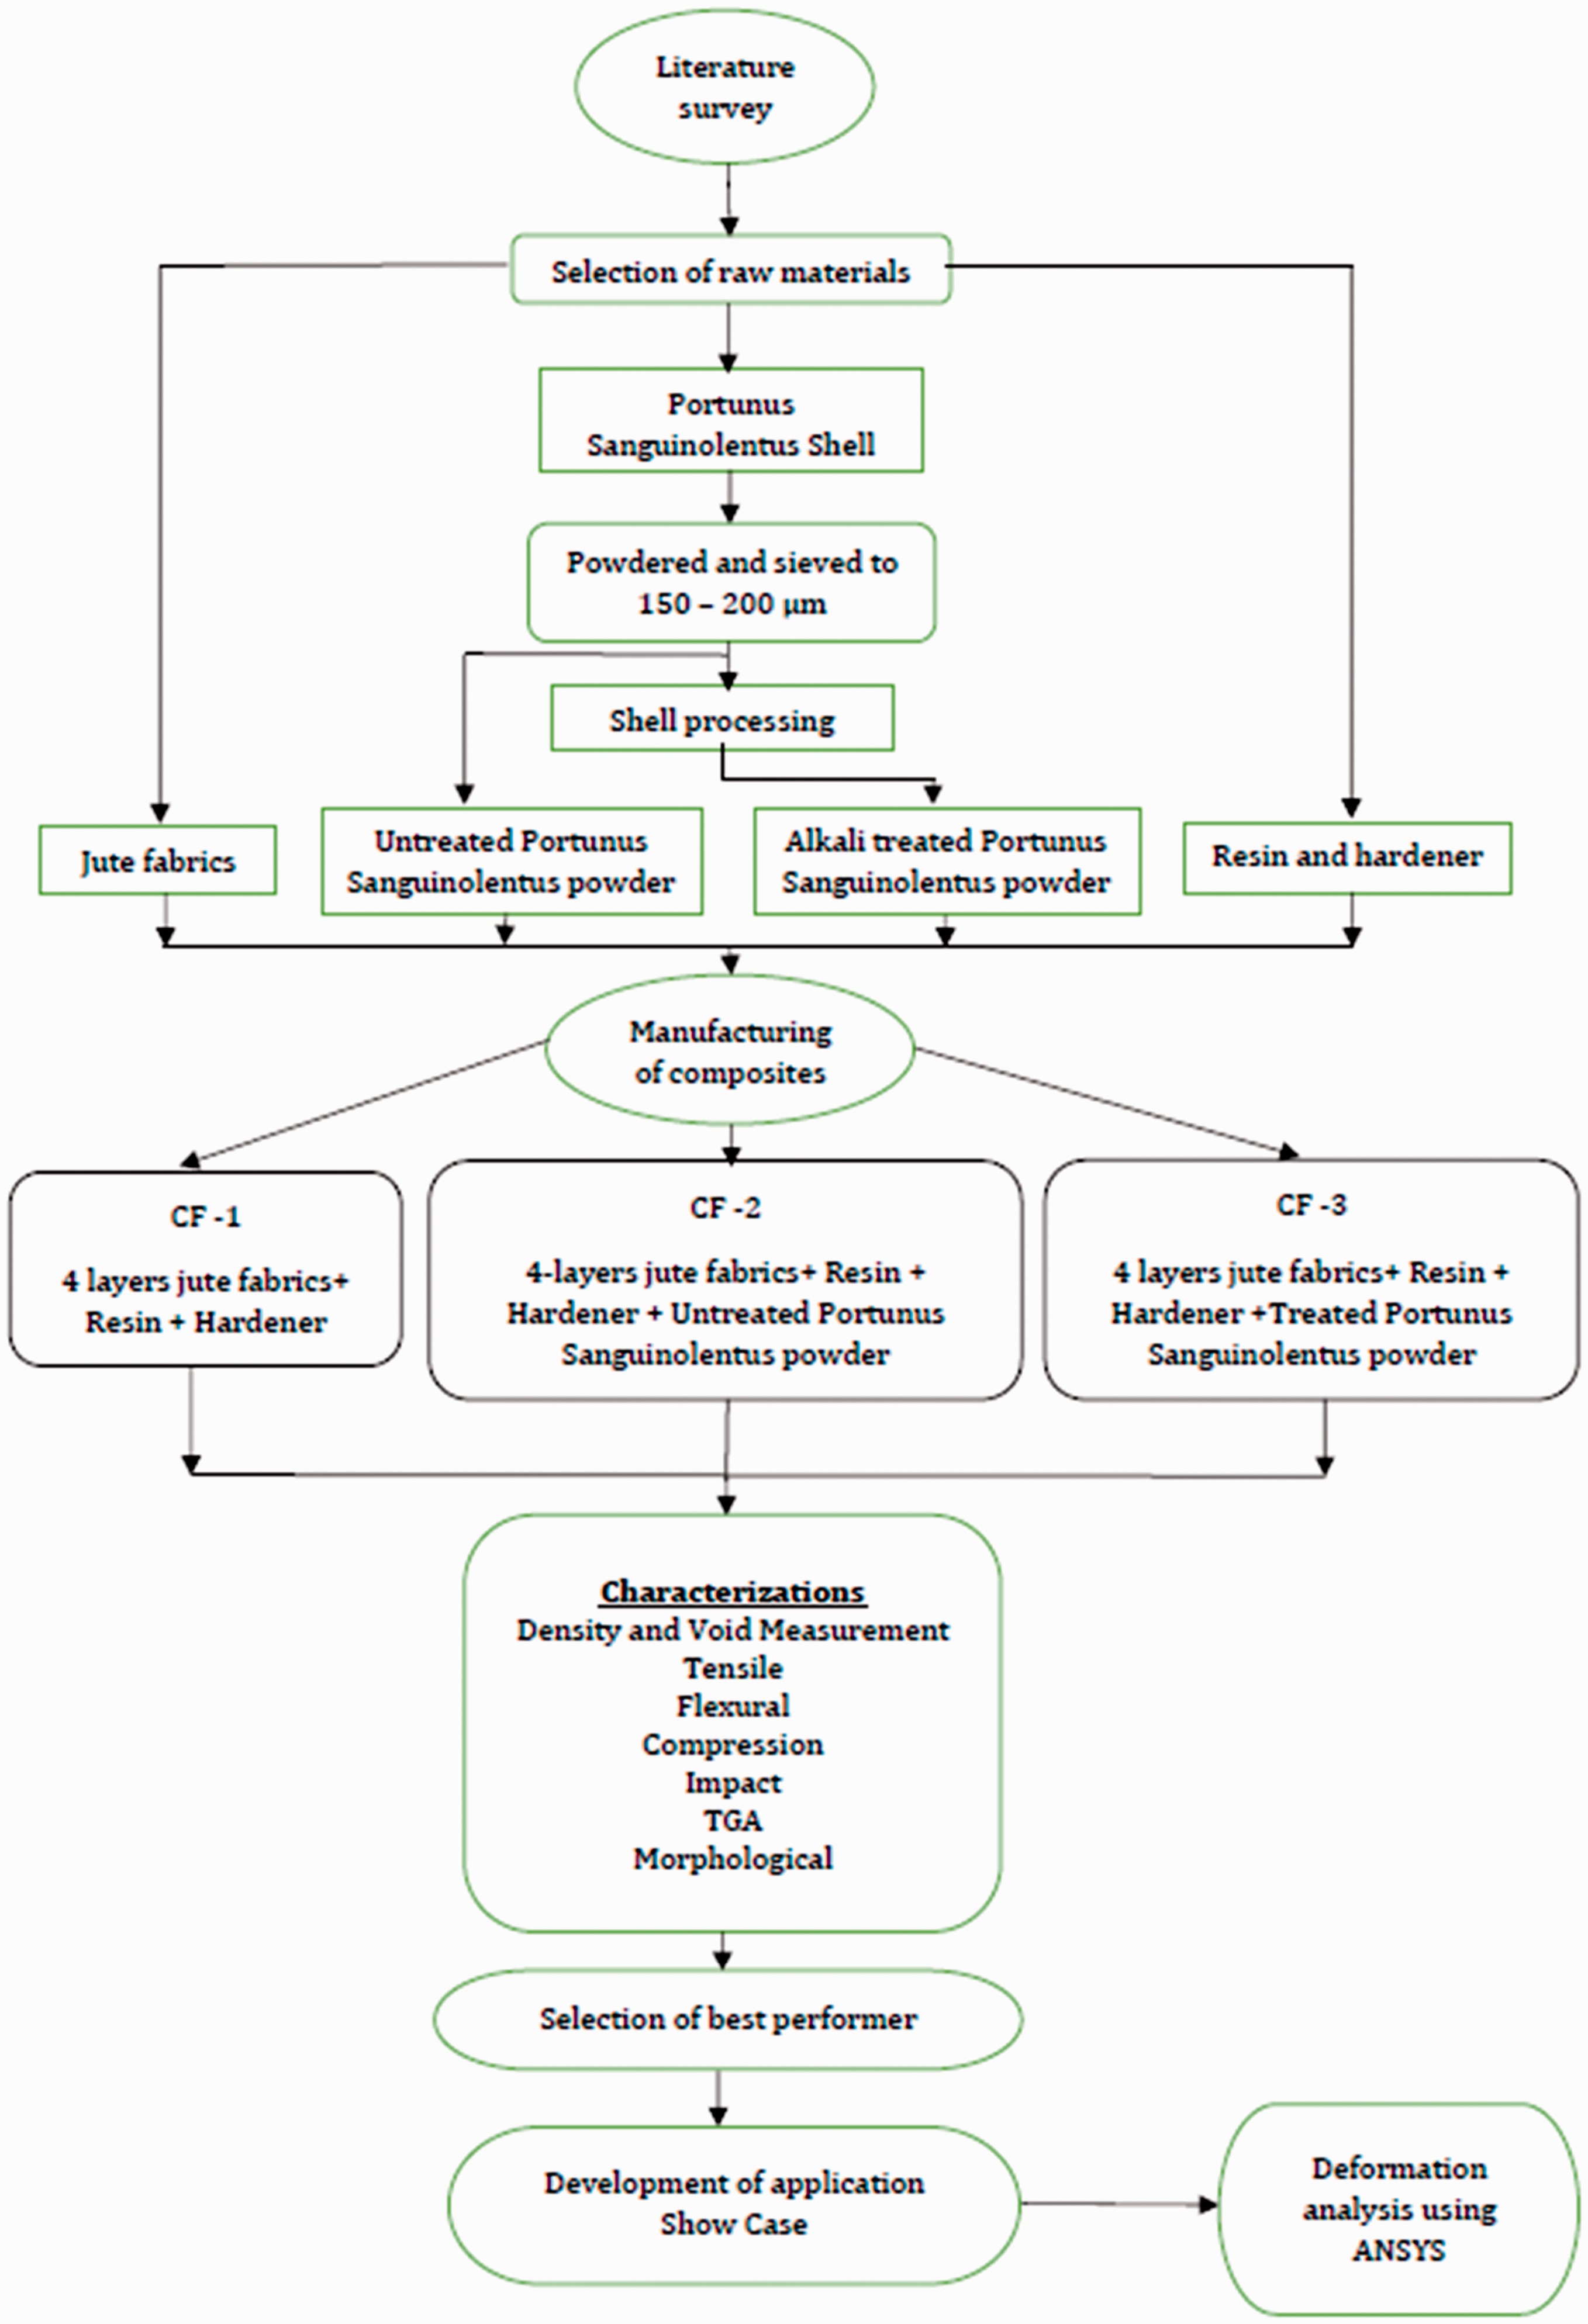
Results and discussions
The characterizations of the fillers and the developed composites are discussed in the forthcoming sections.
FTIR analysis of treated and untreated Portunus sanguinolentus shell powder
The FTIR spectrograms of the untreated and treated Portunus sanguinolentus shell powder are given in Figure 6. From the spectrograms, the first small ‘U’ bend at 3253 cm–1 and 3248 cm–1 denotes the regions of OH and NH, which attributes the presence of α-Chitin for the untreated and treated Portunus sanguinolentus shell powder [22]. The second intensity peak is observed at 2882 cm–1 for the untreated Portunus sanguinolentus shell powder, it is caused by the C-H stretching and vibration from CH, and CH2 attributes the presence of chitin biopolymer. The treated Portunus sanguinolentus shell powder does not show the peak at this range because the alkali treatment removes the excess amount of chitin present in it [23]. The next corresponding peaks at 1645 cm–1 and 1629 cm–1 represents the presence of amide groups of chitin polysaccharides [24]. The next intensity peaks at 1399 cm–1 and 1397 cm–1 corresponds to the asymmetric stretching and vibrations of C = O, which attributes to the presence of CaCO3 [21,25]. A strong asymmetric stretching of C-N-C is observed at the regions of 1014 cm–1 and 1029 cm–1 [25]. The last intensity peaks at 873 cm–1 and 860 cm–1, respectively, for untreated and treated Portunus sanguinolentus shell powder denote the out-of-plane bending of CO32–, which attributes to the presence of calcite [23].
FTIR spectrograms of untreated and treated Portunus sanguinolentus shell powder. FTIR: Fourier-transform infrared spectroscopy.
Density and void characteristics of the developed composites
Theoretical, experimental densities and void content of the developed composites.

Tensile properties of the developed composites
The tensile strength of the composites mainly depends on the fiber and filler-matrix interaction. The composite CF-3 showed higher ultimate tensile strength followed by CF-2 then by CF-1 as shown in Figure 7. The higher tensile strength values are mainly due to the following reasons. Crab shell will have a protein layer in the chitin structure which hinders the matrix-filler interaction as stated in the literature. Upon the chemical treatment of deproteination, these proteins that act as polymer matrix get removed and, thus, the adhesion level of the resin increases. This is in good agreement with the literature findings that treated crab shell filler could be used for Ni- Phosphorus coating due to its better adhesion properties [26]. The translucent layer of chitin was present beneath the protein layer. The layer of protein polymer is confirmed from the studies done [27]. Upon all treatments, the protein layer gets removed, when the chitin was impinged into the resin and coated on an acrylic sheet. The sheet became transparent, produced better results and, thus, this material could be a breakthrough to meet out various optical transparent applications with good thermal expansion/degradation resistance of the polymer. The stability at high temperatures is shown in the TGA of Figure 17. In the forthcoming sections, the literature states that moisture and protein play an important role in the strength of the crab shell [28], but this postulate will not match with the current study because the literature study was preformed for the bare crab shell-based composite without reinforcement in the matrix. However, the present investigation deals with the incorporation of fillers in the matrix. Thus, protein removal becomes mandatory to enhance improved properties. The structure of chitin with protein is given in Figure 1; which confirms that protein is present along with the chitin fibers in the bouligand structure.
Ultimate tensile strength of the developed composites.
The chemical treatment also enhances the surface roughness leading to more wetting of the resin with fillers by forming interlocks that prevent the composite from failing drastically. The surface roughness of untreated Portunus sanguinolentus shell powders is 0.61 µm, while the treated Portunus sanguinolentus shell powder showed 0.95 µm. Poor wetting of fibers by polymer results in materials with defects such as voids and fiber agglomerates, which promotes premature failure. Usually, fiber reinforced composite depends considerably on the fiber-matrix interface because only a well-formed interface allows stress transfer from the matrix to the fiber. Thus, the presence of firm bonding of chemical-treated Portunus sanguinolentus fillers with matrix along the crack growth region arrests the crack from propagating drastically. This prevents ductility failure, thereby leading to the brittle failure, which is confirmed from the percentage strain of the stress–strain graph (Figure 8). The reason behind the increase in strength is mainly the chitosan formation from chitin upon chemical treatment as shown in Figure 1, which creates a permeable surface with high strength leading to high wetting of resin [29]. The CF-2 composites were second in quantity when compared to CF-1 as shown in Figure 7. This was mainly due to the presence of fillers which got distributed uniformly instead of getting agglomerated in the matrix, but the adhesion level was a little lower as compared to CF-3, but higher than that of CF-1. The tensile modulus of the CF-2 and CF-3 is found to be 358.33 MPa and 550 MPa, respectively, the increase in the tensile modulus in CF-3 is because the alkali treatment has increased the surface roughness of the fillers, thus enhancing the bonding between the fiber filler and matrix. The presence of fillers always enhance better results, and this was in accordance with the literature [30].
Tensile stress–strain graphs of the developed composites.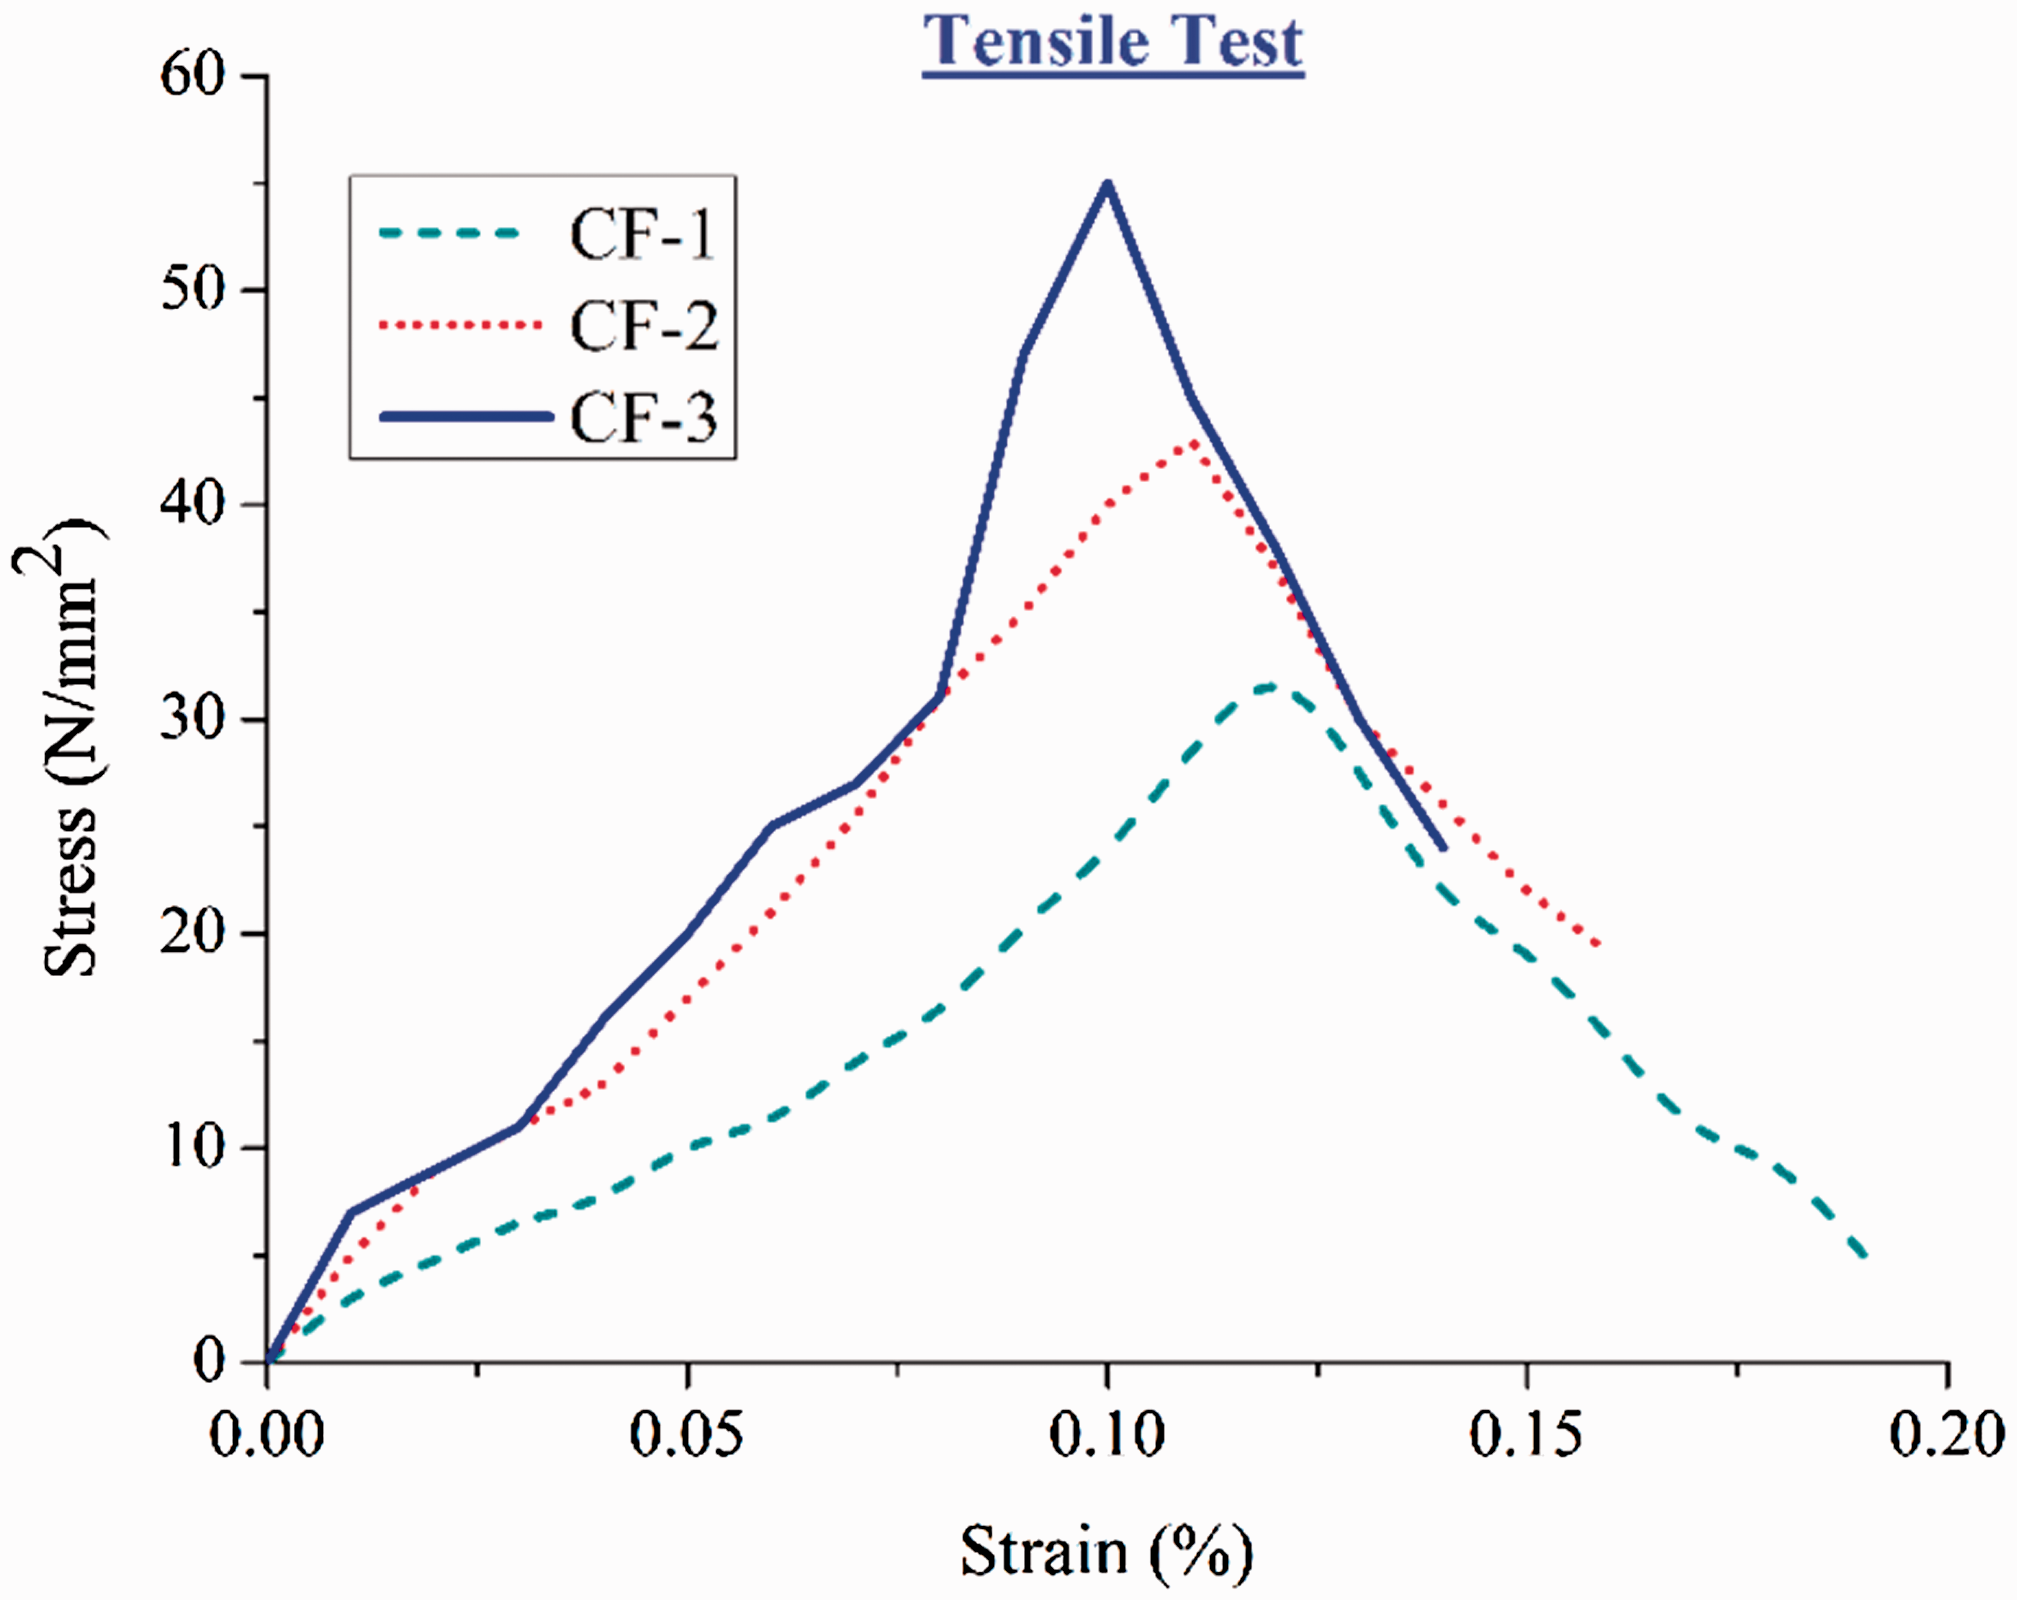
A similar trend was also seen in the Argan nut shell particles reinforced polyethylene composites, where the chemical-treated nut shell-filled composites showed better results when compared to unfilled and untreated one [31]. It was also found that, if the percentage of filler exceeds the certain optimal limit (preferably in the range of 10–15%), then there exists a reduction in the strength values. The increased stiffness shows the effect of matrix mobility reduction due to the presence of fillers, which hinders the crack growth. The stress–strain curve of Figure 8 shows non-linearity due to randomly oriented fibers, as well as the breakage of salt regions of crab shell fillers present in the matrix of CF-2 and CF-3, which is in accordance with the literature [32]. The ultimate tensile strength of CF-3 is 55 MPa, which is 1.3 times higher than CF-2 (43 MPa) and 1.75 times higher than CF-1 (31.5 MPa) as shown in Figure 7. The ultimate tensile strength of CF-3 composite is also 1.12 times higher than 10 wt% Calotropis gigantea stem powder-filled jute fiber reinforced epoxy composites (48.73 MPa) [16] and 1.6 times higher than granite powder-filled treated jute fiber reinforced epoxy composite (33.13 ± 1.15 MPa) [17]. But this value is lesser than tungsten carbide-filled jute/sisal/glass-based epoxy and natural rubber composites since glass fiber is used as the stack layer in the composite [13]. The poor results of CF-1 are due to the voids caused by poor wetting characteristics leading to poor fiber-matrix interactions, though care was taken to remove air bubbles. This was overcome by CF-3 followed by CF-2 due to the presence of fillers, which filled the voids. The other reason for the poor results in CF-1 is the improper fiber-matrix interactions, which was caused due to the poor bonding nature of the jute fibers with the matrix, though other two composites consisted of jute fibers, the fillers present prevented the composite from early breakage. The reduction in the strength of CF-1 composites is mainly due to the presence of more voids, fiber agglomeration, fiber bending, fiber knitting, fiber tear and also lagoon of fibers. Thus, the CF-3 composites could be a positive solution for high-strength, lightweight applications.
Flexural properties of the developed composites
The CF-3 composites showed higher ultimate flexural strength values (5.45 MPa), which were 1.29 times better than CF-2 (4.2 MPa) and 1.37 times than CF-1 (3.95 MPa) as shown in Figure 9. These values are higher than Azadirachta indica seed/spent Camellia sinensis bio-filler-based jute fabrics-epoxy composites (5.4 MPa and 3.15 MPa) [15]. The increased ultimate flexural strength values are mainly due to the following reasons. The degree of mechanical strength of the composites is mainly dependent on the reinforcing filler and the strong adhesion between the matrix and filler. In the current study, the chemical-treated Portunus sanguinolentus fillers have firm adhesion with the matrix, which had already been described in the previous sections. The interlocks formed with the matrix prevented the low strength failure of the composite. The ultimate flexural strength is also dependent on the nature of failure based on the strain as shown in Figure 10. CF-3 resulted with high ultimate flexural strength and low strain rate when compared to other flexural tested composites; this showed the difference in the current value. There are more undulations seen in the stress–strain graph, as shown in Figure 10, in case of CF-3 and CF-2 due to the presence of Portunus sanguinolentus shell fillers along the path of the failure, and another reason was salt region breakage as explained in the previous section. The literature findings also state that brittle fracture occurs due to the inorganic phase at low strain, which leads the chitin phase to bear the load and a steep failure occurs in the composite [32]. The dispersion of fillers in the matrix preventing agglomeration is the prime cause for enhancing the strength; these findings are in accordance with the literature [33,34].
Ultimate flexural strength of the developed composites. Flexural stress–strain graphs of the developed composites.

In the case of CF-3 composite, the cracking of the matrix was caused due to the stress induced during the flexural testing. The SEM image shows that the fillers are more uniform in size, which leads to better strength, which is in accordance with the literature [35]. Interesting fact about the CF-3 composite is that the presence of a hydroxyl group on the surface of the filler forms a good bond with the matrix as stated in the literature [36]. This, in turn, increases the wetting and adhesion of the filler with the matrix, i.e. there is an increase in the cross linking, leading to the deflection of cracks in the composites, and also the pinning of cracks takes place due to the treated fillers present along the path of the crack. Another interesting mechanism involved in CF-3 composites is the percolation mechanism in which the chitosan filler makes the resin matrix to enter into its structure wall, leading to the very firm bonding with the matrix [37]. The ultimate flexural strength of the CF-1 is low when compared to other two composites due to the presence of a void, which makes the fibers to easily get pullout (debonding), fiber bending, matrix crack, straining of the matrix, leading to the poor results. If the fiber-matrix adhesion is poor due to improper wetting, there will be more crack formation paths, and an absence of fillers does not obstruct the same. The flexural modulus of the CF-2 and CF-3 are 100 MPa and 120.92 MPa, respectively. The increase in the flexural modulus in CF-3 is because the alkali treatment has increased the surface roughness of the fillers, thus enhancing the bonding between the fiber filler and matrix. The optimal percentage of chemical treatment nature also plays a significant role in the strength of the composites. In the present study, 5% of sodium hydroxide was used for removing proteins from its surface, which also played a crucial role in strength, since, the alkali solution is in optimal percentage for removal of organic contents and made uniform. If there were more alkali concentration in the solution, then there could be a reduction in the strength of chitosan fibers, which will increase the porous nature of the chitosan leading to the reduced flexural properties, which is in accordance with the literature [38].
Compression properties of the developed composites
In the present work, CF-3 composites showed higher ultimate compressive strength (93 MPa), which is 2.1 times for CF-2 composite (42.5 MPa) and 4.89 times for CF-1 composite (19 MPa) as shown in Figure 11. These values are higher than Azadirachta indica seed/spent Camellia sinensis bio-filler-based jute fabrics-epoxy composites (53 MPa and 33.5 MPa) [15]. The treated Portunus sanguinolentus shell fillers showed better bonding with the matrix due to the rough surface caused due to the chemical treatment leading to the formation of chitosan from chitin and also the hydroxyl group present in the filler will adhere to the matrix leading to higher strength. It is proved in the literature that chemical treatment led to the interfacial bonding with the matrix, thus, leading to better dispersion [39].
Ultimate compressive strength of the developed composites. Compression stress–strain graphs of the developed composites.
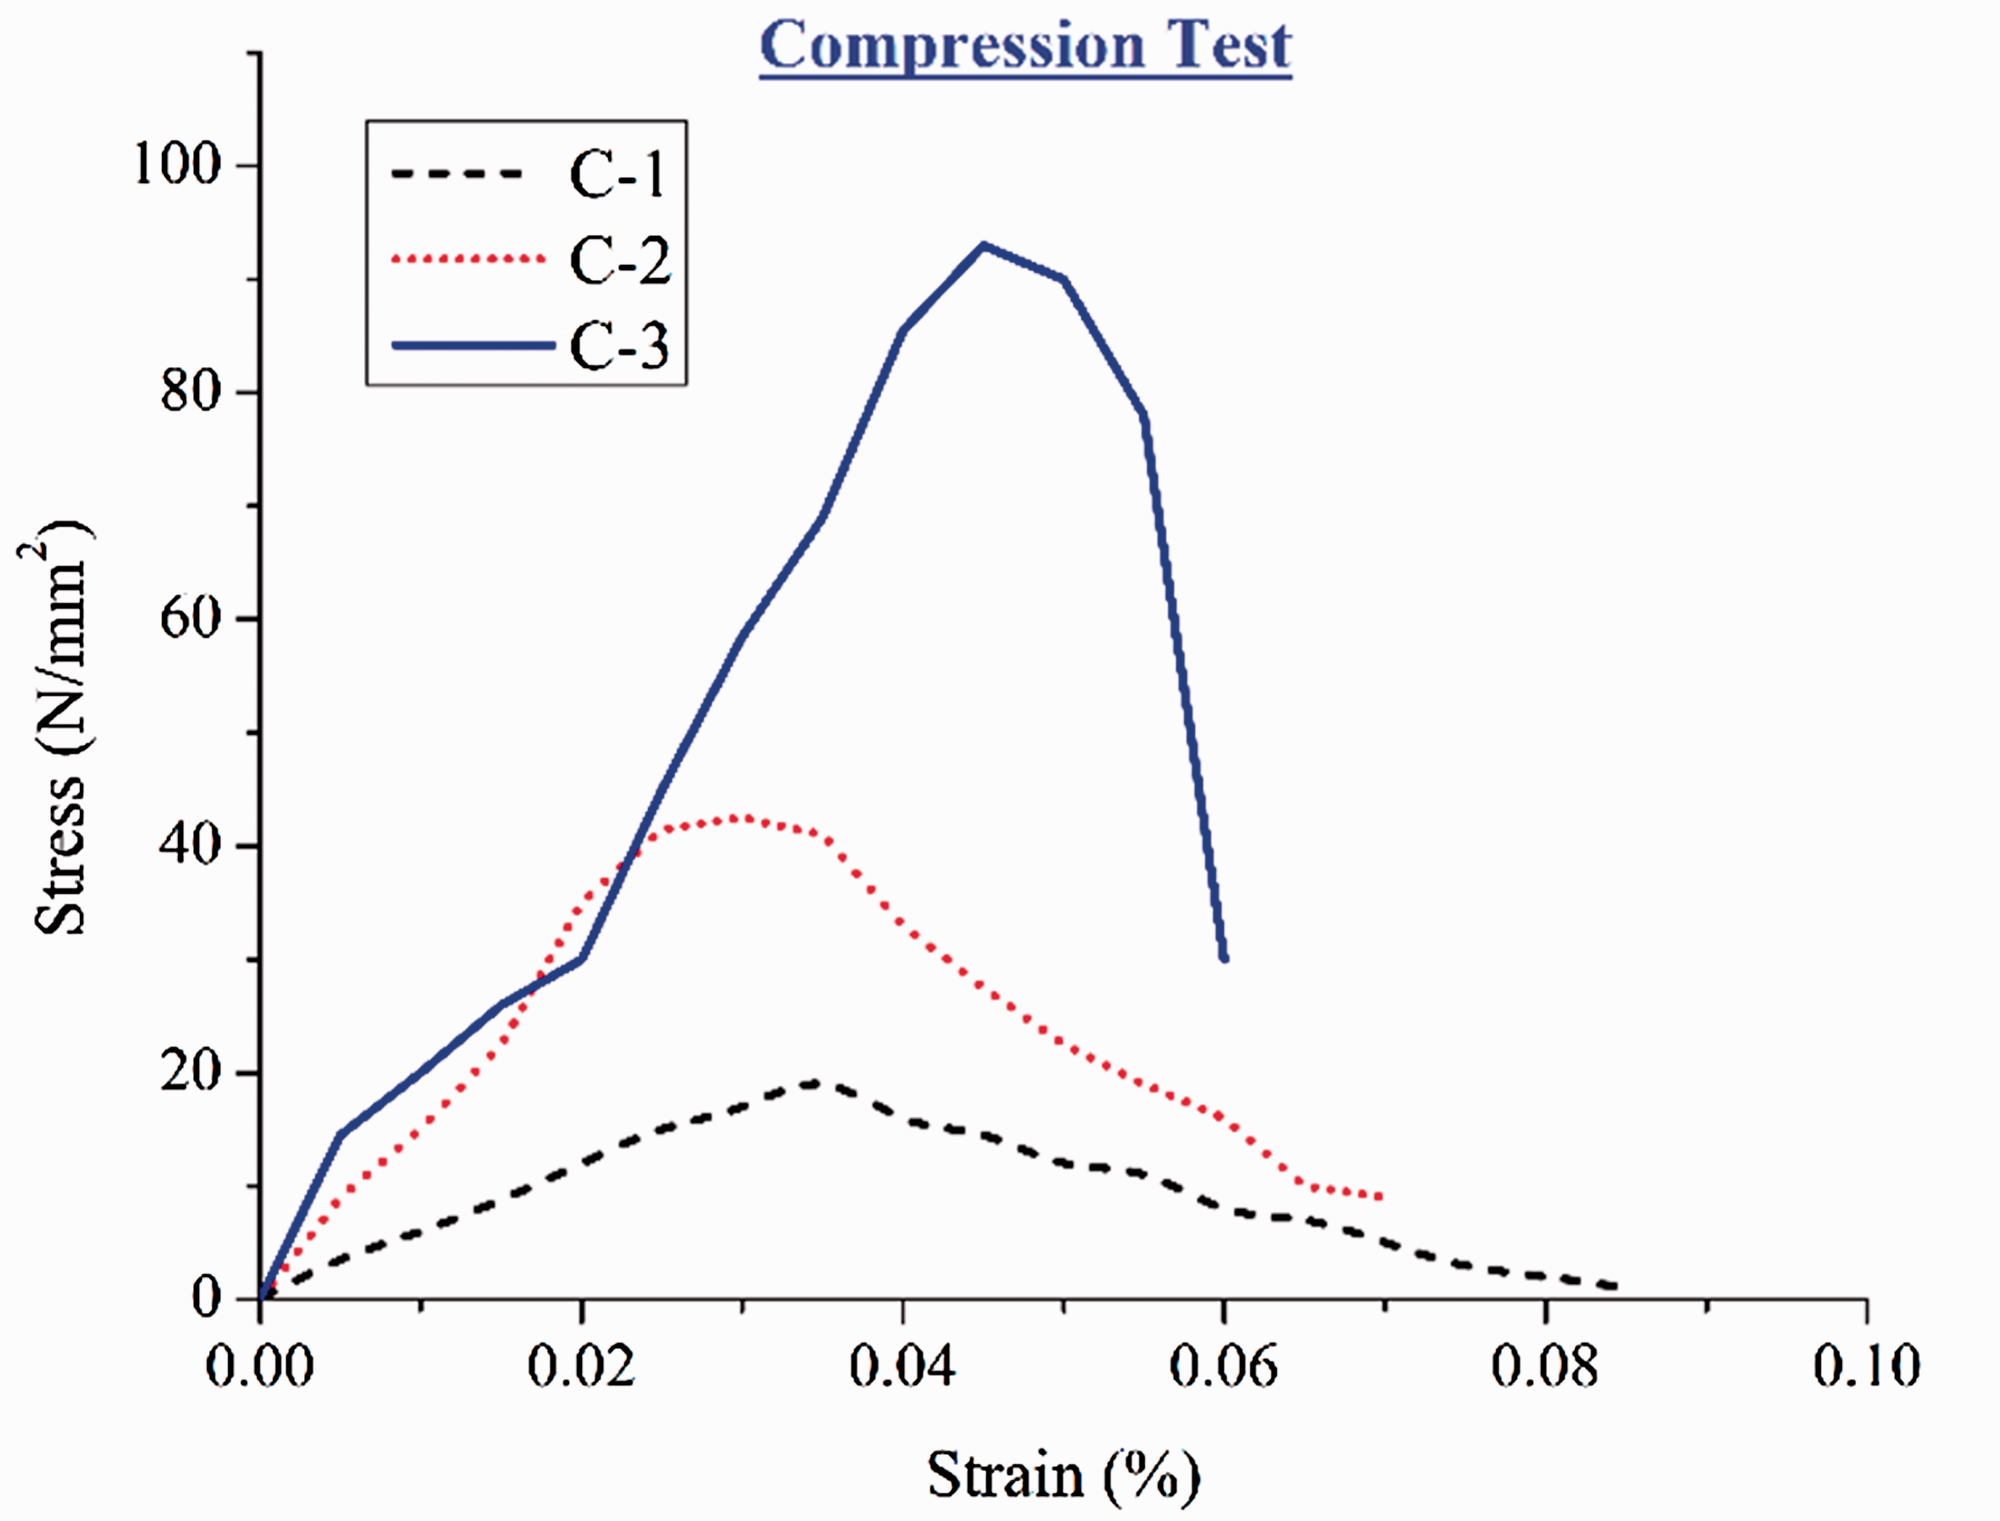
Generally, the treated filler-matrix showed better results as compared to untreated and unfilled composites, which are in accordance with the literature [40]. The typical stress–strain curves for the brittle and ductile natures for uni-axial compression testing are illustrated in the literature [41]. In the present study, graph of Figure 11 comes under the category of brittle failure since it shows the shape of the hemisphere which is also non-linear. In Figure 12, the stress–strain graph shows such shape due to the presence of fillers, which come along the crack path preventing the crack at the early stage; this happens in the CF-3, so it produced higher ultimate compressive strength. Generally, the brittle nature will have less strain when compared to the other. Similarly, CF-3 also showed less strain rate, which was due to the presence of treated Portunus sanguinolentus shell powders in the matrix preventing the mobility of the resin, due to the better wetting nature of the resin with the filler, this is in accordance with the literature [42]. It is also said in the literature that modified shell waste or treated shell powder can enhance the mechanical behavior of the composites [43]. CF-1 showed poor ultimate compressive strength results due to its large size of voids with more fiber tear, which shows the improper wetting of the fiber in the matrix; even the voids present played a vital role in the deterioration of the properties.
Shear properties of the developed composites
From Figure 13, it is very clear that the laminated composite CF-3 possess the highest ultimate shear strength of 30.15 N/mm2 when compared to the other laminated composites. The stress–strain graphs for the shear tested composites are shown in Figure 14, in which the CF-03 composites showed the higher value of strength with good strain while the CF-2 and CF-1 showed inferior strength as well as the strain rates. The improvement in the ultimate shear strength is due to the presence of treated Portunus sanguinolentus shell powders, which possess good bonding with the matrix. The ultimate shear strength of CF-3 is 3.72 times higher than CF-1 and 1.65 times higher than CF-2. The similar type of results is reported in the literature [44].
Ultimate shear strength of the composites. Shear stress–strain graphs of the composites.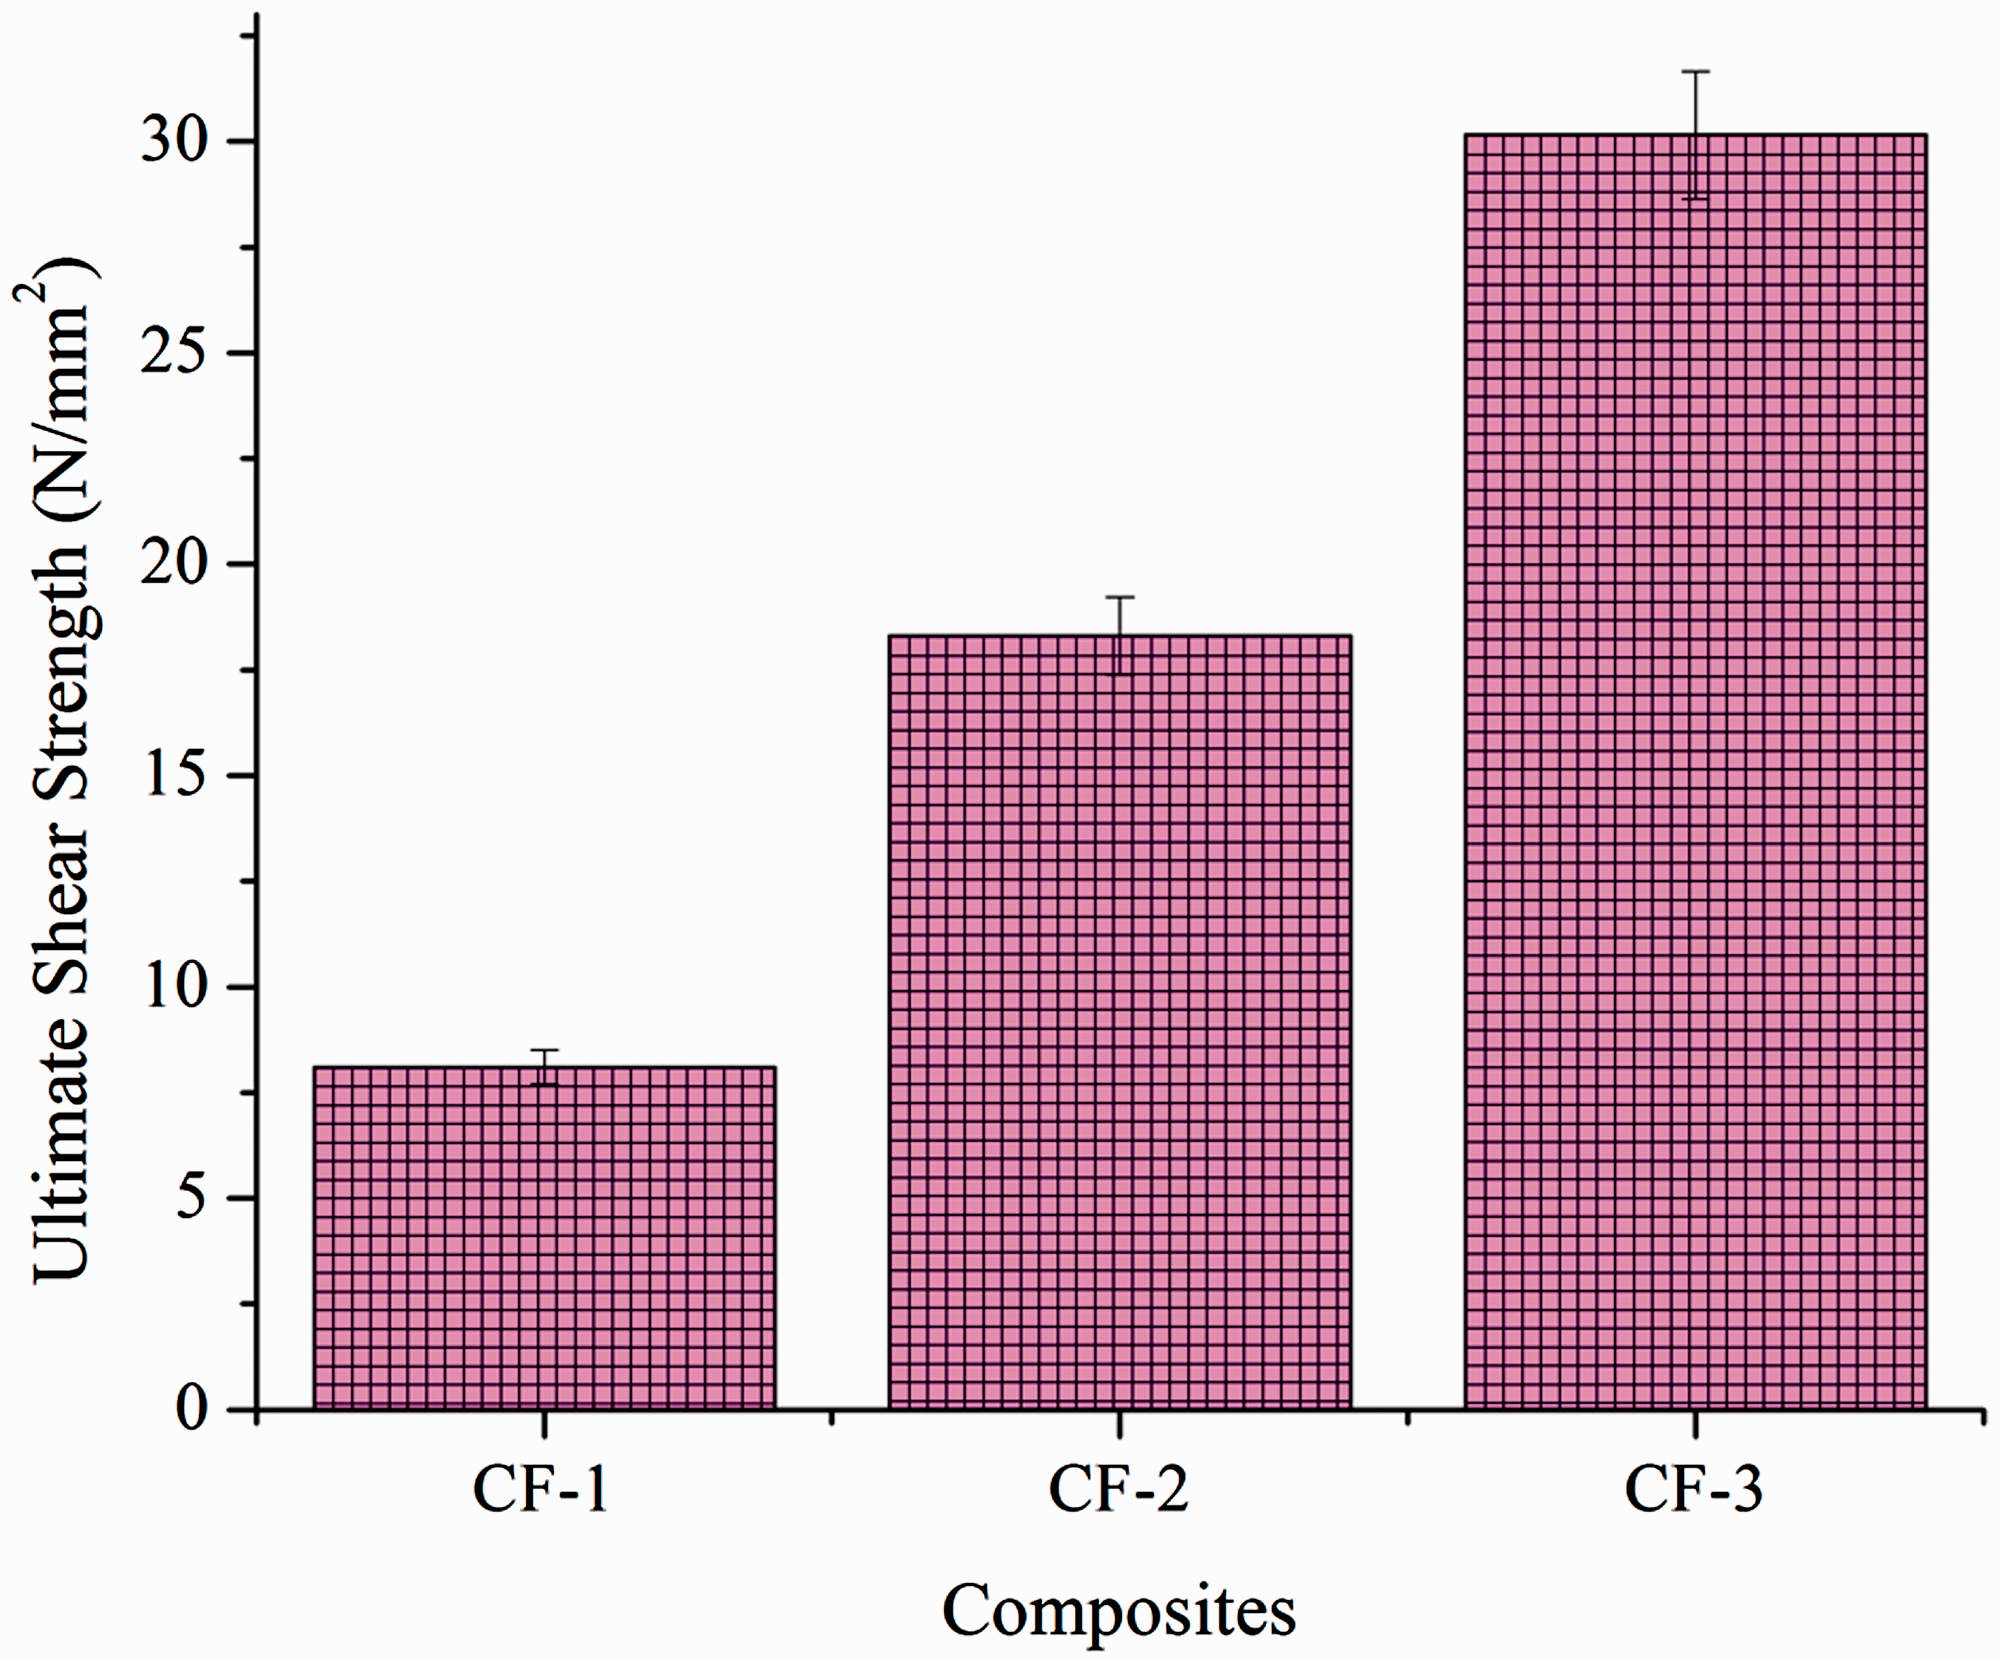

Impact and hardness of the developed composites
Impact strength refers to the toughness of the material, i.e. the ability of the material to absorb energy. The highly stiff material could not absorb the more amount of energy during the failure, only ductile material can withstand high impact load. But the current study shows the results against the above concept, in which CF-3 (6.21 J) showed 1.08 times higher strength than CF-2 (5.75 J) and 1.31 times higher than CF-1 (4.76 J) composites as shown in Figure 15. These values are higher than tungsten carbide-filled jute/sisal/glass-based epoxy and natural rubber composites (4.10 J). This trend was in accordance with the literature findings [45]. Similarly, in the literature snail shell-filled composites showed better trend till 30 volume percentage and the reason for it was the mineral contents present in it enhanced the same [46].
Energy absorbed during impact conditions in the developed composites.
In the current study, Portunus sanguinolentus shell powders are rich in calcium carbonate without protein content (viscous layer on the surface of the shell) which interacts with the strong fiber-matrix interfacial strength and energy dissipation by fiber pull-out is very limited owing to the presence of fillers, which enhance the energy-absorbing nature during impact, to a considerable extent. It is also noteworthy that impact strength is dependent on the particle size, shape and distribution of the fillers, in the case of CF-3 composites, where the particles are rough enough and adhere to the matrix firmly.
Hardness is defined as the resistance to indentation of the indenter in any material being tested. The composite CF-3 showed good results of hardness with the highest value of 67, while the CF-2 showed the second highest value of 61 and the third i.e. least value by CF-1 composites by 57 as shown in Figure 16. The enhanced results of CF-3 composites are mainly due to the presence of treated shell powders, which got mixed evenly with resin and filled the voids as explained in the previous sections and Table 3. In the case of CF-2 though the untreated shell powder filled the voids, it does not adhere well to the matrix due to the presence of protein content in it. The CF-1 composites possess more voids, and it is unfilled, so the value is purely dependent on the fiber and the resin in this case. In general, it is very clear that the highly stiff composite will always have more hardness, which is in accordance with the literature work on wood flour as a filler in the composite [47]. These values are also higher than Azadirachta indica seed/spent Camellia sinensis bio-filler-based jute fabrics-epoxy composites [15].
Hardness of the developed composites.
Thermal stability of the fillers and developed composites
The thermal stability of the developed composites and raw fillers are found out using TGA, and the graph is shown in Figure 17. The parameters like onset, end set, decomposition temperatures and residue percentages are found out and reported. The treated Portunus sanguinolentus shell powder possesses three stages. The first stage is in the range of 100–230℃, where there is the degradation of moisture and low, stable constituents, followed by the second stage, i.e. decomposition of chitosan, which was formed due to the chemical treatment of chitin in the range of 230 to 425℃. Then, the third stage where the decomposition of the mineral constituent calcium carbonate is in the range of 430 to 650℃ [48]. The char residue percentage was 44%, which was mainly due to the calcium oxide and some other mineral constituents in it; and this is in accordance with the literature [25]. The third stage undergoes the steps of degradation namely the calcium carbonate degradation by liberating carbon dioxide and retaining calcium oxide. This stage is also the phase transformation stage where calcite crystals are formed from the aragonite. The highest residue is mainly due to the presence of the high content of calcium oxide with some traces of mineral contents. The presence of residue also confirms that evaporation of the substances takes place with the decomposition of the constituents; which is in good agreement with the literature [49,50]. The untreated Portunus sanguinolentus shell powder was subjected to TGA. The degradation followed the same three stages in which 90–200℃, in which the moisture, water content present in the cuticle layer and the protein degradation took place, since this untreated one has more protein layer as explained in the previous section i.e. Figure 1. Then the degradation undergoes the next stage of 213 to 415℃, where the chitin present with the traces of protein present in the structure will undergo degradation. Then the third stage is the decomposition of mineral ingredients namely, calcium carbonate, which decomposes in the temperature range of 423 to 645℃. The maximum degradation occurs at 597℃, which was mainly due to the decomposition of calcium carbonate to form calcium oxide liberating carbon dioxide. The residue char left behind after the testing was 33%, there was more reduction in the char percentage when compared to the treated filler, mainly due to the protein, water molecules and wax layer present in it, that is in accordance with the literature [19].
The composite CF-1, which is made of jute fibers without the presence of fillers undergoes degradation in three stages. Again in the first stage the degradation of moisture, lignin, proteins of jute fibers and matrix degradation till 200℃, while the degradation of hemicelluloses undergoes in the range of 300℃, while the maximum degradation of cellulose occurs during the temperature of 360℃, which is in accordance with the literature [51]. The end of degradation occurs at 490℃. Then the degradation continues due to the presence of some inorganic minerals present in the composite. The char residue present after the testing is 22%. In the case of CF-2 composite, the degradation followed the similar trend of CF-1, but the fillers present in the matrix came into existence during the testing leading to the changes in the residue char percentage to 28 due to its inorganic mineral constituents as explained in the previous sections. The maximum degradation occurred at 412℃ and the onset and offset temperatures were 200℃ and 560℃. In the case of CF-3, which was filled with treated Portunus sanguinolentus shell powder showed a better trend when compared to others in which the onset and offset temperatures got shifted to 226 and 640℃, with maximum degradation temperature occurring at 495℃, which was due to the decomposition of calcium carbonate. The char residue percentage of CF-3 composite was 35%, which is closely associated with the raw filler percentage, though there may be a deviation in the percentage due to the bare and resin-filled powders. It is stated in the literature that material which is having more molecular weight will undergo less degradation when compared to the less molecular weight. The presence of Portunus sanguinolentus shell powder in the CF-2 and CF-3 composites followed the same trend when compared to CF-1. The molecular weight shown in the literature for crab shell was 1.2 × 10⁵ g/mol [52], thereby increasing the thermal stability of the composite and also the literature findings stated that higher stable material present in the composites increases the stability, this postulate is in accordance with the current study. Thus, the thermal stability followed the trend of CF-3 > CF-2 > CF-1 (higher to lower stability).
Morphological characterization
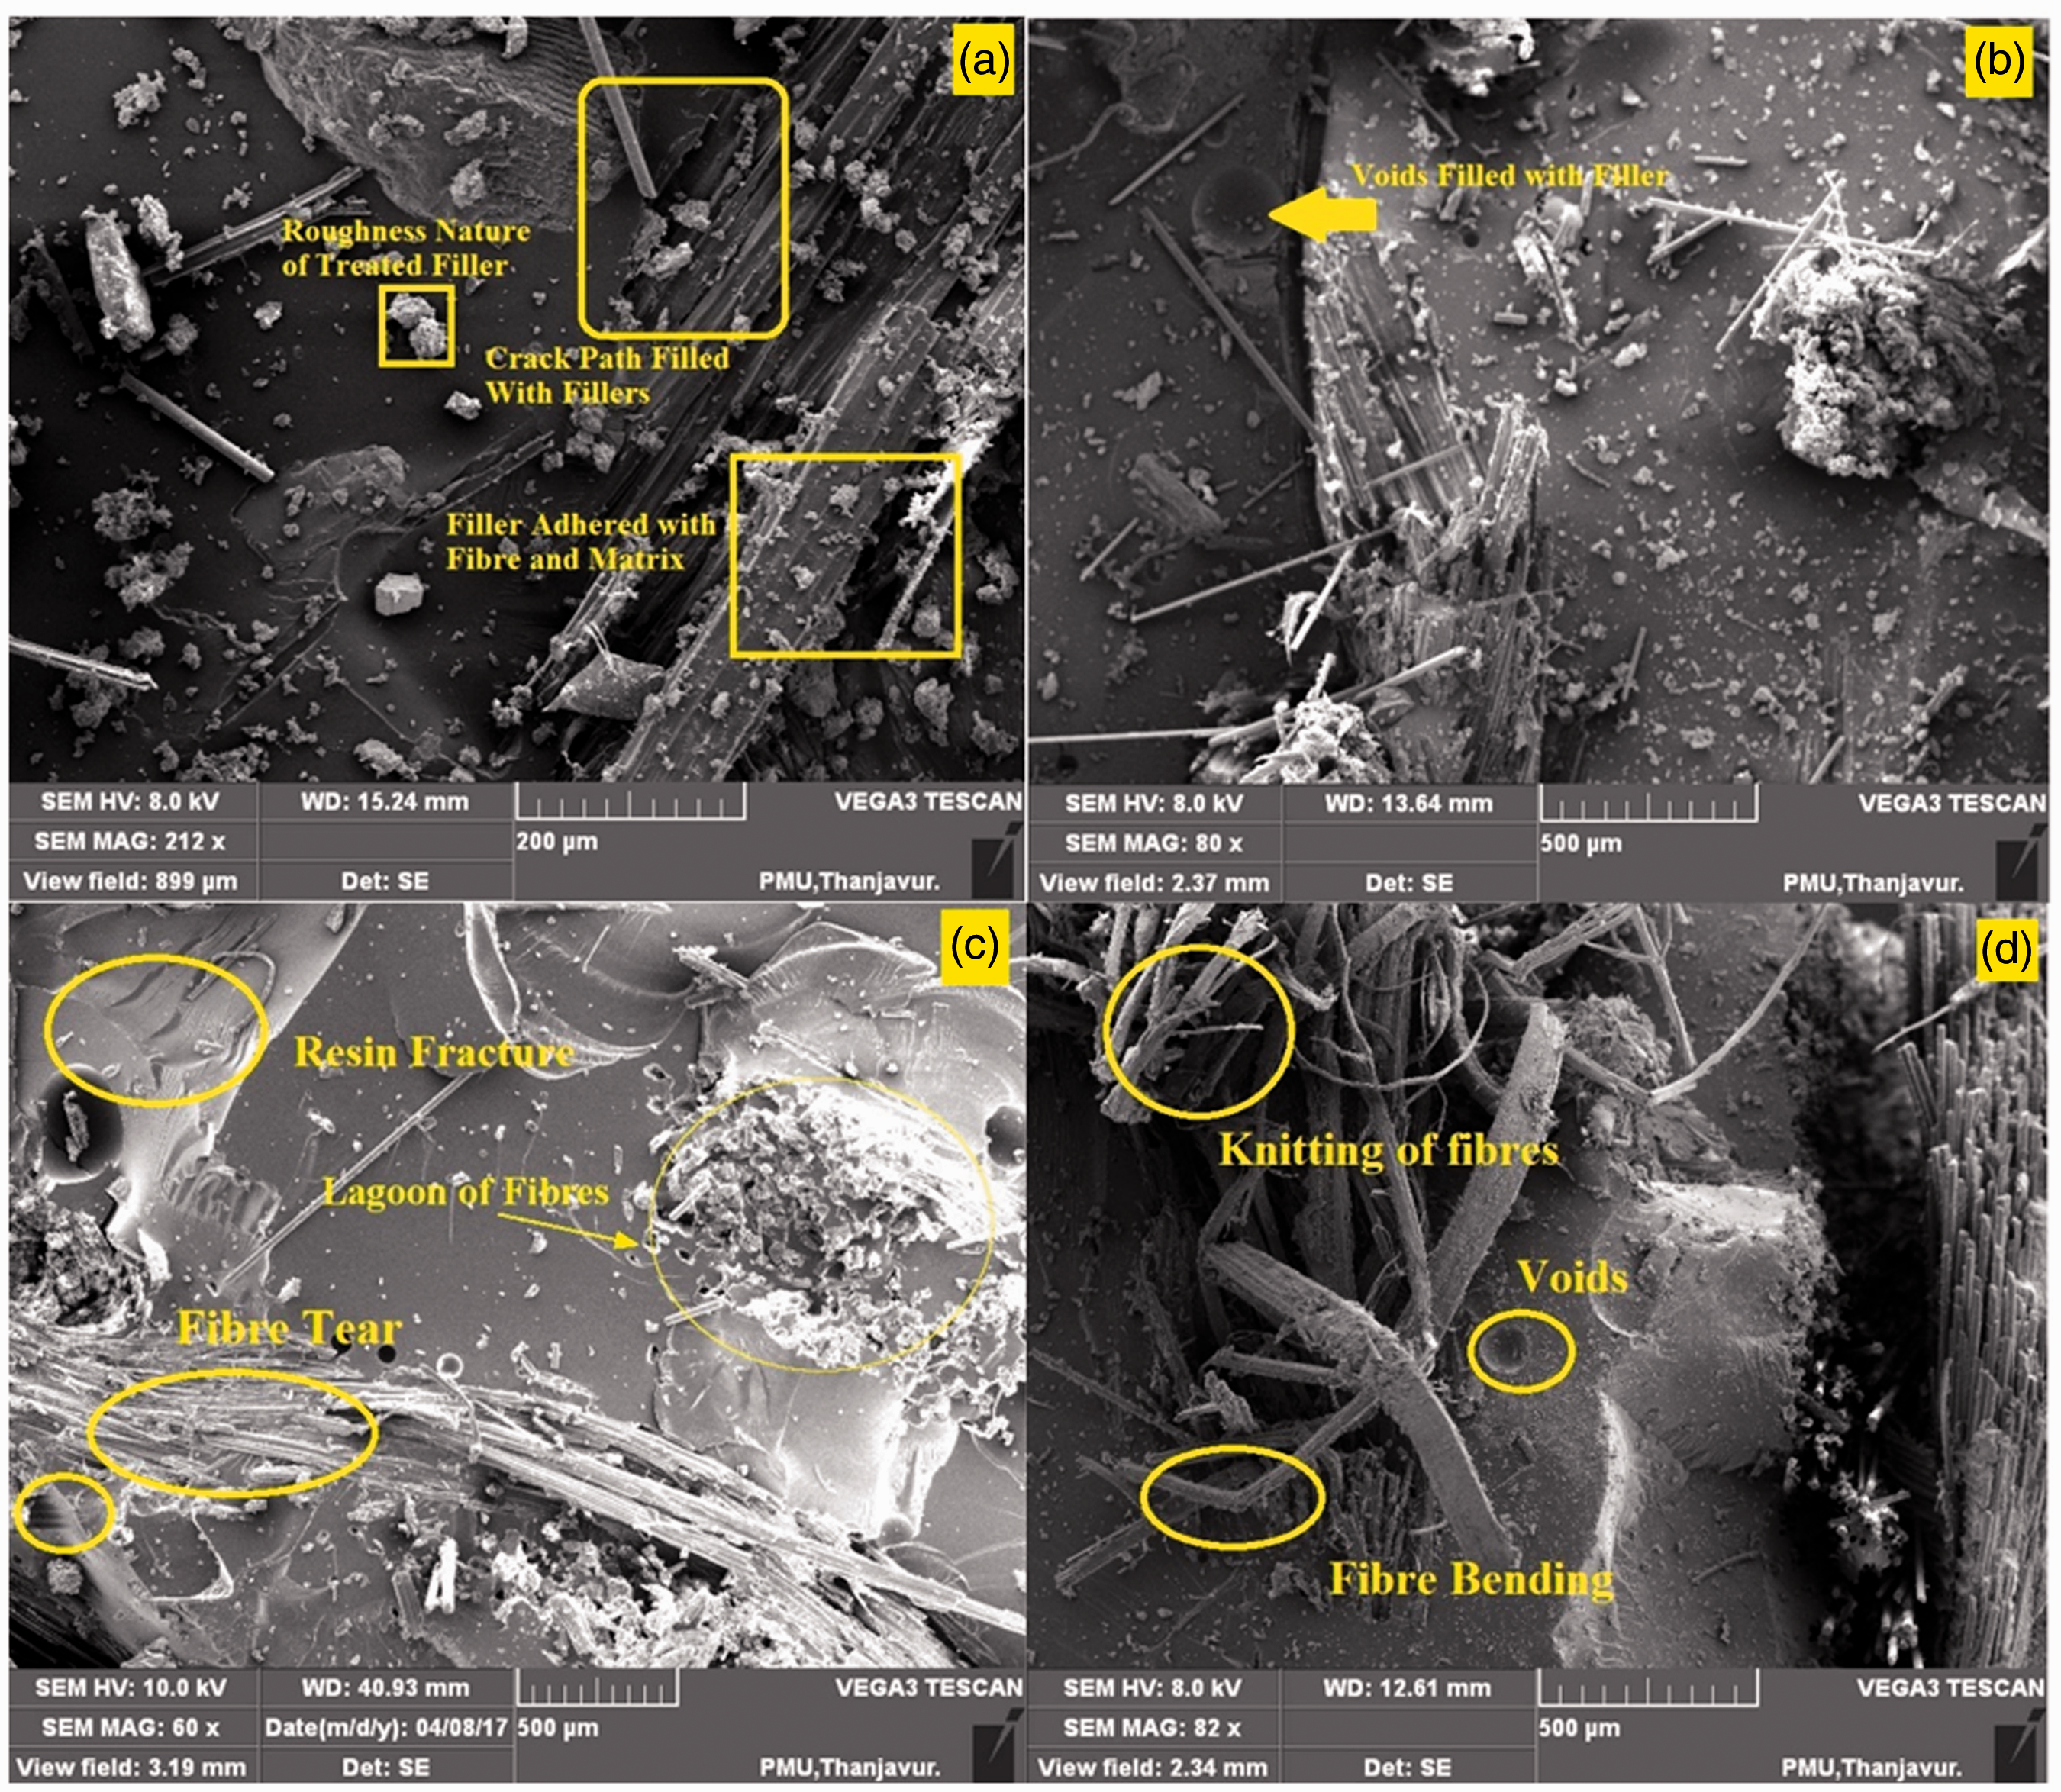
The morphological characters of the tensile-tested specimens are shown in Figure 18. Figure 18(a) shows the rough composite surface, fiber-matrix interaction and the crack path filled with fillers corresponds to the tensile tested specimen of CF-3. From the Figure 18(b), it can be seen that the fillers fill the voids in the case of CF-3, thus leading to better adhesion of the fiber and matrix leading to an increased tensile strength. The low tensile strength of CF-1 is due to the voids caused by poor wetting characteristics leading to poor fiber-matrix interactions, though care was taken to remove air bubbles. This was overcome by CF-3 followed by CF-2 due to the presence of fillers, which filled the voids. As represented in the SEM image of Figure 18(b). The reduction in the strength of CF-1 composites is mainly due to the presence of more voids, fiber agglomeration, fiber bending, fiber knitting, fiber tear and also lagoon of fibers that are seen in the SEM images Figure 18(c) and (d).
Thermal stability of the raw fillers and developed composites. (a) SEM image shows the roughness and other characteristics formed due to treated filler in the CF-3 tensile tested composite; (b) SEM image represents void filled with fillers in tensile tested CF-3 composite; (c) SEM image represents various failure defects in tensile tested CF-1 composite; and (d) SEM image represents knitting and fiber bending at the interface of tensile-tested CF-1 composite.
The improper mixing leads to the decreased flexural strength. Proper mixing is shown in SEM image of Figure 19(a), showing the area covered by the matrix surface. The increases in the wetting and adhesion of the filler with the matrix, i.e. increase in the cross-linking leading to the deflection of cracks in the composites and also the pinning of cracks takes place due to the treated fillers present along the path of the crack, as clearly seen from the SEM image of Figure 19(b). The ultimate flexural strength of the CF-1 is low when compared to other two composites due to the presence of void, which makes the fibers to easily get pullout (debonding), fiber bending, matrix crack and straining of the matrix leading to the poor results, which can be clearly visualised from the SEM image in Figure 19(c).
(a) SEM image shows proper mixing of filler, its effect on filler distribution and crazing of resin matrix in flexural tested CF-3 composite; (b) SEM image shows the deflection of cracks and pinning of cracks due to the treated filler on the CF-3 flexural tested composite; and (c) SEM image shows the various features which are responsible for the failure of CF-1 composite.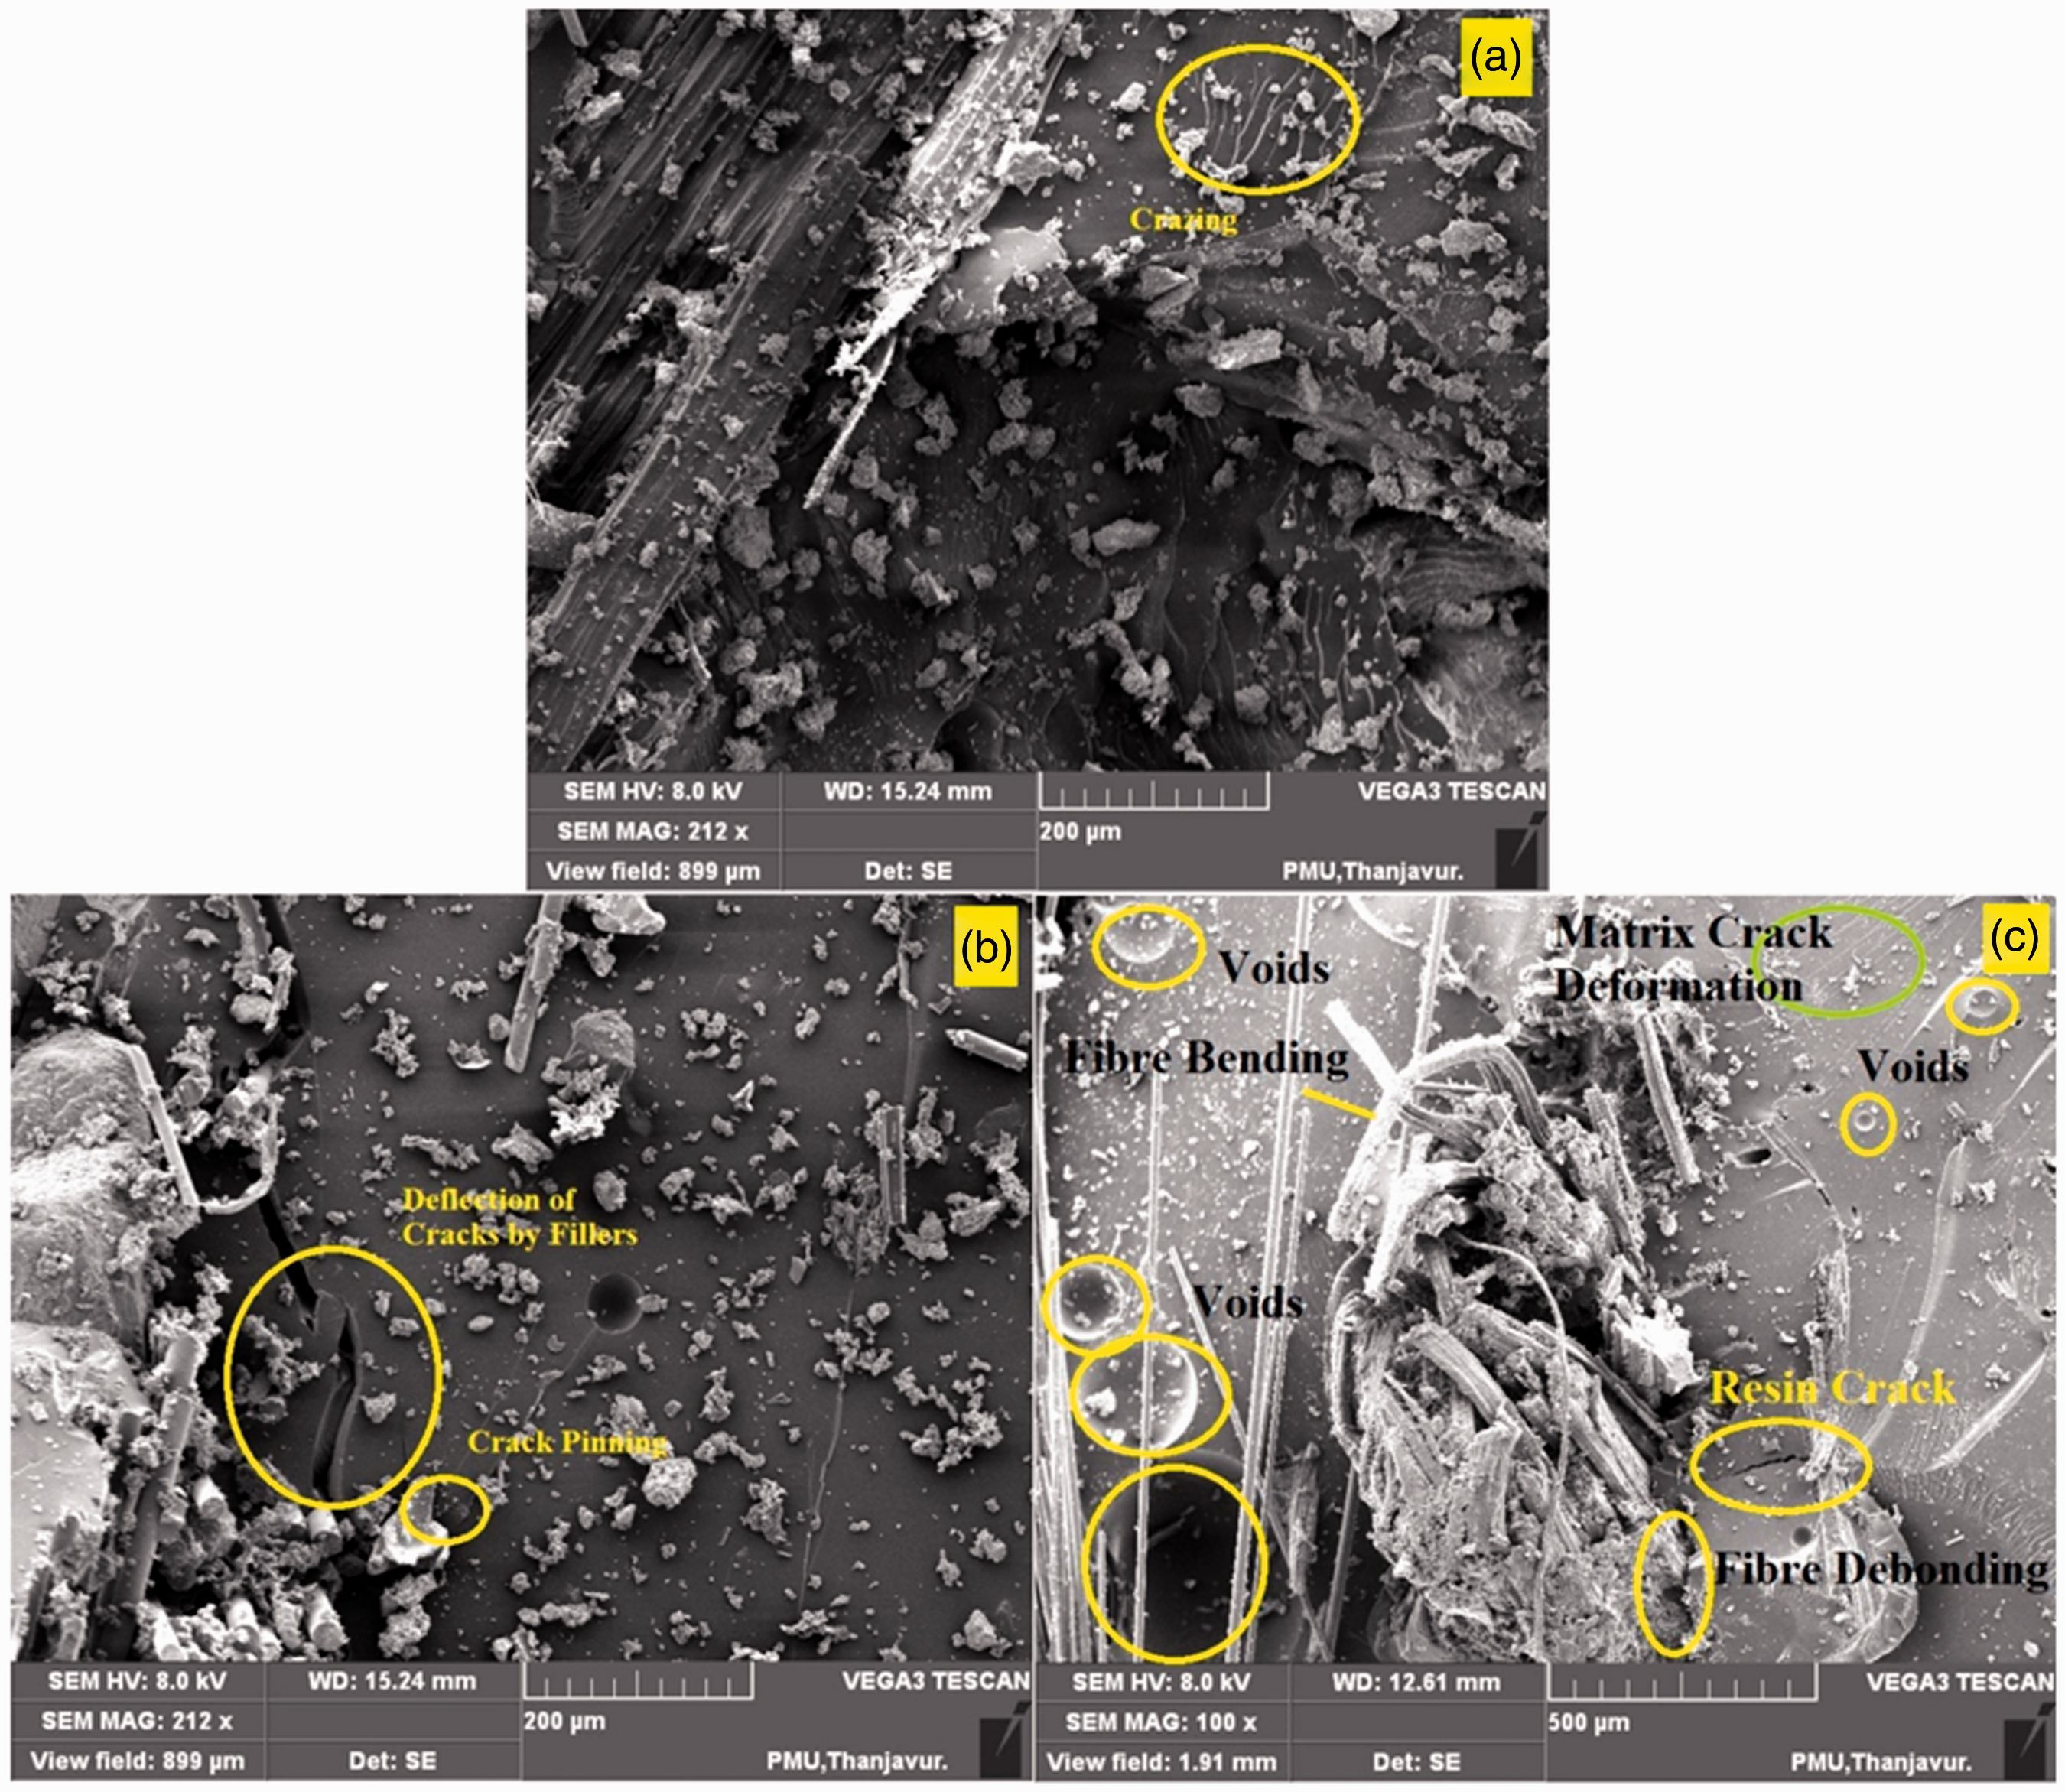
The SEM image in Figure 20(a) shows filler debonding in the case of CF-2 composites since the protein layer will not adhere well with the matrix leading to the debonding though the fillers filled the voids of the composites for considerable stress transfer. In this property also CF-1 showed poor ultimate compressive strength results due to its large size of voids with more fiber tear, which shows the improper wetting of the fiber in the matrix; even the voids present also played a vital role in the deterioration of the properties. These features are visualized in SEM image of Figure 20(b).
(a) SEM image shows the void filled with untreated fillers and debonding of fillers from the matrix for CF-2 composite; (b) SEM image shows voids and fiber tear in case of CF-1 composite.
The SEM image of Figure 21(a) represents the voids present in the CF-3 composites, and those voids also got filled with fillers, where there is no fiber pullout witnessed in the composite. Then in the case of Figure 21(b) shows the voids, more fiber pullout, resin- poor fiber bonding, deep resin crack, which detorite the results on CF-1 composite considerably. The voids were measured for their size using Image-J software, and it was noted that CF-3 showed 0.237 µm, while the CF-1 composite showed 0.513 µm.
(a) SEM image of impact tested CF-3 composites showing the voids; (b) SEM image of impact tested CF-1 composites showing voids and other characteristics which resulted in poor strength.
Development of showcase using CF-3 composite and deformation analysis using ANSYS
A showcase stand was developed using the best performer CF-3 composite as shown in Figure 22(a). In order to predict the deformation of the developed CF-3 laminate before the manufacture of the showcase, deformation analysis was carried out using ANSYS R 15. The prediction was made for three loading conditions (0.25 kg, 0.5 kg and 1 kg), respectively, on each rack. In order to perform a deformation analysis, the ANSYS R-15.0 software was used. The 3D model was developed using CREO Parametric and was exported to the ANSYS R15 in IGES format [53]. The material library was developed using the material properties obtained from the experimental results with ultimate tensile strength 55 MPa, ultimate flexural strength 5.45 MPa, ultimate compressive strength 93 MPa, hardness 67 and Poisson’s ratio of 0.3. The model developed is considered as a single homogenous mathematical model. So that the 3D model posses the same material property throughout the model [54]. The mesh chosen was tetrahedron which produced 32,881 nodes and 16,174 elements. Then, the discretized model was subjected to total deformation. At 0.25 kg load per rack showed 0.098484 mm, and 0.5 kg load per rack showed 0.19697 mm, while 1 kg load per rack showed 0.39393 mm distortion as shown in Figure 22(b) to (d), respectively. The reduced deformation is mainly due to the load-withstanding nature of the composite as explained in the previous sections.
(a) Showcase developed using JC-3 composites with things placed weighing 0.25 kg per rack. (b) Deformation analysis done for showcase with 0.25 kg load per rack. (c) Deformation analysis done for showcase with 0.5 kg load per rack and (d) Deformation analysis done for showcase with 1 kg load per rack.
The scope of the future study is to study the effect of moisture and biodegradation of the developed composites. Also, many more applications can be made like laptop stand, tray, ceilings etc., which could be analyzed further. The crab shell filler can also be compared with other fillers.
Conclusions
In the present research work, jute fabrics reinforced epoxy composites were developed with and without the incorporation of solid seafood waste untreated and treated Portunus sanguinolentus shell powder by using the hand lay-up process. Based on the results obtained from this research work, the following conclusions can be drawn:
The 10 wt% treated Portunus sanguinolentus shell powder-filled jute fabrics-epoxy composites showed enhanced tensile, flexural, compressive, shear, impact and hardness properties due to its rough structure leading to percolation of the matrix, i.e. better matrix-filler interaction, void filling nature. The thermal stability of the treated Portunus sanguinolentus shell powder-filled jute fabrics-epoxy composites were also higher due to the presence of calcium carbonate (i.e. chitosan) without the protein contents. SEM analysis visualized the defects such as the voids, fiber pullout, matrix-filler interaction, fiber tears, crazing, pinning of cracks etc. for the different mechanical properties. A showcase developed using best mechanical performer composite showed less deformation proving its better strength in nature.
Overall, 10 wt%-treated Portunus sanguinolentus shell powder-filled jute fabrics-epoxy composites showed superior results when compared to the other two composites. This research will be a positive solution to reduce the solid waste landfills produced by Portunus sanguinolentus shells after food consumption and also composite could be beneficially used in lightweight applications since these results further enhance the strength of the natural fiber composites.
Declaration of conflicting interests
The author(s) declared no potential conflicts of interest with respect to the research, authorship, and/or publication of this article.
Funding
The author(s) received no financial support for the research, authorship, and/or publication of this article.