
Abstract
This paper reports the mode I interlaminar fracture toughness and fracture mechanisms of two-dimensional (2D) plain woven composite and three-dimensional (3D) angle-interlock woven composite. The fracture toughness behaviors were tested with double cantilever beam method at the different loading rates from 0.5 to 100 mm/min. Critical strain energy release rate was calculated to compare the difference between the 2D and the 3D woven composites. The fractographs were photographed with scanned electronic microscopy and optical microscopy to show the fracture morphologies. We found that the 3D angle-interlock woven composite has high fracture toughness than that of 2D woven composite. The binder yarns resist the crack initiation and propagation to increase the fracture toughness. While the lower in-plane stiffness of the 3D woven composites should be considered fully for designing the 3D woven composites.
Keywords
Introduction
The significant development in fiber-reinforced composites has been recognized as a real game-changer especially in the aerospace industry. Fiber-reinforced composites offer multiple benefits of high specific strength, high specific stiffness [1], durability and damage tolerance [2] as compared to metallic equivalents. Recent considerations towards replacement of some glass with carbon fiber to design latest wind turbine blade is a breakthrough for composite industry dealing with carbon fiber-reinforced polymers. Since, there is an ever increasing demand of composite materials, and new materials are being introduced, so it became more challenging to assess their properties in order to forecast service life and failure behaviors.
Compared to other damage categories, interlaminar delamination is considered as a prevalent life-limiting failure mode for composite structures [3,4]. Delaminations may be introduced during manufacture or caused by damage events during service, such as bird strike, large hailstones, and other impact damage events thus hampering structural integrity and durability [5,6]. Keeping in view the adverse impact of delamination on the composites structures, it is necessary to consider in structural design process as well as in verification testing, to ensure safe application.
It is demonstrated that composites manufactured using three-dimensional (3D) textile preforms suppress delamination limitation of laminated fiber-reinforced composites. Many publications on carbon fiber/epoxy composites quantify the usefulness of 3D reinforcement on composites’ performance [7–9]. However, there is a limited work to evaluate mechanisms which depict reinforcement structural effects on crack initiation and evolution process. 3D angle-interlock reinforced composites have vast potential for engineering applications due to special layer by layer interlocked structure [10–13], nevertheless its toughness properties has not been studied yet.
Besides, fracture toughness studies on composites identified several factors which influence their toughness properties, such as environmental conditions, interface strength between fiber and resin, loading rate and the type of loading [14]. Characterization of these factors is important in order to predict material performance during service. Many published studies on laminated composites report their rate sensitive fracture behavior [14–16], this call for investigating the loading rate effect on 3D reinforced woven composites. In fact, there is strong experimental base for quasi static loading rates effects for laminated composites including test standards; however, for 3D-reinforced composites understanding of delamination behavior under various loading rates is necessary.
To overcome this obvious lack of knowledge on the fracture toughness of 3D angle-interlock woven (carbon/epoxy) composites (3-DAIWC), this paper aims to assess and compare the mode I fracture toughness properties and related toughening mechanisms of specially designed 3-DAIWF without binder yarn-reinforced composite with that of two-dimensional (2D) plain woven fabric composite (PWC) at constant cross head speed. Moreover loading rate effect on fracture behavior of 3-DAIWC needs to be quantified. Understanding of the various mechanisms and structural effects of angle interlock layer by layer weave on mode I fracture toughness is essential, in order to apply these composites to multidiscipline fields.
Double cantilever beam (DCB) specimens composed of 3-DAIWC were tested in pure mode I loading conditions at cross head speed of 0.5, 2.5, 5, 50, and 100 mm/min in order to avoid dynamic effects on fracture response. Load–displacement curve and Rcurve are given to show fracture toughness response of 3-DAIWC. Strain energy release rates were measured by “area method.” Furthermore, fractographic analysis was carried out by scanning electron microscope (SEM) and optical microscope, in order to relate the macroscopic resistance to delamination growth to the micromechanics of delamination fracture and compared with series of photographs obtained during mode I test, to understand toughening mechanisms. Fracture processes were revealed with series of photographs and by clarifying their correlation to load–displacement curve.
Experimental
Materials and specimens
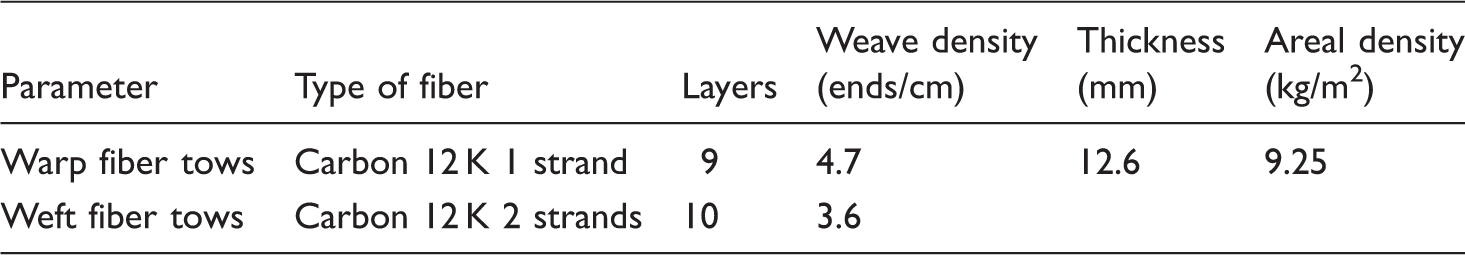
2D plain woven fabric (PWF) composites and 3D angle-interlocked woven fabric (AIWF) composites made of carbon/epoxy were used in this study. PWF and 3-DAIWF with layer by layer angle-interlocked structure (manufactured by Toray, Japan) supplied by Torayca carbon fiber tows, were used as reinforcement. Table 1reports structural parameters of PWF, whereas Figure 1shows composite fabrication process. Twenty-two layers of PWF were used to make composite thickness same as 3-DAIWC (Figure 1(b)).
Composite fabrication steps. (a) Sketch diagram of plain woven fabric. (b) Illustration of laminate layup. (c) Schematic diagram of VARTM. (d) Photograph of composite. Structural parameters of 2D plain woven fabric.

Epoxy resin (JA-02C) mixed with hardener (JC-02B) supplied by Changshu Jiafa Chemicals, Inc. (China) was used to saturate the reinforcement with the assistance of vacuum assisted resin transfer molding (VARTM) technique. Resin was degassed prior injection. Figure 1(c)shows the schematic diagram of VARTM process. Resin mixed with hardener was injected into performs at temperature 60℃ from two injection ports simultaneously and out flowed from the center vent. The curing process featured a step wise program of temperature 90℃ for 2 h, 110℃ for 1 h, and 130℃ for 4 h. Figure 1(d)shows 2-DPWC plate. The fiber volume fraction of composites was measured by Muffle furnace burning method that is 40% ± 3.
Structural parameters of 3-DAIWF are given in Table 2. It is composed of only warp yarns and weft yarns. Figure 2shows sketch diagram of 3-DAIWF and photographic view of 3-DAIWC fabricated by VARTM process described above. As shown in Figure 2, the warp yarns crisscross through the thickness direction at an off-axis angle and weft yarns lay straightly parallel to each other. Two adjacent warp yarns of a single layer traverses from one layer (upper) through the other layer (lower) to interlock the two adjacent weft yarn layers, presents a layer by layer angle interlocked structure. This integrated structure imparts both high strength and stiffness in in-plane and thickness direction of 3-DAIWF reinforced composites and can improve the delamination resistance. The average thickness of the final composites was 12.6 mm, with the fiber volume fraction of 32% ± 3.
3D angle interlock woven composites. (a) Sketch diagram of 3-DAIWF. (b) Photograph of composite. Structural parameters of 3D angle-interlock woven fabric.
DCB test specimens were machined from composite plates, along warp and weft directions for 3D reinforced woven composites, whereas 2D composite have no difference between warp and weft directions, confirmed by manufacturer’s data sheet. Dimensions and configuration of the test specimen are demonstrated in Figure 3. A cut out was machined into the DCB test specimens in order to insert steel loading fixture with hinge. Starter crack for mode I fracture toughness test was introduced in the middle of specimen by using a very fine hand saw.
Double cantilever beam specimen.
Mode I fracture toughness test (DCB test)
Quasi static DCB mode I fracture toughness tests were conducted using a computer controlled Instron machine equipped with a load cell of 3 kN capacity. Figure 4shows a photograph of the DCB test configuration. Specimens were loaded in displacement control mode at crosshead velocity of 2.5 mm/min. Load–displacement (crack opening displacement) values were recorded in Instron data file for analysis. The tests were closely monitored and conducted at room temperature. The delamination crack growth length was monitored optically using a camera. In order to read crack tip position during experiment, paper ruler with 1 mm graduations was glued to both sides (across width) of the specimens starting from just below the starter crack tip.
Mode I double cantilever beam test.
It was experienced that when crack propagates, its geometry becomes uncertain, so the crack length was monitored from both sides (across width) of specimens and average value was recorded. In this study, Load, displacement, and crack length values were recorded at each load drop, starting from first nonlinear point in load–displacement curves. These values were used to calculate energy consumed for crack growth (critical energy release rate) using “area method,” that is, considered suitable for the 3D composites and is based upon energy considerations [17].
Date reduction scheme
Schematic load–displacement curve.


Therefore

Results and discussion
Load–displacement curves
The fracture toughness responses of 2-DPWC and 3-DAIWC were evaluated by load–displacement curve and strain energy release rate.
Figure 6(a)shows load–displacement curve of 2-DPWC. Delamination started at load of 275 N as a consequence of interface delamination between plies. After crack onset, once the load dropped and then increased again until it reached to its maximum point. From photographs, it is observed that crack is restricted to a narrow region in the vicinity of its primary path. Load–displacement data shows stair shape curve. Stair shape curve represents instability in crack growth. It is the consequence of wavy crack propagation path shown in Figure 6(b). Fibers bridging could be seen from photographs at specified points of load–displacement curve. When crack comes across fiber bundles in its path it becomes slow due to resistance offered by fiber bundles to crack growth by formation of bridging. Hence considerable intra-ply damage occurred (Figure 6(b)). However, when crack propagates in resin rich region it becomes fast. These results are in agreement with a previous study on laminated composites [19].
Fracture process of 2-DPWC. (a) Load–displacement curves. (b) Delamination path and fibers bridging.
Figure 7shows fracture process of 3-DAIWC during mode I loading, for warp direction. The load–displacement curve (Figure 7(a)) illustrates crack initiation behavior of composite. After crack initiation specimen failure occurred due to buckling damage. Local buckling damage occurred due to undulated path of warp yarn ahead crack tip (Figure 7(b)), which changed crack propagation plane from relatively straight line to curved path promoting shear damage, hence unsymmetrical arms of the specimen lack to transfer tensile load ahead crack tip, thus local failure occurred. Yarn fracture due to kink band of wrap yarns could be seen on the top outer surface of specimen. Hence it is concluded that when crack tip approaches crisscross point, undulated warp yarns which act as binder yarns control crack propagation behavior there by formation of kink band and initiating buckling damage.
Fracture process of 3-DAIWC (warp direction). (a) Load–displacement curve. (b) Schematic illustration of crack tip position at specimen failure point.
Figure 8shows load–displacement curve and related damage evolution process of 3-DAIWC for weft direction. In Figure 8(a), three major regions are highlighted. In the first region, the load versus displacement curve increased linearly until the crack onset (nonlinear (NL) point) at load value of 1230 N. This region represents the elastic deformation of the DCB specimen.
Fracture process of 3-DAIWC (weft direction). (a) Load–displacement curve. (b) Series of photographs correlating fracture process with the corresponding points on the load–displacement curve.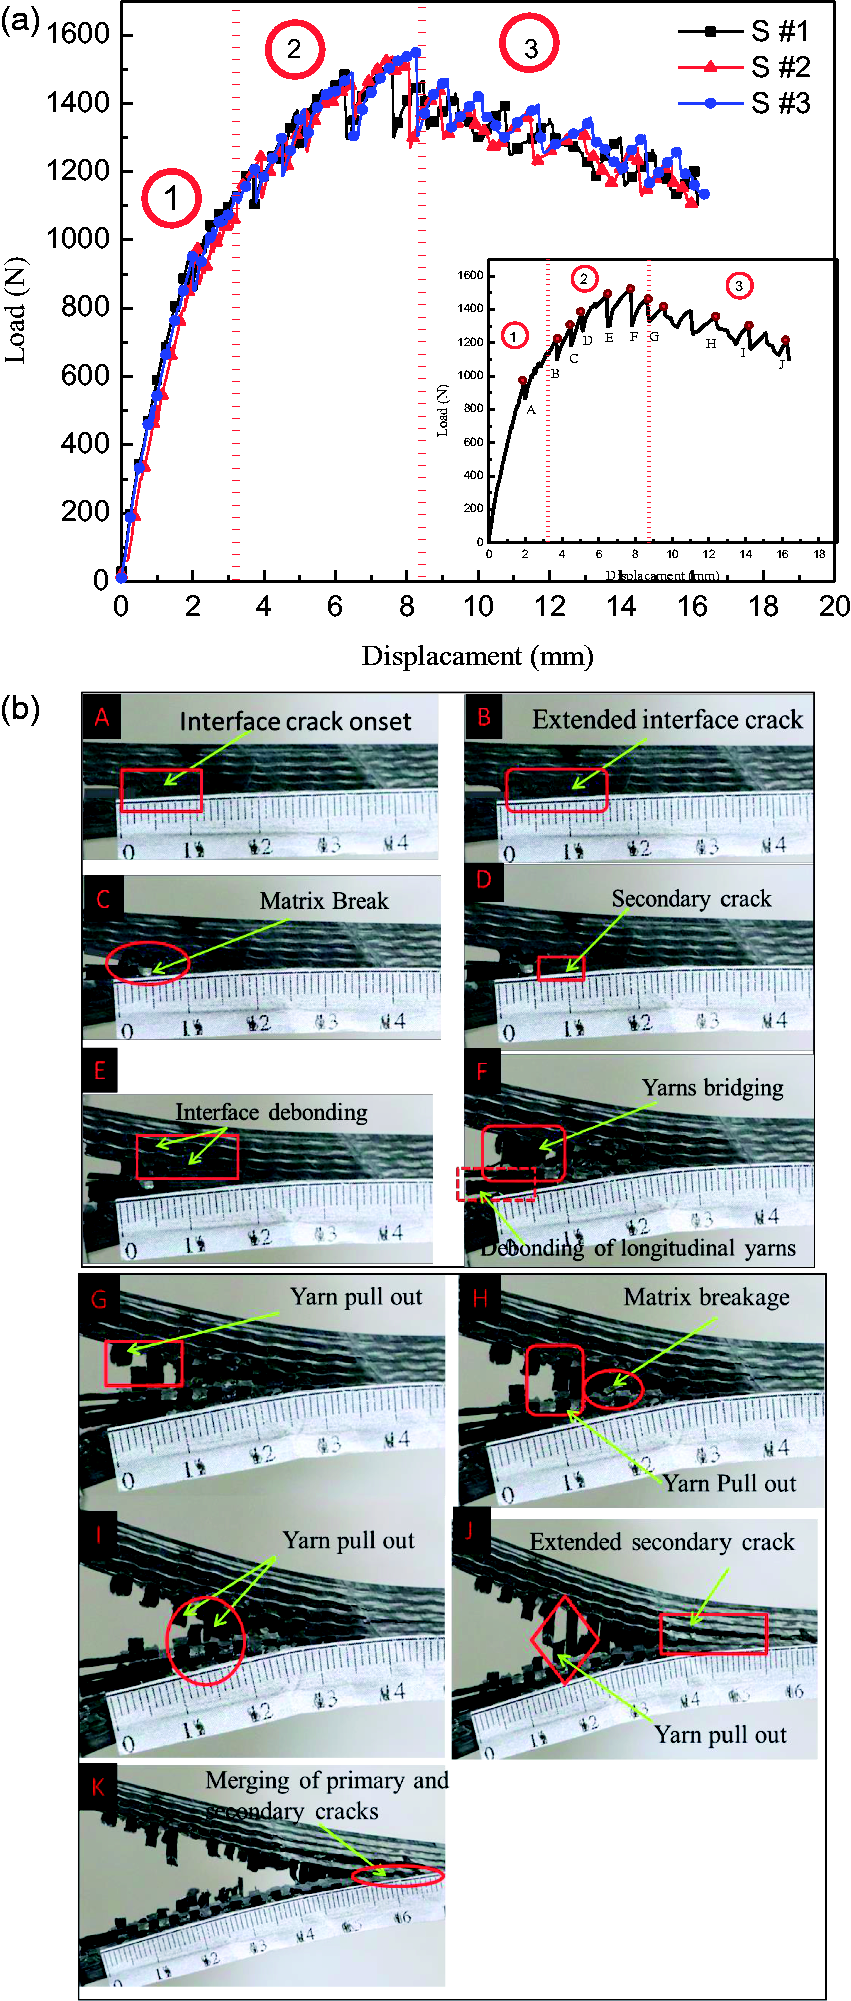
At NL point, load–displacement curve shows deviation from linear behavior. In the second region, nonlinear ascending behavior was observed for load. This region is known as crack propagation region and plastic deformation starts in this region. Nonlinear ascending behavior was due to interface debonding along with secondary cracks propagation and bridging formation behind crack tip and is explained in the next section. In addition, after delamination growth, crack arrest behavior (crack growth almost stopped, while load keep on increasing until crack propagation starts and load drops) was also observed. Sharp peaks in load-displacement curve revealed this behavior. Crack arrest behavior is attributed to structure of the 3-DAIWF, and clarified by the unstable pattern of crack propagation. After each crack propagation arrest, load decreased and then increased again with the displacement. Crack propagates slowly, until the peak load was reached (1543 N) and a big load drop was seen there. This peak load is the turning point. After that load decreases with the increase of displacement beyond approximately 8 mm of crack opening displacement. Small drops in load, before the peak load were seen for all tested specimens.
The third region is the descending region. It mainly starts after peak load. This region showed drops in load with increase of displacement. It also showed crack arrest behavior. The spaces between successive peak loads are assumed to associate with the spaces between consecutive undulated carbon fiber yarns perpendicular to crack growth direction.
Fracture process and toughening mechanisms
Figure 8(b)shows the crack propagation process of 3-DAIWC from a series of photographs captured during DCB test corresponding to load–displacement curve (Figure 8(a)). For clarity of load–displacement diagram, right bottom corner of Figure 8(a)shows curve of one specimen. Different types of energy dissipating mechanisms are observed from the photographs. Figure 8(a)shows the onset of crack propagation. It mainly occurred due to fiber/resin interface debonding. Interface debonding may be the consequence of non-uniform stress evolution in epoxy resin and carbon fibers due to the mismatches in material properties of both constituents. Immediately after the crack onset, only a small load drop occurred at that point. Figure 8(b)shows increase in crack length, as a consequence of another load drop (as load drop occurs when energy stored becomes enough to propagate crack). Figure 8(c)shows opening of crack wake due to matrix breakage from crack propagation path. Figure 8(d)shows occurrence of in plane secondary cracks in the top and bottom layers of primary cracks, predominantly for the delamination length of Δa ≤ 6 mm.
From photograph (Figure 8(e)), it is observed that small load drops and crack growth seen in the previous photographs mainly occurred due to interface debonding, matrix cracking from crack propagation path and occurrence of small fibers bridging which were relatively easy to break. Subsequent photographs show prominent increase in crack opening displacement rather than increase in crack length (crack arrest behavior). It relates to load–displacement curve at point F where a large peak load (1543 N) was seen.
The load drop occurred at that point was due to debonding of longitudinal yarns from lower arm of DCB specimen. It is assumed that straight longitudinal yarns also carry the major part of load during fracture. Bridging yarns (undulated warp yarns) promote toughening by resisting the tensile force directly concentrating on the crack tip region. Thus, increases the force (mode I force) to crack growth, which makes the crack propagation slow. Load value keeps on increasing, until the stored energy becomes enough to propagate crack through bridging region.
Figure 8(g)shows increase in crack opening as well as crack length growth due to first yarn pullout behind the crack tip (energy was dissipated at that point as shown by a large load drop). Fracture and pull-out of bridged yarns involve input of work, being the main energy dissipative mechanisms. Therefore, increase fracture resistance [20]. Yarn bridging and pull out were observed as important toughening mechanisms in the present 3-DAIWC structure. Onward photographs show one by one transverse yarns pullout and matrix breakage between consecutive yarns. Interesting thing is that primary and secondary cracks extend simultaneously but the primary crack was dominant compared to the secondary crack. Figure 7(j)depicts that secondary crack was propagated to some extent and then it merged with the main crack. Secondary cracks propagation can be considered another dominating toughening mechanism after yarn bridging and pull out, as energy is required for initiation and propagation of secondary cracks.
Collectively interface debonding, matrix breakage, yarns bridging and pull out and occurrence of secondary cracks as well as their propagation are assumed to be liable for high mode I interlaminar fracture toughness of 3-DAIWC. But exact contribution of each toughening mechanism to overall fracture toughness is somewhat difficult to figure out. Although the structure failure started due to interface debonding but later on it promotes toughening by hindering the stress concentration on crack tip, as revealed by photographs in Figure 8.
Figure 9depicts that layer by layer interlock fabric structure of 3-DAIWC promotes yarns bridging, when mode I force acts on the two arms of DCB specimen, yarns ahead crack tip (undulated warp yarns normal to crack growth direction) in the top and bottom layers, adjacent to primary crack layer are more prone to dislocate thus impart in yarn bridging. It is assumed that secondary cracks formation is also a consequence of bridging, as the bridging yarns resist crack propagation in the primary path behind crack tip [21], so crack changes its path, thus resulting secondary cracks.
Schematic illustration of bridging mechanism shown by undulated warp yarns ahead crack tip (front view). (a) Preform structure before load application. (b) Bridging formation shown by yarns (normal to crack growth direction) with steep slope. (c) Yarns pull out by further increase of load.
Figure 10provides a clear picture of the crack arrest behavior described above, in which crack length growth behavior is shown versus crack opening displacement.
Crack length versus crack opening displacement.
Fracture toughness data
Eventually, the results of mode I fracture toughness as functions of delamination length (Rcurve) are presented in Figure 11. Figure 11(a) and (b)illustrate fracture toughness as a function of crack length. All data points in Figure 11(a)are obtained by averaging the three replicate specimens’ test results. The Rcurve shows that fracture energy increased with crack extension gradually at the initial stage of crack propagation. This is probably owing to the gradual development of bridging behind crack tip until the maximum value is obtained, which is the indication of fully developed bridging zone. This phenomenon, that is, gradual increase in the crack propagation resistance as crack extends, arises from bridging effect and is explained by the concept of Rcurve. Both data plots show the similar trend; however, data points of Figure 11(b)are widely scattered as compared to Figure 11(a). This presents the instability in fracture energy associated with the crack growth behavior by increase in crack length. Moreover bridging phenomenon and some other energy absorbing mechanisms such as matrix breakage and secondary cracks formation are dominant in 3-DAIWC caused by fiber tows positioned in through thickness direction, whereas in 2-DPWC crack growth path is relatively smooth.
Results from fracture toughness tests. (a) Rcurve of 2-DPWC. (b) Rcurve of 3-DAIWC. (c) Comparison of GIcvalues.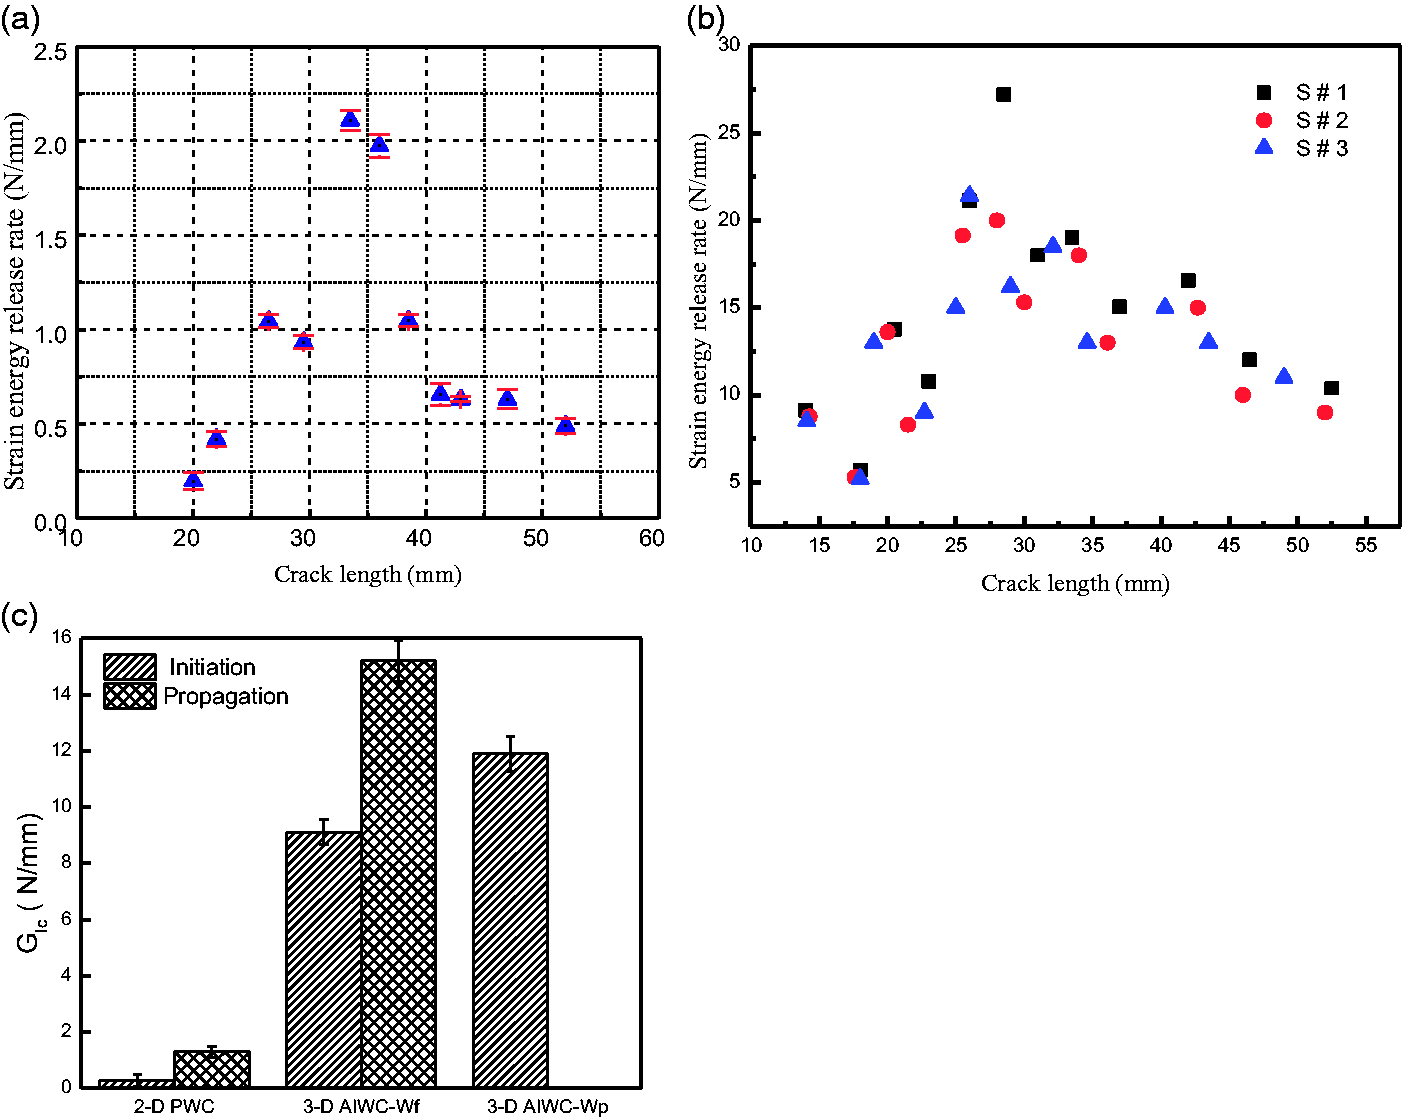
A comparison of crack initiation and propagation values of
Bridging yarns have significant impact on the energy requirement for crack propagation and as reported by de Moura et al. [20] bridging phenomenon is liable to increase the energy dissipation during crack growth process. Thus, we can say that
Loading rate effects on fracture toughness
Load–displacement curves in Figure 12illustrate the rate sensitive crack growth behavior of 3-DAIWC. The specimens respond in a linear fashion up to the initiation of crack irrespective of the loading rate; however, after this the curves for lower loading rates are notably higher. It is observed that after crack initiation, steep slope of load–displacement curve bends downward with relative increase in loading rate. Curves obtained at higher loading rate are relatively smoother compared to curves obtained at lower loading rate. For better understanding, Figure 12(b)represents rate effect on peak load. It depicts that increase in loading rate results decrease in critical level of load at which crack propagates, similar to the findings of previous studies on laminated composites [23,24]. This is caused by decrease in the intensity of energy absorbing mechanisms, such as interface debonding, secondary cracks formation, and bridging formation.
Loading rate effect on fracture behavior. (a) Load–displacement curves. (b) Peak load as a function of loading rate. (c) Loading rate effect on size of plastic region.
At lower loading rate, composite have large plastic deformation in the surroundings of crack tip, thus increase in stress results blunting the crack tip and impedes stress concentration ahead crack tip; however, at higher loading rates composites have less plastic deformation, thus increase in stress results faster crack propagation caused by stress concentration on crack tip. The proposed effect of load rate on size of plastic region (rp) in the crack surroundings is shown by Figure 12(c)and verified by the photographs on right (Figure 12(c)), where higher damage is seen at lower rate of loading. This behavior is the consequence of rate sensitivity of epoxy resin [25].

Generally carbon fibers are rate insensitive; however, epoxy resin shows significant rate dependency at room temperature, thus impact of load rate on epoxy matrix is finally translated to composite.
Figure 13shows fracture toughness plot as function of loading rates, where a substantial decrease in toughness is reported by increasing loading rate. This represents decrease in material toughness with increase in load rate, due to decrease in the extent of plastic deformation in contrast to the findings of Blackman et al. [26] who reported the Fracture toughness versus loading rate.
From the above findings, it is concluded that loading rate effect on fracture responses of 3D-reinforced woven composites is governed by rate dependent matrix properties. It influences other fracture mechanisms, thereby rate effect on interaction properties of carbon fiber and epoxy matrix [25], thus synergize the resulting effect.
Fractographic examination
Optical microscopy
Figure 14shows side fractography of fractured DCB specimens. Figure 14(a)shows zigzag crack propagation path along with interface debonding and some broken fibers in crack path. Figure 14(b)shows fractured 3-DAIWC specimen. It was characterized by number of failure modes including interface debonding, matrix cracking, and yarn pull out.
Optical microscopy showing top and bottom sides of fractured double cantilever beam specimen. (a) 2-DPWC. (b) 3-DAIWC.
Figure 15also shows optical micrographs of fractured specimens. Figure 15(a)identifies two main regions of varying toughness in crack propagation path, fibres rich region and resin rich region. Matrix cracks and bared yarns could be seen from fractured surface in Figure 15(b).
Optical micrographs showing (a) crack growth path in 2-DPWC and (b) fractured surface of 3-DAIWC.
SEM microscopy
SEM images were obtained before and after test by cutting samples to suitable size. After test fractured DCB specimens were fully separated for SEM analysis. Thin gold layer was coated on samples to remove charging effects.
Figure 16shows SEM micrograph of DCB specimen prior test to find whether there is any built in crack. There is no evidence of cracks or any other noticeable flaw. SEM micrograph in Figure 17revealed interface debonding, evidenced by some bare yarns on fractured surface. Figure 18shows damage morphology from cross section and fractured surfaces of specimen. Figure 18(a)depicts the energy absorption mechanisms, such as debonding of undulated warp yarns from matrix layer along with resin cracking. Figure 18(b)also shows extensive resin cracks on fractured surface.
Micrographs of the double cantilever beam specimen before test. (a) Bottom surface. (b) Top surface. Micrograph of the fractured surface showing bared yarn and interface cracks. (a) Lower magnification. (b) Higher magnification. Scanning electron microscope micrographs of the fractured specimen. (a) Cross section. (b) Fractured surface.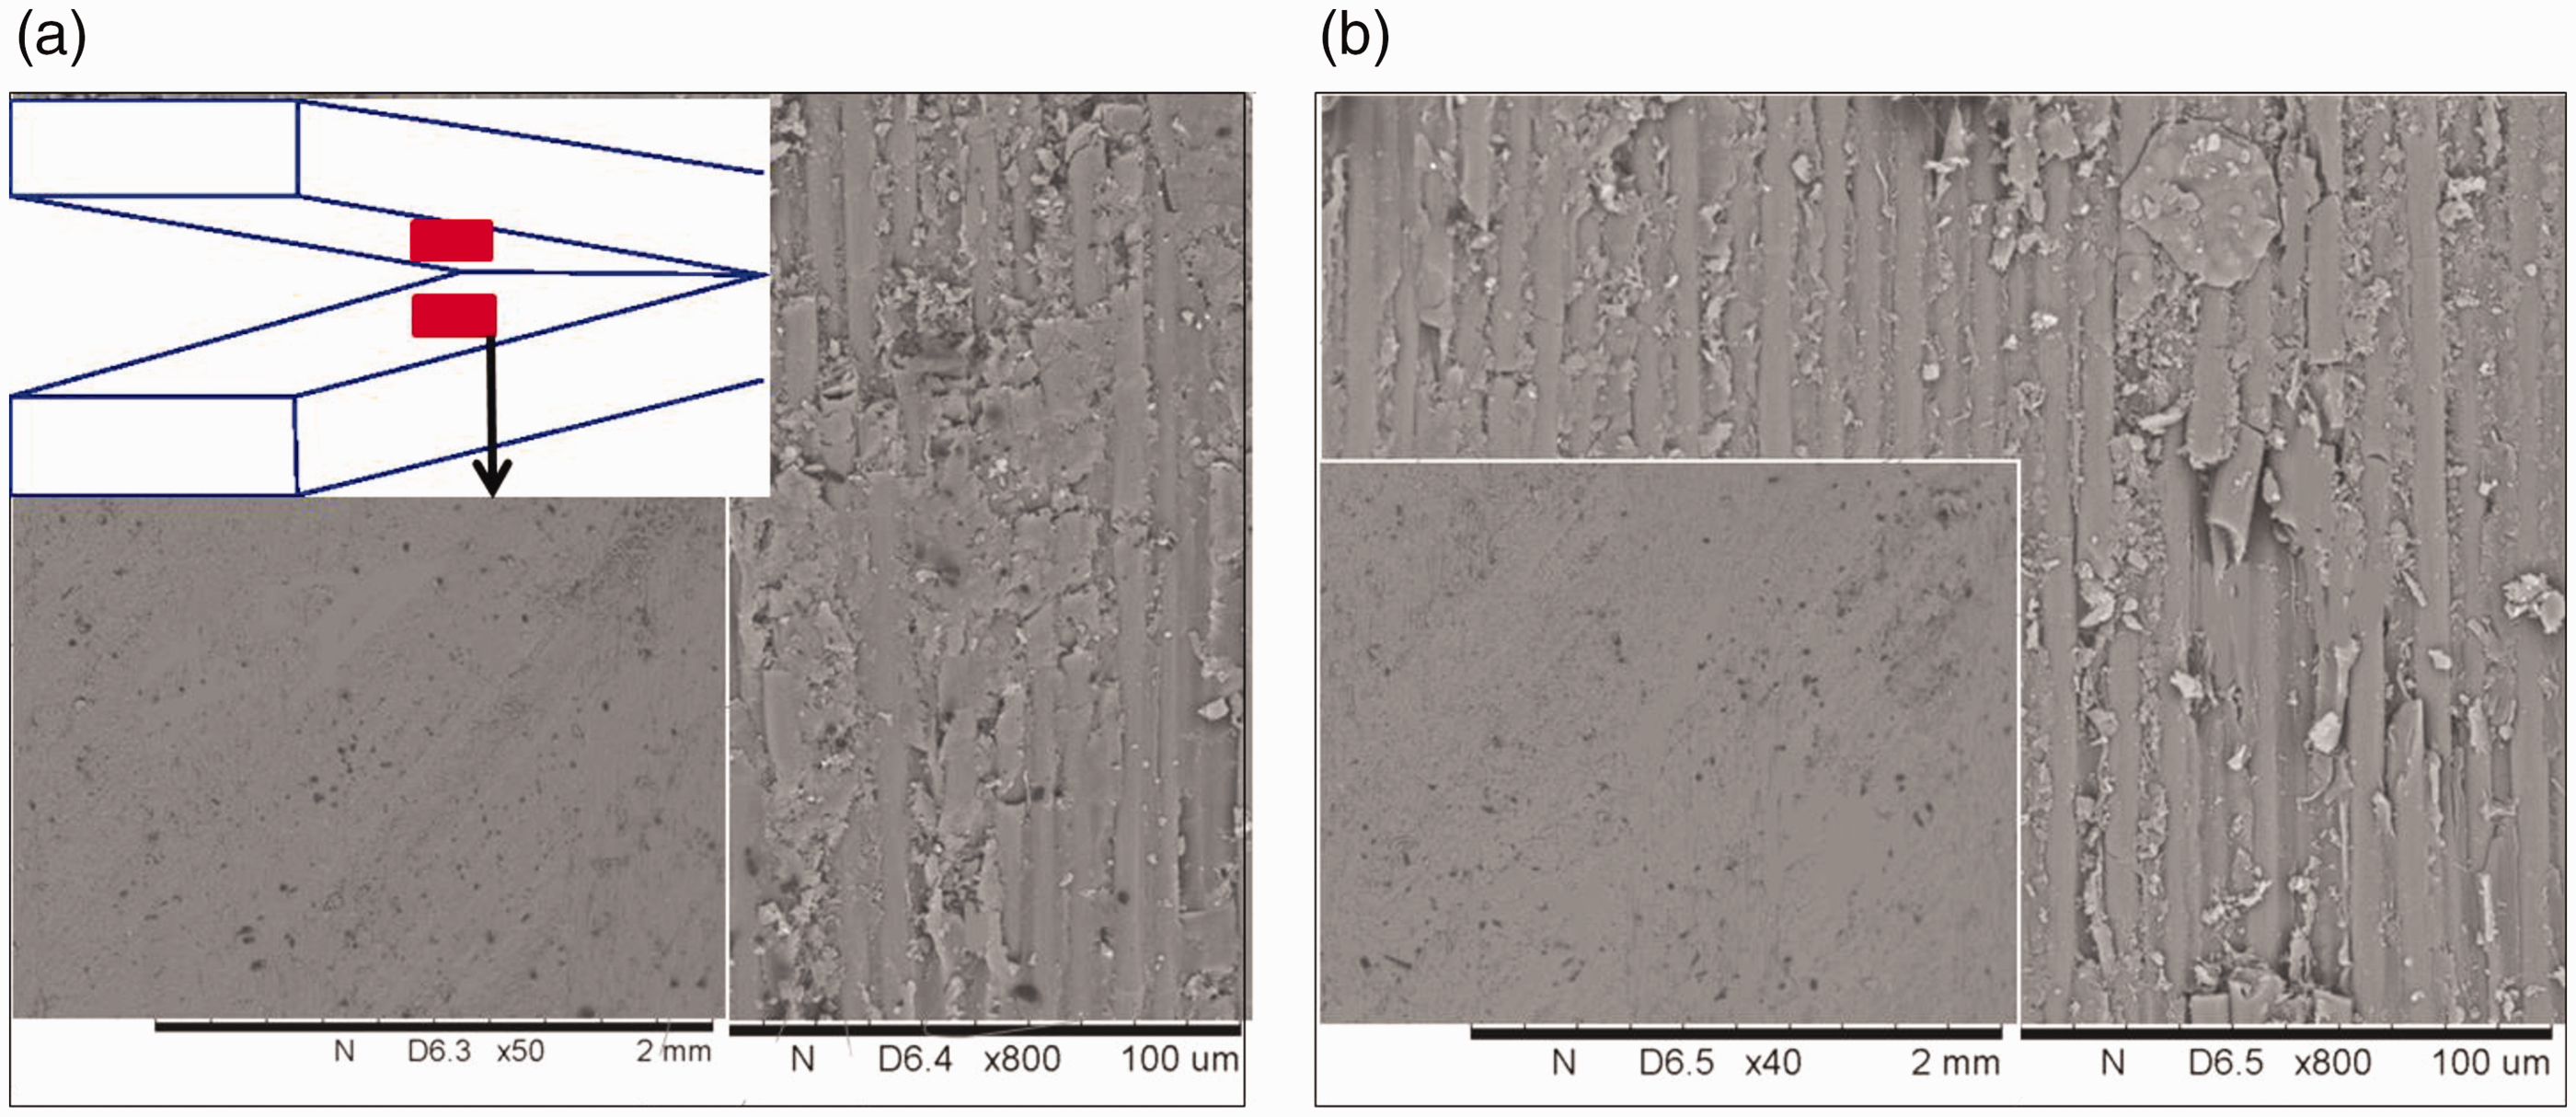


Micrographs in Figure 19provide evidence of matrix breakage and some broken fibers, however, extensive resin fragments are observed on specimen surface tested at lower loading rate (0.5 mm/min), which verify more plastic deformation compared to higher loading rate (100 mm/min).
Scanning electron microscope micrographs of the fractured specimen tested at (a) 0.5 mm/min and (b) 100 mm/min.
Fractographic investigations of 2-DPWC and 3-DAIWC confirmed that several mechanisms are involved in increasing interlaminar fracture toughness of 3D-reinforced composites compared to 2D-reinforced composites. Fracture processes, such as interface debonding, resin cracking and break, yarns bridging and pull out and secondary cracks formation apt to increase the energy absorption associated to fracture.
Conclusions
The mode I interlaminar fracture toughness of 2D plain woven composites (2-DPWC) and 3D angle-interlock woven composites (3-DAIWC) was tested with DCB method. The load–displacement curves and fractographs have been obtained to compare the mode I fracture toughness of the two woven composites. The influence of woven structure on the fracture behaviors was analyzed from the tested results. We found that the 3-DAIWC has higher fracture toughness than that of 2-DPWC because of the existence of binder yarns. The crack propagation in the 3-DAIWC was dominated by the woven structure. The undulated warp yarns resist crack development and increase fracture energy absorption. Load–displacement curves obtained at different loading rates from 0.5 to 100 mm/min revealed the decrease of the critical load of crack initiation as the increase of loading rate. Fractographs show the effect of the binder yarns fracture on the interlaminar cracks. The binder yarns leads to the significant increase of the GICfracture toughness. Owing to the decrease of in-plane stiffness in 3D woven composites, the trade-off between higher interlaminar fracture toughness and lower in-plane stiffness should be considered for the application of the 3D woven composites.
Footnotes
Declaration of conflicting interests
The author(s) declared no potential conflicts of interest with respect to the research, authorship, and/or publication of this article.
Funding
The author(s) disclosed receipt of the following financial support for the research, authorship, and/or publication of this article: The authors acknowledge the financial supports from National Science Foundation of China (51875099 and 51675095) and Fundamental Research Funds for the Central Universities (CUSF-DH-D-2018032).