
Abstract
In this study and for the first time, aligned nanofibers were produced from low molecular weight polyvinyl butyral. Using response surface methodology, the preparation condition of aligned nanofiber was optimized in terms of nanofiber diameter and its structural stability. Central composite design as a response surface methodology was employed and the effects of process variables and their influence on nanofiber diameter were investigated. Based on a statistical analysis, the use of a model, which was used to determine the nanofiber diameter, proved to be successful because of its low probability value (0.0073) and high correlation coefficient (0.9619). A high-speed cylinder collector was used to fabricate aligned polyvinyl butyral nanofibers. The optimum conditions of 17.5 kV voltage, 10 cm collector distance, 13% solution concentration, and 2100 r/min rotational speed were obtained from experiments. The least diameter of 158.6 nm along with a stable structure was determined for polyvinyl butyral nanofiber prepared under the optimum conditions. An aligned polyvinyl butyral nanoweb was applied on the mid-layer of glass-phenolic laminated composites as an interlaminar reinforcement. The fracture behavior of the laminates was determined by end-notched flexure tests. Excellent toughening property which was observed for the aligned polyvinyl butyral nanofibers caused the mode-II fracture toughness and its maximum force to increase by 25.2 and 40.8%, respectively.
Keywords
Introduction
Nanofibers can be produced from a wide range of polymers. Nanofibers, due to their small diameter, have high specific surface area, causing them to be highly porous with excellent pore interconnectivity [1]. They also have large surface-to-weight ratio, that provides high strength per unit weight [2]. These unique characteristics impart many desirable properties to nanofibers for use in advanced applications.
Polyvinyl butyral (PVB) has been extensively used in many industrial and civil applications because of its advantages, such as relatively low price, excellent adhesion bonding, desired film-forming capacity, adequate water resistance, high bonding power, excellent optical visibility, typical elasticity, high compatibility with organic polymers, easy processing, etc. which have led to its popularity [2]. In spite of the extensive literature on PVB polymers, only a limited number of studies exist that have investigated electrospun PVB nanofibers and, to our knowledge, a few of them focused on high molecular weight PVB [3–7]. Three solvents with different physical properties including ethyl alcohol, n-butanol, and isopropanol were used to prepare PVB spinning solution. Data reported by Yener and Yalcinkaya [6] demonstrated a considerable increase in nanofiber diameter with decreasing dipole moment and increasing boiling point and density of solvents. Based on their morphology results, isopropanol was selected as the most suitable solvent for a range of PVB molecular weights. The effect of PVB solution concentration on the process throughput and fiber properties was studied in both needle and roller electrospinning techniques. The results obtained by Yener and Jirsak [5] showed that in both techniques the fiber diameter increased by increasing the concentration, but the diameter of fiber produced by needle electrospinning was smaller than that made by roller electrospinning. Lubasova and Martinova [3] presented a simple method for the fabrication of porous PVB nanofibers based on solvent evaporation methods and showed that the diameter of porous PVB nanofiber decreased with increasing voltage and decreasing concentration. B30H PVB which is cheaper than high molecular weight PVBs has excellent compatibility with phenolic resin, and, shows some benefits over other types of PVB [8]. Despite B30H has more applications than other types of PVB and is widely available in market, researchers have not focused on the preparation of aligned nanofibers from low molecular weight B30H PVB.
For enhancing the potential of nanofibers, especially as a reinforcement for laminated composites, one way is to align the fibers [9,10]. In recent years, researchers have explored novel mechanical and electrostatic methods to control the electrospinning process to reach aligned nanofibers [11–14]. The use of cylinder collectors with high rotational speed is an interesting way to obtain aligned nanofibers [15]. Proper selection of the speed of cylinder surface is highly crucial since, if it were slower than the stretching rate, nanofibers would not be aligned and if the rotating speed were too high, due to the fiber breakage, continuous fibers would not be collected.
Delamination is one of the most concerning problems of laminated composites [16]. This problem has restricted the application of laminated composites in practice. Researchers have proposed many ideas to meet this challenge [17,18]. Aligned nanofiber is the newest technology for reducing delamination [19–23]. Aligned nanofibers have been used to clarify different micro-mechanisms taking place during mode-II crack propagation in the laminated composites. The research reported by Daelemans et al. illustrated that the distribution of nanofiber orientation had an outstanding effect on the interlaminar fracture of composites under mode-II loading and improved different micro-mechanisms observed at different nanofiber orientations [20]. Palazzetti et al. demonstrated that reducing the fiber diameter led to more energy absorption. They also showed that the fiber orientation had different effects on each loading mode [21]. So, nanofibers with specific properties, in terms of their diameter and orientation can be applied to improve the fracture toughness of laminated composites.
Phenolic resin is commonly used as thermosetting matrix in many polymeric composite materials, due to its unique properties such as resistance to ignition, low smoke generation and high-temperature resistance. Despite the benefits cited above, low level of toughness restricts the application of phenolic resin in structural components [24,25]. Therefore, it is vital to improve the fracture toughness of phenolic-based composites.
In this study, aligned PVB nanofiber was prepared using a low molecular weight PVB and used as an interlaminar reinforcement in phenolic-based composite to improve the fracture toughness under mode-II loading. Using RSM, the preparation conditions of nanofibers in terms of nanofiber diameter and its stability were introduced.
Materials and method
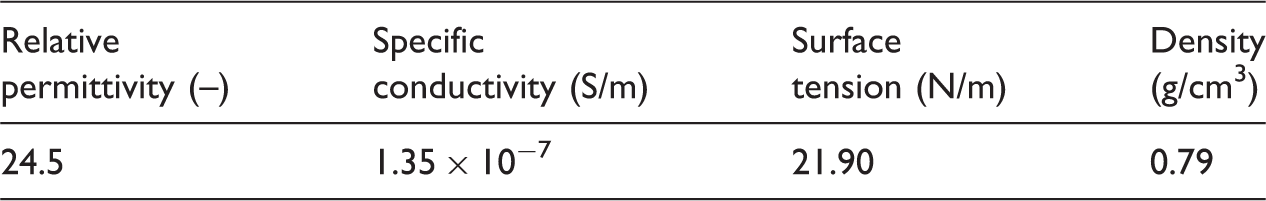
Specification data of ethanol at 25℃.
Experimental design and analysis
Independent variables of CCD method.

CCD: central composite design.
Electrospinning PVB polymer
Using the results obtained from the experimental design, a PVB–ethanol solution with different concentrations was prepared by stirring at room temperature for 5 h using a magnetic stirrer. Then, by using the results obtained from the RSM study, nanofibers were electrospun at a feed rate of 0.5 mm/min. Figure 1 shows the electrospinning setup.
Electrospinning setup.
Alignment of PVB nanoweb
In order to obtain aligned nanoweb, a cylindrical collector (20 cm diameter) with a high rotational speed was used. The rotational speed of 2100 r/min was demonstrated through several experiments to be the optimum velocity of electrospinning. Scanning electron microscope (SEM) images were used to determine the most suitable speed of rotation.
Fracture test on glass–phenolic composite
Hand-layup method was applied for producing glass/phenolic prepreg. Glass/phenolic prepregs containing about 50 wt% resin were prepared by using a resol-type phenolic (IL800) resin and plain E-glass fabrics with 200 g/m2 weight. The prepregs were B-staged at temperature 109℃ after 90 min. Before curing, a nanofiber web with a thickness of 5 µm (for modified samples) and a 15 µm Teflon sheet (for producing initial crack in both modified and reference samples) were placed just between the mid-layer, and test panels were cured by using a vacuum bag at 160℃ for 90 min.
Specimens of ENF tests under mode-II loading were prepared based on ASTM D7905 with a width, B, of 25 mm, length, L, of 130 mm, nominal thickness, t, of 3 mm, and initial crack length, a, of 35 mm. Mode-II fracture test was carried out in a universal testing machine (Santam-STM 150) with a force capacity of 200 kN and crosshead speed of 1.5 mm/min. Figure 2 presents the ENF test machine (A) and an ENF sample (B).
(a) ENF test machine and (b) ENF sample.
The energy release rate for mode-II fracture (GII) was calculated from the direct beam theory using equation (1) [32], where p is the load, δ is the displacement, 
Results and discussion
Low molecular PVB nanofiber
Response values for different experimental conditions.

Analysis of variance (ANOVA) and adequacy of the quadratic model.

Results of regression model.

The F-value of 11.46 and low probability value (Pr>F < 0.0073) indicate that the model is significantly valid for the PVB nanofiber diameter. The values of Prob > F less than 0.0500 imply that the model is significant, whereas the values greater than 0.1000 are usually considered as insignificant [26]. The value of correlation coefficient (R2) obtained in the present study was 0.9619 for PVB nanofiber diameter. A high-R2 value indicates a good agreement between the calculated and observed results within the range of study.
In this study B, C, C2 and A2C are significant model terms. The final regression model, in terms of its codes, is illustrated in equation (2).
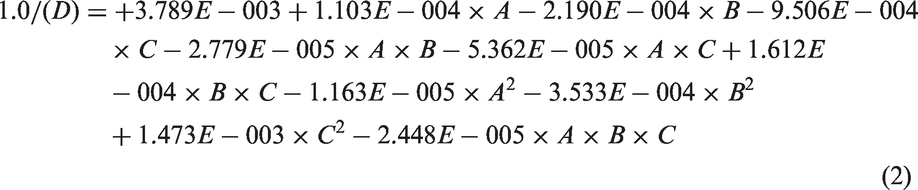
In terms of actual factors, an empirical relationship between the PVB nanofiber diameter and the controllable factor can be expressed by the following reduced cubic model presented in equation (3):

Usually, it is important to confirm if the selected model provides an adequate approximation of the real system. By applying the diagnostic plots provided by the Design Expert® software, such as normal probability plots of the studentized residuals, as well as the predicted versus actual value plots, the model adequacy can be judged. Figure 3(a) displays the normal probability plots of the studentized residuals for the PVB nanofiber diameter. A normal probability plot indicates if the residuals follow a normal distribution; the points will follow a straight line. Since some scattering is expected even with the normal data, Figure 3(a) reveals that the data are normally distributed. As shown in Figure 3(b), the predicted values of PVB nanofiber diameter obtained from the model and the actual experimental data are adequately correlated. The perturbation plot (Figure 4) shows the comparative effects of all controllable factors on PVB nanofiber diameter. In Figure 4, the sharp curvature in the concentration’s curve (C) shows that the response PVB nanofiber diameter is very sensitive to these controllable factors. On the other hand, the voltage curve (B) and the collector distance curve (A) show less sensitivity to PVB nanofiber diameter than solution concentration.
(a) Normal probability plots of the studentized residuals for PVB nanofiber diameter and (b) comparison between the predicted results obtained from the model and the actual experimental data. Comparative effects of all controllable factors on the result.

In Figures 5 and 6, the 3D response surface and contour plots are introduced as a function of two controllable factors, while the third controllable factor is remained constant. The effects of voltage and collector distance on nanofiber diameter at a constant solution concentration of 13% are illustrated in Figure 5. It has been revealed that the diameter decreases by increasing the distance for any selected voltage. Thus, based on the model presented in equation (2) and at this concentration value, the minimum diameter can be calculated at a given distance, bearing in mind the other physical and technical constraints. According to Figure 6, the increase in voltage and decrease in solution concentration resulted in the lowest diameter at a given constant distance. Based on the chart, this optimum value is 17.5 kV. On the other hand, according to Figure 7, when the voltage is remained at 17.5 kV, the response of the system is more complicated; the model shows a peak of distance. As seen in this figure, there is an optimum value for distance. Below this value the diameter decreases with increasing distance and above this value, it increases. A similar trend can be seen for the concentration of solution at constant voltage. Below the optimum value of concentration, the diameter increases with increasing concentration and above this value, it decreases.
(a) The respective iso diameter lines and (b) Effects of voltage and collector distance on nanofiber diameter at a constant solution concentration of 13%. (a) The respective iso diameter lines and (b) Effects of solution concentration and voltage on nanofiber diameter at a constant collector distance of 15 cm. (a) The respective iso diameter lines and (b) Effects of solution concentration and collector distance on nanofiber diameter at a constant voltage of 17.5 kV.


The results of the experimental design revealed that the nanofiber obtained from run no. 6 had minimum diameter but due to the existence of bead at run nos. 2, 5, 6, 7 and 8, the nanofiber obtained from run no. 9 had minimum diameter and appropriate structure. Figure 8 shows the SEM image of the nanofiber under the conditions of run no. 6.
SEM images and diametrical distribution of nanofibers prepared by run no. 6.
Figure 9 shows the SEM image of nanofiber of random PVB which was prepared under the experimental condition of run no. 9. The results revealed the least diameter (158.6 nm) with the best structural stability for this nanofiber.
SEM images and diametrical distribution of nanofibers prepared by run no. 9.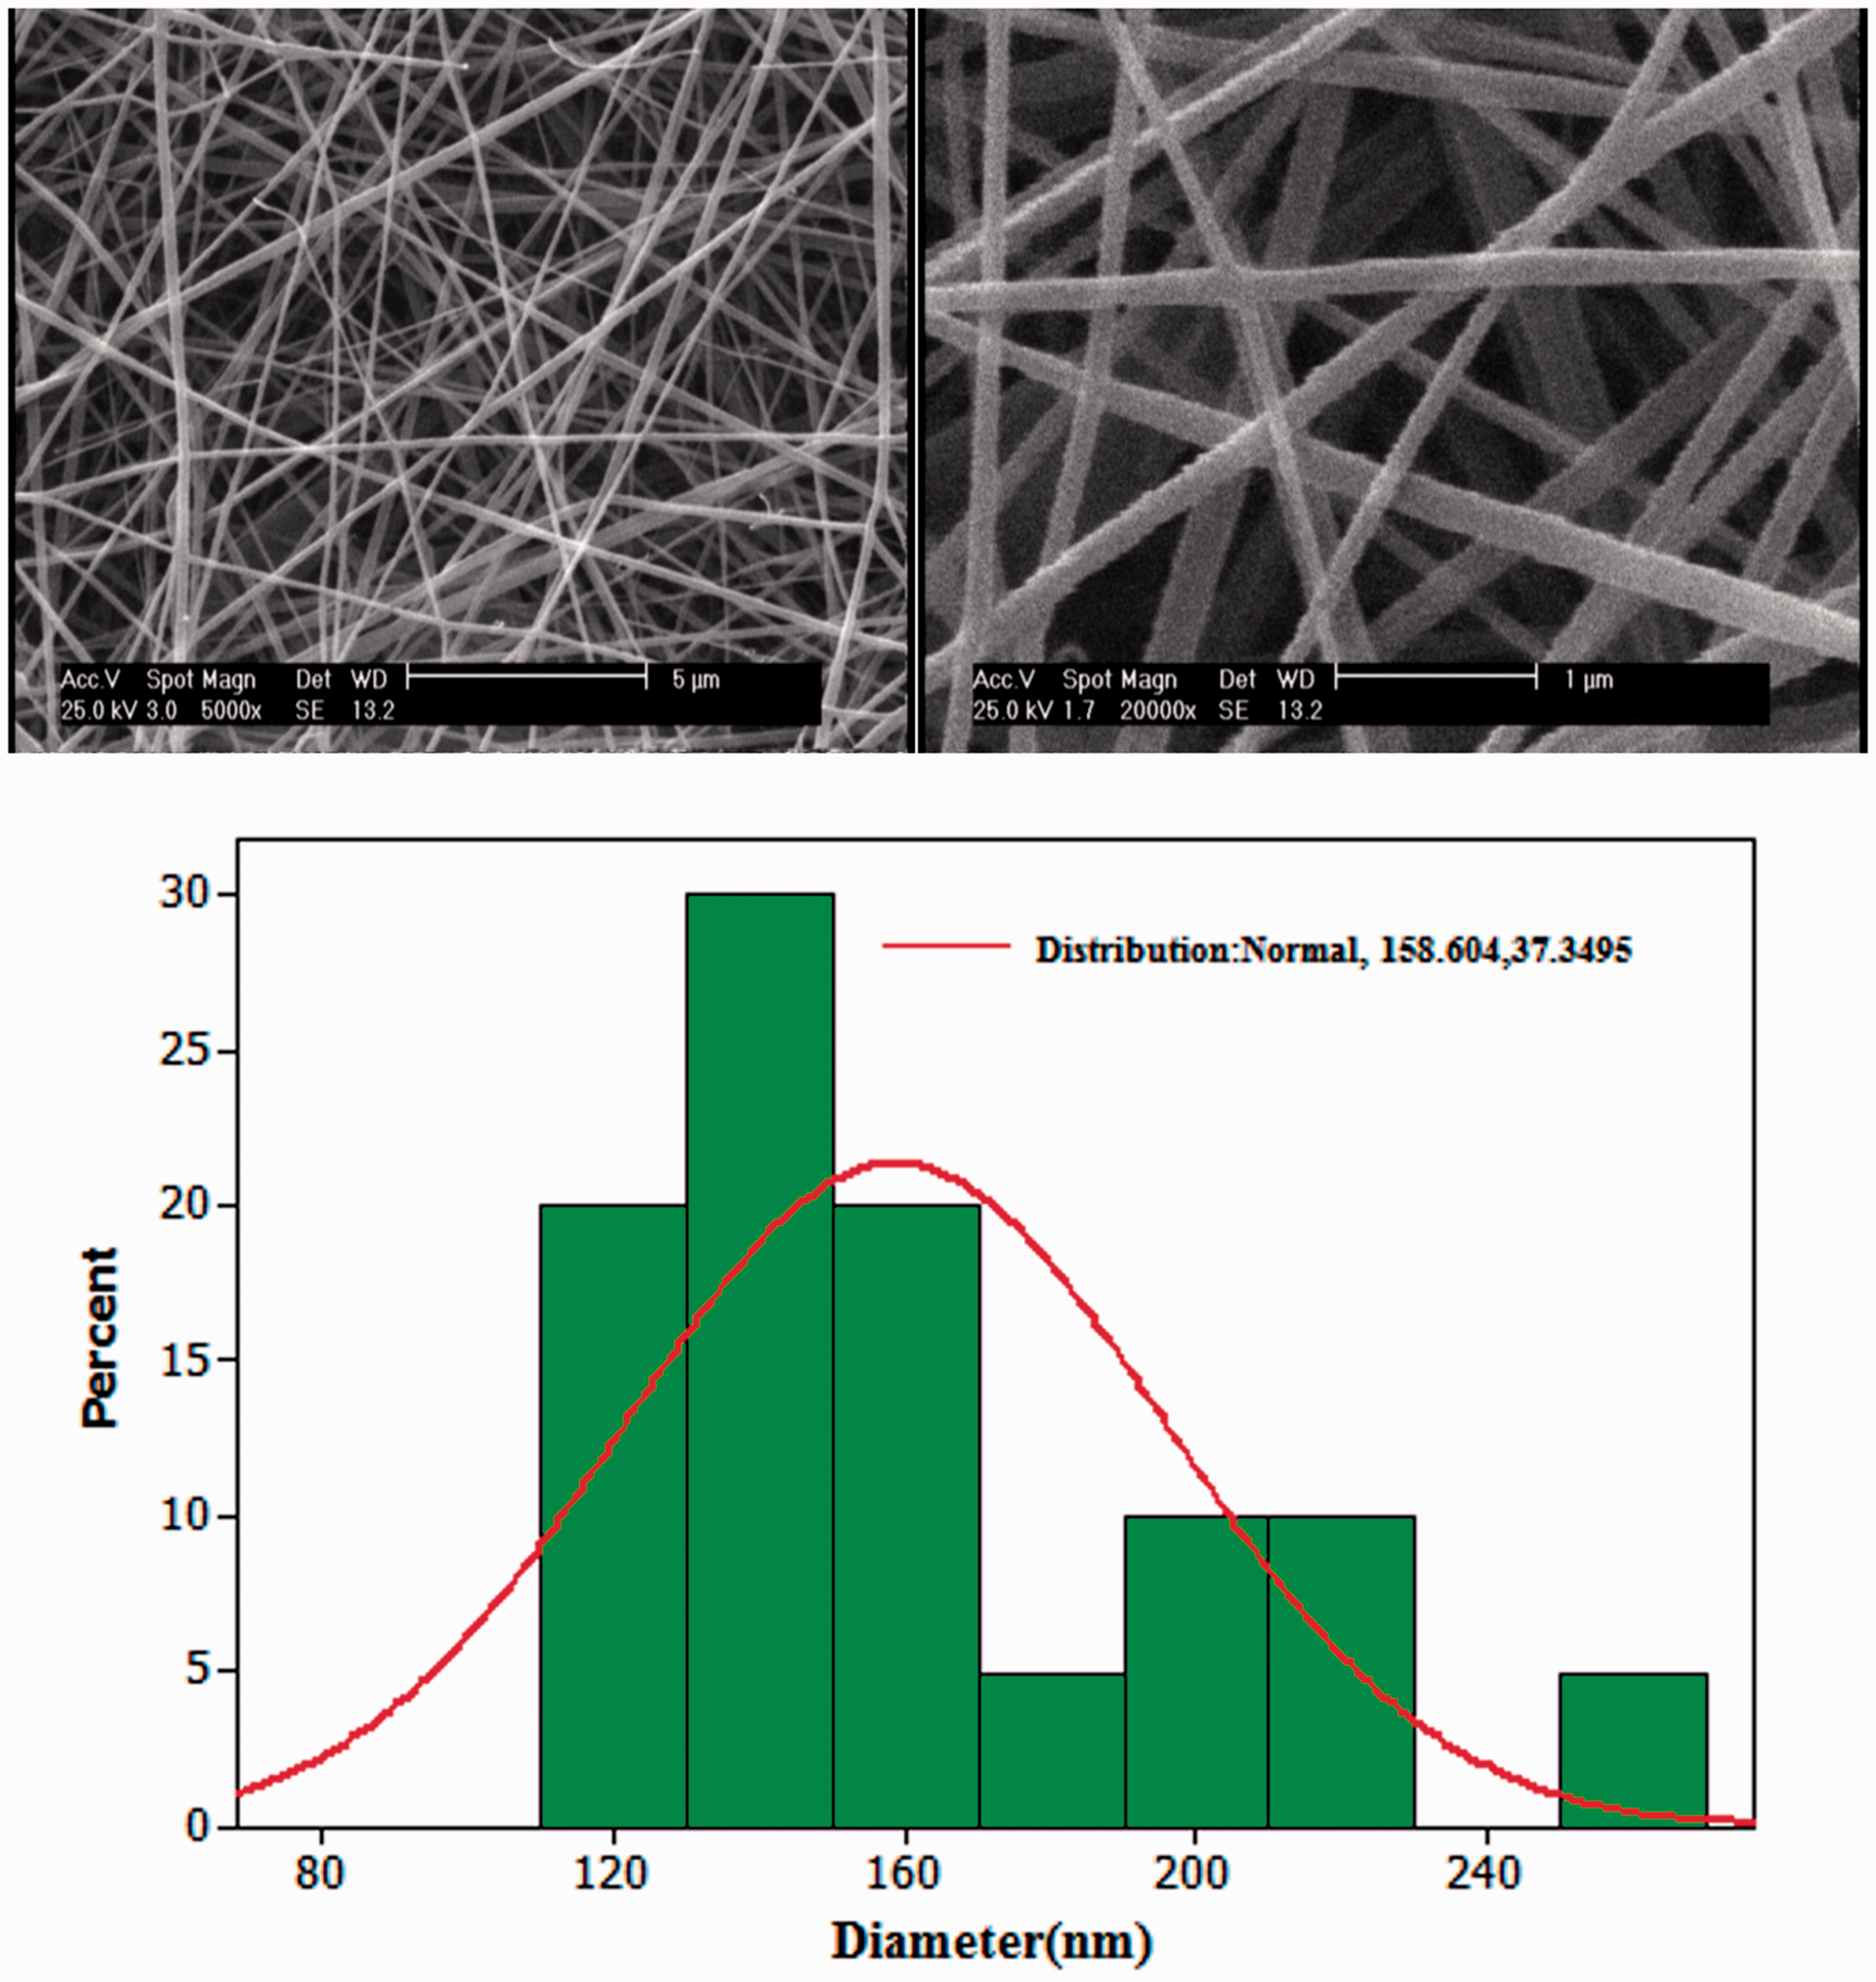
In order to achieve aligned nanofibers, the best collector speed of 2100 r/min could be selected from the results of several experiments performed under the optimal condition in terms of the least diameter and the best structural stability. Figure 10 shows the aligned nanoweb prepared from low molecular weight PVB. The percentage of fiber alignment in nanoweb was calculated by using the SEM images and with the help of MatLab® software. It was found that 70% of nanofibers was aligned, showing a significant degree of nanofiber alignment.
SEM image of nanofiber produced in run no. 9 with a collector speed of 2100 r/min at two magnifications (a: 20 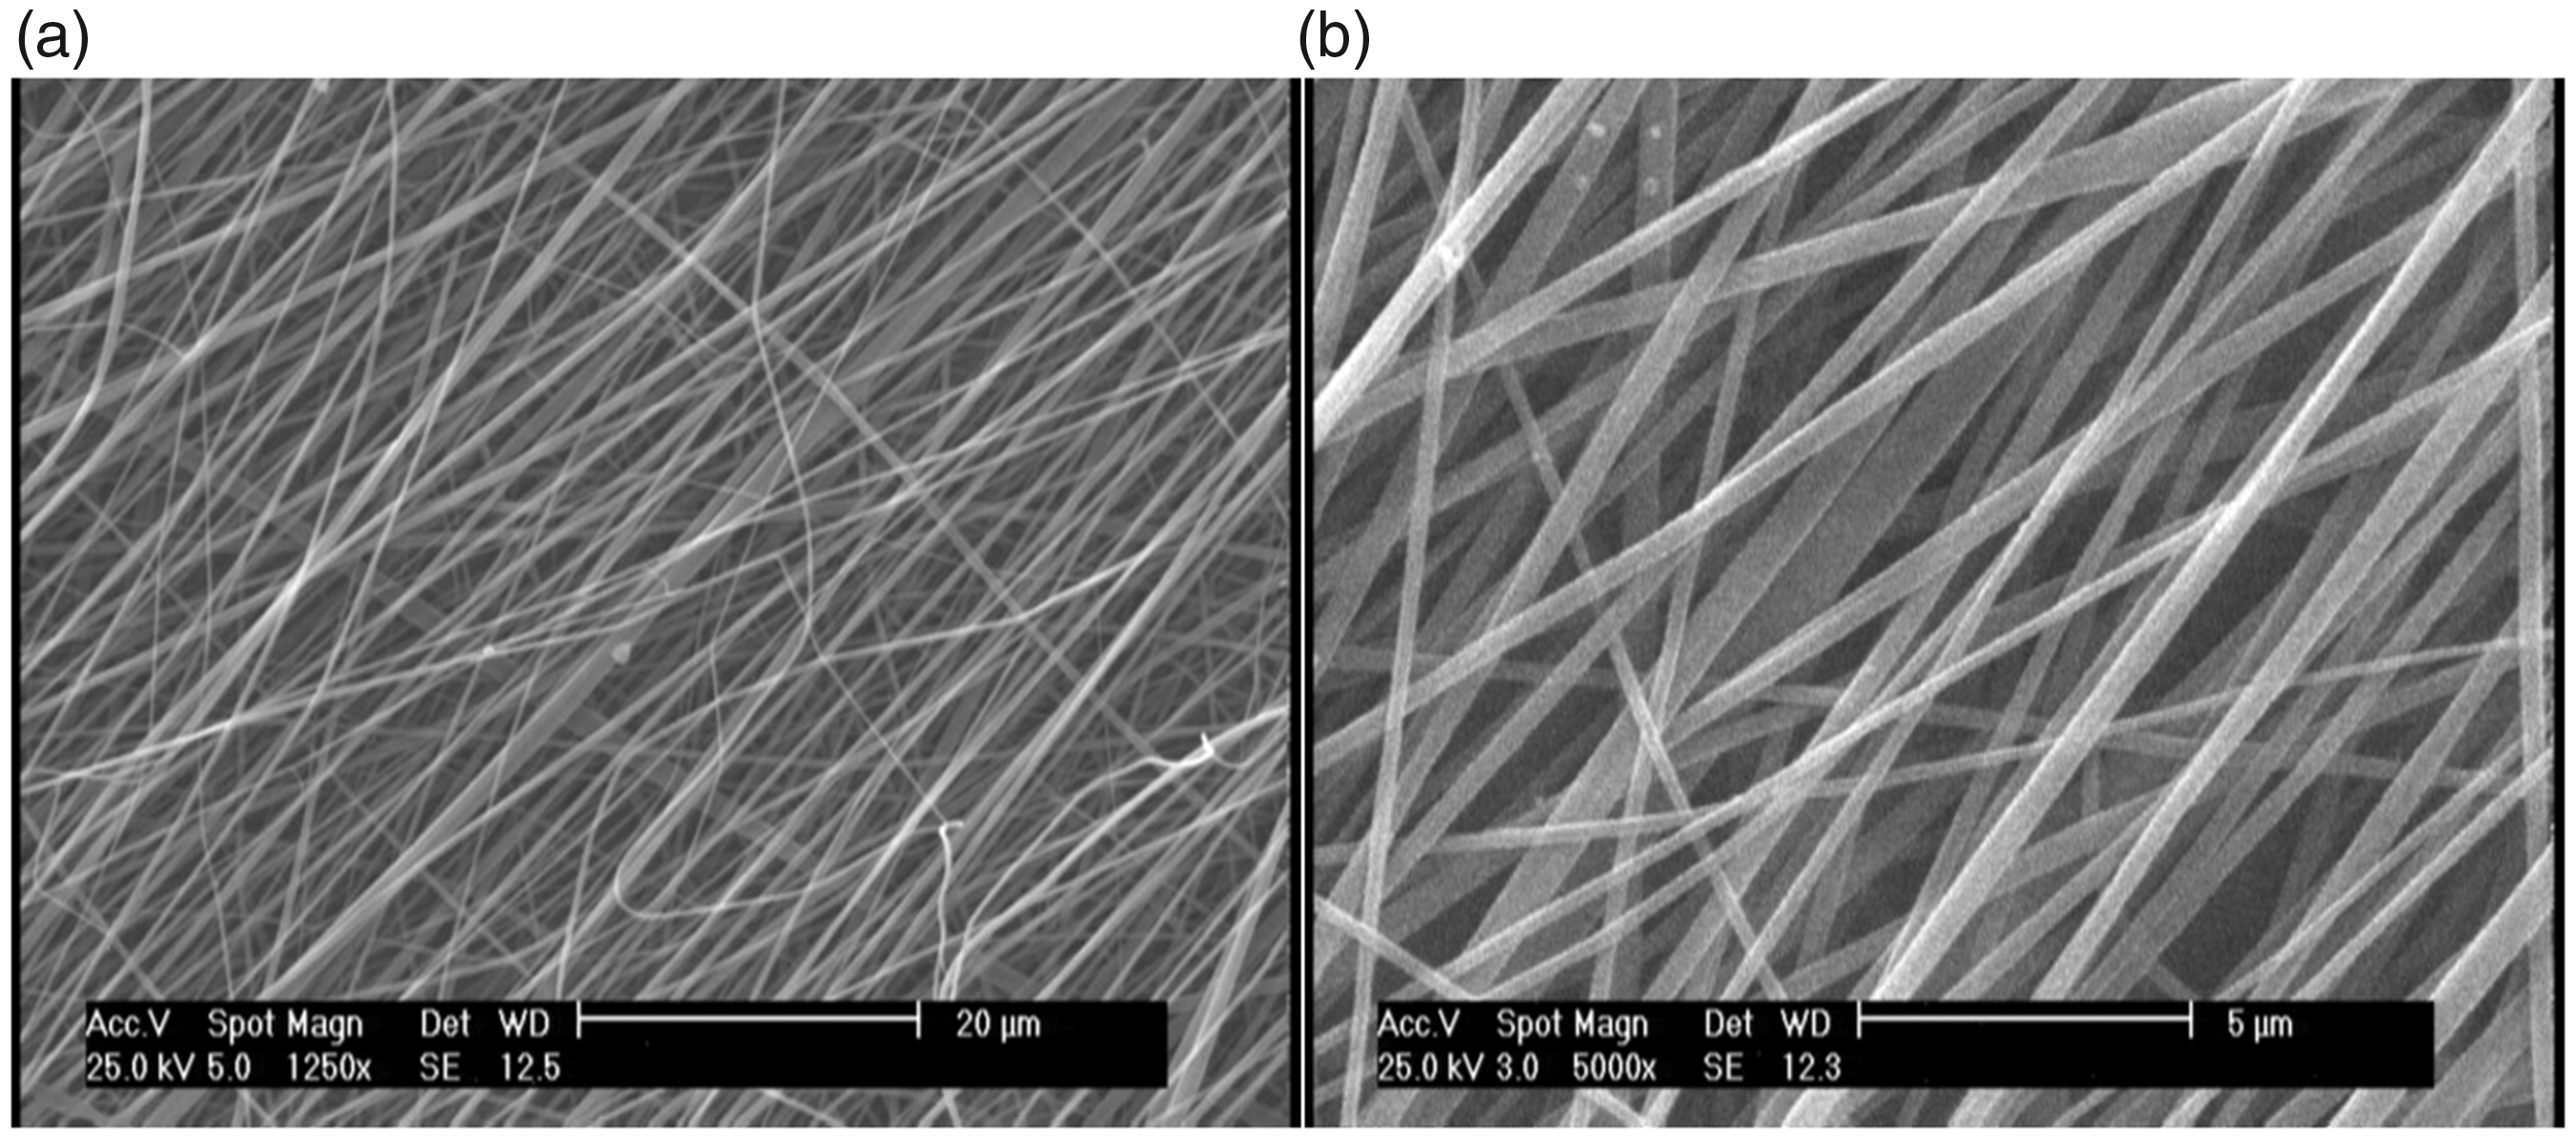
ENF test
Figures 11 and 12 present the force–displacement curves of mode-II fracture tests and GIIC for the reference and the modified laminates. As seen, the PVB-modified specimens have increased the fracture toughness (GIIC) about 25.2% and its maximum force about 40.8%, compared to the reference laminate. The increase in the slope of the force–displacement curves of Figure 11 demonstrates that the stiffness values of modified specimens are higher than that of reference sample, which can be due to the stress and strain fields of both the region close to the initial imperfection and the nano-reinforced layer which may lead to a different force–displacement response. This can be revealed from the regarding diagram as the nano-reinforced specimen starts with the same slope of the reference one, as it is expected, but after imposing a bit more deflection it continues with a different slope showing a piecewise linear manner before the damage starts to degrade the stiffness of both specimens.
Force–displacement curves (ENF tests) for modified and reference laminates. Energy release rate of mode-II fracture (GIIC) for modified and reference laminates.

Due to the excellent adhesion property of PVB and unique property of the nanofiber such as porosity, the aligned PVB nanowebs located in the mid-plane of composite caused to form ductile regions. As seen in Figure 13(a), the fractured surface of reference specimen is completely smooth without any rough zone and the crack is propagated in the brittle region. But as seen in Figure 13(b), the interfacial bond between the PVB nanofiber and phenolic matrix is strong, and, the interlaminar fracture toughness is improved through the bridging mechanism due to the presence of the nanofiber.
(a) SEM images of fractured surface of reference and nano modified (b) SEM: scanning electron microscope.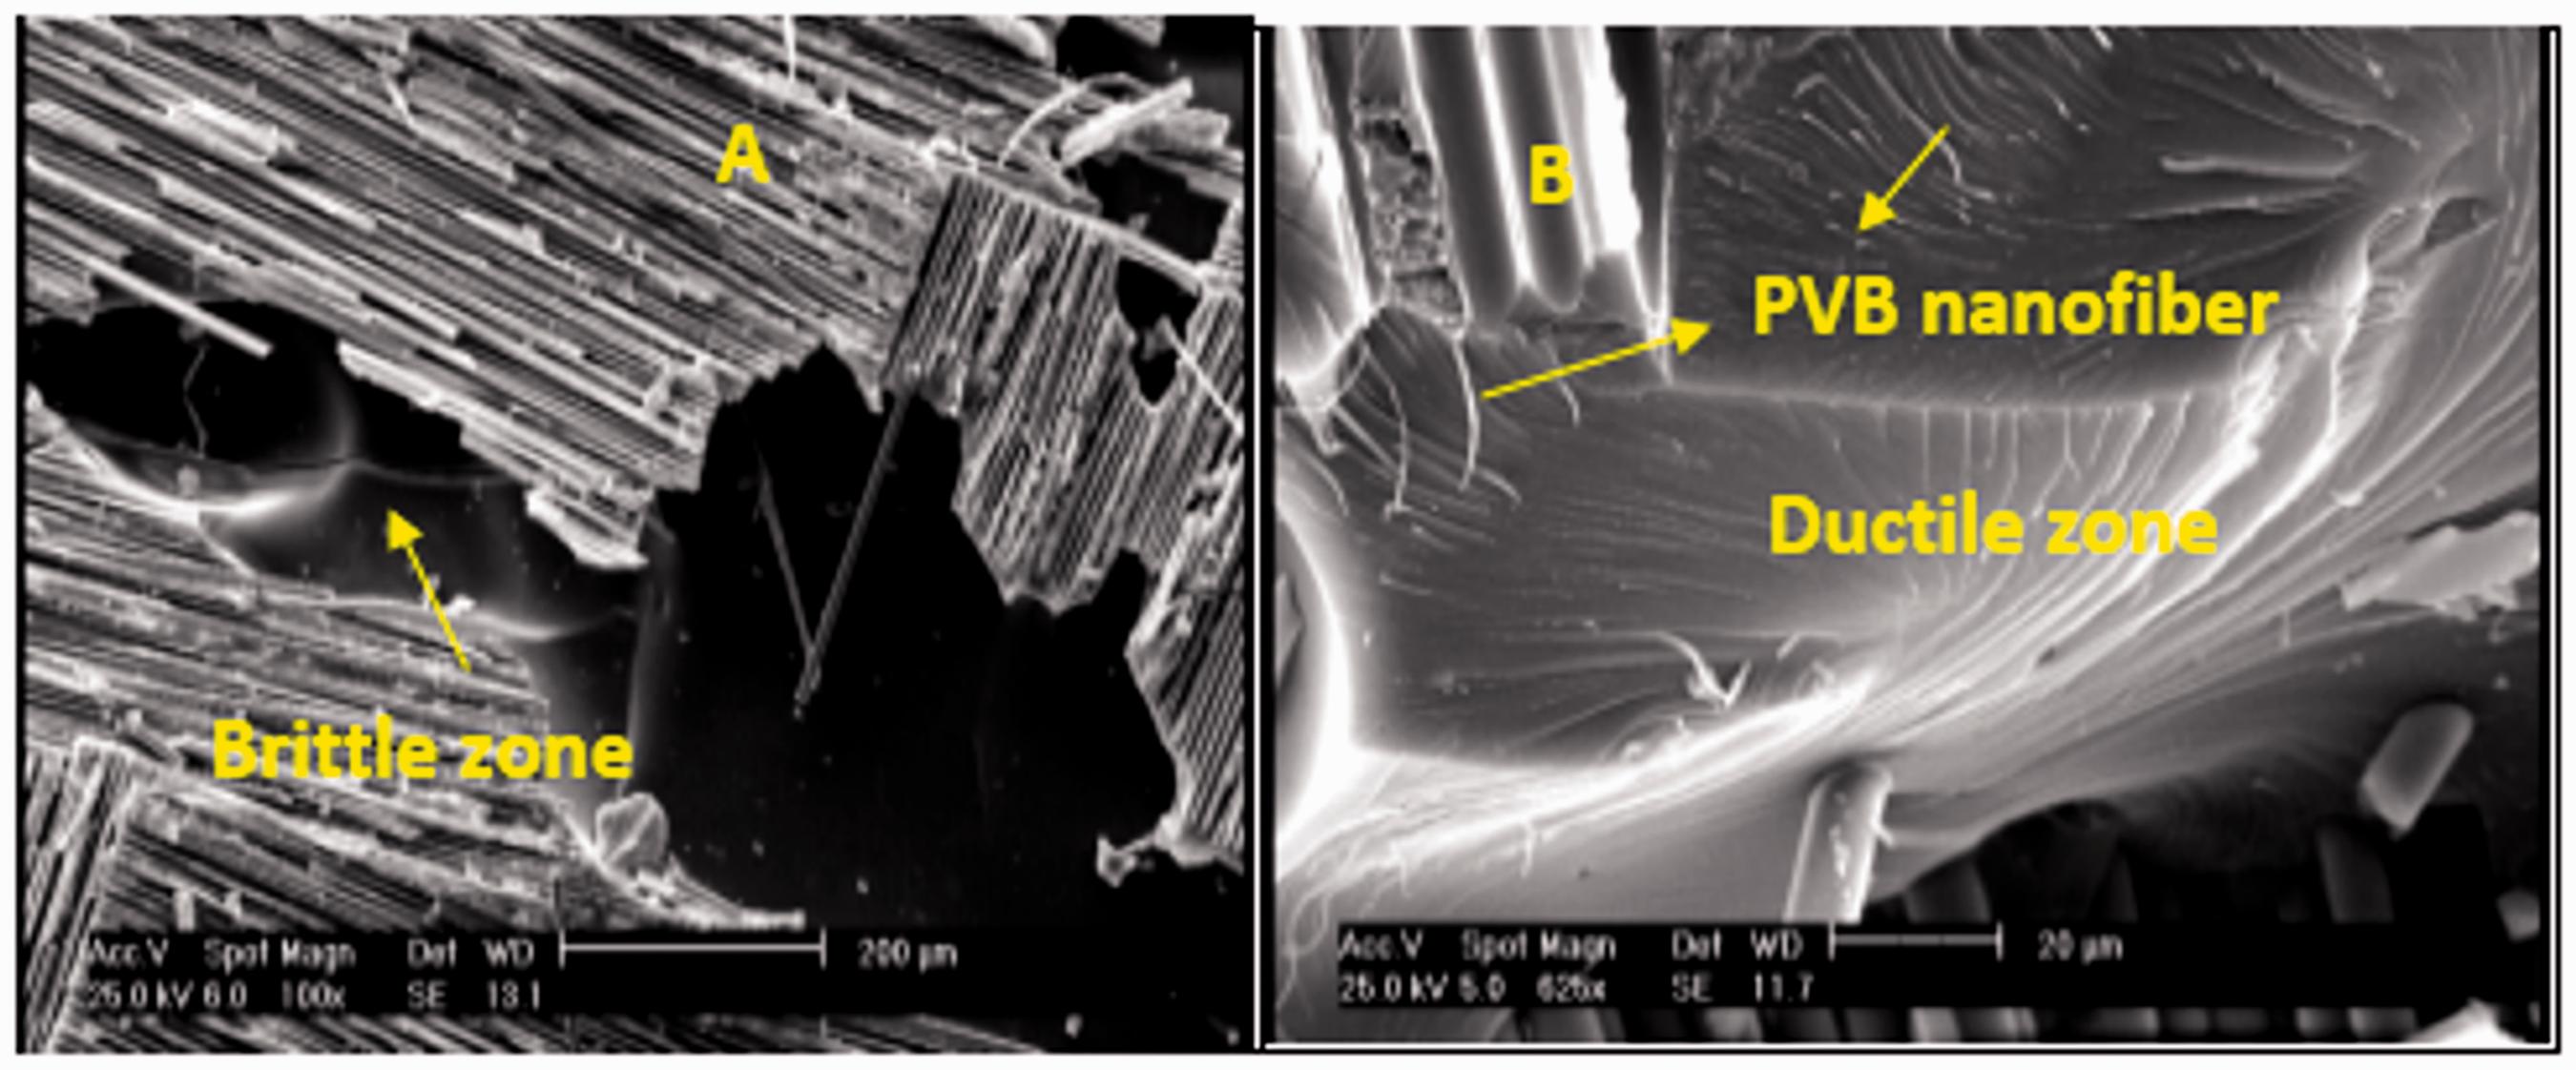
Conclusion
In this research, aligned PVB nanofiber with the least diameter and optimal structure, determined based on an experimental design, was successfully produced from a low molecular weight PVB, in order to demonstrate the importance of correct estimation of diameter and alignment in nanofibers. PVB nanoweb with a thickness of 5
Footnotes
Acknowledgements
Dr. Latifi from Textile department of Amirkabir University of Technology and Dr. Rezadoust from Iran Polymer and Petrochemicals Institute cooperated as the supervisors of Ms. Kheirkhah Ph.D. thesis.
Declaration of conflicting interests
The author(s) declared no potential conflicts of interest with respect to the research, authorship, and/or publication of this article.
Funding
The author(s) disclosed receipt of the following financial support for the research, authorship, and/or publication of this article: This work was supported by the Textile Engineering Department of Amirkabir University, and was also funded by the Electrospinning of Nanofibrous Structures Lab, Amirkabir University of Technology.