
Abstract
This paper describes a self-developed MATLAB program for achieving complex deformation properties and accurate elastic parameters of woven fabrics. Using this program, the response surface analyses of deformation and elastic parameters were conducted to reveal the variation and evolution in stiffness, Poisson’s ratio, and orthotropy of the laminated woven fabric composite under different loading/unloading stages, cycles, stress levels and ratios, which is a further development of our prior work. Results show that elastic parameters and orthotropic characteristics of the material vary noticeably with the loading/unloading stages, cycles, stress levels, and ratios. As higher values are required to model the remarkable warp–weft interaction and large negative strains, Poisson’s ratios in boundary regions with a maximum of 1.0 (loading) or 1.5 (unloading) are outside the bounds normally expected for these parameters. In addition, the proposed method is feasible to evaluate elastic parameters for any stress state, and thereby provides new insights into underlying deformation mechanisms of woven fabric composites.
Keywords
Introduction
Currently, laminated fabrics are mainly used in stratospheric airships (SSAs), which have become a cost effective alternative for telecommunication and science observation as the earth orbit satellites. Due to its greatly expected usage, NASA, ESA, JAXA, etc. have developed plans to utilize SSAs [1–3]. The envelope of the SSAs is made of ultra-light and high strength laminated fabrics [3]. Therefore, the laminated fabrics have also attracted widespread attentions due to their importance in SSAs manufacturing [4,5]. The laminated fabrics provide structural strength for the system and act as the primary barrier between the outside air and lifting gas.
The design of airship structures is complicated by the complex responses of laminated fabrics under in situ loading. A more comprehensive understanding of material properties in the plane stress space may significantly reduce uncertainty in the design and analysis of airship structures, and the accurate determination of elastic parameters is vital to achieve safe and efficient designs of airships. Therefore, this paper attempts to investigate mechanical responses and evaluate elastic parameters of the laminated fabric under different biaxial loading states.
According to recent literature [6–28], mechanical properties of woven fabric composites are typically modeled in three methods, including the elastic matrix method, the mathematical function method, and the micro-mechanics model method [8,9]. The elastic matrix method based on the plane stress orthotropic assumptions is recommended by most of the current design guides or codes [13,14], due to its simplicity in calculating procedure. Uhlemann et al. [15], Galliot and Luchsinger [16,17], Bridgens and Gosling [18], Szostkiewicz and Hamelin [19], and Blum and Bogner [20] used this method to estimate the elastic parameters of coated fabrics by applying special loading histories where warp and weft directions were loaded separately. The second method, i.e. the mathematical function method, is particularly interesting in the case of nonlinear behavior of coated fabrics. Day [21], Testa et al. [22], Galliot and Luchsinger [17], Bridgens et al. [23,24], and Minami [25] used this method to represent the nonlinear responses of fabrics. The last method is the micro-mechanics models, which emphasize the great influence of local weave geometry. Kato et al. [26], Pargana et al. [27], Meng et al. [7], and King et al. [28] successfully applied this method to model the woven fabric composites. More detailed review can be found in Ambroziak and Kłosowski [29,30] and Chen et al. [6,31].
As one kind of mathematical function method, response surfaces method is the most recent method attempting to describe the fabric composites behaviors [17]. This method could directly link the measured strains to the applied stresses through three dimensional representations. Gosling and Bridgens [32], Minami [25], Galliot and Luchsinger [16], and Chen et al. [31] have successfully applied such a method to the investigations of deformation behaviors for fabric composites. This method has potential in detailed analyses of deformation behaviors and mechanism of woven fabrics, and unfortunately, its potentialities in the biaxial response analyses have not been brought into full play.
As we all know, under biaxial loading, the woven fabric composites exhibit obvious geometric and material nonlinearities [16–18]. Due to the frictional effects (inter-fibre and inter-yarn friction), fabric composites could present hysteretic properties. Typical stress–strain curves for laminated or coated fabric under biaxial loads often show two key features of the fabric response: sudden changes in gradient, gradient reversal, and negative strain. These characteristics cause difficulties in exhibiting material responses with a few mechanical parameters, let alone with some estimate ones.
As mentioned above, a better understanding of the behaviors of woven fabric composites could significantly reduce the level of uncertainty in the design process and enable more ambitious architectural forms to be generated [23]. However, currently, insufficient emphasis has been placed on elastic parameters, especially on Poisson ratios which are often evaluated using rules of thumb in real design practices. Use of several assumed values of elastic modulus and Poisson’s ratio for designs of fabric structures potentially reduces the efficiency of these structures. Therefore, for the purpose of reducing uncertainty in the structural design and understanding the deformation mechanism of the fabric composites, it is imperative to investigate the elastic parameters response surfaces of fabric composites in detail.
In addition, many researches have demonstrated that the mechanical properties of woven fabrics are dependent on loading conditions, such as loading speed [9], temperature [33,34], as well as loading modes, such as uniaxial, biaxial, and cyclic tests [6,8,10,35]. Compared with uniaxial mode, the biaxial cyclic tests are more accurate and reasonable if considering the real loading conditions. A survey of the literature shows that biaxial cyclic tests have been performed but just several stress–strain curves at loading stages are available, and it is found that these studies are limited with several stress ratios or loading states and that their analyses could only demonstrate some of the trends without specific values. On the other side, large discrepancies between loading and unloading tensile behaviors, such as residual strains and tangent stiffness [33,35], have shown that response surfaces of different cycles are required to analyze the fabrics components and structures.
Our prior study [31] has referred to the response surface analysis of the deformation and elastic parameters for a fabric composite. However, it has focused only on the applicability of response surface method to calculation of elastic parameters and the comparison with uniaxial results. The variation and evolution in stiffness, Poisson’s ratio, and orthotropic characteristics of the woven fabric composite under different loading/unloading stages, cycles, stress levels and ratios, have not been dealt with or not studied sufficiently in the prior work. There remains a need for a detailed analysis on response surface behaviors of the fabric composite.
This paper aims to investigate the fabric composites’ detailed response characteristics of strain, elastic modulus, Poisson’s ratio, and orthotropic characteristics for all loading/ unloading cycles in the plane stress space, and to discuss the accurate determination of elastic parameters for specific stress states and those mechanical properties evolving with number of cycles, loading/unloading stages and stress states. The study is dedicated to the engineers and designers in order to properly recognize the behaviors of laminated fabrics under biaxial tensile loads.
Experimental program
Materials
In this paper, the envelope material URETEK3216LV shown in Figure 1(b) consists of several functional layers, including the wearable layer, the structural layer, the gas retention layer, and the sealing layer (shown in Figure 1(a)).
The envelope materials, (a) typical cross-sectional image of the laminated fabric and (b) macro morphology.
The structural layer is composed of Vectran fiber plain weave fabric. The high-performance thermoplastic multi-filament yarn is spun from Vectran® liquid crystal polymer (LCP). Vectran® fiber exhibits high strength to weight ratio, low creep, low moisture regain, improved hydrolysis resistance, and excellent cut resistance [36]. The overall properties make the Vectran® fiber a good choice for SSA structures.
Data of the tested laminated fabric.

Tedlar polyvinylflouride film is selected as the helium barrier and the UV radiation protection. The Tedlar film is well known for its excellent resistance to weathering, outstanding mechanical properties, very good UV protection capability, and inertness towards a wide variety of chemicals, solvents, and staining agents [3].
Specimens
The biaxial tests were performed on cruciform specimens with their arms aligned to the warp and weft directions of the fabric, according to the geometry depicted in Figure 2(a) [13]. The specimen is with the cross area of 160 × 160 mm2, and the effective cantilever of 160 mm. The slits were cut in each arm of the specimen in order to obtain a homogeneous tensile stress in the center of the specimen even for large deformations. In addition, the shape of the cross corner was rounded with a radius of 15 mm in order to avoid the stress concentration.
The geometrical dimension of cruciform specimens (a) and the experimental setup for biaxial tests (b).
All specimens were carefully fabricated along the yarn orientations, avoiding the losing of yarns. The effects of bowing or skewing of the fabric during manufacture were minimized by cutting the cruciform specimens from the center of the roll.
Test setup
Cruciform specimens of the laminated fabric were tested on a biaxial testing machine equipped with two orthogonal independent loading axes (Figure 2(b)). Hydraulic power and series of valves which provide power for tester are parametrics controlled to apply any loading spectrum. A unique feature of this test equipment is its feed-back of force which is automatically followed as the loading spectrum rather than constant rate tension (CRT) mode, and this unique feature makes the loading more precise.
The central square of the specimen is 160 mm wide. Each cruciform arm was loaded independently by two clamps mounted on the loading cars. The loading car of each arm was equipped with a load transducer of 100 kN to measure the load applied to the specimen. The strains were measured by the use of two needle extensometers placed in the warp and weft directions and bolted on the test specimen using small diameter screws. The strain gauge length was set to be 28 mm.
Test procedure
In the current work, biaxial tests were to study the stress–strain behavior and to determine the elastic parameters. For this reason it is only necessary to carry out the tests in a relevant load range, which therefore needs to be determined. In the Standard of Membrane Structures Association of Japan (MSAJ) [13], the maximum test load is set to 25% of the lower ultimate tensile strength (UTS) of the strip specimens in two directions. A higher security factor for the materials is needed for the materials in SSAs, and in this study, a security factor of 6 (larger than the security factor of 4 in MSAJ) is used for the laminated fabric.
In the standard of MSAJ, the unloading is required to reach zero in every load cycle, namely there is no pre-stress. However, this condition may be not reasonable for the following reasons: First, an airship structure, despite residual strain of the fabric, must be designed such that a significant level of pre-stress is maintained for the life of the structure to avoid slackness, flapping and probable failure. Then, in order to avoid high initial levels of creep and limit the influence of the recent load history, in the test protocol, starting from and returning to a nonzero pre-stress are appropriate.
Therefore, the biaxial test protocol for this work was modified from that of the MSAJ standard. As shown in Figure 3, instead of a zero stress, a pre-stress of 2.5 kN/m was used in the pre-stressing stage and at the end of each load cycle in order to remove the residual strains and avoid high initial levels of creep. The load profile explored various stress ratios with repeated load cycles. Nine stress ratios of 0:1, 1:3, 1:2, 2:3, 1:1, 3:2, 2:1, 3:1, and 1:0 were adopted and three load cycles were applied for each stress ratio. Before each stress ratio was applied, the sample needed to be first loaded with the stress ratio of 1:1 to a pre-set value, and then released to the pre-stress for three cycles, which is useful to eliminate the effects of creep strains and achieve stable tensile responses of laminated fabrics.
Biaxial test protocol: (a) load history and (b) population of stress space.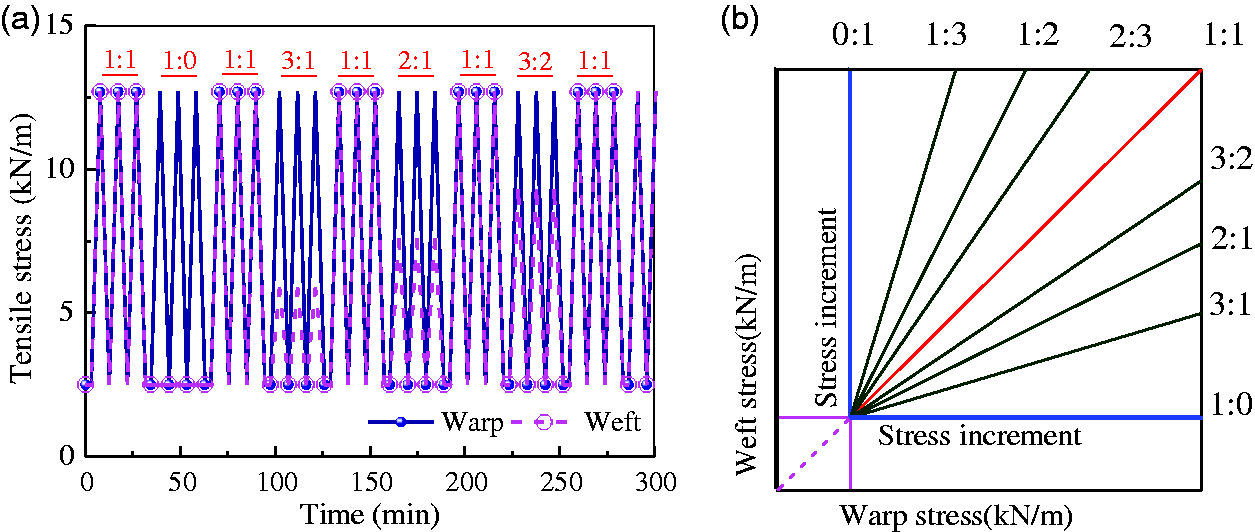
In the biaxial tests, the loading speed in one direction was set 2.0 N/s and that in the perpendicular direction followed the stress ratios determined. For example, for the stress ratio 1:2 (warp: weft), the loading speed in warp and weft directions was set at 1.0 and 2.0 N/s, respectively.
Environmental conditions
All tests were done at a relative humidity of 65 ± 4.0% and a temperature of 20 ± 2.0 ℃ according to the ISO 139-2005 standard [37].
Results and discussion
Experimental results
The stress–strain data are obtained from measured force–displacement data with the following equations

Typical stress–strain curves are plotted in Figure 4 as a function of the stress ratios and number of cycles. Preliminary investigation of the figure shows the following observations.
The stress–strain curves of the laminated fabric exhibit significant material orthotropy. Initial behaviors (namely, the responses of the fabric when it is first loaded) does not tend to be repeatable, and they are typically fundamentally different to cyclic behaviors. Therefore, the first loading curve differs from subsequent loading and unloading curves. Hysteresis loop area and ratcheting strain decrease with number of cycle, and vary with the stress ratio. The lower creep strain increases with the increasing cycle. Loading tangent modulus differs from unloading tangent modulus, and both of them vary with the stress ratio. Unbalanced deformation, i.e. shrinkage of the membrane surface, may occur at certain stress ratios. Typical experimental results of seven ratios: (a) 3:1, (b) 2:1, (c) 3:2, (d) 2:3, (e) 1:2, (f) 1:3, and (g) 1:1.

These observations mean that the stress ratio is a main factor affecting mechanical properties as the tangent moduli and ratcheting strain vary noticeably with the stress ratio. To quantify these observations effectively and accurately, this paper employs a MATLAB program to determine the mechanical properties and elastic parameters of the studied material (Figure 5). In Figure 5, σ is the stress, ɛ is the strain, N stands for cycle number, and Ap and Flowchart of the MATLAB program.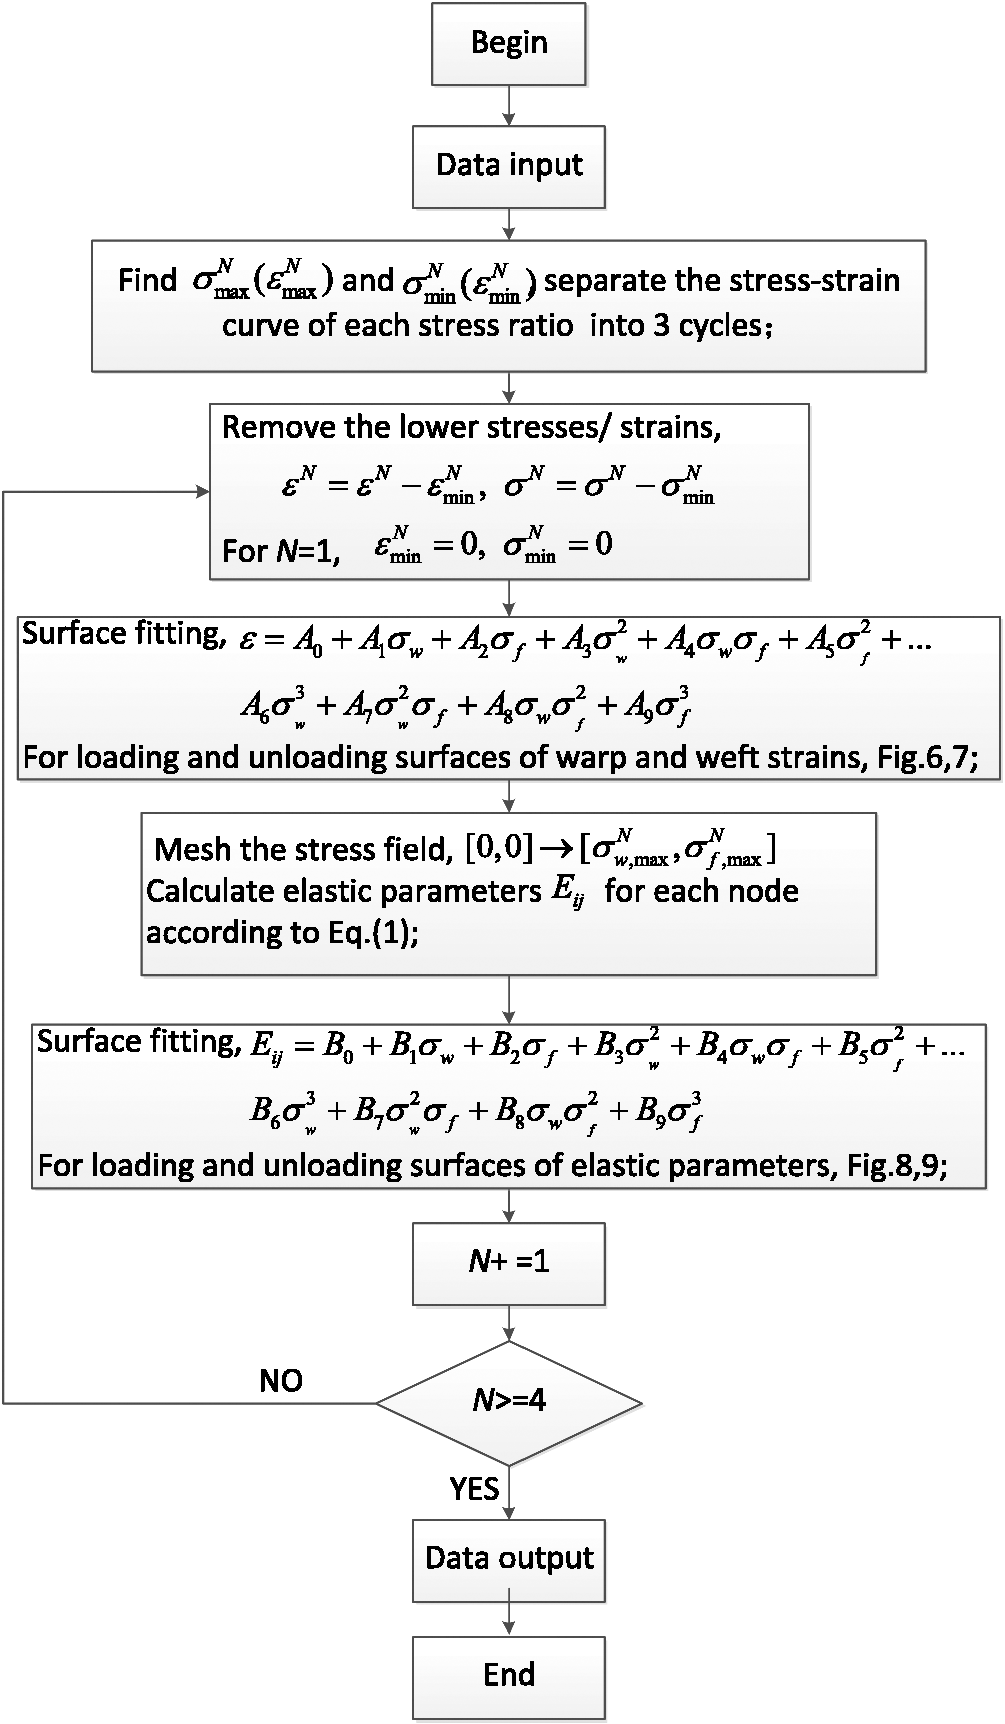
Analysis of results and discussion
The biaxial tensile deformation and elastic parameters responses are processed by a newly-developed MATLAB program. In this section, the detailed methods integrated in the program are presented. Then, the mechanical properties are discussed in the following paragraphs respectively.
Strain response surfaces
The strain response surface is a mechanical property expressing stress–strain relation in a plane stress field and directly used as the basis for structural analysis. According to the results in Figures 6 and 7, it is found that the first cycle deformation response is different from deformation responses of the subsequent cycles, and that loading and unloading deformation responses are different for the woven composites. Therefore, the strain response surface needs to be divided into three kinds, i.e. first loading surface, subsequent loading surface, and unloading surface.
Biaxial strain response surfaces for the (a) 1st, (b) 2nd, and (c) 3rd loading cycles. Biaxial strain response surfaces for the (a) 1st, (b) 2nd, and (c) 3rd unloading cycles.

Loading strain response surfaces
Based on the response surface method, the strain response surfaces of the material URETEK3216LV under loading and unloading stages (shown in Figures 6 and 7, respectively) are obtained. These surfaces in Figures 6 and 7 are drawn using the measured stress–strain curves relating those nine stress ratios shown in Figure 4. As shown in Figures 6 and 7, the response surfaces could enable a detailed representation of the material behaviors, such as surface fluctuations and orthotropic characteristics, which could prove the accuracy and reliability of simulations by this MATLAB program.
For the loading stages, typical loading strain response surfaces for three cycles are plotted in Figure 6. A preliminary analysis of these surfaces could obtain the following observations.
The response surface method could represent the relations between stress and strain intuitively and enable a better representation of the mechanical characteristics. Many large fluctuations could be found in each cycle, and the material shows obvious nonlinearity despite having been loaded for two cycles. The strain range decreased with loading cycle, and the strain range in the 3rd cycle was about half of that in the 1st cycle. The distances between symmetry line and intersection points of the two surfaces could reveal the level of material orthotropy. Apparent orthotropy existed in all cycles as obvious misalignment between symmetry line and intersection line (indicated by intersection points) of the two surfaces was observed. As shown in Figure 6, the distance from intersection points to symmetry lines of the 3rd cycle was fairly small when compared with that of 1st cycle. In other words, the orthotropic characteristics became progressively less obvious with increasing cycle number.
Unloading strain response surfaces
Typical unloading strain response surfaces evolving with unloading cycles were depicted in Figure 7. A preliminary estimation of these experimental results could get the following observations.
The similarity between two unloading cycles was much higher than that between the corresponding loading cycles. The responses in unloading stage became stable after loading stage; however, apparent nonlinearity still existed in all cycles as obvious “crimps” in the margin of surfaces were observed, due to the viscoelasticity of the composite material constituents. Most of the intersection points were uniformly distributing in the vicinity of the symmetry line. The distance from intersection points to symmetry lines in unloading surfaces were fairly small when compared with that of loading surfaces in Figure 6. Despite smaller distance from intersection points to symmetry lines, the mechanical responses of two directions presented orthotropy in all cycles, which is also progressively less obvious with increasing cycle number.
As listed above, the loading/unloading response surface analysis could provide useful guide for further investigations on mechanical properties of fabrics, such as the ratcheting behaviors and deformation mechanism.
Elastic parameters response surfaces
Most of the studies about envelope fabrics rarely touched the issues of elastic parameters response surfaces and evaluation of elastic parameters for specific stress levels and stress ratios. In order to reveal the complex response of elastic parameters in the plane stress space, a new method is needed and interpreted as follows.
Mesh. Each loading and unloading stress space are meshed by 1600 square elements. This is based on the findings that the surface fitting with the stress increment of 0.25 kN/m in the 1st cycle shows good accuracy. Calculate. The commentary to the MSAJ standard [13] provides multiple methods for calculation of these elastic constants. In this work, the elastic parameters
where ɛ = strain, σ = stress, E = elastic modulus, and v = Poisson’s ratio, and subscriptsf and wdenote weft/fill and warp directions, respectively.
As the laminated woven fabrics are not homogeneous materials, and there are obvious interaction of warp and weft yarns and complex behaviors of the twisted yarn structure. Therefore, in this work, the constraint of reciprocal relationship [31] has not been used in calculations of the elastic parameters. Proceeding in the same way for other groups of nodes and repeating the procedure just mentioned, elastic parameters for all nodes will be obtained.
Surface fit. Having the values of elastic parameters for all the nodes, interpolating surfaces that pass through all data points were generated using the Matlab meshgrid and surfc functions. In the interpolating surfaces (illustrated by Figures 8 and 9), the colored contour is used to enable numerical comparisons of the elastic parameters for different stress states.
Elastic modulus response surfaces for the (a) 1st, (b) 2nd, and (c) 3rd cycles. Poisson’s ratio response surfaces for the (a) 1st, (b) 2nd, and (c) 3rd cycles.


The elastic parameter response surfaces are very important for characterizing the mechanical behaviors of woven fabric composites. The elastic parameter response surfaces contains lots of information, and they deserve to be referred to by a set of parameters describing the whole response surface instead of by some medium values alone. Such a set of parameters can be obtained by fitting a mathematical model (shown in Figure 5) to the response surfaces obtained above.
Elastic modulus
Typical elastic modulus response surfaces for three cycles were plotted in Figure 8. The elastic parameters response surfaces can represent the distribution of these parameters clearly in different stress states, including different stress levels and stress ratios. The detailed study of the elastic modulus response surfaces could get the following observations.
Overall, the elastic modulus response surfaces in the 2nd and 3rd cycles are approximate to each other, but considerably different from those in the 1st cycle. The cyclic loading history could change the crimp level and relative positions of warp and weft yarns, and these changes then lead to the geometric nonlinearity effects and affect the biaxial elastic parameters of the fabric material. Hence, there are two distinct peaks in first cycle surfaces, while in the second and third cycles, these peaks disappeared and some other peaks appeared. There still exist some small differences in the response characteristics, especially in two corners A and B of the stress space (depicted in unloading surfaces of Figure 8(b) and (c)). The modulus response behaviors of the laminated fabric exhibits a significant orthotropy. The modulus of warp direction (as shown in Figure 8) is approximately 15% higher than that of weft direction, especially for the unloading stage. This could be due to the fact that weft yarns with slightly higher initial crimps have sustained more damage during weaving [6,39]. During the material manufacturing process, the warp yarns are often pre-tensioned and the weft yarns are winded alternately around the warp yarns, and therefore the initial waviness of the warp yarns is much lower than that of the weft yarns. The yarn waviness directly affects the elastic moduli of woven fabrics [40,41]. Hence, it is unavoidable to observe the significant differences between the elastic modulus response surfaces of warp and weft directions. According to the Figure 8, the moduli in both directions fluctuate over the stress space. There are some distinct peaks and valleys in every response surface. However, for the unloading stage, some peaks cannot be fully distinguished in weft direction, and there are some differences in peak and valley values and locations between the two directions. Typical distributions of peaks and valleys for different stress states and loading stages are shown in Figure 10. As shown in Figure 10, the high modulus regions or peaks tend to occur in the high stress states, such as some sidelines and corners in the stress space, and the low modulus regions or valleys occur in the medium stress states, i.e. the central zone of the stress space. Although the responses of the 1st cycle are in line with those of other cycles, some insignificant differences still exist in these responses, especially for the loading stages. For the peak regions A and B of the unloading surfaces (see Figure 8 (b) and (c)), due to the viscoelasticity of the materials, the elastic moduli increase firstly and then decrease, especially in the warp direction. That is to say, elastic parameters responses of the studied material are variable and complex in the transition stages of loading and unloading cycles, which is probably related to the complex twisted yarn structure and the inherent material properties of yarns and other laminated layers. As illustrated by Figure 8, there are many obvious differences between these response surfaces, in terms of values and distributions of the peaks and valleys. These differences could also be attributed to the inherent hysteretic behaviors of the constituent materials and geometric nonlinearity effects of the complex twisted yarn structure. In detail, Chen et al. [6], Gosling and Bridgens [32], Ambroziak and Kłosowski [35] show that under cyclic biaxial loading woven fabrics exhibit inelastic deformation and hysteresis effect, resulting in the variation and evolution in stiffness of fabric materials. Meanwhile, Whitcomb and Tang [40], Chen and Chen [41], and Sun et al. [42] found that the cyclic/ mono loading history could change the crimp level of yarns, which leads to the geometric nonlinearity effects and affects the biaxial tensile characteristics and elastic parameters of the woven fabrics. As we all know, the effect of repeated cycles of environmental loading on a fabric structure (e.g. wind loading), could be simulated by applying cyclic loads at various load ratios. Cyclic tests of fabric materials provide stiffness and residual strain information appropriate for medium to long-term structural designs. Therefore, in order to achieve safe and efficient designs of fabric structures, the differences in mechanical responses between unloading and loading stages should be considered in the determination of elastic parameters.
Typical elastic modulus distributions for the (a) 1st and (b) 3rd cycles.

Poisson’s ratio
As indicated in Figure 9, similarly to the results of elastic moduli, obvious differences of Poisson’s ratios between unloading and loading stages could also be observed in terms of values and distributions of the peaks and valleys. The Poisson’s ratios fluctuate between 0 and 1.0 in loading stage and between −0.5 and 1.5 in unloading stage over the whole stress space. Both the minimum (absolute value) and maximum values in unloading stage are slightly larger than those corresponding values in loading stage, which indicates that strong interactions of weft and warp yarns and complex deformation mechanism have occurred in the unloading stage. Meanwhile, for the loading stage, the Poisson’s ratio response surfaces in the 2nd and 3rd cycles are also approximate to each other, but considerably different from those in the 1st cycle. However, for the unloading stage, all surfaces are quite similar to each other no matter in which cycle.
Besides, the stress states affect the Poisson’s ratios remarkably, especially for those zones near the sidelines of the stress space. However, in the central zone of the stress space, the Poisson’s ratios could reach a plateau at about 0.30 for vwf and 0.40 for vfw, respectively. The Poisson’s ratios in the boundary region with a maximum of 1.0 (loading) or 1.5 (unloading), are outside the bounds normally expected for these parameters. According to the plane stress theory Poisson’s ratio cannot exceed 0.5, but, higher values are required to model the high level of warp-weft interactions and large negative strains occurring during the tests [23,24,32]. Additionally, for the studied material, the weft-warp Poisson’s ratio (ν fw ) is consistently higher than the warp-weft values (ν wf ), which results from the unbalanced yarn twisted structures in two directions.
Elastic parameters for specific stress states
A weighted average method of integrals is proposed to calculate the representative elastic parameters 

The weight factor Typical stress states in the stress space: (a) central zone and (b) constant stress level in one direction. Elastic parameters of central zone I0 in different loading/unloading cycles. Typical elastic parameters–stress relationship for the 3rd unloading cycle: (a) Ef, and (b) vfw.


As listed in Table 2, in the central zone I0 (see Figure 11(a)), the elastic parameters of three cycles are close to each other, especially for the Poisson’s ratios in the unloading stage in which the 2nd and 3rd cycles show almost the same values as the 1st cycle. Hence, in order to obtain reasonable and accurate structural design and analysis, it would be more reasonable to select these central zones for the evaluation of elastic parameters. As the results in the 3rd cycle are more representative than those in other two cycles for the actual structural design, the influences of stress level on the elastic parameters shown by Figure 12 are discussed only for the 3rd cycle.
As illustrated by Figure 12, when the stress in one direction keeps constant, generally speaking, the elastic parameters vary regularly with the stress level in the other direction except in some special stress states, such as high (6.0 kN/m) and low (1.5 kN/m) stress levels which mainly correspond to borders of the stress space in Figures 8 and 9. What’s more, the elastic parameters vary considerably among stress states (see Figure 12), particularly for the low and high stress levels, which has greatly exceeded our expectation, and thus for good predictability of stress distributions and deformations of laminated fabrics, the effects of stress levels on elastic parameters should be considered. In the real design practice, it might be more reasonable to use elastic parameters which are determined for specific stress distributions depending on the project’s needs. Additionally, the existence of large or negative Poisson’s ratios, such as 0.68 and −0.85 of vfw in Figure 12(b), probably also results from the high level of warp-weft interaction and obvious nonlinear behaviors occurring in woven fabrics under biaxial stress states [31,43,44]. The mechanism inside this phenomenon can be complex and hard to interpret using the traditional theory, so more work is needed to establish nonlinear micromechanical models to reveal the nonlinear deformation mechanism of laminated fabrics affected by their internal and external factors.
Conclusions
The elastic modulus, Poisson’s ratio, and orthotropic characteristics of the laminated fabric evolve with the number of cycles, loading/unloading stages, and stress states. There are many obvious differences between the response surfaces in loading and unloading stages, in terms of values and distributions of the peaks and valleys, which results from the inherent hysteretic behavior of the constituent materials and the geometric nonlinearity effects of the complex twisted yarn structure. Elastic parameters responses of the laminated fabric are variable and complex in the transition stages of loading and unloading cycles, which is probably related to the complex twisted yarn structure and the inherent material properties of yarns and other laminated layers. Therefore, the elastic parameters vary significantly in those zones near sidelines of the stress space. As higher values are required to model the high level of warp-weft interaction and large negative strains which occur in woven fabrics under biaxial loading, Poisson’s ratios in the boundary regions with a maximum of 1.0 (loading) or 1.5 (unloading), are outside the bounds normally expected for these parameters.
The results provide compelling evidence for understanding biaxial cyclic mechanical properties of laminated fabrics and suggest that the constitutive relation of traditional materials does not apply to the laminated fabrics and that their deformation mechanisms are complex and stress-states dependent. It is evident that the weighted average method of integrals is feasible to evaluate the elastic parameters of laminated fabrics for any stress states. Therefore, this method may offer potential access to obtain accurate design and analysis of the membrane structures, including the airship structures, under specific stress states. As this work is the experiment study on the mechanical properties of laminated fabrics, future work will focus on deriving constitutive equations of the studied material.
Footnotes
Acknowledgements
Some of the tests were conducted in School of Naval Architecture, Ocean & Civil Engineering, Shanghai Jiao Tong University. The authors acknowledge with thanks all these help and other unmentioned ones.
Declaration of conflicting interests
The author(s) declared no potential conflicts of interest with respect to the research, authorship, and/or publication of this article.
Funding
The author(s) disclosed receipt of the following financial support for the research, authorship, and/or publication of this article: This work was supported by the National Natural Science Foundation of China (Grant No. 51608270), the Fundamental Research Program (Natural Science Foundation) of Jiangsu Province (Grant No. BK20150775), the Fundamental Research Funds for the Central Universities (Grant No. 30916011342), and the China Postdoctoral Science Foundation (Grant Nos. 2016M601816 and 2017T100371).