
Abstract
Determination of Poisson’s ratio and shear module of complex, nonlinear elastic material, such as woven fabric, is a challenge for researchers in the field of textile mechanics. In the standard method of determining the Poisson’s ratio, the transverse fabric strain is measured by a 1% tensile extension. In this way, there is no information about changing the Poisson’s ratio at higher tensile extensions, and the methodology itself is unsuitable for larger extensions because of woven fabric buckling. In this research, a device has been designed, which can be built on a dynamometer and which has the ability to measure transverse forces in fabric during tensile test. A mechanical model is developed from which it is possible to calculate Poisson’s ratio throughout the fabric stress–strain curve.
Introduction
During uniaxial stretching or compression of rigid materials, deformation occurs, not only in the direction of force but also in the lateral direction. 1 This phenomenon is called the Poisson’s effect, and in textile materials, it is manifested in the way that tensile stretching of the material emerges in the direction of the applied force while the material narrows in the transverse direction. This property is important for many engineering applications and computer simulations, and has been studied in many researches.1–9
The problem of determining Poisson’s fabric ratio is the subject of many researches. In 1963, Kilby had developed a simple grid model and studied the strain/stretch ratio where he observed the correlation between the Poisson’s coefficient, shear modules, and elastic fabric modules. However, to date, a small number of researches concerned the influence of geometrical and structural properties of the fabric and the mechanical properties of the yarn at the Poisson’s ratio. 7
Poisson’s ratio is still difficult to accurately determine in empirics and theory. The common method of determining the Poisson’s ratio is to measure the displacement of the markings on the sample subjected to the standard tensile test on the dynamometer, by video analysis in one of the computer programs intended for that purpose. It is important to emphasize that this method has the following disadvantages:
The sample is marked at a time when it is not yet preloaded, and it is necessary to examine the importance of the sample preloading in the lateral direction.
It can only be stretched to a certain percentage, because at higher values of tensile stretching, the sample begins to buckle in the form of transverse curvature, that is, deplanate, and the analysis of the displacement of the markings by the analysis of the image in the two-dimensional projection becomes unproductive.
Poisson’s values in homogeneous, isotropic, elastic materials range between 0 and 0.5. Thus, the appearance of the Poisson’s ratio higher than 0.5 may be extremely significant in non-homogeneous materials due to the specificity of their structure and this is a common case for woven fabrics.
In this article, it is assumed that the application of Hooke’s law is adequate for the description of deformation of woven fabrics, at least in the incremental form, where current value of Poisson’s ratio, just like the tensile modulus, depends on the deformation rather than being considered as material constant. More sophisticated recently developed material models, such as Neo-Hookean, Mooney–Rivlin, Ogden, and the like, devoted to advanced nonlinear analyses, therefore remain beyond the scope of this work.
Mechanics of elastic materials
The material is ideally elastic if it is deformed under the influence of the current load, and is completely returned to its original form and size after the load being released. 10 Although the mechanical properties of the fabric are generally nonlinear, they can be subdivided into linearly elastic orthotropic materials (panels) in a numerical model in cases where the deformation is very small. For orthotropic materials, the relationship between strain and stretching is defined by Hooke’s law.
The mechanical behavior of woven fabric subjected to the tensile load is not linearly elastic, but in the surrounding area of a certain point on the stress–strain diagram, it is possible to linearize the deformation behavior. In this case, it is assumed that the modulus of elasticity is incremental or tangent, so that the Poisson’s factor is also current, that is, it does not apply to the entire range of deformations but to the narrow range in which the whole case is linearized. However, in some cases of woven fabrics with low crimp (i.e. satin weave), the linear approximation may adequately describe the deformation properties of the material and then there is no need for incremental approach.
Hooke’s law for elastic, orthotropic material
Orthotropic materials are a special type of anisotropic material having mutually perpendicular plane of elastic symmetry called the orthotropic plane. 11 The material has a plane of elastic symmetry, if at the reflection of the coordinate system on that plane, the components of the stiffness tensor Cijkm, or the compliance tensor Sijkm do not change. At reflection, the coordinate system goes from left to right and vice versa.
Materials having two mutually perpendicular planes of elastic symmetry necessarily have the third plane of elastic symmetry which is also perpendicular to the first two. Such materials are called orthotropic materials.
These materials have nine mutually independent elasticity constants. If the coordinate axes coincide with orthotropy axes, the elasticity constants are called the main constants of elasticity. When it comes to a flat plate lying in the plane 0 × 1 × 2 and in which the equilibrium state of the stress is in place, only those constants in the index that do not have three, that is, S1111, S1122, S1212, and S2222., appear in the Hooke’s law.
In this case, only four mutually independent elasticity constants are used
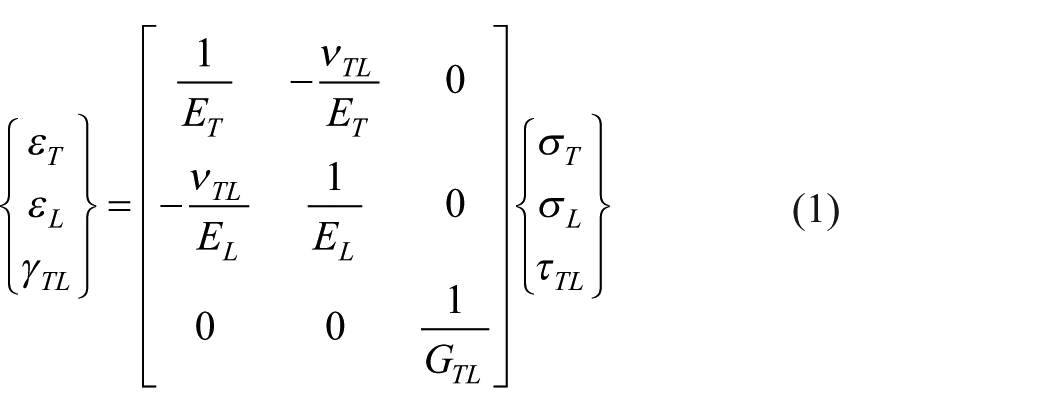
Equation (1) is valid for an elastic, planar, orthotropic material in which T and L are the main directions, respectively, directions of elastic symmetry in the material. The properties of the material in these two main directions may differ, and therefore the elastic modulus may also be distinguished. Because of this, a shear module can occur which is such that when rotating it gives different values of the tensile module. From equation (1), it is evident that there is still symmetry in relation to the main diagonal. Hooke’s law for orthotropic material is somewhat similar to Hooke’s law for isotropic material in which nulls in the matrix show that there is no relation between relative linear extension and shear stress, that is, between angular deformation and normal stress. In orthotropic material, the modules are no longer the same in two main directions and the shear module is independent. However, with orthotropic materials, this is valid only in the main directions of symmetry, because when the coordinate axes turn to an arbitrary position (in equation (2) denoted as “xy”), the matrix is changed by replacing zero with the normal shear coefficients α x and α y which represent the property of the material (e.g. fabric) responsible for the situation that the pure, uniaxial tensile strain causes an angular deformation (equation (2))

where α represents normal shear coefficient.
Development of mechanical model for tensile test with lateral restriction
In order to get the Poisson’s ratio from the lateral force, a mechanical model was created. The following points show the modeling procedure for the isotropic material on the cross-shaped fabric sample with lateral restriction and for the anisotropic material on the cross-shaped fabric sample with lateral restriction.
Mechanical model of tensile test for isotropic material with lateral restriction
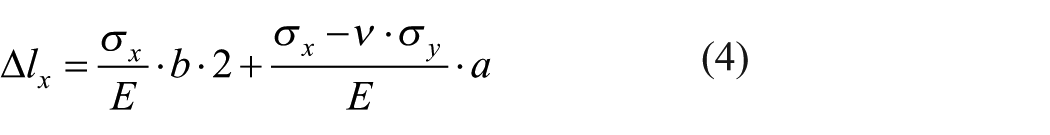
In the tensile test with lateral restriction, the lateral force is measured by means of a measuring device having a high rigidity relative to the test material itself, which means that the displacements achieved in the horizontal plane of the sample are very small. For a considerable range of forces, the range of the displacement of the measuring device is very small and can be considered negligible. For the purpose of simplifying the situation, it may be considered that lateral narrowing of the sample is disabled (solid restriction) where it is possible to measure the lateral force as a force of the rigid connection with the sample. In this case, deformation is recognized only in the direction of the acting force. This situation is illustrated in Figure 1. The dimensions of the sample are 200 mm × 200 mm, and the sample is cut on all four sides in the shape of the cross. The sample subjected to the tensile test is deformed, whereby zones of different states (uniaxial and biaxial) have an impact on the total tensile and lateral deformation. Part of the sample, which is in lateral restriction, will be less likely to contribute to the tensile deformation than the parts that do not have a lateral restriction. Total extension of the sample will be integral of the change in length throughout the total sample length due to zones of different stress states (uniaxial and biaxial). Similarly, lateral deformation equal to zero will be the sum of deformations of the different horizontal stress zone regions of the sample. For this reason, the Young’s modulus of elasticity cannot be determined as σ/ε by applying the Hooke’s law, but it is necessary to have the results of tensile deformation and tensile stress of the samples without lateral restriction.

Tensile test with lateral restriction (isotropic material in millimeters).
As can be seen from the example, a similar characteristic with a small difference appears, whereby the deformation of the sample subjected to a tensile test with lateral restriction corresponding to a given force will take lower values of the strain comparing to sample without the lateral restriction or free stretching. The reason for this is apparently an increased rigidity of part of the cross-shaped sample which is in biaxial state of stress. The link between the strain and the relative extension in the case of free tensile test (without lateral restriction) is pure E, and in the case of a tensile stress state with lateral restriction, the modulus of elasticity must be corrected or modified according to the following considerations.
In the longitudinal direction of the sample, the total extension will be the sum of the extensions of the individual zones of different stress states in the tensile test with the lateral restriction (equation (3))

that is, the sum of the stresses in the two zones subjected to uniaxial stress of sample length b and one zone subjected to biaxial stress of sample length a (equation (4))
If there is a lateral restriction at the tensile stress of the material, then εy = 0 (no lateral deformation) and is also equal to the sum of deformations of all stress zones in the horizontal direction of the sample, followed by equation (5)

Rearranging the above equation, equation (6) is obtained
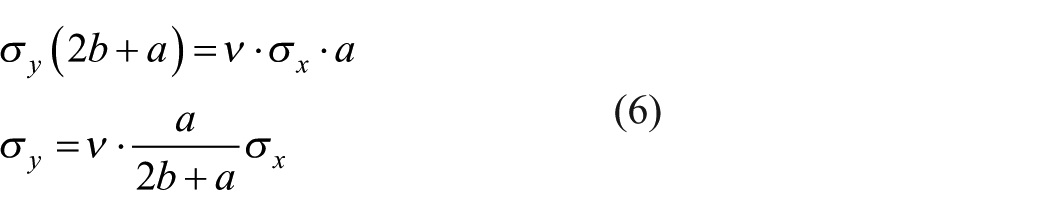
in which it appears
Substituting expression (6) in expression (4), the relation of the relative extension is obtained (equation (7))

Lateral force measured by the lateral device directly leads to lateral stresses in the material (equation (8))

where t is the cross-sectional area of the sample.
From equation (8), Poisson’s ratio is obtained (equation (9))

Poisson’s ratio of isotropic elastic material is then equal to the ratio of lateral and tensile forces with correction based on sample geometry.
The expression for tensile deformation results from the relative extension ratio for the longitudinal strip of the cross-shaped sample and the total length 2b + a. Arranging the expression results in equation (10)

in which it is apparent that Hooke’s law
From equation (10), it is apparent that the value of the corrected modulus of elasticity
From the example above, it is apparent that E* > E, which means that due to the lateral restriction, it is assumed that the material in restricted part of the sample is stiffer, that is, for a certain tensile stress, the material will be less deformed.
Mechanical model of tensile test for anisotropic material with lateral restriction
In anisotropic material, the design of the model becomes more complex for the appearance of different modules in different axis of the material. Poisson’s factors are also different, but with their double indexes, because of the symmetry of material stiffness matrices, they are mutually related in the equation
where L and T are the main directions of the woven fabric sample, which corresponds to x and y axes, respectively.
Scheme of the model for tensile test with lateral restriction for anisotropic material is shown in Figure 2.

Model for tensile test with lateral restriction for anisotropic materials, with different modules in main axis in millimeters.
The extension in the x direction is equal to the sum of the extensions of the two parts of the sample subjected to uniaxial tensile stretching (length b) and extension of the part of the sample subjected to the biaxial stress (center of the sample, length a) (equation (11))

In the transverse direction of the sample, the restriction on the lateral device is the result of which the extension or narrowing is
From equation (12), it is possible to express

By incorporating

Then the relative extension of the complete sample (where l = 2b + a) is given by equation (15)

The corrected elastic modulus from the tensile test with the lateral restriction comparing to the modulus of elasticity obtained from the ordinary, uniaxial tensile test is then described by equation (16)

For the purpose of model testing it is necessary to perform a tensile test on the non-restricted strip-shaped sample in order to obtain the ET and also the tensile test on the cross-shaped sample with the lateral restriction to obtain
Experimental
Measuring the lateral forces at the tensile stress of the fabric in different directions
With the help of a lateral force measuring device as the tensile tester upgrade, it is possible to measure lateral forces in the material incurred as a result of the lateral narrowing of the material subjected to normal tensile load in which way Poisson’s ratio could indirectly be measured. Since the device is balanced by weight, its mass cannot affect the measurement results. Also, the clamps of the device are sufficiently distanced from the measured part of the sample so that they cannot have any effect on the results. The device has a measuring range of up to 500 N. Measurements are made in such a way that the cross-shaped sample is attached to the device clamps at a preloading of 5 N. Thereafter, the two remaining strips of the sample are attached to the clamps of the dynamometer, also under preloading of 5 N. By starting the dynamometer, the lower clamp starts to move down, at a speed of 100 mm/min, where the sample is stretched and striving to narrow in the lateral direction, perpendicular to the action of the tensile force. Since the sample is laterally suspended by the side device clamps, lateral shifts are disabled which cause lateral stresses in the material that are related to the force or the amount directly readable on the scale of the side unit. Since the results of the measurement of lateral forces cannot be stored, it is necessary to make a video footage of the testing and create a database for each test sample from video analysis.
The purpose of this process is to develop a method for determining Poisson’s ratio of the fabric at higher stress values.
Testing samples
The tested fabrics were produced on the same weaving machine, woven from the same warp (same production lot) in two different weaves, plain weave and twill 2/2 weave. The yarn for warp and weft were made from 100% cotton, carded, single, nominal fineness 36 tex and 505 (S) twists/m, and produced in the same production lot. In this way, various effects on the microscale and their impact on observed properties are eliminated.
In order to obtain a more detailed picture of the anisotropic nature of diagonally structured fabrics, the first selected sample was woven fabric in twill weave K2/2S with a density of 20 threads/cm in warp and weft directions. Sixteen samples are separated from the fabric in different directions: in the direction of the warp and the weft and at the angle to the direction of the warp with angular displacements of 11.25° through the range of 0° to 180°. Five specimens were tested for each sample. Also, cross-shaped samples in the symmetrical plain weave of the same density were tested, in order to make a comparison.
Results and discussion
Poisson’s ratios of cross-shaped samples, calculation via model
Poisson’s ratios for homogeneous, isotropic, elastic materials range between 0 and 0.5. For textile made from spun yarns, these values range around 0.5 and often over 0.5, which is otherwise unnatural for homogeneous material. For homogeneous material, the Poisson’s ratio is equal to zero when no lateral deformation occurs at the tensile extension. If the value of the Poisson’s ratio is higher than 0.5, this would mean that when the material is stretched so much laterally, it would reduce its volume, which is also unnatural because the volume of material should increase at tensile extension. Thus, the occurrence of the Poisson’s ratio higher than 0.5 may occur in extreme cases of non-homogeneous materials due to the specificity of their structure. Since the Poisson’s fabric ratio of woven fabrics could not be fully identified with the Poisson’s ratio of homogeneous materials, it would be more appropriate to use the name apparent or pseudo Poisson’s ratio.
Extremely high values of the apparent Poisson’s ratio of woven fabric outside the main directions are the result of changes in the structure caused by rotation of the thread systems.
Poisson’s ratios are calculated for each 0.5% of extension from equation (13) derived from the model.
The Poisson’s ratio is calculated in such a way that obtained results of tensile and lateral forces, respective stresses, and geometric parameters a and b are incorporated in equation (13). For example, at an extension of 5% for woven fabric in plain weave in the direction of the warp, a tensile force of 4130 cN and a lateral force of 1010 cN are read. Since the thickness of the sample is the same regardless of the direction, the ratio of lateral and tensile forces will be equal to the ratio of lateral and tensile stresses. Lengths a and b derive from the geometry of the cross-shaped sample and their values are a = 5 cm and b = 7.5 cm. By incorporating these values into equation (13), the Poisson’s ratio at 5% extension is obtained and amounts 0.978. The calculated mean values of Poisson’s ratios are paired with the corresponding strain values and are shown in the linear diagrams.
From the graphs shown in Figures 3 and 4, it is clear that in the principal direction of both samples, Poisson’s ratio has lowest values: in the warp direction within the range of 0.8 to 0.1, and in the weft direction within the range of 1.4 to 0.5. The reason for this is that the lateral deformation at the tensile stress in the main axis is small compared to the other directions of the material. In addition, higher Poisson’s values in the weft direction could be related to the initial system tension, that is, crimp, which is greater in weft system. At the beginning of the extension, warp threads will have a shorter path to complete straightening due to lower crimp, and even the lower extension will lead to extension of the threads. At the beginning of extension, the Poisson’s ratio in the direction of the warp and weft is the highest. By further extension, the curve takes on a slightly falling trend. Thus, the lateral and tensile deformation ratio is slightly reduced by extension progression. For example, in case of the sample Kc00, at the extension of 0.5% in the warp direction, the Poisson’s ratio is 0.7, and when the extension increase to 6% Poisson’s ratio decreases to 0.1. The reason for this is less lateral deformation comparing to tensile deformation at the stage of thread extension, whereby the extension of a thread system does not substantially affect the shrinkage of the other since the two systems are not tightly connected in the contact points (weave points), but they have freedom of movement independently of each other. The tensile displacements depend on the friction forces in the contact points, weave pattern and the fabric density (Figure 5).

Poisson’s ratio distributions in different directions for woven fabric sample in plain weave.
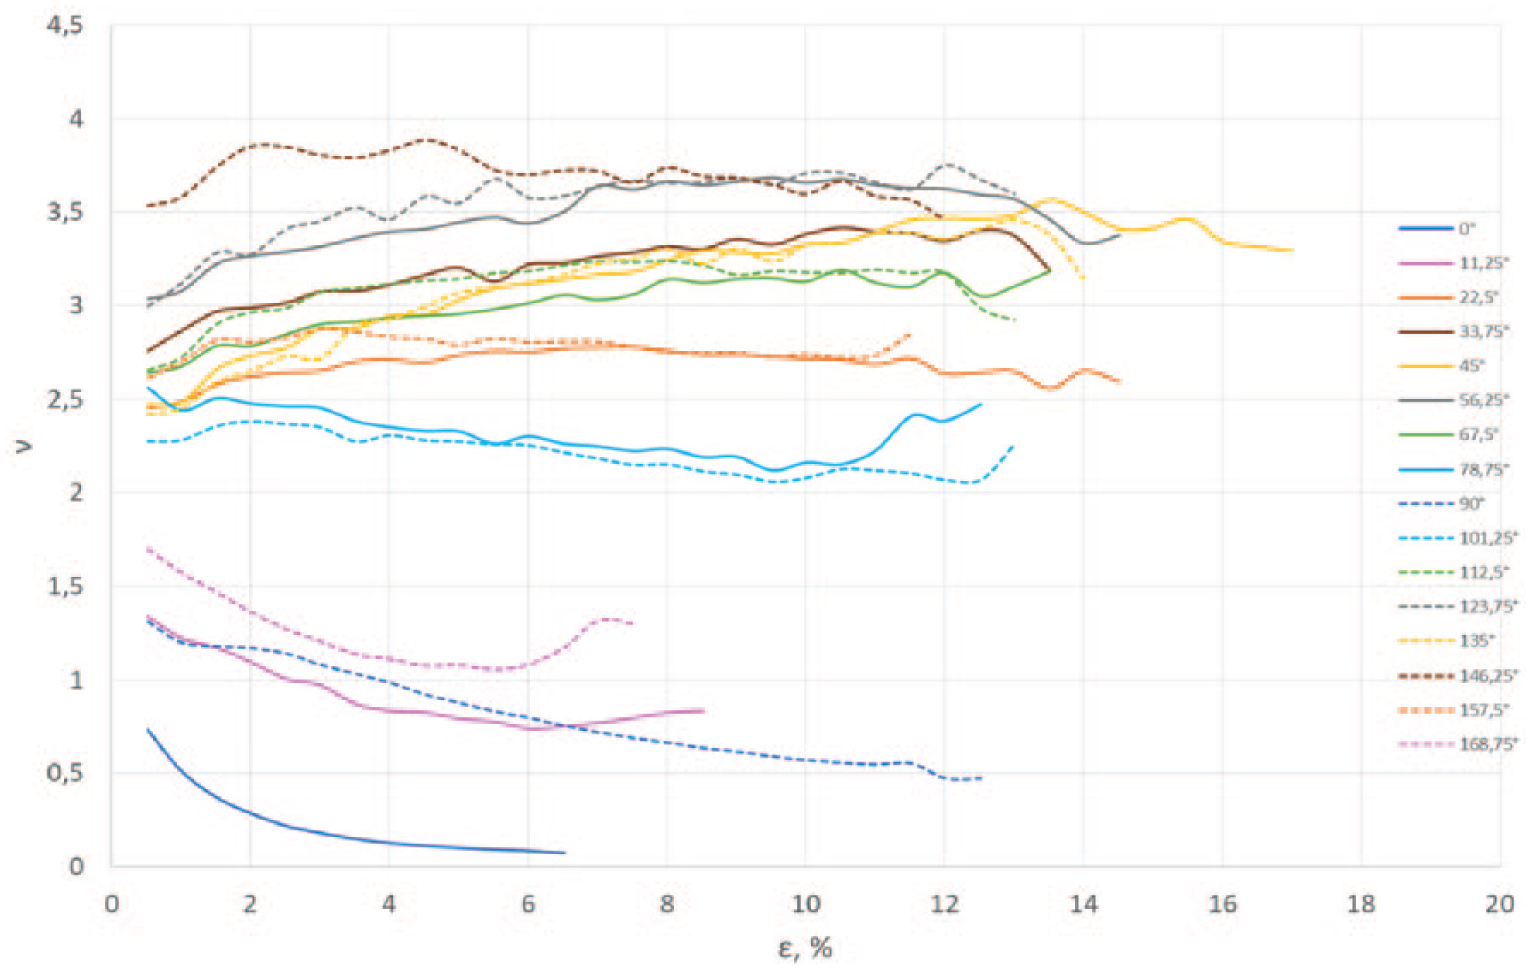
Poisson’s ratio distributions in different directions for woven fabric sample in twill weave (K2/2).

Variants of the contact geometry in the weave point depending on the position of the surrounding weave points.
The fabric construction will be more stable with a larger number of thread interlacements. Contact area between perpendicular thread systems has direct impact on the value of the friction force, which is higher with a larger number of interlacements (Figure 5). In places where there is no interlacements between the warp and weft, threads are more mobile, which results in less stable structure of the fabric, and in these places, the contact area between the two thread systems is smaller.
Poisson’s ratio distributions outside the main axes in the first phase of extension have a slightly upward trend with an extension progression for both samples. Thereby, the woven fabric in the directions closest to the main axes of the symmetry has the lowest value of Poisson’s ratio. The plain weave sample was analyzed in 8 directions, while the twill weave sample, for its diagonal structure, and for a more detailed insight, was analyzed in 16 directions. At the plain weave sample, the Poisson’s values are higher when the angle of rotation is closer to the diagonal. At a 45° angle plain, weave sample has the highest values of Poisson’s ratios. The reasons for the high values of the Poisson’s ratio were described earlier. However, from the results of the detailed angle division for the Kc00 sample, the most pronounced values of the Poisson’s ratio are located at angles close to the diagonal lines of the fabric, that is, 45° ± 11.25° and 135° ± 11.25°. In general, the Poisson’s values outside the main axes of sample P00 are lower than that at Kc00 sample. The reason for that is more compact structure of the plain weave sample compared to the twill 2/2 sample. The Poisson’s ratio in the principal direction is, in the case of the P00 sample, in the range of 0.15 to 0.78 in the warp direction and in the range of 0.55 to 1.39 in the weft direction, and, in the case of the Kc00 sample, in the range of 0.07 to 0.73 in the warp direction and in the range of 0.46 to 1.31 in the weft direction.
Testing of mechanical model—matching of tensile and adjusted modules
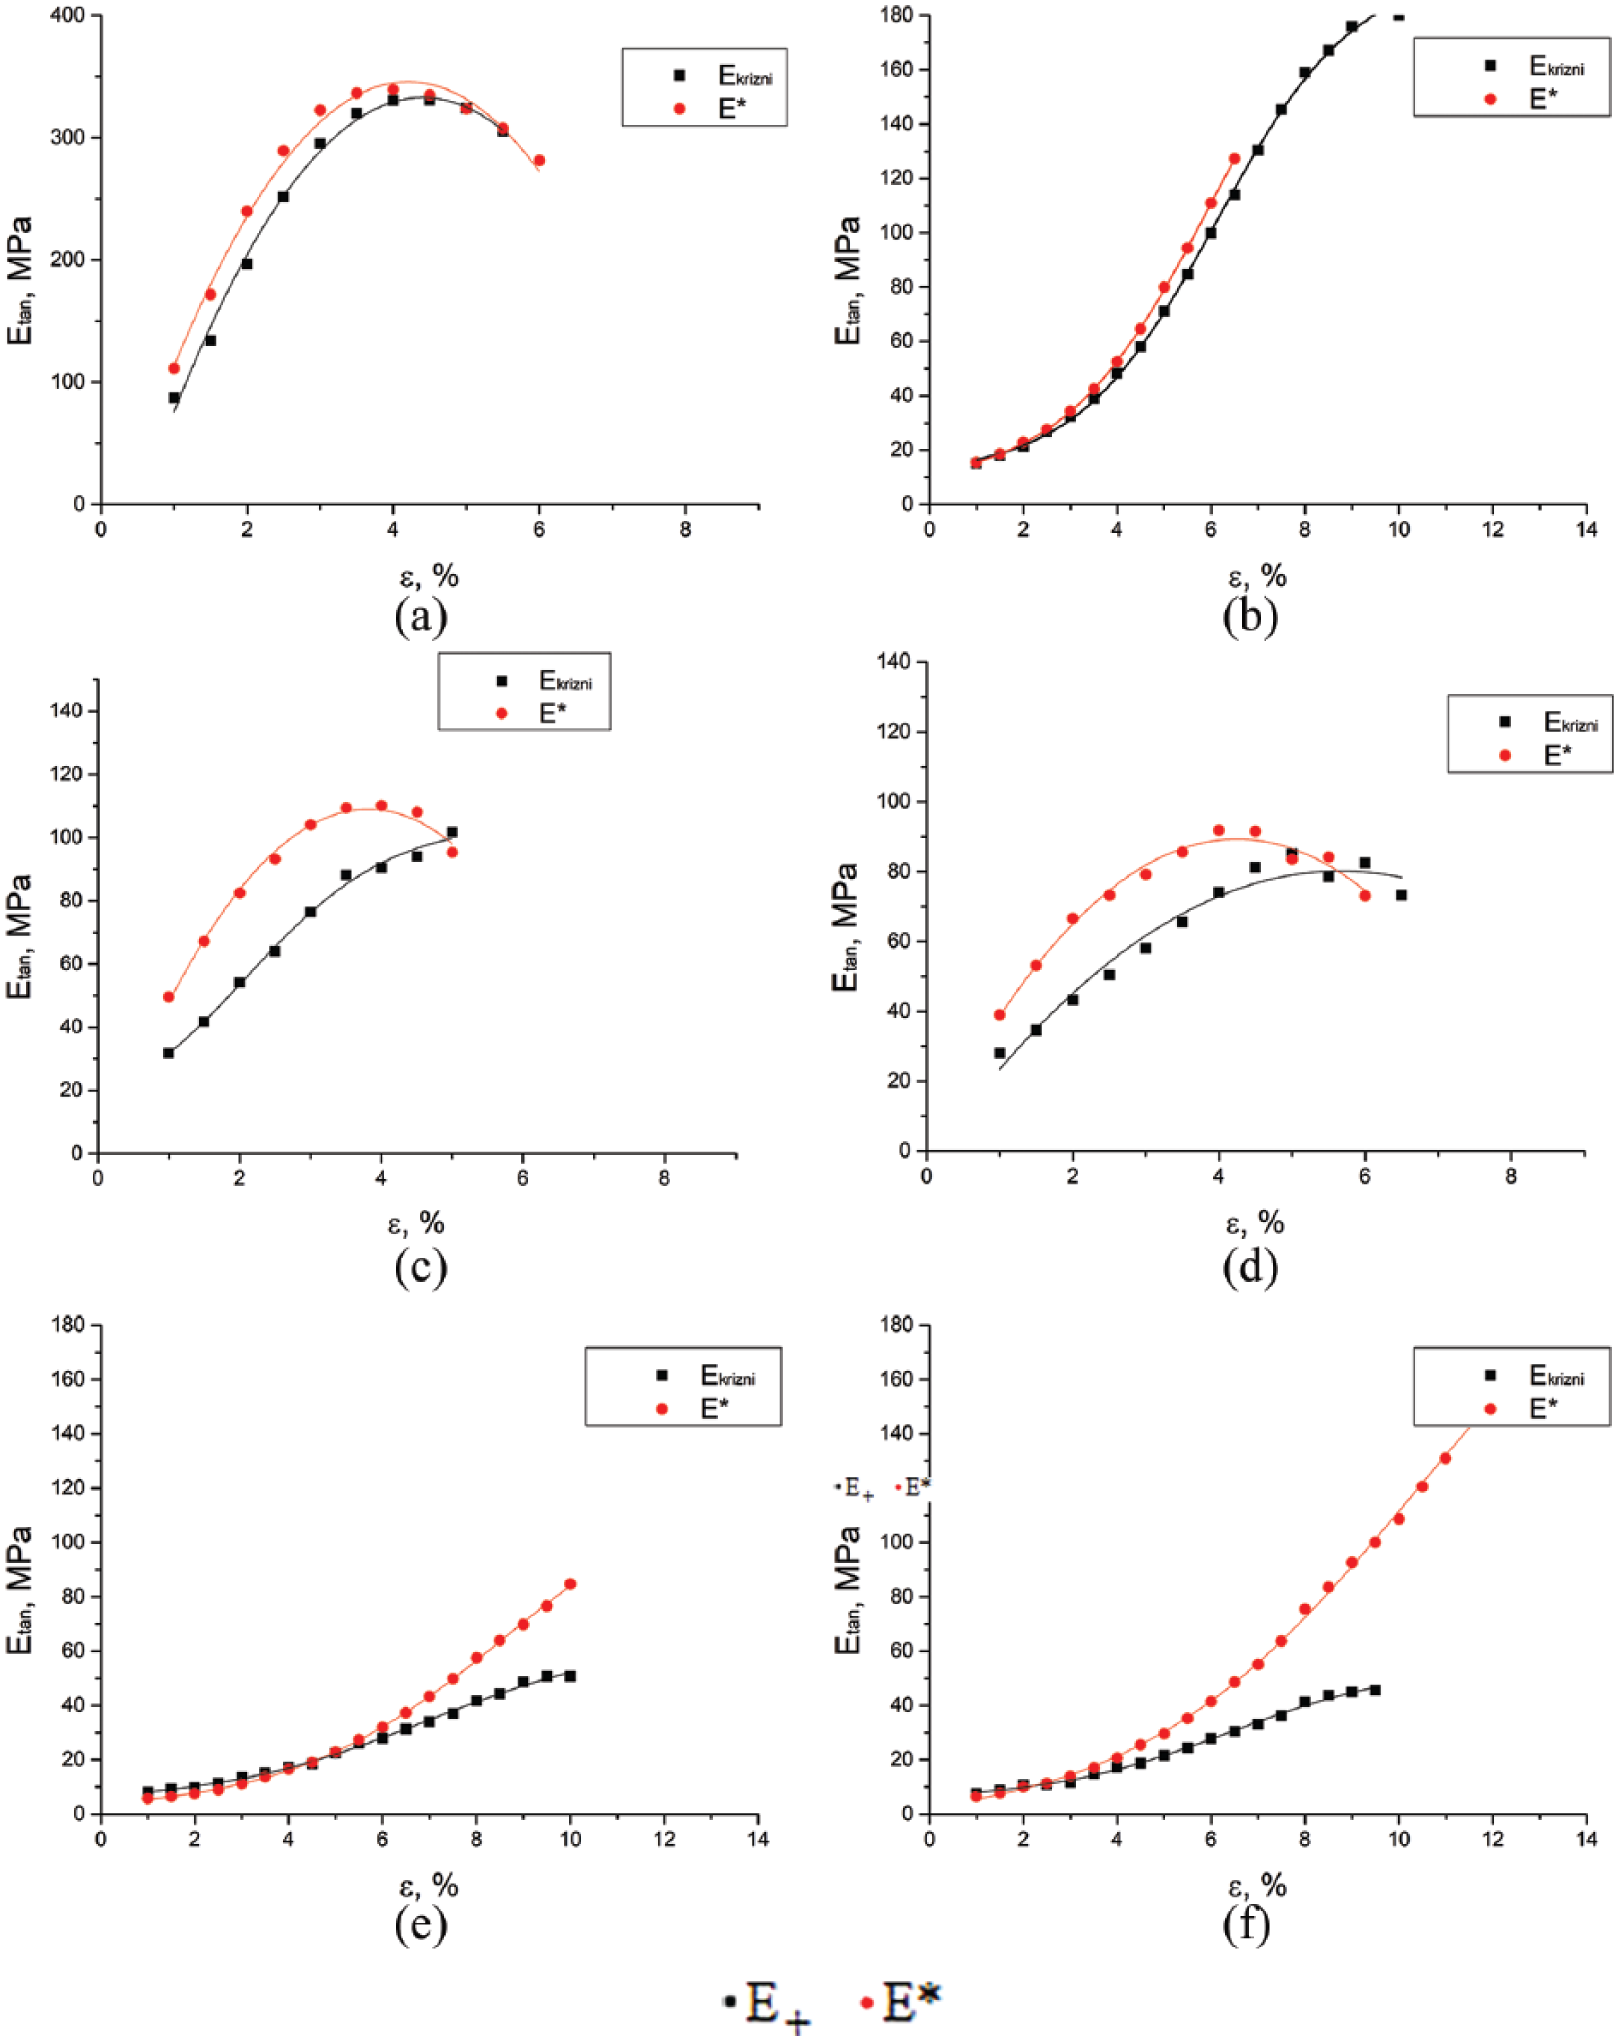
Tangent modulus of elasticity for the entire distribution curve (for every 0.5% extension to maximal force) of the K2/2 sample and the plain weave sample, with density of warp and weft 20/20 threads/cm, was calculated. Figures 6 to 10 show linear graphic representations of elastic modules and adjusted modules obtained through the model and modulus of elasticity of tape-shaped samples and cross-shaped sample elastic modules. The adjusted module E* is shown in the diagram with a red line.

Graphic representations of tangent moduli E for the cross-shaped sample and adjusted E* obtained by a mechanical model for plain weave sample, density 20/20 in the directions: (a) 0° (warpwise), (b) 90° (weftwise), (c) 22.5°, and (d) 157.5°.

Graphic representations of tangent moduli E for the cross-shaped sample and adjusted E* obtained by a mechanical model for plain weave sample, density 20/20 in the directions: (a) 45°, (b) 135°, (c) 67,5°, and (d) 112.5°.
Graphic representations of tangent moduli E for the cross-shaped sample and adjusted E* obtained by a mechanical model for twill weave sample, density 20/20 in the directions: (a) 0° (warpwise), (b) 90°(weftwise), (c) 11.25°, (d) 168.75°, (e) 22.5°, and (f) 157.5°.

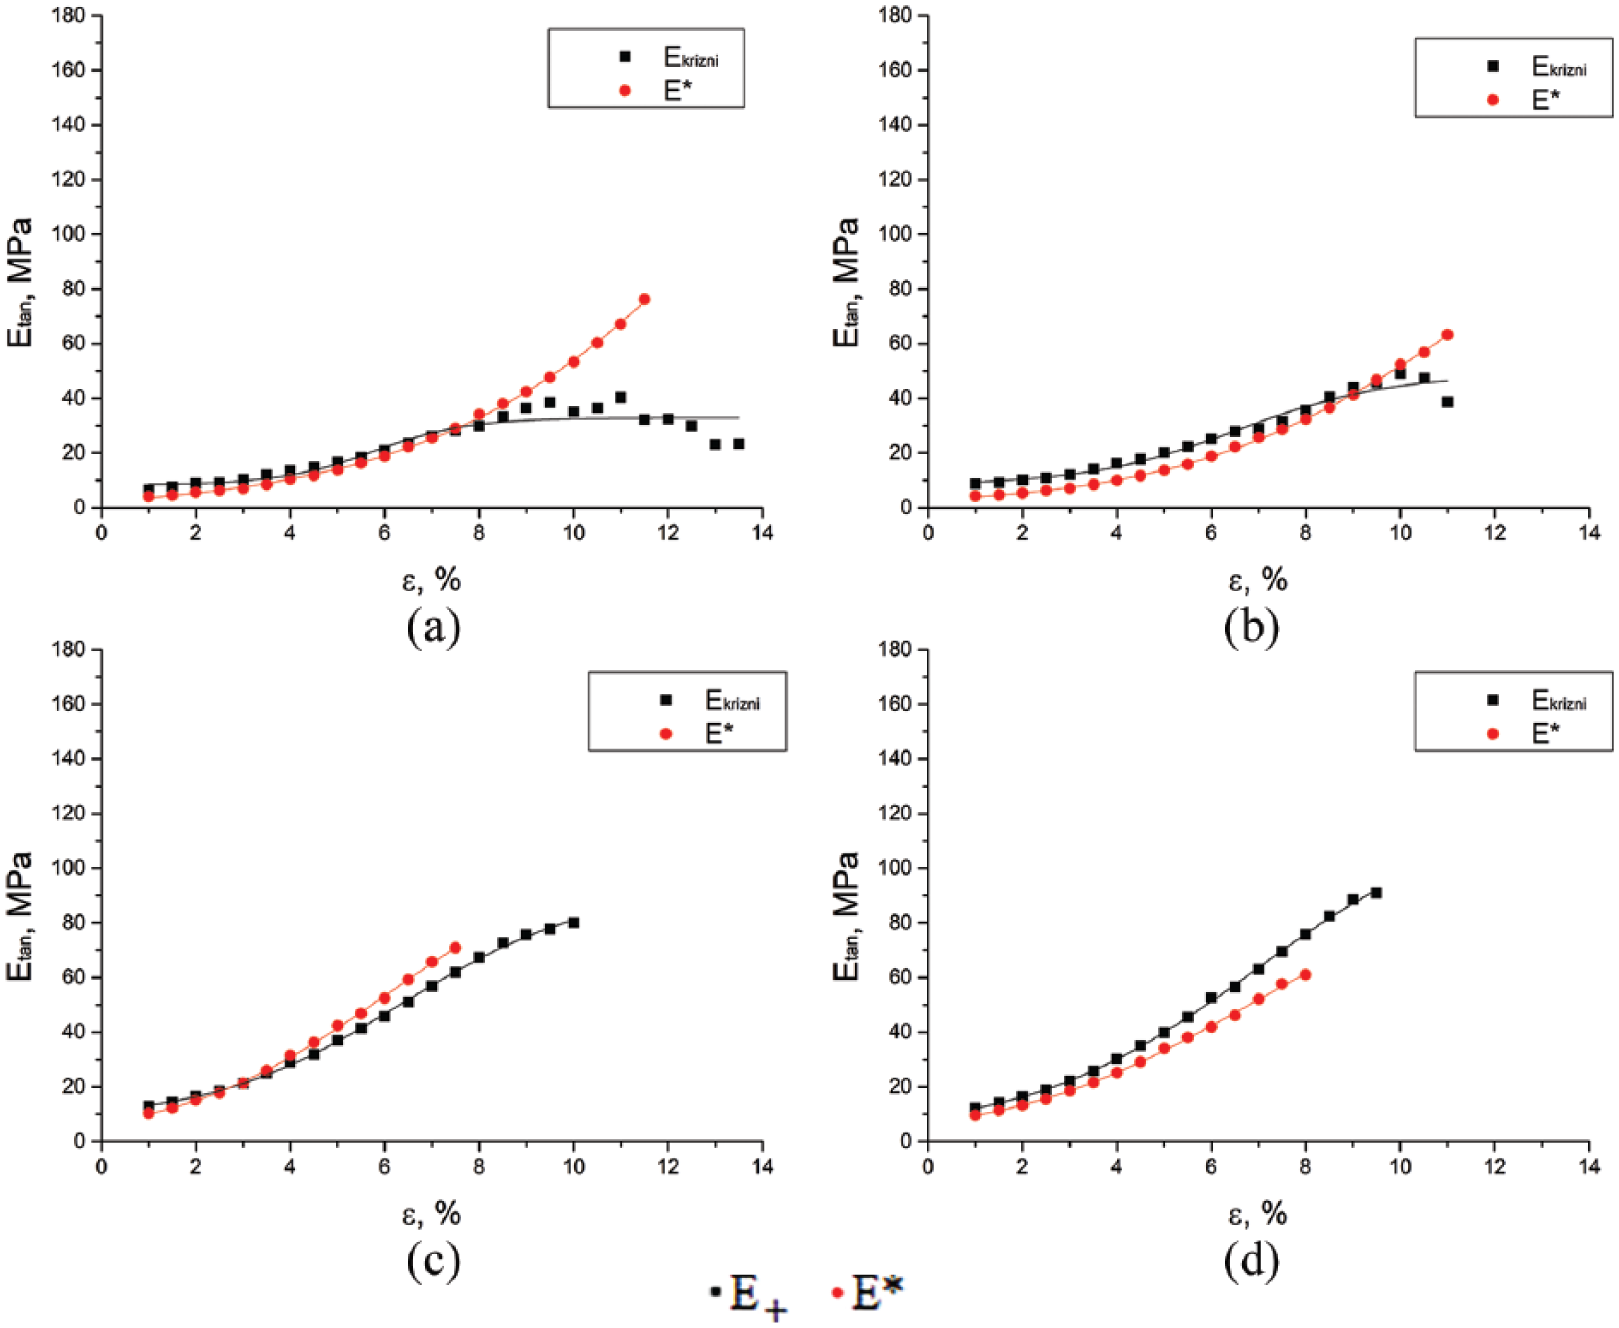
Graphic representations of tangent moduli E for the cross-shaped sample and adjusted E* obtained by a mechanical model for twill weave sample, density 20/20 in the directions: (a) 33.75°, (b) 146.25°, (c) 45°, (d) 135°, (e) 56.25°, and (f) 123.75°.
Graphic representations of tangent moduli E for the cross-shaped sample and adjusted E* obtained by a mechanical model for twill weave sample, density 20/20 in the directions: (a) 67.5°, (b) 112.5°, (c) 78.75°, and (d) 101.25°.
Figures 6 and 7 show the distribution of tangent modules calculated from the cross-shaped samples woven in the plain weave and the adjusted module E*, obtained from the model. In the case of samples measured in the main directions (Figure 7(a) and (b)), there is an apparent closeness of the distribution and it can be concluded that the model is appropriate for the calculation of the adjusted modules in the main directions of the symmetry. When tested at angles of 22.5°, 157.5°, 45°, and 135° (Figure 6 (e) and (d) and Figure 7(a) and (b)) in relation to the direction of the warp, at greater extension, the differences in the behavior of the band-shaped and cross-shaped specimens increase, which causes a significant distancing between distributions of the adjusted and cross-shaped module. It can be concluded that at these angles, the model is valid only for lower extension values; in the case of this sample, the extension ranges from 6% to 10%. In the samples tested at angles 67.5° and 112.5° in relation to the warp direction (Figure 7(c) and (d)), a similar distribution shape with a gradual separation of distribution at a greater extension is apparent. Since these angles are closer to the direction of the weft, where a small gap between the two distributions is also apparent throughout the whole extension range (Figure 6(b)), it can be concluded that the influence of the main weft direction influenced the difference between the distribution at these angles, and for these directions, the model should be adjusted by introducing the corrective factor.
The distribution of the modules in the directions with the same angular distance from the warp direction is very close to the point of being overlapping, suggesting the extreme orthotropy of the fabric woven in the plain weave.
Figures 8 to 10 show the distribution of elastic modules in the different directions of the twill weave K2/2, density 20/20 threads/cm for the cross-shaped sample, and the adjusted E* obtained from the model (equation (16)).
In the main directions (Figure 8(a) and (b)), respectively, in the directions of the warp and the weft, the distribution of the cross-shaped and adjusted module have a similar shape. In the direction of warp, distribution has a parabolic shape with minimal module values (about 100 MPa) at 1% extension and maximum modules (about 350 MPa) at 4% extension. In the direction of the weft, distributions of cross-shaped and adjusted module have sigmoid form whereby at the extension of 1%, modulus has minimum values of about 15 MPa; while the elongation increases the modules increase up to 120 MPa at 6.5% extension. Distributions of the adjusted and cross-shaped module in the main directions are more distant than in the case of plain weave. This could be due to the smaller compactness and diagonal geometry of the twill fabric, compared to plain fabric. At the tensile strain of the twill fabric, apart from deformation in the direction of extension, there is also an angular deformation which is, in the case of cross-shaped sample, because of the lateral restriction, partially prevented, and the difference in the elastic modulus amounts could be derived from that fact. This difference in the distributions of the adjusted module measured on the cross-shaped sample increases with an angular distance that is very close to the warp direction (Figure 8(c) and (d)) as was the case with the plain weave sample. In these cases, the model will be valid only with the correction factor.
In the direction of extension, the sample at 45° in relation to the main axis and close angles (Figure 8(f) and 9(a)–(f)), the adjusted modulus distribution curve obtained from the model significantly deviates from the cross-shaped modules. Adjusted module for virtually the entire extension range has higher values than the calculated module from the cross-shaped sample test. This does not coincide with the theory that fabric samples which, when tested at 1/4 of its length, are laterally restricted, whereby this part should contribute to increasing the stiffness of the material relative to the band-shape test, should have higher stiffness. The reason for this is the lack of a tensile test with lateral restriction, where in the first stage, lateral preloading is applied (5 N), followed by a preloading in the direction of the tensile test extension (also 5 N). In the case of elongation in the warp and weft directions, one system will slightly be influenced by the other, while in the case of tensile extension outside the main axes, both thread systems are longitudinally extended and transversely shrinked at the same time. If the lateral preload is first applied to the test, at the later vertical preloading, the sample will be less stretched for the same amount of force, for the lateral restriction that is accompanied by the buckling of the sample. This will result in closer position of the weave points in the prepared cross-shaped sample, which is longitudinally preloaded with the same amount of force, comparing to preloaded band-shaped sample that needs much greater extension to achieve the same force value. This situation becomes more extreme by approaching the angles of 45° and 135° where the material has the maximum elongation followed by low forces. For these reasons, for the applicability of the model at angles close to 45° in less compact fabrics, it is necessary to find the method of preloading the sample first in the direction of tensile act and then in the lateral direction.
Distributions of the adjusted modules and the cross-shaped module at angles close to the warp direction (Figure 10(a) to (d)) are very close as expected due to the nearness of the distribution in the weft direction. At angles 67.5° and 112.5°, it is necessary to consider the extension range when applying the model.
In plain and twill samples in the warp direction, the change in the trend of the distribution curve of the module in the last extension phases is apparent, pointing to the critical load point for the fabric for technical purposes. Curve slope change at the beginning of the extension is somewhat smaller. In this part, the greatest impact on the rigidity of the material will have bend stiffness of the yarn in the direction of the extended system, that is, the resistance of the yarns from the system perpendicular to it. At a greater thread straightening, the stiffness of the material will be higher. The module values are rapidly growing with the extension in the first stage, whereupon stagnation occurs in the second half of the extension progression prior to break, followed by a decrease of the module. Therefore, the stiffness of the fabric increases in the first half of the extension test so that in the final stage, where destruction of the yarn structure takes place, the stiffness began to decrease. In all other directions, outside the main axis of symmetry, the growth of the module has a nearly linear tendency of mild growth with the increase in extension. Mechanical behavior of the woven fabric outside the main axes is completely different from the one in the main directions. Besides straightening and extension of the yarn systems, threads, due to tensile extension, also cause rotation of the warp and the weft yarn system, and the impact on the rigidity of the material has the mechanical and geometrical properties of the weaving point.
Conclusion
The verification of the model was performed by comparing the tangent modules of the cross-shaped and band-shaped samples. Modules of the plain weave sample is well described by the developed model because of its more compact structure in which the results with the thread shifts within the structure due to external force are relatively small. The results of plain weave sample analysis at angles of 22.5°; 157.5°; 45°; and 135° in relation to the warp direction indicate that at higher extension values, the module distributions of the band-shaped and the cross-shaped sample module are diverged. Therefore, it can be concluded that the model for some directions will only be valid for a lower extension range, while for higher extension values, the model needs to be adjusted. The test results of the model validation for the twill fabric sample show that in the main directions, distributions of the cross-shaped and adjusted module have the same shape, but there is a clear shift in relation to each other. From this, it follows that the model for the twill weave fabric in the main directions will be acceptable with the introduction of the corrective factor. In the direction of sample extension at the angle of 45° in relation to the warp directions and angles close to it, the adjusted modulus distribution curve obtained from the model significantly deviates from the cross-shaped modulus. The reason is the lack of performance in the tensile test, that is, in the timing of chronology, which is a challenge for future research on this topic. Distribution curves of the adjusted modules and cross-shaped modules at angles close to the direction of the weft are very close, which confirms the eligibility of the model for these directions.
For the calculation of Poisson’s ratios for cross-shaped samples through the model, the cross-shaped samples in plain and twill weaves with 20 threads/cm in both the directions were analyzed. Sample tags are P00 for plain weave sample, and Kc00 for twill 2/2 weave sample. In the main axes, higher values of the Poisson’s ratios will be in the weft direction (for P00 from 1.4 weftwise and 0.8 warpwise, and for Kc00 from 1.3 weftwise and 0.7 warpwise) which could be the result of the low initial tenseness of the thread system and consequently high crimp. Poisson’s distribution outside the main directions in the first extension phase has a highly growing trend with the increase in extension in both weaves. In this case, the lowest values of the Poisson’s ratio are in the directions close to the main axes of the symmetry, that is, in the direction of the smallest angle of rotation relative to the main direction of the warp and its supplementary angle. The Poisson’s values outside the main axes of sample P00 are lower than that of Kc00. The cause is the more compact structure of the plain weave woven fabric that results from the maximum thread interlacements, and the limited possibility of the displacements at the meso level. Consequently, the transverse deformation at the tensile stretching is smaller than the longitudinal which is not the case in a less compact twill 2/2 sample. The Poisson’s ratio in the main axes is, in the case of the P00 sample, in the range of 0.15 to 0.78 warpwise and in the range of 0.55 to 1.39 weftwise, and, in the case of the Kc00 sample, 0.07 to 0.73 warpwise and 0.46 to 1.31 weftwise.
Values of Poisson’s fabric ratios in the main axes of the symmetry range from 0 to 1.4. However, in the case of extension outside the main axes, the Poisson’s ratio gains higher values up to 3.9. The cause is the specific structure of the woven fabric. When the woven fabric extends in the direction out of the main axis, mutually perpendicular thread systems rotate, one in relation to the other, leading to the closure of the porous structure. This results in a reduction in the volume of material at the tensile stress, which results in very high values of lateral deformation in relation to the tensile deformation, especially in the first extension phase and consequently to the high Poisson’s ratios.
Footnotes
Declaration of conflicting interests
The author(s) declared no potential conflicts of interest with respect to the research, authorship, and/or publication of this article.
Funding
The author(s) disclosed receipt of the following financial support for the research, authorship, and/or publication of this article: This work has been fully supported by the Croatian Science Foundation under the project number IP-2018-01-3170.