
Abstract
The objective of this work is to study the in-plane shear behavior of 3D warp-knitted spacer knitted fabrics by using a picture frame fixture. This part aims to investigate the effects of structural parameters on the shear stress and energy absorption of warp-knitted spacer fabrics. A group of warp-knitted spacer fabrics was produced on a double-needle bar Raschel machine by varying their structural parameters including spacer yarn fineness, fabric thickness, and outer layer structure. The effects of fabric structural parameters on the shear properties of the spacer fabrics were tested and analyzed based on the nonlinear behavior of shear stress versus shear angle and the deformation mechanism. During loading process, the series of surface images were acquired in certain interval at different positions. These images were processed in image analysis software to obtain the full-field displacement and shear angles at chosen points on the surface of test specimen. The potential shear behavior of the fabric was identified with support of the shear stress–strain curve, work done, and efficiency at different shear stages. The regression model was used to establish the elastic deformation properties to obtain the shear results. Advance statistical evaluation and two-way analysis of variance are used to analyze the significance of various factors such as thickness, spacer yarn diameter, and surface structures on energy absorption at maximum shear load and deformation.
Keywords
Introduction
Spacer fabrics have two outer surfaces connected to each other with spacer yarns; they provide lightweight and bulkier structure. The middle layer comprises of mono or multifilament yarns [1]. Figure 1 illustrates a kind of spacer fabric in which its third dimension (thickness) is significant [2]. Components in spacer fabrics differ depending on the yarn type and production method. There are two types of knitted spacer fabrics: warp-knitted spacer fabrics and weft-knitted spacer fabrics. The first type can be produced on rib raschel machine having two needle bars [3,4], while the second type can be produced on double jersey circular knitting machine having a rotatable needle cylinder. It can be produced by flat knitting too [5,6].
Structure of spacer fabric [2].
The properties of spacer fabrics such as 3D fiber disposition, possibility to use different materials, and single-step production system, enable them in different application areas. The major application areas are acoustics and automotive, aerospace, civil engineering, medical field, geotextiles, protective textiles, sportswear, and composites [7–10]. Spacer fabrics are a class of material with unique properties and applications. They are lightweight and designed to undergo very large deformations. They are typically used in packing and to absorb energy. Their properties are the results of the spacer fabrics microstructure, a complex three-dimensional network, and low density and, possibly thicker, which undergo large deformations and contact during deformation [2,9,11]. Their compression characteristic is also better than conventional textile structures. Compression resilience is an important attribute of spacer fabrics, which is related to sensation of mechanical comfort [8,10].
Due to excellent compression behavior, spacer fabrics usually serve as cushioning structures and have many actual applications such as seats and back supports, mattress, shoe-insoles, etc. [12], mainly on account of excellent energy-absorbing properties. In these applications, the spacer fabrics may be subjected to multiaxial loads. Thus, the macroscopic stress distributions and the failure modes of spacer fabrics are complicated under multiaxial loading conditions. The determination of complex mechanical behavior of spacer fabric using design approaches will find the suitable application in various fields. As cushioning structures, the spacer fabrics are designed to carry loads with regard to in-plane direction, which is the strongest material symmetry direction [13,14]. Therefore, it is important to model accurately the failure behavior of spacer fabrics under shear load.
Shear behavior is used for selecting the proper materials for engineering applications. In-plane shear behaviors indicate the deformation response of a material to forces applied tangentially. Shear tests are applied primarily to papers, thin sheet materials, either metals or composites, such as fiber-reinforced plastic [15,16]. Shear properties of fabrics are often measured to predict the material behavior under loading conditions. The shearing behavior of a fabric determines its performance properties when subjected to a wide variety of complex deformations during its use. This property enables fabric to undergo complex deformations and to conform to the shape of the body [17,18]. Shear properties influence draping, compression, flexibility, and also the handle of fabric. Strength of the fabrics is always primary concern in shear tests. High-strain-rate shear testing is necessary to understand the material response under dynamic loading conditions. Shear properties such as shear modulus, complete stress–strain responses, and shear strengths of fabrics are complex to measure [15–20].
The in-plane behavior and the interlaminar behavior are the most important deformations in 3D fabrics, and also shear behavior predominates the deformation mode of the material [16]. The in-plane shear behavior of 2D fabric has been comparatively well investigated [18–21]. Vanclooster et al. [16] presented shear tests of unbalanced 2/2 twill glass/PP fabric on picture frame in three different pretension states and studied the influence of tensile load in the yarn direction on the shear resistance for the fabric and the repeatability of the test method. Lin et al. [19] established the finite element model based on the geometry of 2D fabric to simulate the in-plane shear deformation, the simulation results were identical with experiments. Cao et al. [20] compared the picture frame shear test results from seven different labs for developing a standard test setup and obtaining accurate and appropriate material properties. Zhu et al. [21] carefully investigated the in-plane shear characterization of 2D fabric by experimental test and found that the reduction of yarn was a key to wrinkling. In past, research work on 3D fabrics and its shear performance were studied and reported by the authors [2,22]. In part I of this work, Arumugam et al. investigated the shear behavior of 3D weft-knitted spacer fabrics by using a picture frame fixture and analyzed with image analysis techniques [2]. They found that shear deformations depend very much on the type of spacer yarn and the fabric stitch density. Also, they concluded that the nonlinearity of shear deformation increases after limiting locking angle, which initiates the buckling of the spacer fabrics [2]. To the best of literature survey and my knowledge, the in-plane shear behavior of spacer fabrics has not been studied or reported, other than the work done by Arumugam et al. [2,23].
Hence, the lack of comprehensive studies on the characteristics especially on in-plane behavior and energy absorption during loading of warp-knitted 3D spacer fabrics are sound basis for this research. In the present study, the paper reports that the in-plane behavior of warp-knitted spacer fabrics specially developed for cushioning applications. With an attempt to increase the energy absorption during shear and efficiency of the material, various structural parameters such as structure, thickness, and spacer yarn linear density are varied during development of spacer fabrics. The shear stress versus shear angle curves and position of wrinkles during in-plane shear test are recorded and analyzed. In addition to this, image analysis technique was used to analyze the surface shear angle during deformations. The results of image analysis were compared with the actual experimental data. In order to predict the shear force of spacer fabrics at different loading conditions, suitable regression model was developed and reported with significances. At the end, the influences of all various factors on in-plane shear energy absorption of different samples were carefully compared and analyzed using advance techniques. It is expected that a clear picture for tailoring a warp-knitted spacer fabric with promising shear property for cushioning applications.
Methodology
Materials
Description of warp knitted spacer fabrics.

WAS: warp-knitted spacer fabrics.
The first group (six samples) was knitted using lock-knit on both the surfaces and the second group (six samples) was produced with face layer hexagonal net and base with lock-knit structure. Among these samples, spacer fabrics with different thickness were manufactured by adjusting two needle bars. In each structure, the samples were produced by varying thickness (1.5, 2.5, and 3.5 mm) and spacer yarn diameter (0.055 mm and 0.1mm). The loop length of the all 12 warp knit spacer fabrics was kept at 2.12 mm. The structure and knit pattern of both lock knit and hexagonal net warp knit structures are given in Figure 2.
Structure and knit notation of warp knit spacer fabrics.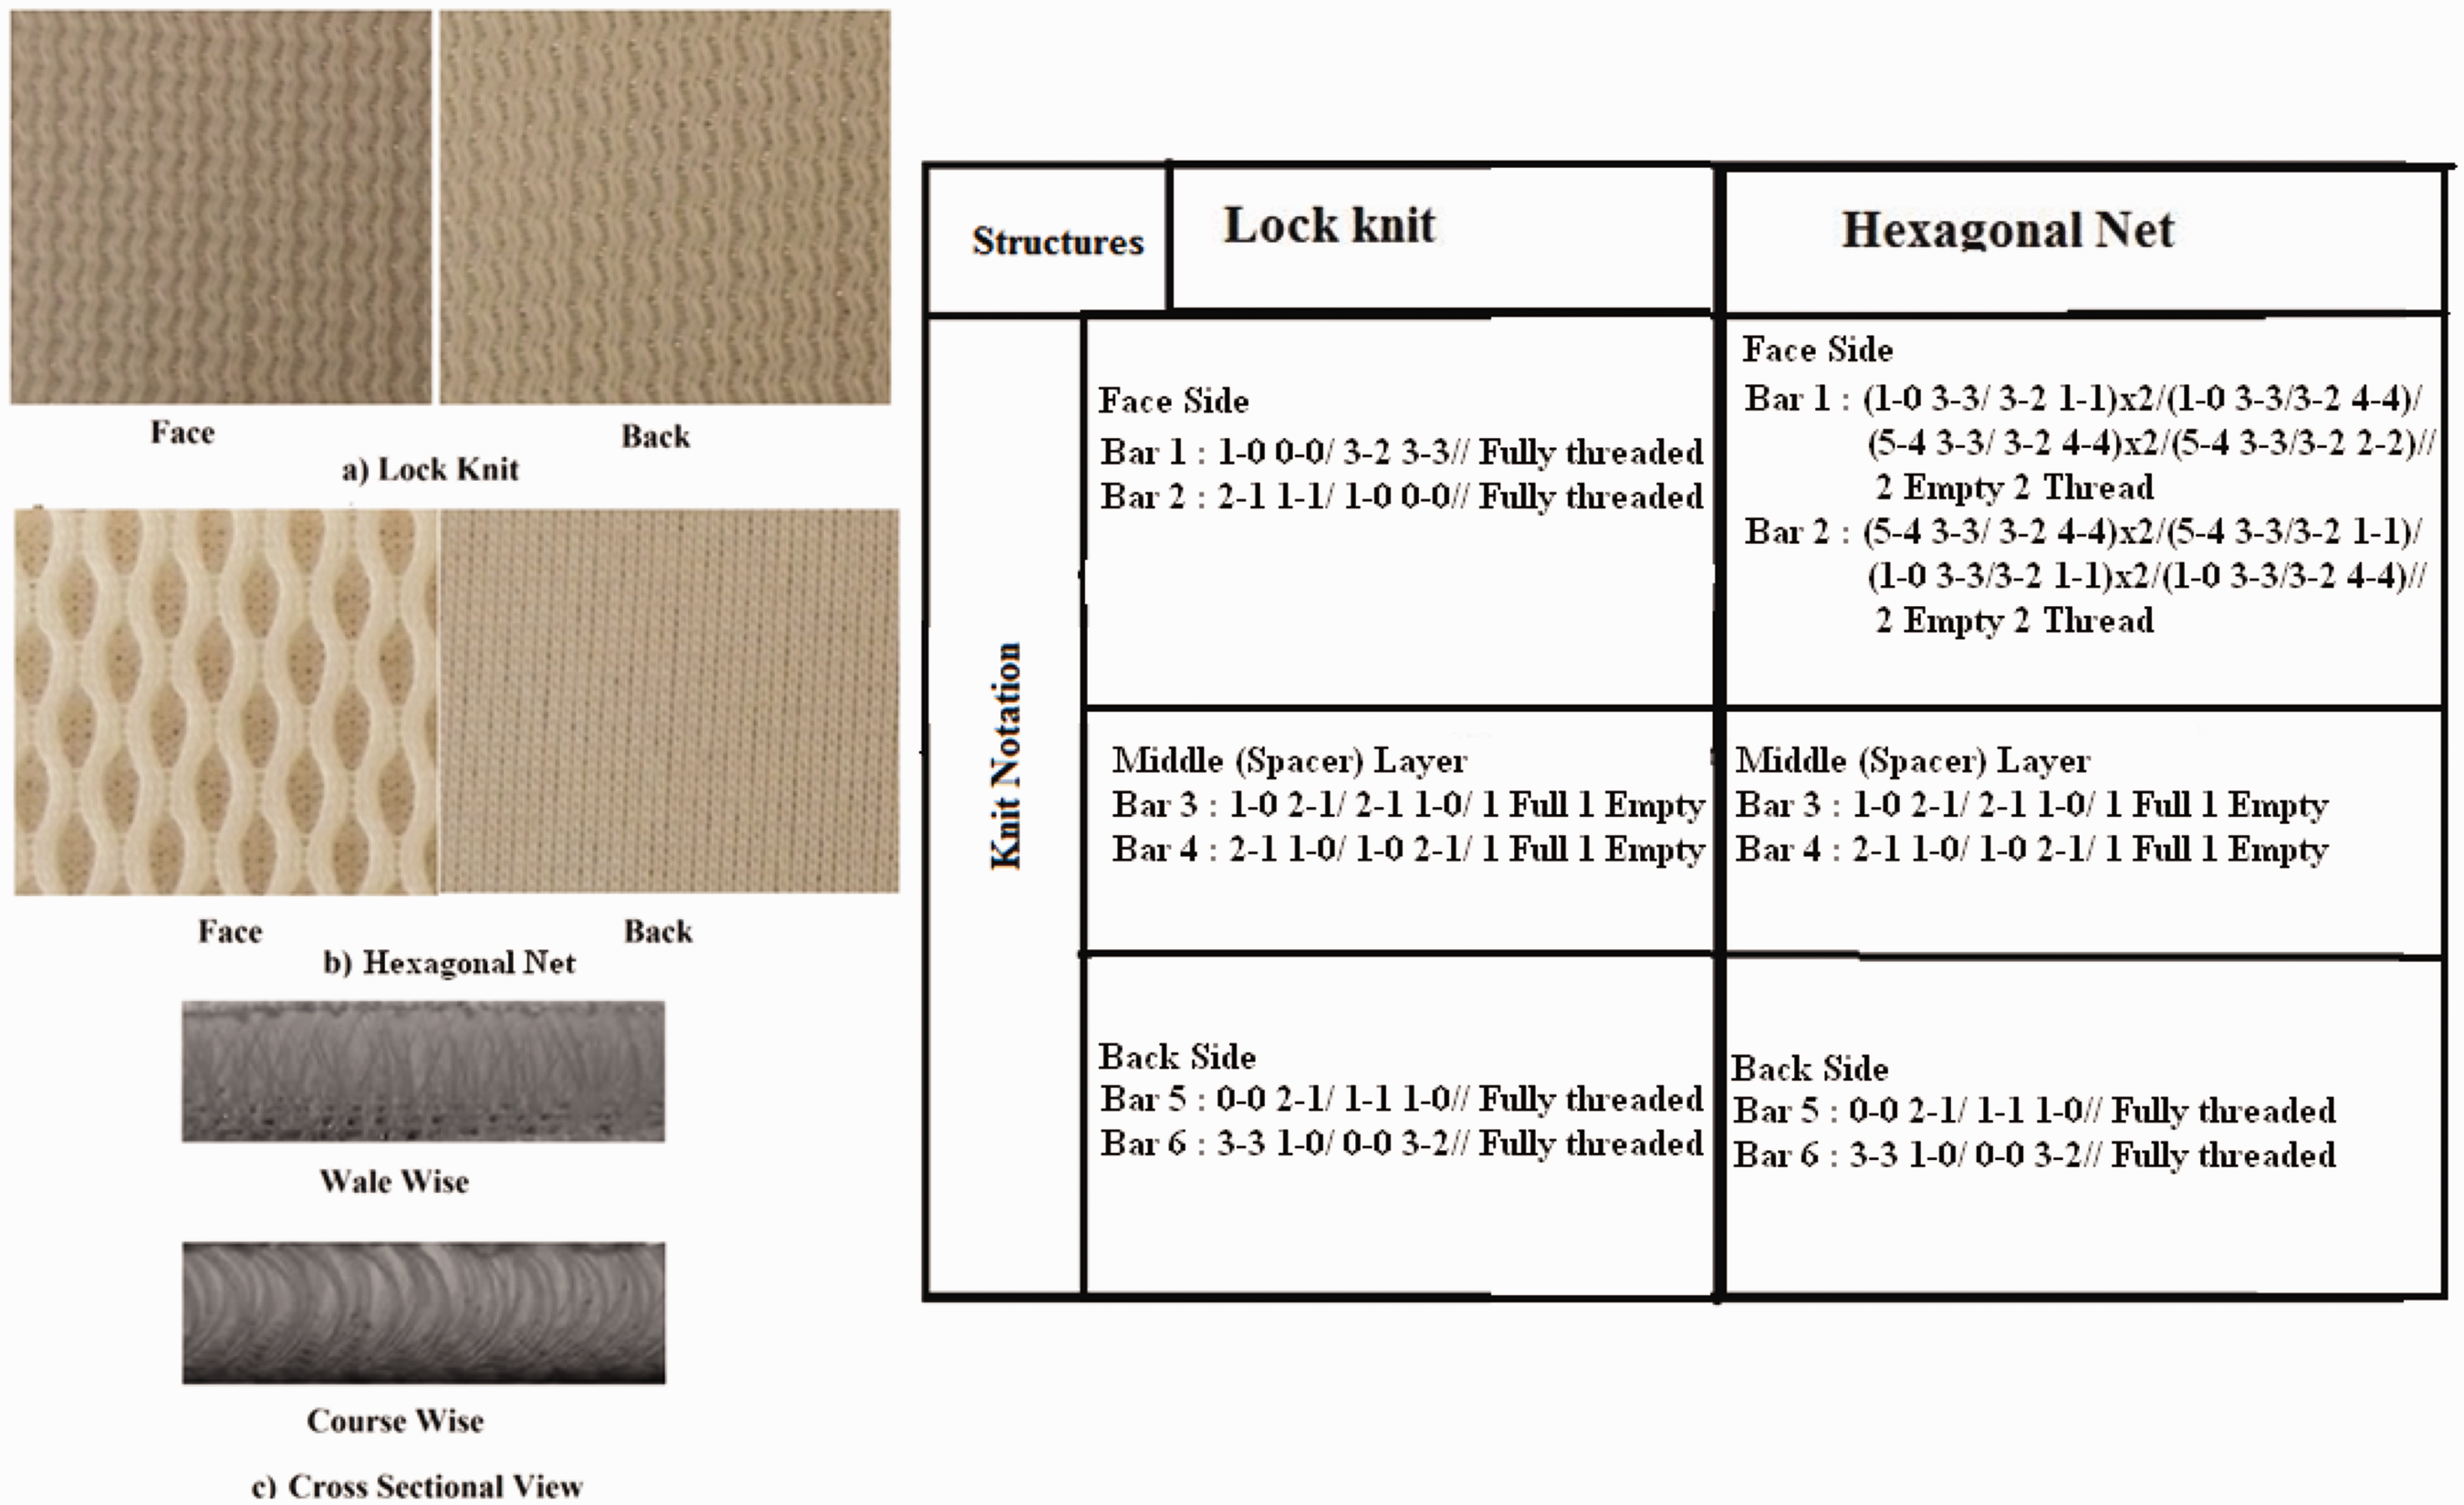
Methods

Structural characteristics of warp knitted spacer fabrics.

GSM: grams per square meter; ME: margin of errors; LL: lower limit; UL: upper limit; WAS: warp-knitted spacer fabrics.
In-plane shear behavior
The in-plane shear behavior of warp-kitted spacer fabrics is carefully measured and analyzed using picture frame test and image analysis methods.
Picture frame test
The picture frame shear test method achieved some popularity in the early days of composite materials development when few other shear test methods existed. But as the two- and three-rail shear test methods, and later the Iosipescu shear test, were introduced for characterizing basic shear properties, picture frame shear testing became less popular for three reasons: It used a relatively large specimen; test preparation required that a number of holes be drilled in the specimen; and the method required a complex fixture. Despite these disadvantages, the picture frame shear test continued to be an attractive option for composite laminate panel testing because the method accommodates large specimens [23,28].
After certain considerations and modifications, the picture frame shear fixture was developed to characterize the in-plane shear property of spacer fabrics as shown in Figure 3 [2]. The picture frame test is preferred by many researchers for shear testing since it has pure state of strain, which can be imposed on the test specimen. Shearing is induced by restraining the textile materials in a rhomboid deformation frame with fibers constrained to move parallel to the frame edges [29]. The frame is extended at diagonally opposing corners using simple tensile testing equipment. It was a challenge to maintain uniform rate of loading on the tensile testing device. Therefore, uniform displacement method was selected. In order to ensure that the frictional effects of the clamping device and picture frame do not influence the uniform displacement, the linear fit curve was analyzed between time and displacement. Also, the empty frame is tested under the same condition to find the frictional effects between bearings and slots. After several trials of this test, the average load was calculated at each displacement point. This is to record the load–displacement behavior of the empty fixture under the same condition as in the real shear experiment. So, it is mainly considered and optimized during sample testing. To eliminate the error caused by the weight and inertia of the fixture, the net load obtained was subtracting from the machine recorded load when the fabric is being deformed in the picture frame. Then this resultant load is considered and account as an actual load.
Three-dimensional view of picture frame shear fixture.
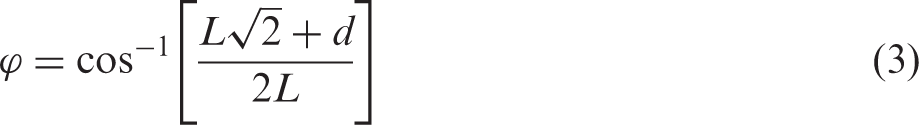
Shear tests were conducted on a TIRA—universal tensile testing machine with a crosshead speed of 10 mm/min. The test was repeated for five samples of each type under the same conditions. The empty frame is tested under the same condition to find the frictional effects between bearings and slots, after several trials of this test, the average value of load at each displacement point is calculated. This is to record the load–displacement behavior of the empty fixture under the same condition as in the real shear experiment [29,30]. So, it is mainly considered and optimized during sample testing. A tensile force is applied at the crosshead mounting. The rig is jointed at each corner such that its sides can rotate and the interior angle between adjacent sides can change. The initially square frame thus becomes of rhomboid (or diamond) shape and material inside the rig is subjected to pure shear deformation kinematics as shown in Figure 4. The force required to deform the material is recorded at the crosshead mounting as a function of crosshead displacement [31,32]. The 3D spacer fabrics for shear tests were prepared according to the size of the picture frame and the characteristics of samples. Direct measurement of axial load and shear angle is possible through the following relationship (equation (2)).
Deformation kinematics of picture frame.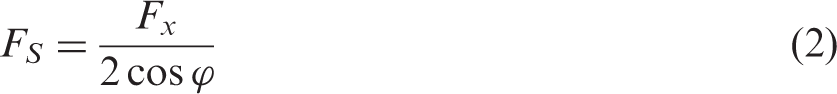

Shear force (Fs) is determined by the axial force (Fx) frame rig length or sample length (L) and the frame angle (φ). In this study, both sample length and frame length are considered for calculation of shear angle and to find the correlation with the image analysis method. Meanwhile, frame angle can be determined directly from crosshead displacement (d). Shear angle (γ) can be obtained from frame angle by using the following equations (3) and (4) [29–32].

Analysis of in-plane shear stress–strain curve of spacer fabrics
Overall, shear stress–strain trend of the spacer fabric samples is presented in Figure 5. Normally the shear behaviors of spacer fabrics are classified into three stages with respect to changes in the slope. The three stages are surface elongation and lateral compression (1), inter-fiber compaction and buckling (2), and densification (3). In the first stage, the surface layer of spacer fabric undergoes elongation; also the inter-fiber slippage takes place in this stage. In this stage, the initial lateral compression occurs in the fabrics due to shearing, a lower slope is observed for loose structures and slope increases with increase in stitch density. Here the spacer yarn has low contribution in constraint during initial compression. Further, inter-fiber compaction and extended shear (second stage) lead to rapid increase in shear stress, it might be due to jamming of surface yarns, which allows both surface yarn and spacer yarn to buckle to a larger extent. In spacer fabrics, the next stage is quite complex because the shear stress and strain have been affected by buckling, shearing, and locking of spacer yarns. It is also noticed that there is sharp increase in stress in the third stage because the fabric attains a very high density.
In-plane shear behavior of 3D spacer fabrics.
Energy absorption during in-plane shear of spacer fabrics
It is necessary to evaluate and analyze the spacer fabrics energy absorbing ability during shear. It would be more useful to get a better understanding about the applicability of spacer fabric for cushion materials. The shear curve suggests that all spacer fabric samples may potentially be good energy-absorbing materials.This is due to the fact that spacer fabrics have ability to undergo potential shear deformation and come back to its original structure. The area under the load–displacement curve represents the total energy absorbed and it can be calculated by multiplying the area under the stress–strain curve by the volume of the sample. The energy absorption capacity per unit volume, W, can be calculated by integrating the shear stress–strain curve, as given by equation (5) [33]:


Image analysis using MATLAB
Figure 6 shows the image of a fabric specimen captured during the loading process without displacement. This image was analyzed to obtain shear angle and displacement of the specimen during the test. The image file string is examined and then the appropriate image reading function is called by MATLAB imread. The image is then converted to a gray image and then normalized to a matrix of values ranging from zero to one. This matrix is returned by the function in the variable I. Image analysis can aid in the determination of the shear angle and displacement at any particular point on the surface of fabric specimen. Grid pattern was applied on the specimen surface before the test and used as the reference points of image analysis. Around 16 points (25 square cells (4cm2 each) with 90° angle at 4 points) can be chosen on a 100 mm × 100 mm specimen for image analysis to determine the displacements and shear angles at the chosen points. First, by manually choosing the points on a reference image, the X and Y coordinates of each point can be determined in pixel. The difference of X and Y coordinates of each chosen point between the reference image and the image chosen for analysis represents the displacements in X and Y directions. The complete displacement of the specimens during loading process was obtained by image analysis method. The images were captured at certain regular interval of time using digital camera during deformation of frame. A special program is developed in MATLAB 7.10 (R 2010a) using Hough's transform to find the angle between the lines on the specimens [2,23]. The Hough transform patented by Paul Hough in 1962 is basically a feature extraction method used to detect lines and finding arbitrary shapes position in the image and is used in the field of computer vision and image processing. The simplest case of Hough transform is the linear transform for detecting straight lines. The Hough transform is widely used in image analysis, computer vision, and digital image processing to find shapes in a binary digital image. This approach is preferred when the objective is to find lines or curves in an image. The parameter ρ represents the distance between line and origin, θ is the angle of the vector from origin to this point. This distance and angle indicate the line that bisects the points being tested at each 5 mm displacement in every 30 s interval. It helps researchers to understand more about detections of angles using Houghs transform.The results of experimental methods and image analysis were compared with each other.
Determination of shear angle using image analysis.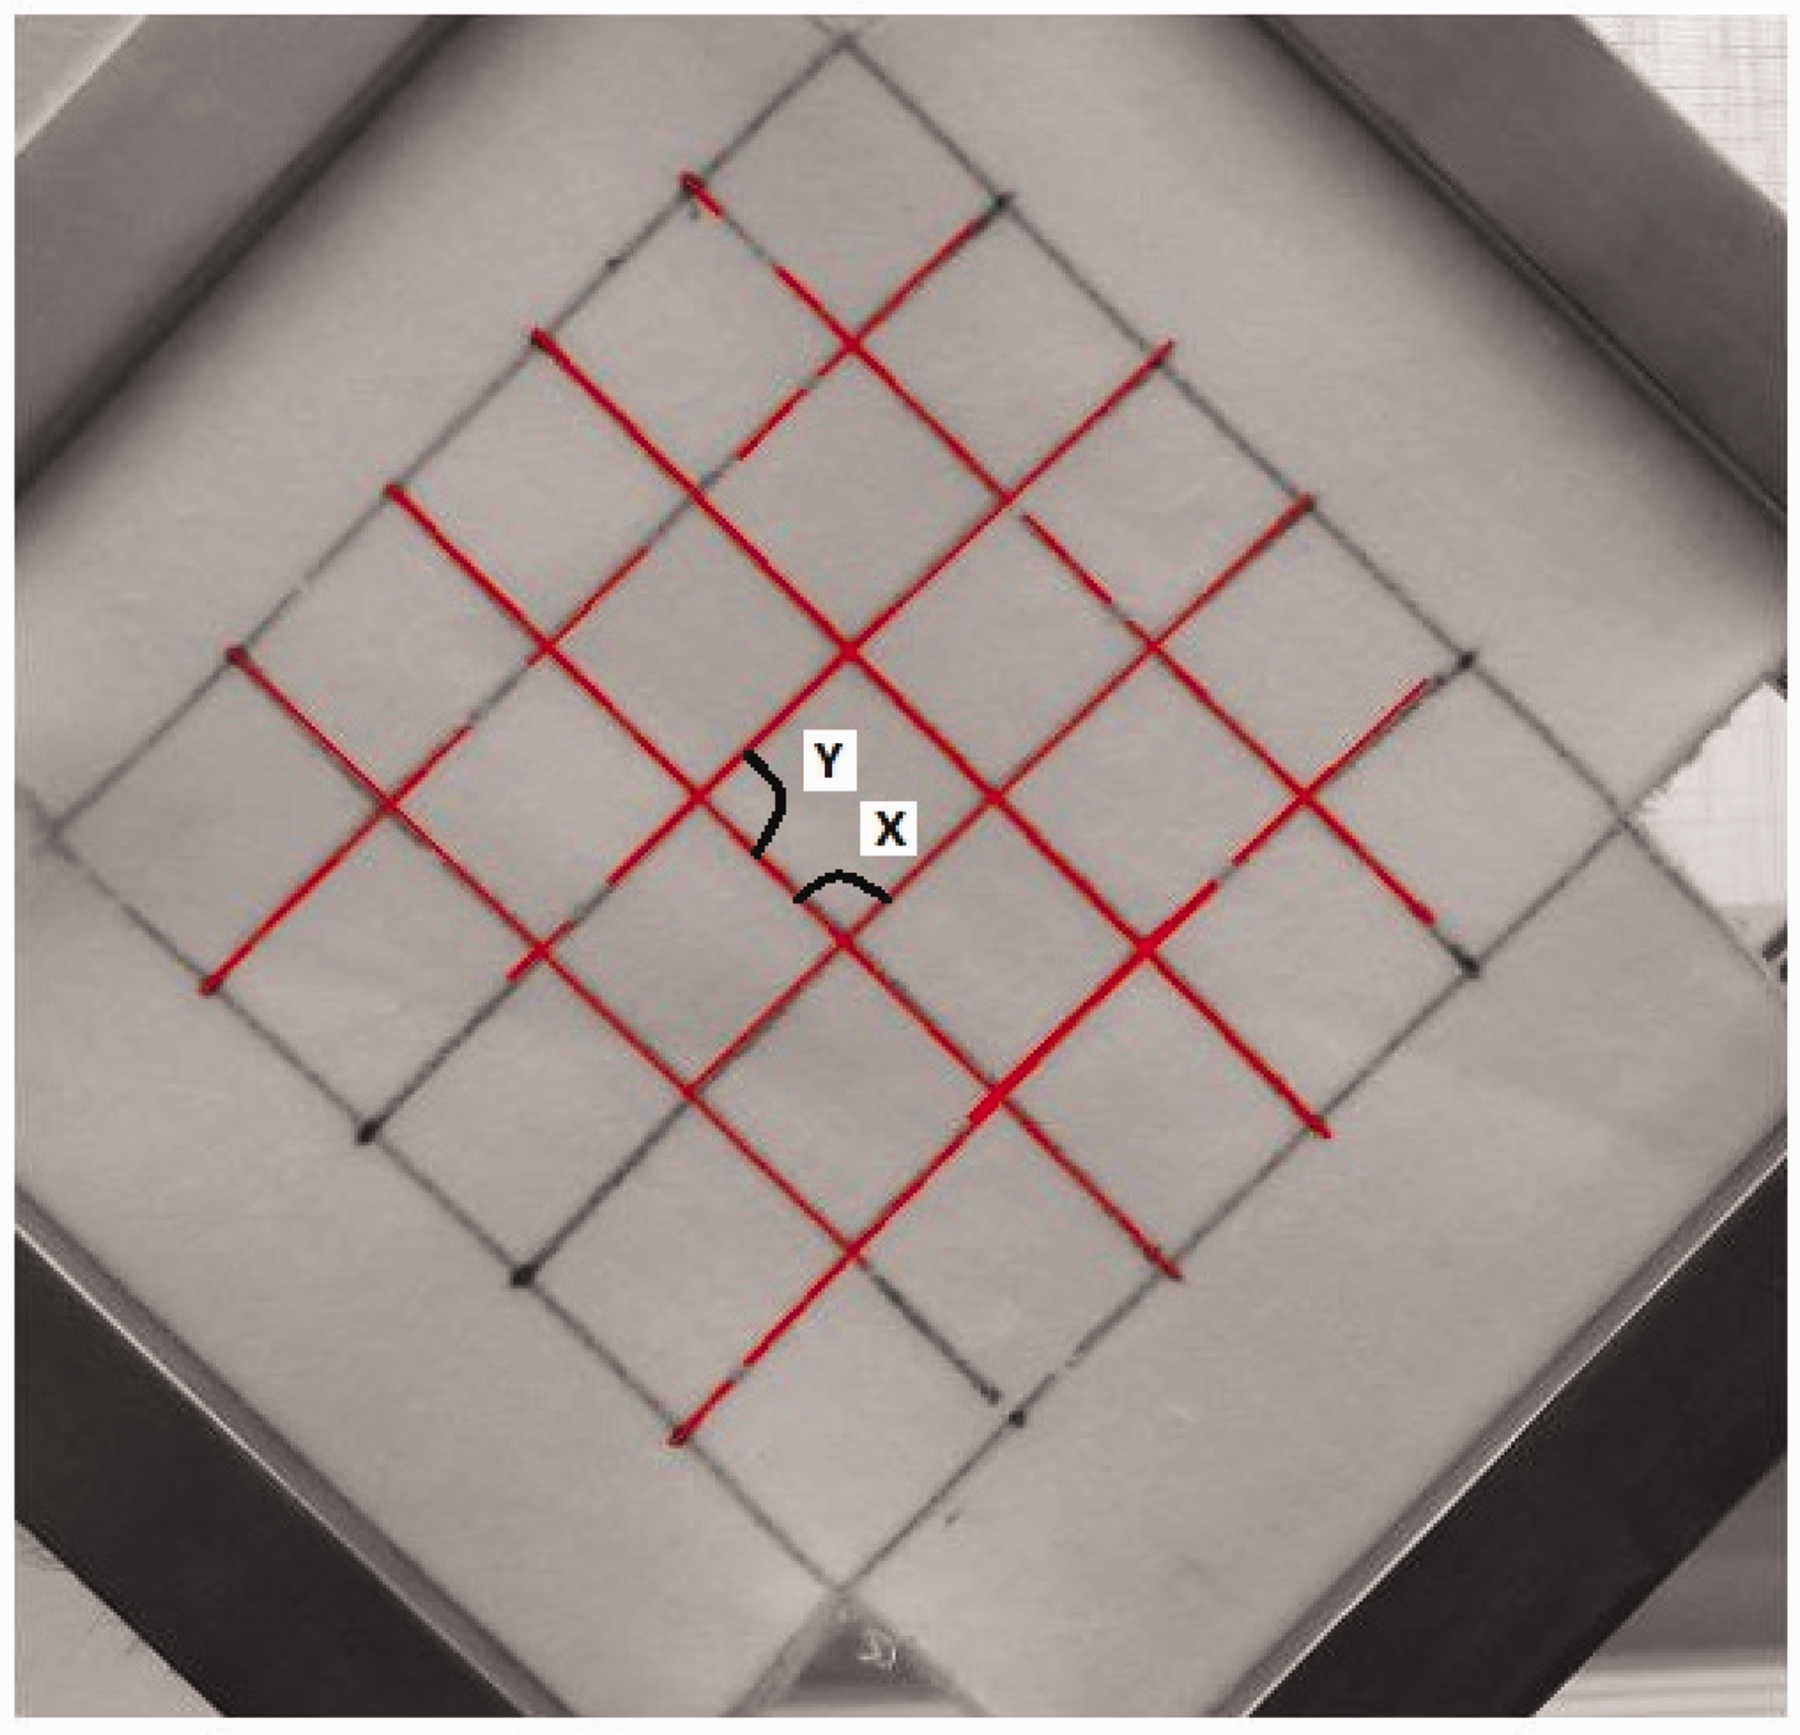
Statistical analysis
Statistical analysis software, QC Expert—Trilobyte was used to conduct all the statistical tests mentioned in this work. Advance statistical evaluation and two-way analysis of variance (ANOVA) were used to analyze the significance of various factors on required properties of WAS fabrics. Also, differences in means between various groups were examined for statistical significance using two ANOVA followed by pair comparison using Scheffe's method. For all the statistical tests, differences were considered significant at P < 0.05. Data were reported as mean ± standard error of mean unless otherwise stated.
Results and discussions
The experimental evaluation of shear stress, shear strain, and shear angle of WAS fabrics are explained in this section.
Influence of thickness on in-plane shear behavior
In this section, the effect of thickness on in-plane shear behavior of WAS fabrics has been evaluated with respect to different structural parameters. First group of six spacer fabrics (WAS 1–WAS 6) were produced with same outer layer structure (Lock knit) and stitch density but with different thickness (1.5, 2.5, and 3.5 mm). As shown in Figure 7(a) and (b), the stress–strain curve reveals that the shear resistance decreases with increase in thickness. Naturally, the density of spacer fabrics decreases with increase in thickness, it results in more open, loose, and lightweight structure, which offers lower resistance toward shear stress. Another technical reason is that the spacer yarn length increases with increase in thickness, which offers higher deformation with low shear stress. It can be seen that the samples have almost similar behavior as they behave linearly in surface extension stage due to same surface structure and density. In next stage of shear deformation, the compressive stress also played a vital role to make the fabrics resist shear force. It was also observed that the thicker fabric has ability to undergo larger deformation in both shear and compression conditions. It was found that the hexagonal net structure fabrics (WAS 7–WAS 12) show similar trend as the lock knit structures (Figure 7(c) and (d)). The stress–strain curves show that shear resistance is indirectly proportional to thickness of the spacer fabrics. From this observation, it is suggested that the fabrics with different thicknesses have different ranges of applications. The thickness of the fabric should be selected according to the amount of the energy to be absorbed and allowed shear stress level. The shear stress–strain behavior of spacer fabrics appears to change significantly with an appreciable decrease in spacer thickness.
Influence of thickness on shear behavior of warp knitted spacer fabrics.
Influence of spacer yarn on in-plane shear behavior
In both sets of spacer fabrics (lock knit and hexagonal net), two types of spacer yarn with different linear density (33 and 108 dtex) and diameter (0.055 and 0.1 mm) were used for convenient analysis of its effect on in-plane shear. Normally the spacer yarns are monofilament, which connect surface layers and keep them apart. The spacer yarns act as linear springs which offer more resistance toward compression, result in higher shear stress as compared to other type of materials in specific applications. The angles between spacer yarn and surface layer can be varied by means of needle underlapping. In this study, spacer yarn angles (84°–86°) of different samples have been maintained. From Figure 8(a) and 7(b), it is observed that the shear stress is high for the fabrics with coarser spacer yarn for both types of structures. In surface elongation and compression (first stage), a higher shear force was observed in the fabrics with coarser spacer yarn as compared to the fabrics made up of finer spacer yarns. It might be the fact that the large diameter and linear density of the coarse spacer yarns have higher ability to resist shear stress than the fabrics made up of finer spacer yarn. In stage 2, the pre-buckling was observed after 20% of shear strain because the surface layers come in contact with each other leading to a locking effect. The fabrics have almost identical stress–strain curves with same thickness for both lock knit and hexagonal spacers in stage 1 region. However, a significant difference in the shear stress–strain behavior was obtained in the densification stage. It was due to the fact that the internal surface and spacer layer experience a closer compaction, which depends on the thickness, the surface structure, and spacer yarn properties.
Influence of spacer yarn linear density on shear behavior.
Influence of surface structure on shear behavior
The in-plane shear behaviors of spacer fabric are also greatly influenced by their surface structures. The outer layer structure affects the monofilament yarn inclination, binding condition with surface, distribution, and multifilament stitches in surface layers.
The surface layers with these structures are shown in Table 2, from which the stitch density, spacer yarn angle, and size of the stitches in the outer layers can be clearly observed. It has been found that the surface structures could slightly affect the stitch density of the outer layers and the spacer yarn inclination angle, although these parameters are maintained the same during knitting. As shown in Figure 9, the shear stress–strain behavior for both the structures (Lock knit and Hexagonal net) exhibits almost same load and deformation in stage 1.
Influence of surface structure on shear behavior.
In-plane shear work done
Figure 10(a) to (d) presents the work done on all spacer fabrics under in-plane shear load and it also compares the response shear stress with effect of deformation and structural characteristics. The figure reveals that thicker fabrics have higher work done than that of thin fabrics when it undergoes compression. Irrespective of the structural variation (lock knit and hexagonal net), the shear work done shows same trend for all the samples. Overall, the work done values were higher for the fabrics made up of hexagonal net structure on face side than that of lock knit fabrics. Also, it can be seen that fabrics with finer spacer yarn have low work done when compared to other fabrics; it might be due to finer spacer yarn offers low resistance toward compression.
Work done during shearing of warp knit spacer fabrics.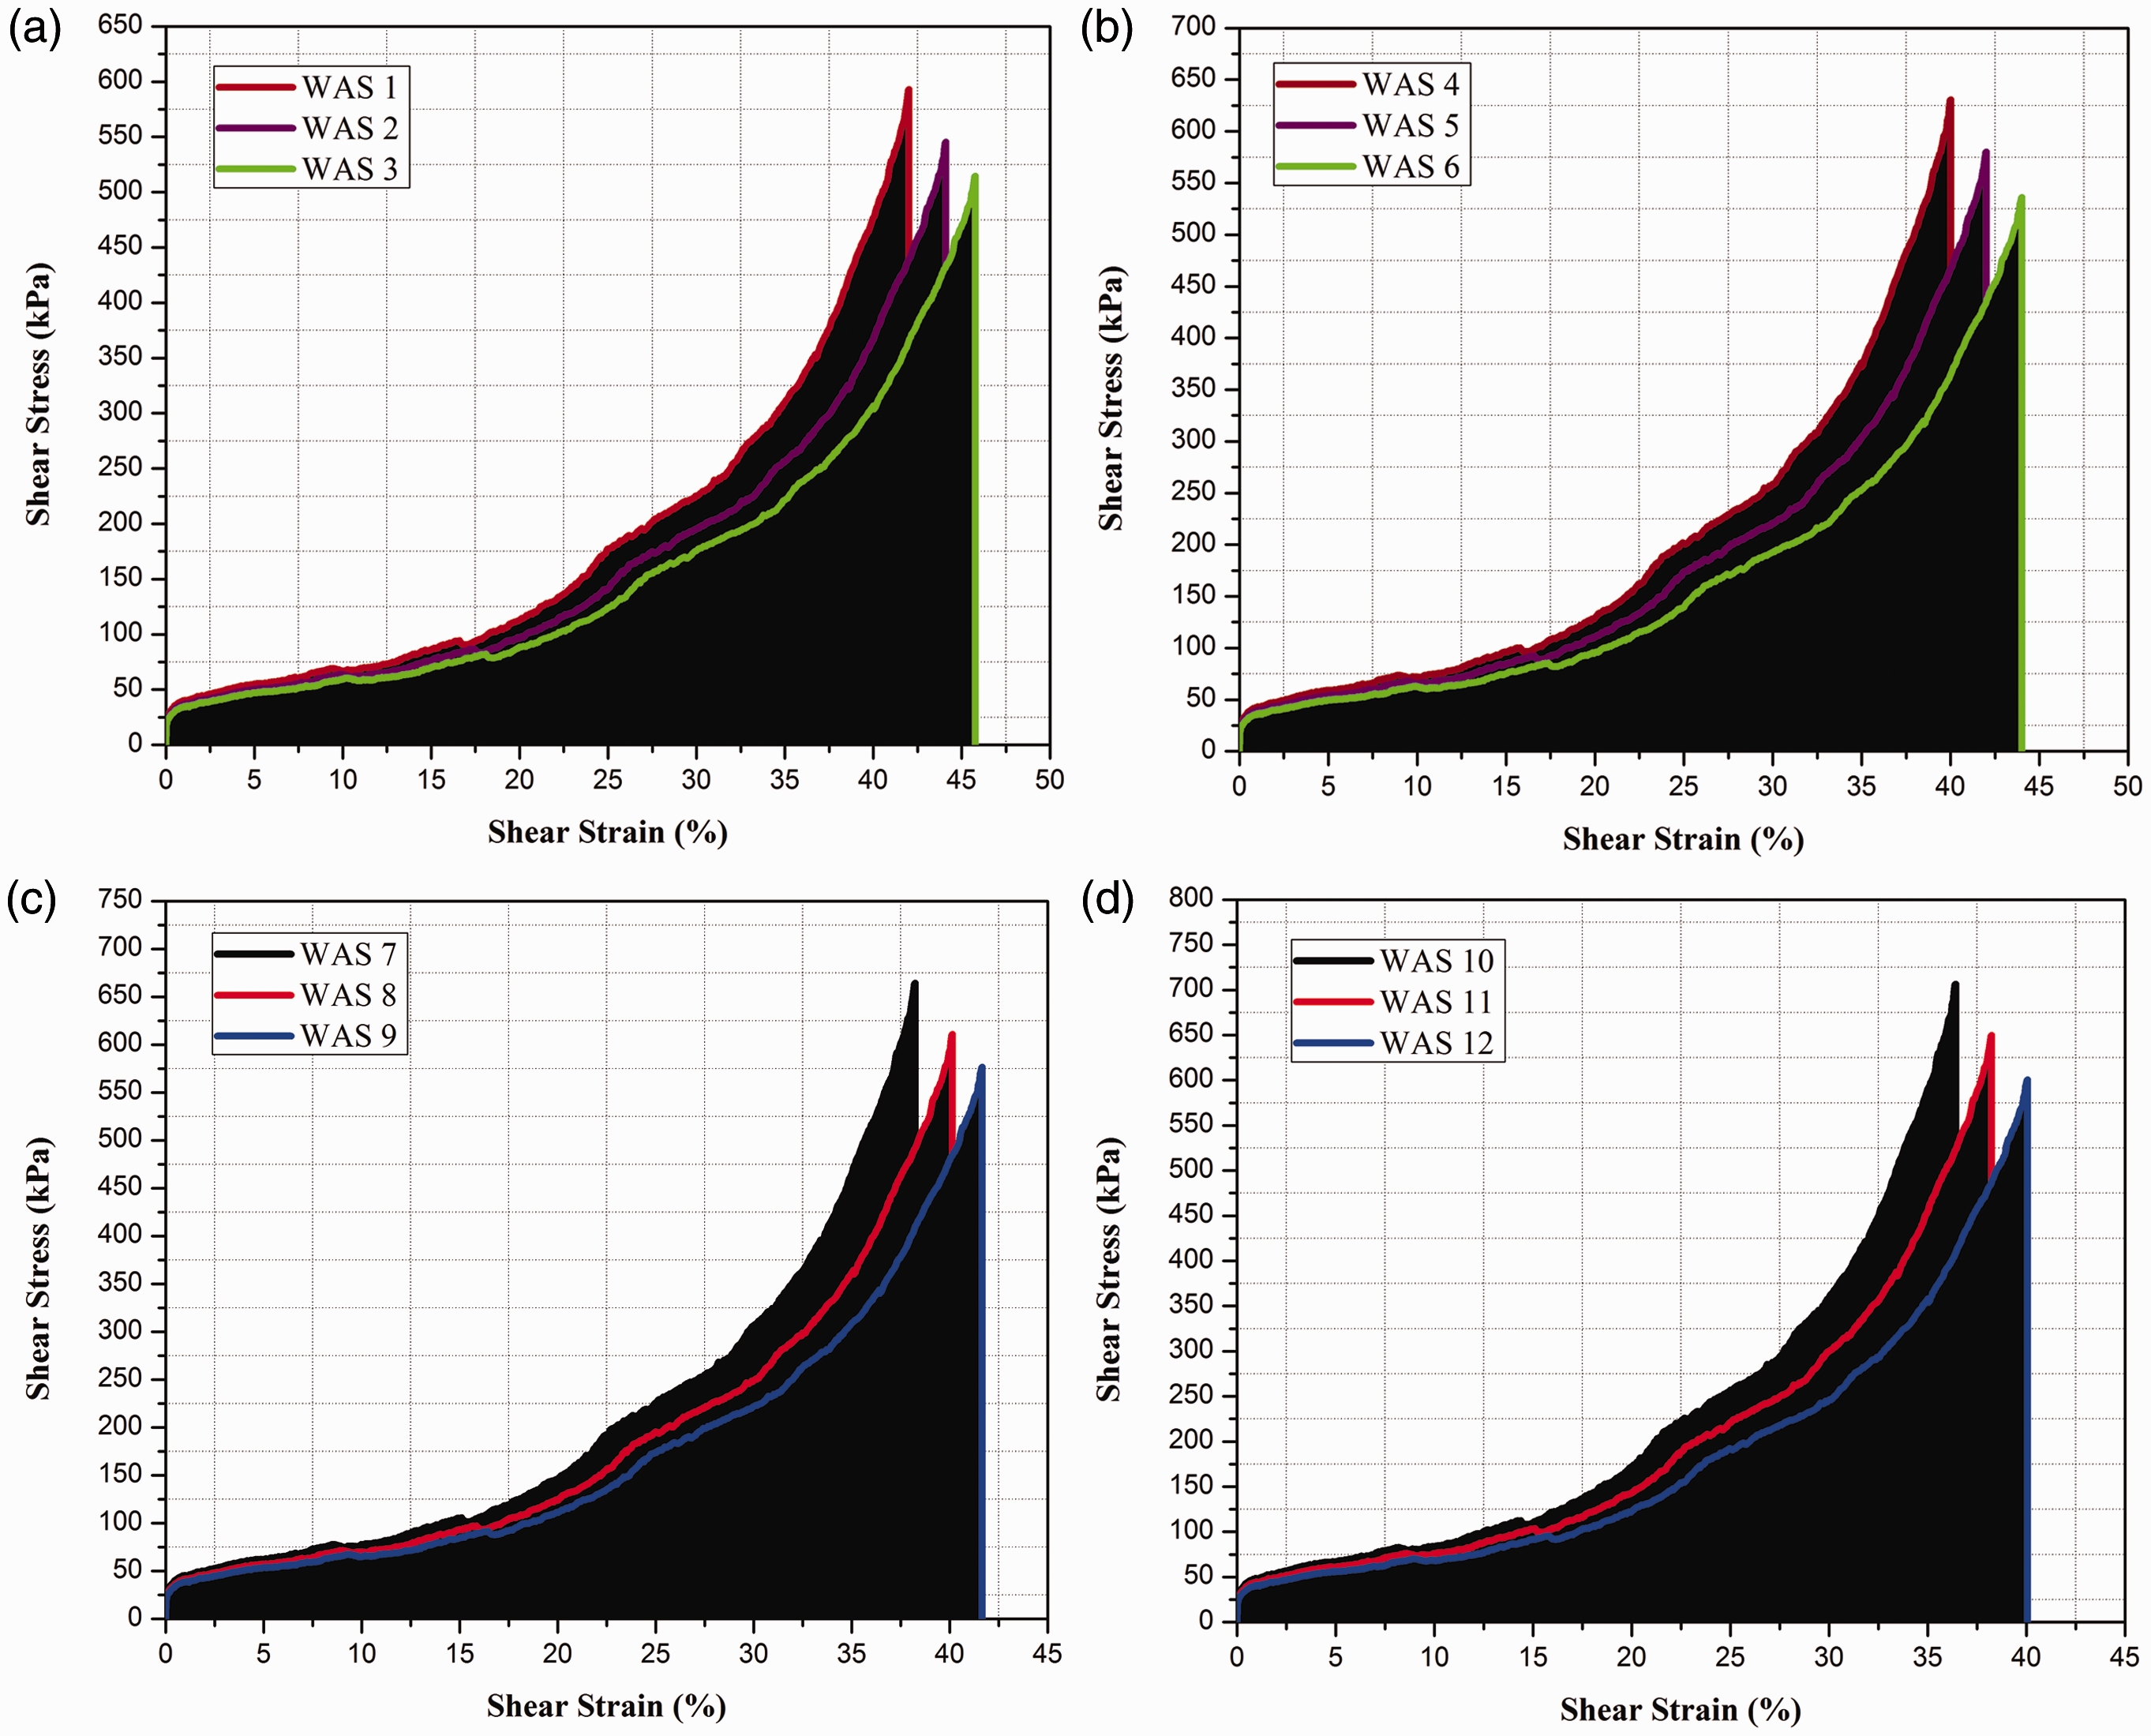
Absorbed energy during shear deformation of warp-knitted spacer fabrics.

WAS: warp-knitted spacer fabrics.

In-plane shear energy absorption and efficiency of lock knit spacer fabrics.
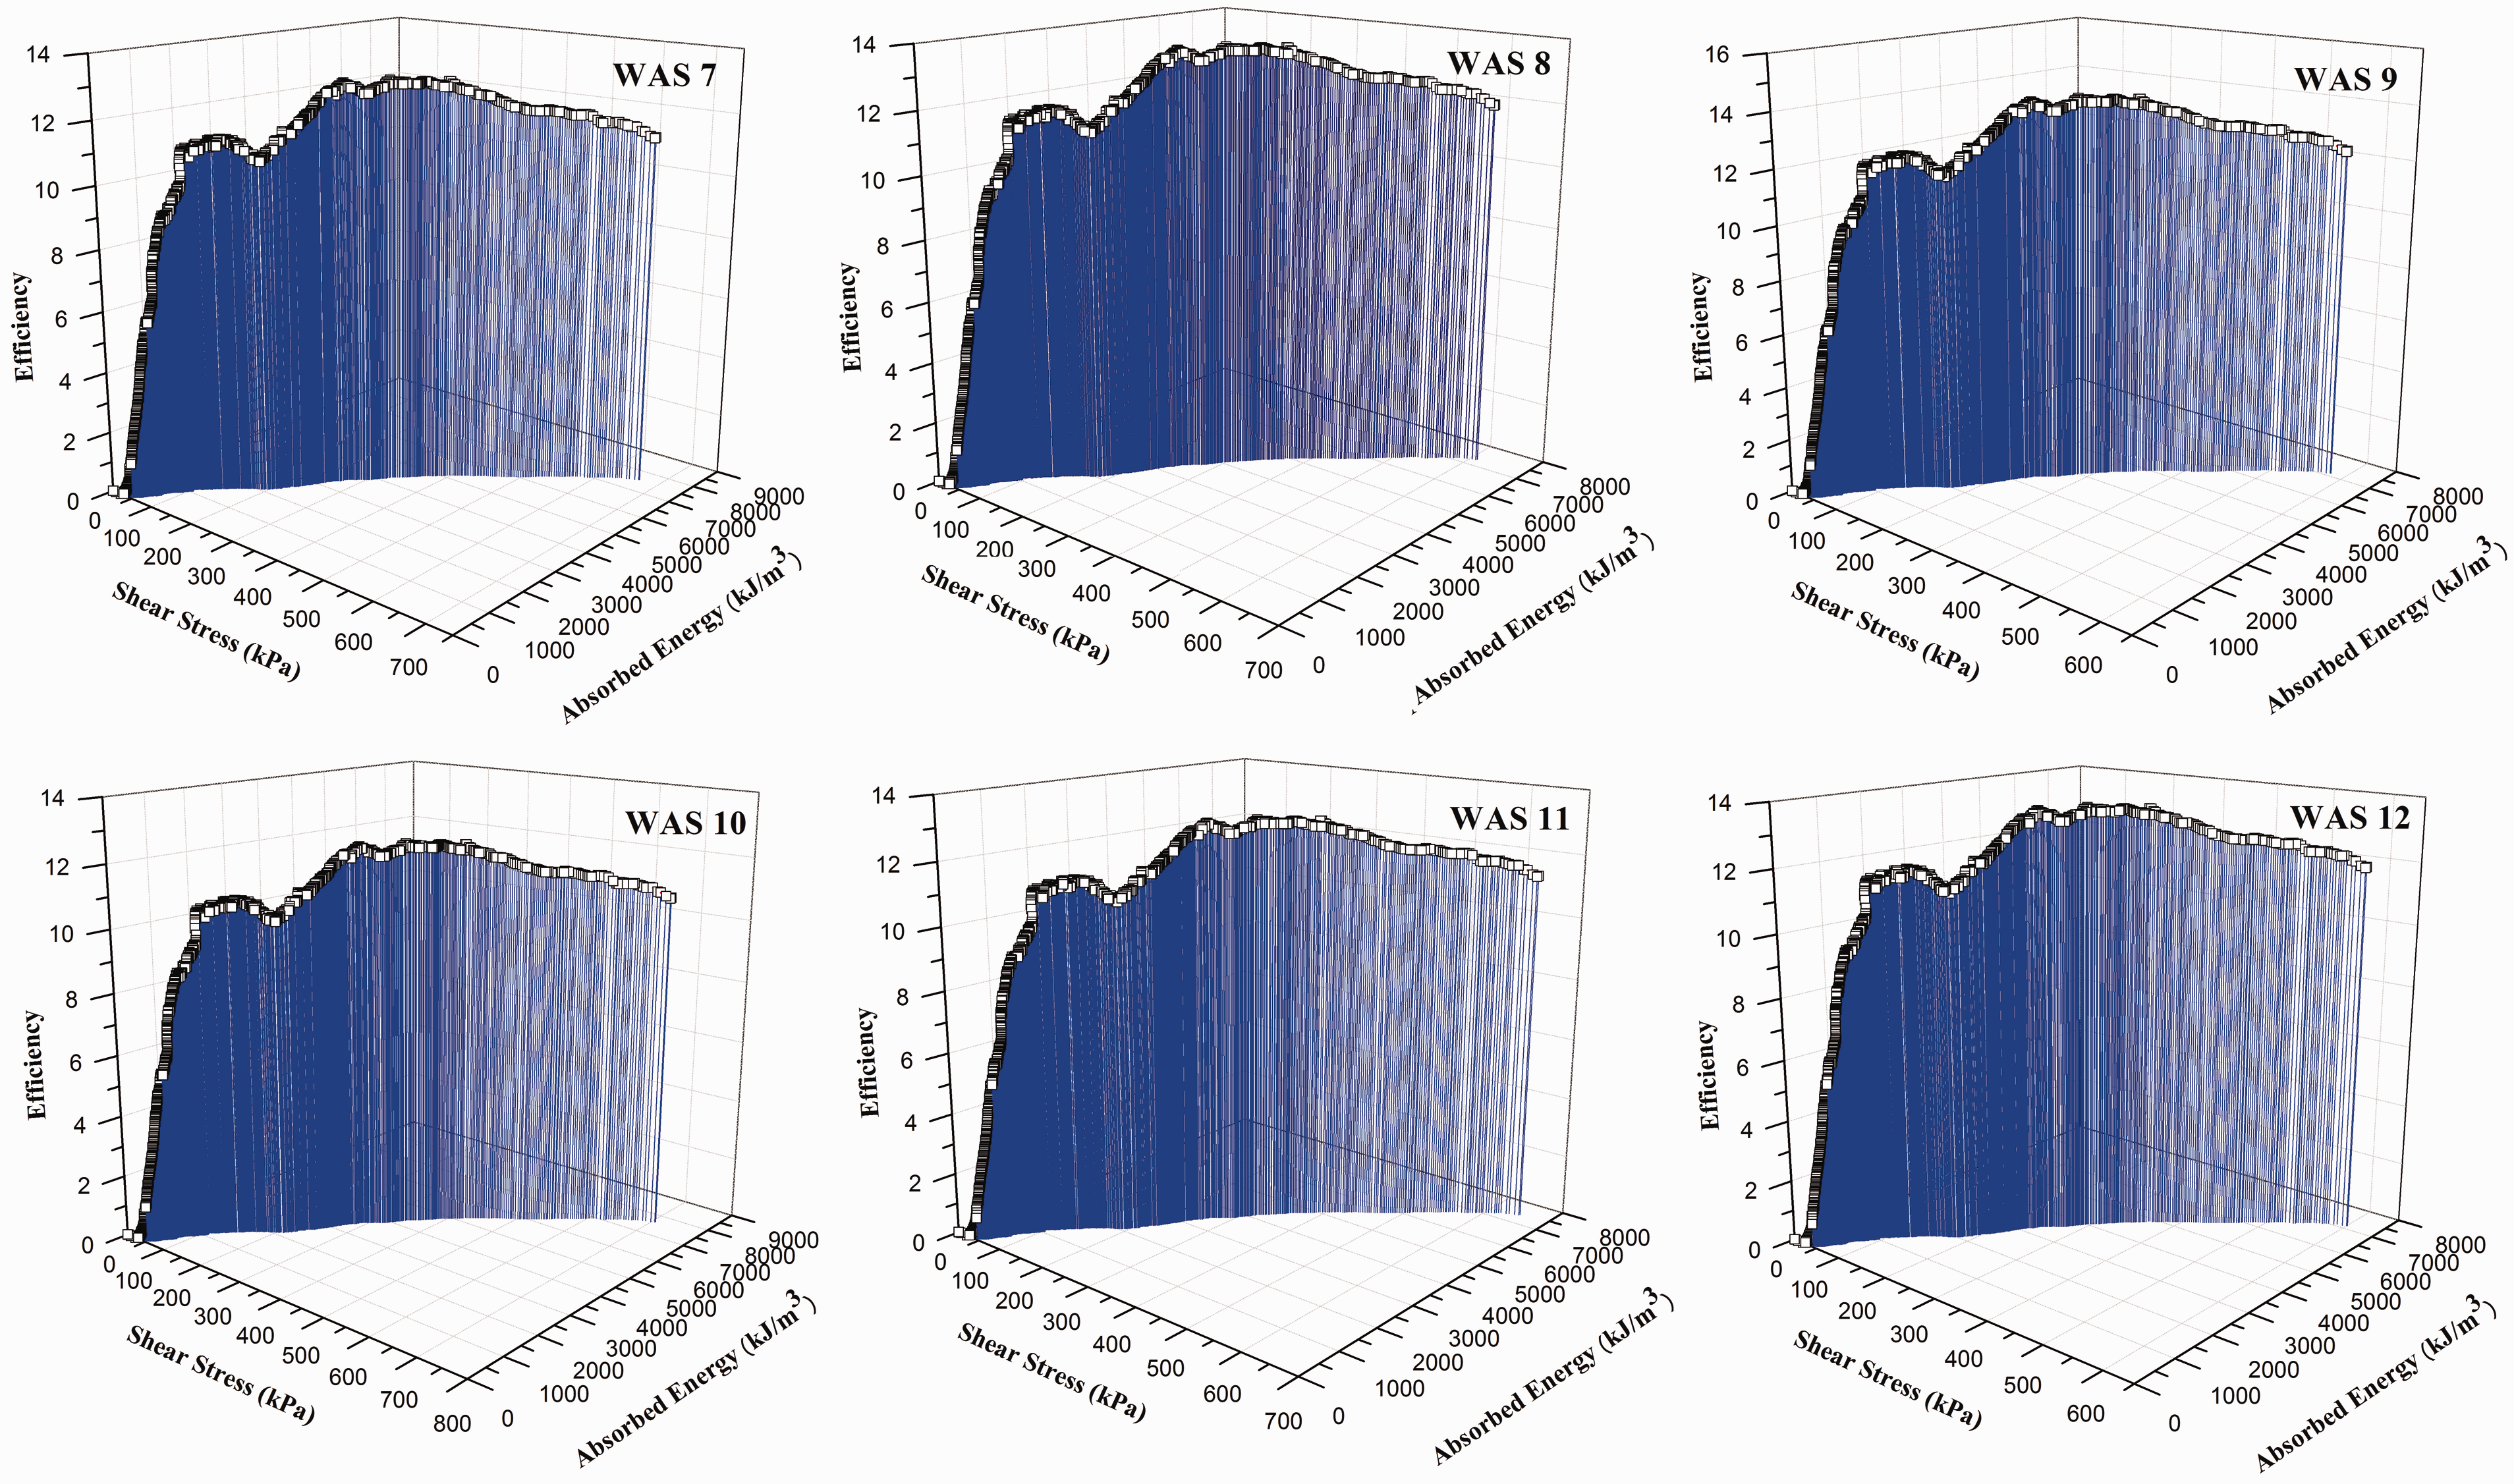
In-plane shear energy absorption and efficiency of hexagonal net spacer fabrics.
As it is observed from the Figure 11, the fabric with hexagonal net structure shows similar tendency in energy absorption and efficiency with regard to thickness and spacer yarn. The maximum energy-absorption efficiency is obtained at the end of the densification stage. As noticed in the densification stage from Figures 11 and 12, efficiency becomes almost constant with increase in stress level. It may also be because of locking of the spacer yarn and with the yarns in the surface structure of spacer fabrics. The point at the maximum energy-absorption efficiency can be considered a critical point in the densification zone. Overall, it was observed that the shear work done and efficiency are higher for the thin fabrics with low density. Also, it was found that fabrics with finer spacer yarns undergo large amount of work done as well as high efficiency during shearing mechanism.
Relation between shear angle versus shear force of warp knit spacer fabrics
The in-plane shear angle versus shear stress of 12 WAS fabrics were carefully evaluated and presented in Figure 13. It is observed from the graph that the thin hexagonal net spacer fabric with coarser spacer yarn (WAS 10) offers more resistance toward shear deformation than that of other fabrics. The thick lock knit fabrics with low-linear density spacer yarn (WAS 3) have ability to undergo high shear angle with low shear stress.
Experimental determination of shear force and shear angle.
Regression model for shear deformation
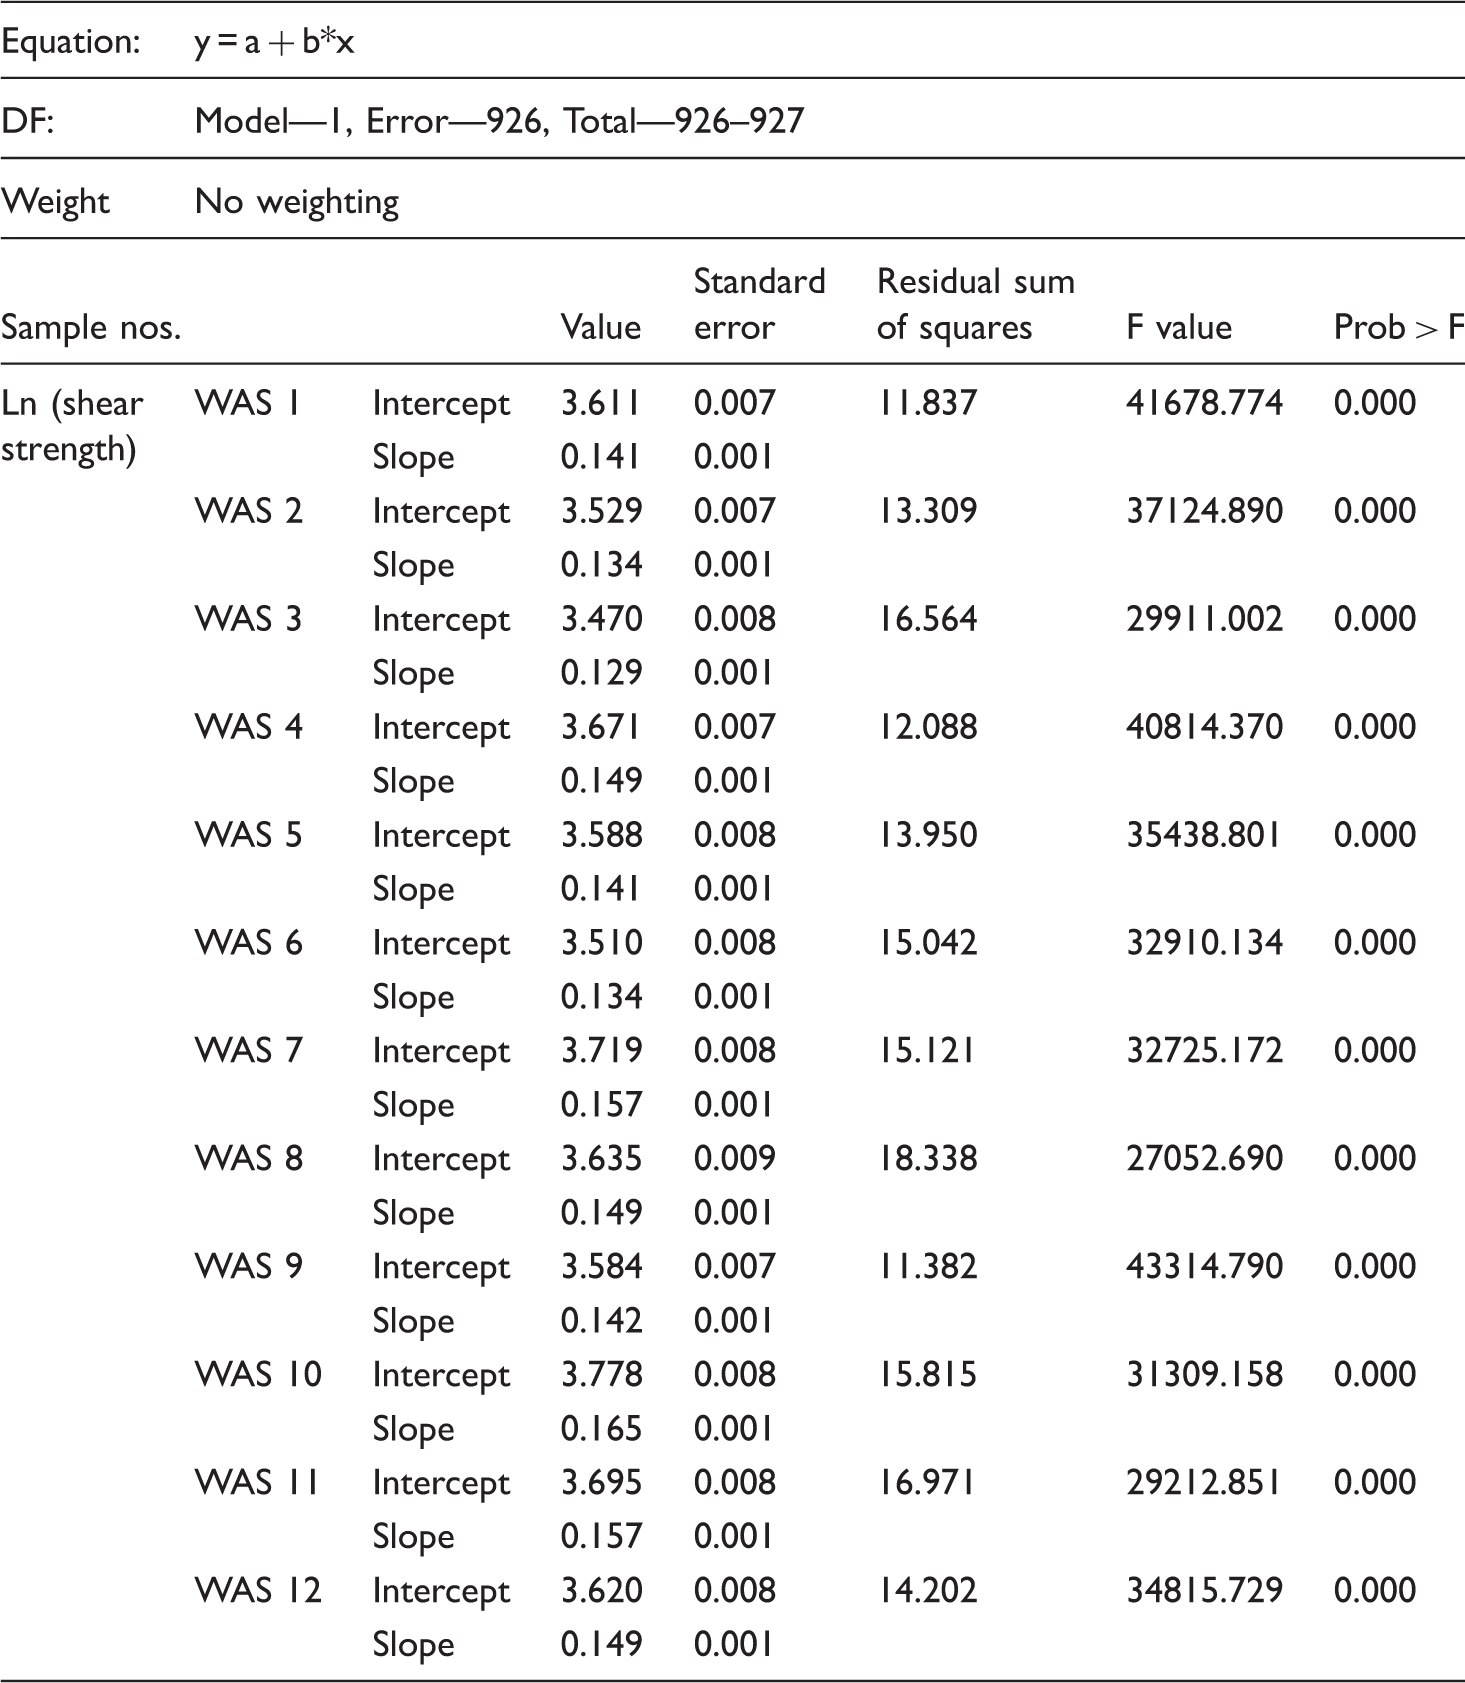
Linear relationship between two variables x and y is a common concept, in which effective and easy assumptions help to deduct relationship between them. The average of in-plane stress responses against shear angle obtained for each spacer fabrics samples was fitted in the general form of linear fit (Figure 14). To obtain highly fitted linear equation and R2 value, the dependent variable values (shear stress) were transformed using log-transformation. Response fit analyses, regression coefficient estimations, and model significance evaluations were conducted. The estimated coefficient of determination and fitted linear regression equation are given in Table 4. The adequacy of the models was tested using residuals sum of squares and adjusted coefficient of determination (R2).
Linear regression fit of experimental shear stress of spacer fabrics as a function of shear angle. Prediction of experimental shear strength of warp knit spacer fabrics using linear regression model. DF: Degree of Freedom; WAS: warp-knitted spacer fabrics.
Statistical evaluation—In-plane shear behavior
Statistical evaluation for in-plane shear behavior.


Graphical output—statistical evaluation for in-plane shear behavior response.
Differences between levels and interactions can be seen on this plot. The residuals versus prediction plot show the quality of fit of the model. From Figure 15(b), it is observed, closer is the points to the line y = x, the more significant the model is. If the lines for factor A are similar for each level of the factor B, then the factor A is probably significant. If the lines have rather opposite direction, then there is probably strong interaction between the factors. If the lines are shaped rather randomly, then the influence and significance of the respective factor are probably low. The plot is only a qualitative visual tool and cannot fully replace the F test. Figure 15(c) and (d) shows that the lines of factor—thickness look merely the same trend, not just opposite to the factor—spacer yarn diameter, hence it reveals that there is no interaction between these two factors.
Determination of shear angle using image analysis method
The shear angle of WAS fabrics was determined using image analysis method at different displacement levels and presented in Figure 16(a) and (b). In both the cases (lock knit and hexagonal structures), the spacer fabric samples (WAS 1–WAS 12) have smooth and linear increases in shear angle till 25-mm displacement.
Determination of shear angle using Image Analysis method.
The irregular trend in shear angle observed after 25-mm displacement may be due to the fact that spacer fabric undergoes compaction which leads to buckling. In the buckled fabric, it is extremely complex to find the same shear angle at different points using Hough transformation image analysis method. The image analysis shear angle is plotted against the shear strain for both the structures such as lock knit (WAS 1–WAS 6) and hexagonal net (WAS 7–WAS 12) as given in Figure 17. Also, the linear model fit was presented in figures with shear strain as independent variable and shear angle as dependent variable. The regression equations for all the samples are given in Table 6 with the probability to find the degree of linear fit.
Linear regression fit of shear angle using image analysis as a function of strain (a) Lock knit structure and (b) hexagonal net structure. Prediction of shear angle using image analysis as a function of shear strain. WAS: warp-knitted spacer fabrics.

Comparative discussion of shear behavior using different methods
The shear angles are calculated by considering sample length as a substitute for L in equation (2) and it is further used for calculation of shear force.
Figure 18 shows the comparison of shear angles between image analysis and both experimental measurements for all 12 specimens. The differences between image analysis and calculated shear angle using sample length at the chosen points are relatively small. It does not show any significant difference until pre-buckling occurs but significant difference occurs after 20-mm displacement. Using image processing technique, shear deformation of samples was not accurate after certain displacement; it might have happened due to the development of wrinkles in test area of samples.
Comparison of shear behavior of warp knit spacer fabrics using different test methods (a) Lock knit structure and (b) hexagonal net structure.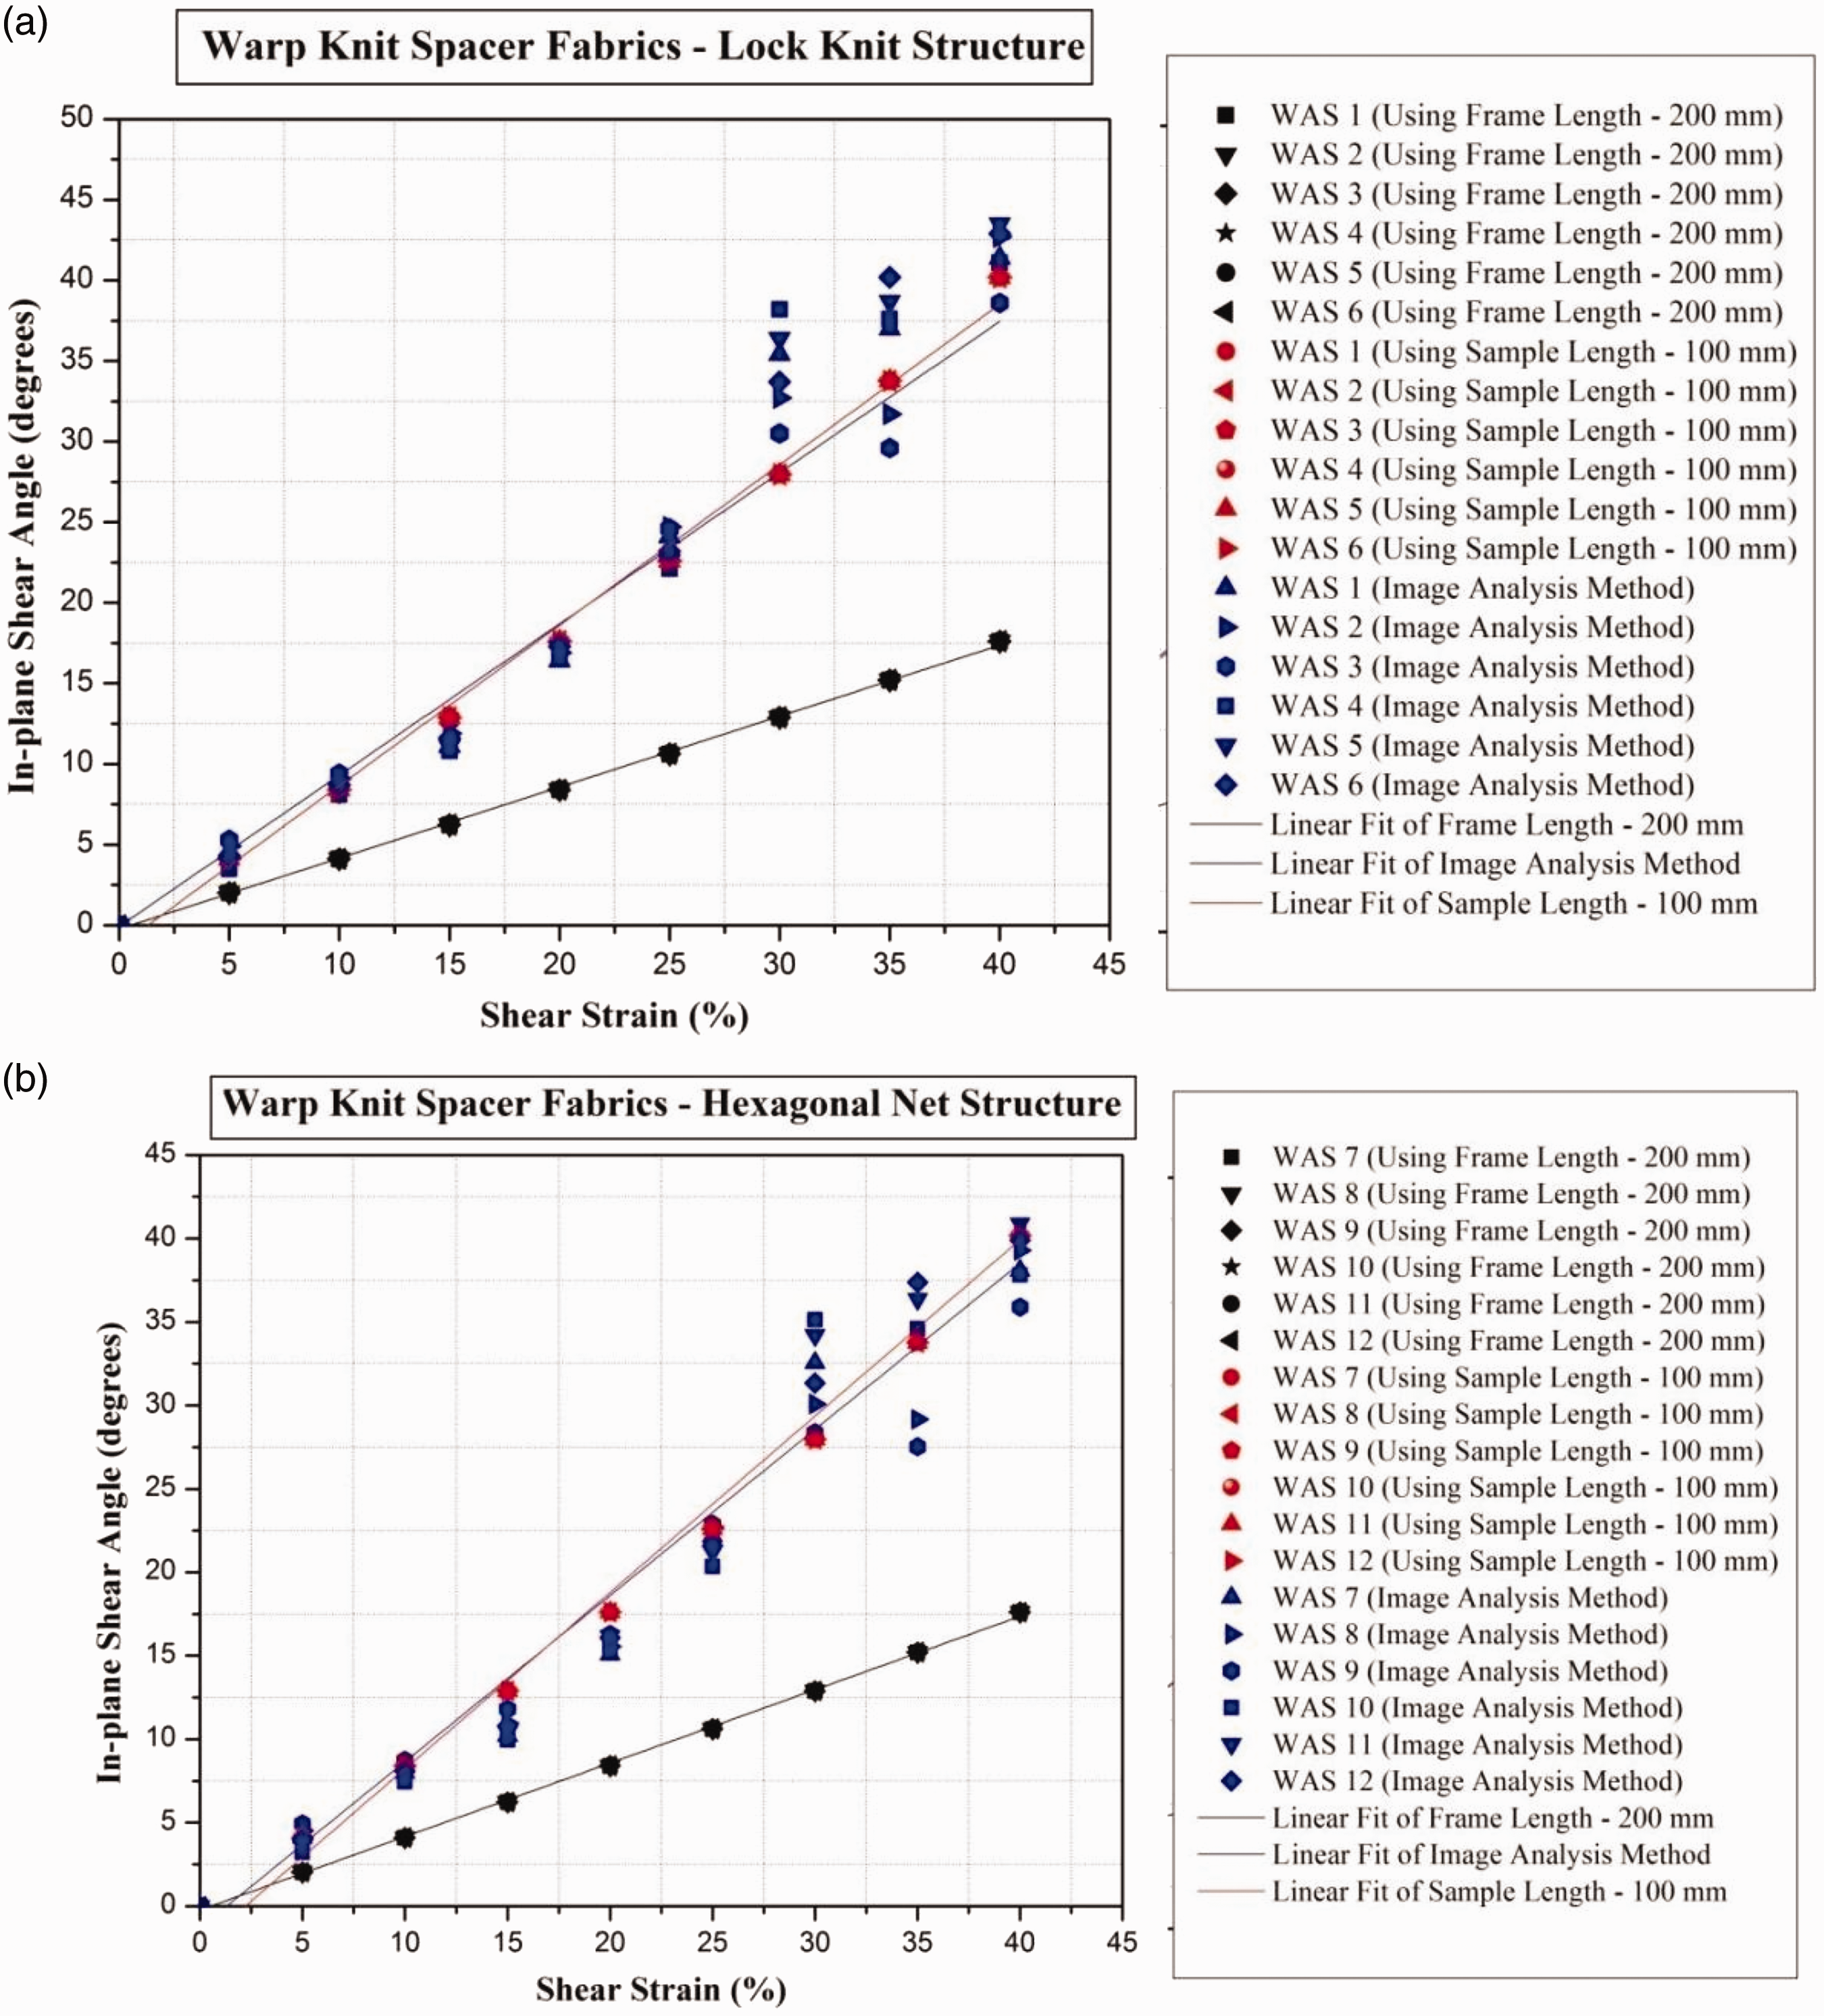
Prediction of shear stress as a function of shear strain using different methods.

Conclusion
3D WAS fabrics with varying thicknesses, spacer yarn linear density, and face structures resulted in significant shear performance. In-plane shear behavior of spacer fabrics is greatly influenced by their surface structures, type of spacer yarn, and the fabric stitch density. The nonlinear behavior of shear stress versus shear angle and the deformation mechanism was analyzed and it was established that shear deformation increases after limiting locking angle, which initiates the buckling of the sample. The work done is higher for the fabrics made up of hexagonal net structure on face side than that of lock knit fabrics. Shear stress is higher for the fabrics with coarser spacer yarns among all the fabrics samples. Significant differences in the shear stress–strain curve were obtained in the densification stage. The outer layers and spacer layer lead to higher compaction depending on thickness, density, surface structure, and spacer yarn properties. Even minor change in the spacer fabric thickness results in significant change in the shear behavior. The image analysis procedure provided much detailed information about the shear behavior of the fabric than stroke measurement. The displacement data and change in shear angles during loading process explain the excellent shear behavior of the WAS fabrics. The significant regression equations accurately predict the in-plane shear behavior and identify the most significant factors influencing the spacer fabric shear properties. The outer layer structure affects the monofilament yarn inclination, binding condition with surface, distribution, and multifilament stitches in surface layers. Suitable models can be developed to interrelate shear behavior with compression and related deformations. Such an approach can enable attaining the needed performance based on constructional parameters with sufficient accuracy.
Footnotes
Declaration of Conflicting Interests
The author(s) declared no potential conflicts of interest with respect to the research, authorship, and/or publication of this article.
Funding
The author(s) disclosed receipt of the following financial support for the research, authorship, and/or publication of this article: This work was supported by the research project of Student Grant Competition of Technical University of Liberec no. 21195/2017 granted by Ministry of Education Youth and Sports of Czech Republic.