
Abstract
Nonwoven fabric can be produced for thermal insulation. It has low fibre volume fraction. Thermal insulation property of fibrous materials depends on not only the thermal conductivity of fibre but also the entrapped static air. If fibre volume fraction is low in fibrous assembly it means that more air in the volume, therefore, the insulation property of the fabric increases, or vice versa. In this research thermal bonded nonwoven fabrics were used to analyse the heat transfer phenomena and predict the effective thermal conductivity and thermal resistance by using finite element method. Finite element models of nonwoven fabrics were created by two techniques: 3D reconstruction and solid modelling. For validation purpose, the effective thermal conductivity results obtained from an in-house developed instrument were compared with predicted results from the developed finite element models. Furthermore, this research work also contains an investigation of the effect of fibre volume fraction and thermal conductivity of fibre on the overall heat transfer of nonwoven structures.
Keywords
Introduction
Nonwoven fabrics are widely used in many application areas such as insulation, filtration, health care, protective clothing, automotive interiors, consumer and industrial wipes because of their specific thermal property, filtering, bacterial barrier, flame retardancy, resilience, stretch, softness, strength and absorbency [1].
Many researchers have analysed the heat transfer through fibrous structures in terms of fibre conductance, bulk density and fibre arrangement. Bogaty et al. [2] studied the effect of pressure on thermal conductivity of fabric by using two plates method. They used the results of thermal conductivity of fabric obtained from the experimental device at different levels of pressure to find out the effective fraction of fibres parallel (x) and perpendicular (y) to the direction of heat flow by using equation (1)

They concluded that:
thermal conductivity of fabric increases with the increase of proportion of fibres which are parallel to the heat flow at higher bulk density; thermal resistance of fabric can be improved by using low thermal conductive fibres which are arranged parallel to the surface or perpendicular to the direction of heat flow; and at a given bulk density the insulation property of fabric can be improved by using higher density of fibre because fibre volume fraction is dependent on the bulk and fibre density. The fact is that the fibre volume fraction is inversely proportional to fibre density. It means that the higher the fibre density at given bulk density the less the fibre volume fraction will be hence the more volume fraction of air.
In the above model there is no consideration of thermal anisotropy of fibres in fabric. Imakoma et al. [3] developed a unit cell model, as shown in Figure 1, to determine the effective thermal conductivity of fibrous insulation by considering the conduction heat transfer.
Conduction heat transfer unit cell model [3].
Two semicylinders represent two fibres which are parallel to the surface of the material. In this unit cell model there is no consideration of contact between fibres. In order to compensate this issue, they proposed another unit cell in which contact among the fibres was considered but it was assumed that the thermal resistance at contact point was much higher than that of within fibres. In their models random orientation of fibre was taken; however, they also failed to take into consideration of the thermal anisotropy nature of fibre. Naka and Kamata [4] analysed the thermal conductivity of wet fabric by varying the water content. In their model the effect of thermal anisotropy of fibre was considered in order to calculate the thermal conductivity of fabric normal (Kv) and parallel (Kw) to the surface by


In the above described model there was no consideration of actual orientation of fibre. Kawabata [5] evaluated the thermal anisotropy of fibre by measuring the thermal conductivity of fibre along and perpendicular to the fibre axis and the result of thermal conductivity of fibres obtained shows strongly in anisotropy. It is believed that in order to calculate the effective thermal conductivity of fibrous material it is necessary to consider the thermal anisotropy of fibre.
Kawabata measured the longitudinal thermal conductivity of fibres by clamping the parallel fibres in the copper chuck. The distance between the chucks/clamps or sample length is around 3–7 mm, sample width about 30 mm and cross-sectional area of fibres is about 3–5 × 10⁻⁶ m2. Base chuck has constant flow of water and the temperature difference of 10℃ was maintained by a built-in chuck sensor as shown in Figure 2(a). The longitudinal thermal conductivity (KL) of fibre can be calculated by equation (4)
Measuring head for measurement of thermal conductivity: (a) longitudinal and (b) transverse.

In Kawabata’s work the transverse thermal conductivity of fibre contained in composite plate was measured. The composite plate was composed of parallel fibre bundles which impregnated in epoxy at high pressure about 1 ton/cm2 and cured. The thickness of plate is around 0.5–1 mm and the surface area of 5 × 5 cm2 was placed between the plates as shown in Figure 2(b).
The transverse thermal conductivity of fibres was calculated by

Woo et al. [6] developed an analytical model for the thermal conductivity of nonwoven fabric in the transverse direction by considering fibre orientation, thermal anisotropy of fibre and fabric orthotropic effect as shown in equation (6)


They analysed the effect of fabric geometry on thermal conductivity of the nonwoven fabric and concluded:
the conduction is the prominent mode of heat transfer; there is no evidence of convective heat transfer and radiative transfer was only effective when the fibre volume fraction is less than 3%; the thermal conductivity of fabric is affected by the fibre volume fraction; and the thermal conductivity of fabric is influenced by fibre orientation and thermal anisotropy of fibre. The overall thermal conductivity of the nonwoven fabric would increase for fibres arranged parallel to heat flow compared to that of the fibres arranged perpendicular to heat flow.
Nonwoven fabrics can be produced in three stages: web formation, web bonding and finishing (optional) as shown in Figure 3.
Stages of nonwoven fabric manufacturing process.
Figure 4 shows the process flow of thermal point bonding of nonwoven fabric. Two rollers one smooth and other engraved are used. A web which contains thermoplastic fibre is passed through these two heated rollers; the web melts at the contact points and binds thermoplastic fibres to form a nonwoven fabric. The fabrics produced by this method are relatively softer than the fabric produced by thermal bonding with high pressure.
Thermal point bonding process of nonwoven fabrics.
The advantages of thermal bonding over other bonding techniques are as follows:
energy efficient compared to chemical bonding because in chemical bonding high amount of energy is required to evaporate water from adhesive [7]; high production rate compared to chemical bonding [7]; environmental friendly because there is no any chemical involved; and the end product developed have soft handle.
Thermal bonded nonwoven fabrics with unique structural properties and applications were used in this study. They have been used for protective clothing, cloth interlining, insulation, etc. The heat transfer behaviour of thermally bounded nonwoven fabrics has not been studied by numerical analysis except randomly distributed nonwoven fabric [8–12]. In this study methods have been developed to predict the effective thermal conductivity of thermally bonded nonwoven fabric via finite element (FE) method by using the actual geometrical parameters of nonwoven fabric, analyse the fibre orientation by using 2D Fast Fourier Transform (FFT) and the effect of fibre volume fraction and thermal conductivity of fibre on the overall heat transfer of nonwoven structures. This will contribute to the knowledge base of nonwoven textile research and will be useful for nonwoven textile industry due to the rapid market growth of nonwoven fabrics and their applications [13].
Methodology
The following methodology is adopted to calculate the effective thermal conductivity and thermal resistance of thermal bonded nonwoven fabrics:
3D reconstruction of thermally bonded nonwoven fabric by using µCT image; unit cell modelling of nonwoven fabric by using repeating unit cell; calculation of the effective thermal conductivity and thermal resistance of thermally bonded nonwoven fabric and analysis of the effect of thermal anisotropy and orientation of fibre using FE method; and estimation of fibre orientation by using 2D FFT.
Materials
Fabric specifications.

From µCT image.
Fibre properties [15].

Three-dimensional reconstruction of nonwoven fabric
Nonwoven fabrics have complex and irregular structures as compared to woven and knitted fabrics. In this work the geometrical models of nonwoven fabrics were obtained by 3D reconstruction through high-resolution X-ray computer tomography (CT). In X-ray CT the samples are rotated around a vertical axis in front of X-ray source and the reconstructed data come as slices and cut to normal to that axis, illustrated in Figure 5.
Schematic of X-ray tomography [16].
In order to develop the 3D reconstructed nonwoven fabrics, the fabric samples were cut in small strips with a scalpel and placed in boron nitride cup to hold (BN is extremely low in density and almost X-ray transparent).
A small angle cone X-ray beam source is used and samples are rotated around the vertical axis. Images are generated on the basis of X-ray attenuation showing the density of nonwoven fabric samples. These projection images are used to generate 2D slices which reflect the inside of the samples when it is cut to normal to the axis of rotation. The resolution of the data collected was 3.713 µm per voxel (a voxel is the volume equivalent to a pixel). Figure 6 shows the 3D rendering of grey scale image achieved by ImageVis3D [17].
Three-dimensional rendering of (a) sample-1, (b) sample-2 and (c) sample-3.
Unit cell model of thermally bonded nonwoven fabric.
The unit cell models of thermally bonded nonwoven fabrics have been developed by using repeat unit cell approach, shown in Figure 7. The following two techniques were used:
X-ray CT; and solid model generation by using 3D reconstructed STL (Stereolithography/Standard Tessellation Language) mesh model. Unit cell model of thermally bonded nonwoven fabric.

Unit cell model from X-ray CT.
Unit cell model of thermally bonded nonwoven fabrics obtained from the X-ray CT was created in four steps:
image collection, 2D slice reconstruction and segmentation; 3D reconstruction and STL surface mesh generation; restoration and simplification of STL surface mesh; and solid unit cell model formation of STL surface mesh.
Image collection, 2D slice reconstruction and segmentation
One thousand four hundred and twenty-nine 2D grey scale sliced images obtained from CT scan were assembled in ImageJ [18] to develop the stack. These stack images were binarised/segmented in order to extract the solid fibrous portion from their backgrounds by using sufficient thresholds of grey levels. In this work Otsu algorithm [19] was utilised to binarise the stack of images as shown in Figure 8. Otsu algorithm binarises the image by the following steps:
calculate the grey level of normalised histogram of the input image; find the potential threshold level of input image and categorise the pixel into two groups (background and foreground); calculate the mean of each group; calculate the between-class variance ( obtain the optimal threshold that maximises the between-class variance ( use the optimal threshold to binarise the input image.
The drawback of Otsu’s method is that it fails in case of the object and background pixels are extremely unstable (unimodality of the object function). During the segmentation of the stack images in ImageJ by using Otsu’s method it is important to use the optimum threshold level to ensure that the fibre volume fraction of thermally bonded nonwoven fabric will not be changed. If the fibre volume fraction is changed during the segmentation process, the effective thermal conductivity will be affected significantly.
Three-dimensional reconstruction and STL surface mesh generation
After the segmentation step, stack images were cropped and the slices were reduced in order to obtain the quarter unit cell of thermally bonded nonwoven fabric. A 3D viewer plugin [20] of ImageJ was used to generate surface mesh (shell) of sample-1 in STL format which contains 254,388 triangular faces, 381,582 edges and 126,778 vertices.
Three-dimensional reconstruction steps (a) 2D grey scale stack slice image of sample-1, (b) segmented image by Otsu’s method, (c) cropped unit cell segmented image of sample-1 and (d) 3D reconstructed unit cell of sample-1.
Restoring and simplification of STL surface mesh
Surface mesh file was imported in MesLab [21] and filters were applied to remove the duplicate faces, zero area faces and self-intersecting faces. Quadratic edge collapse decimation was also used to reduce the number of faces which ultimately reduced the computing cost and time. Figure 9 shows how this Quadratic edge collapse decimation filter works. When quadratic edge collapse decimation filter is applied it is important to make sure that the geometric parameter mesh volume keeps no change because it represents the fibre volume fraction. After applying Quadratic edge collapse decimation filter the faces of sample-1 reduced from 254,388 to 40,000.
Faces reduction: (a) sample-1 with 254,388 faces and (b) sample-1 with 4000 faces after Quadratic edge collapse decimation filter.
Solid unit cell model form STL surface mesh
After the application of filter and face reduction in MeshLab the STL file was imported into Abaqus/CAE by using STL import plug-in which enables to import a model from Stereolithography (*.stl) file into Abaqus/CAE by using node merge tolerance of 1 × 10⁻⁶ as shown in Figure 10. A plug-in was used to convert STL mesh model into shell geometrical model and the volume was added to make the shell solid, shown in Figure 11. Some portion of the model is still in shell form after conversion by plug-in, therefore the built-in GUI function of Abaqus/CAE “shape solid from shell” has been utilised to further convert shell portion into solid.
STL mesh model: (a) sample-1, (b) sample-2 and (c) sample-3. STL: Stereolithography/Standard Tessellation Language. Create geometry from mesh plug-in.

Unit cell model by using 3D reconstructed STL mesh model
Solid unit cell model was developed by using STL mesh model as shown in Figure 12. The parametric dimensions of thermally bonded nonwoven fabrics were determined in MeshLab by using STL mesh models and described in Table 3. It is assumed that the bond points were solid without any porosity, while the fibrous part is considered as solid, shown in Figure 12(b). Their fibre volume fraction values need to be calculated.
Nonwoven models: (a) STL mesh model of sample-3 and (b) solid model of sample-3. STL: Stereolithography/Standard Tessellation Language. Sample geometric dimensions.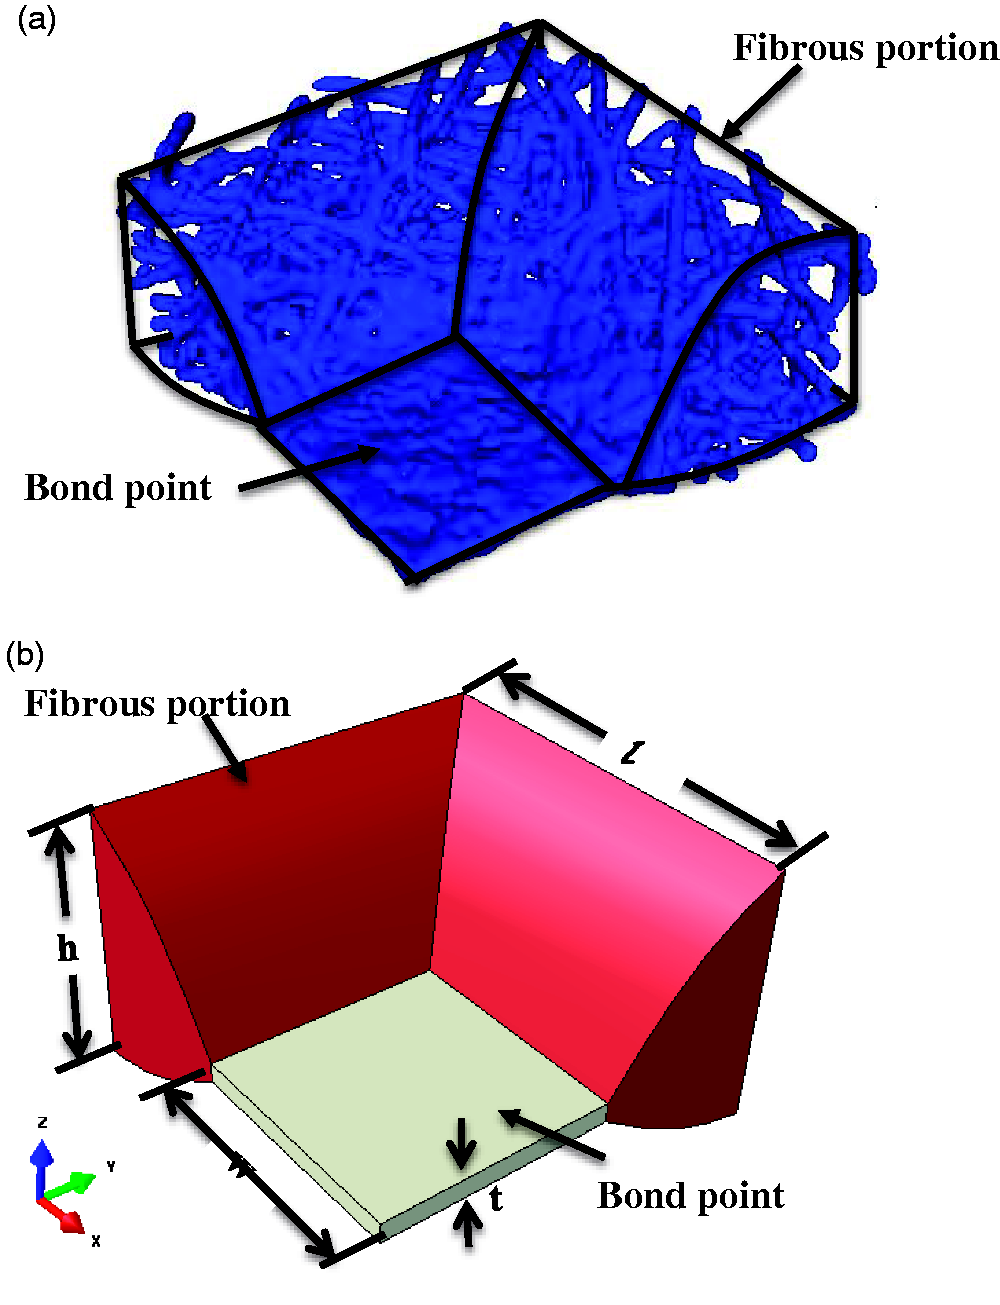

Fibre volume fraction of fibrous portion ( calculate the volume of bond point ( calculate the fibrous portion volume ( calculate the volume fraction of fibrous part in solid model by equation (7)
where 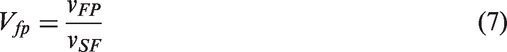
Effective thermal conductivity of thermally bonded nonwoven fabric
Effective thermal conductivity of thermally bonded nonwoven fabric was determined with consideration of the following assumptions:
there is no compression in nonwoven fabric when it is placed between the two plates during thermal conductivity testing; and entrapped air between the two plates and within in the fibrous portion of the nonwoven fabrics is considered as fluid matrix, shown in Figure 13.
Three-dimensional reconstructed and solid model with air fluid is shown in Figure 14. Thermal conductivity value of fibrous portion ( Experimental and simulation setup. Unit cell model of sample-1 with air fluid matric: (a) 3D reconstructed model and (b) solid model.


Fibre volume fraction and thermal conductivity of nonwoven fabric.

Predicted effective thermal conductivity and thermal resistance.


Unit cell model of sample-1 with air fluid matric: (a) heat flux contour of sample-1, (b) temperature contours of sample-1 and (c) temperature contours of sample-1 with air fluid matrix.

Heat flux and temperature contour of unit cell model of sample-1 (a and b) with air fluid matrix and (c and d) without air fluid matrix.

Heat flux and temperature contour of unit cell model of sample-2 (a and b) with air fluid matrix and (c and d) without air fluid matrix.

Heat flux and temperature contour of unit cell model of sample-3 (a and b) with air fluid matrix and (c and d) without air fluid matrix.
Figures 16 to 18 show the heat flux contour of solid unit cell model of thermally bonded nonwoven fabrics. The fibrous portion has less thermal conductivity as compared to the solid bond point; as a result, the contact point between the solid fibrous portion and bond point makes the heat flux profile changed. This effect is especially significant for sample-1 as it has thicker bond point as compared to the other two samples.
Experiment and model validation
Experimental results.

Three-dimensional model of experimental setup [23].
Figure 20 shows the comparison between the experimental and the FE modelling predicted results of thermal conductivity. There is good linear relationship between the two reflected by high correlation factor of 0.992372 and coefficient of determination of 0.98. However, the absolute mean error between the experimental and predicted results is high (17.86638%); this can be explained by the fact that there was no consideration of fibre orientation and thermal anisotropy of fibres in the model which exist in a nonwoven structure. This is agreed well with the finding by Siddiqui and Sun [23] that the isotropic analysis has more error as compared to the anisotropic conditions.
A comparison of effective thermal conductivity between predicted by FE model and experiment. FE: finite element.
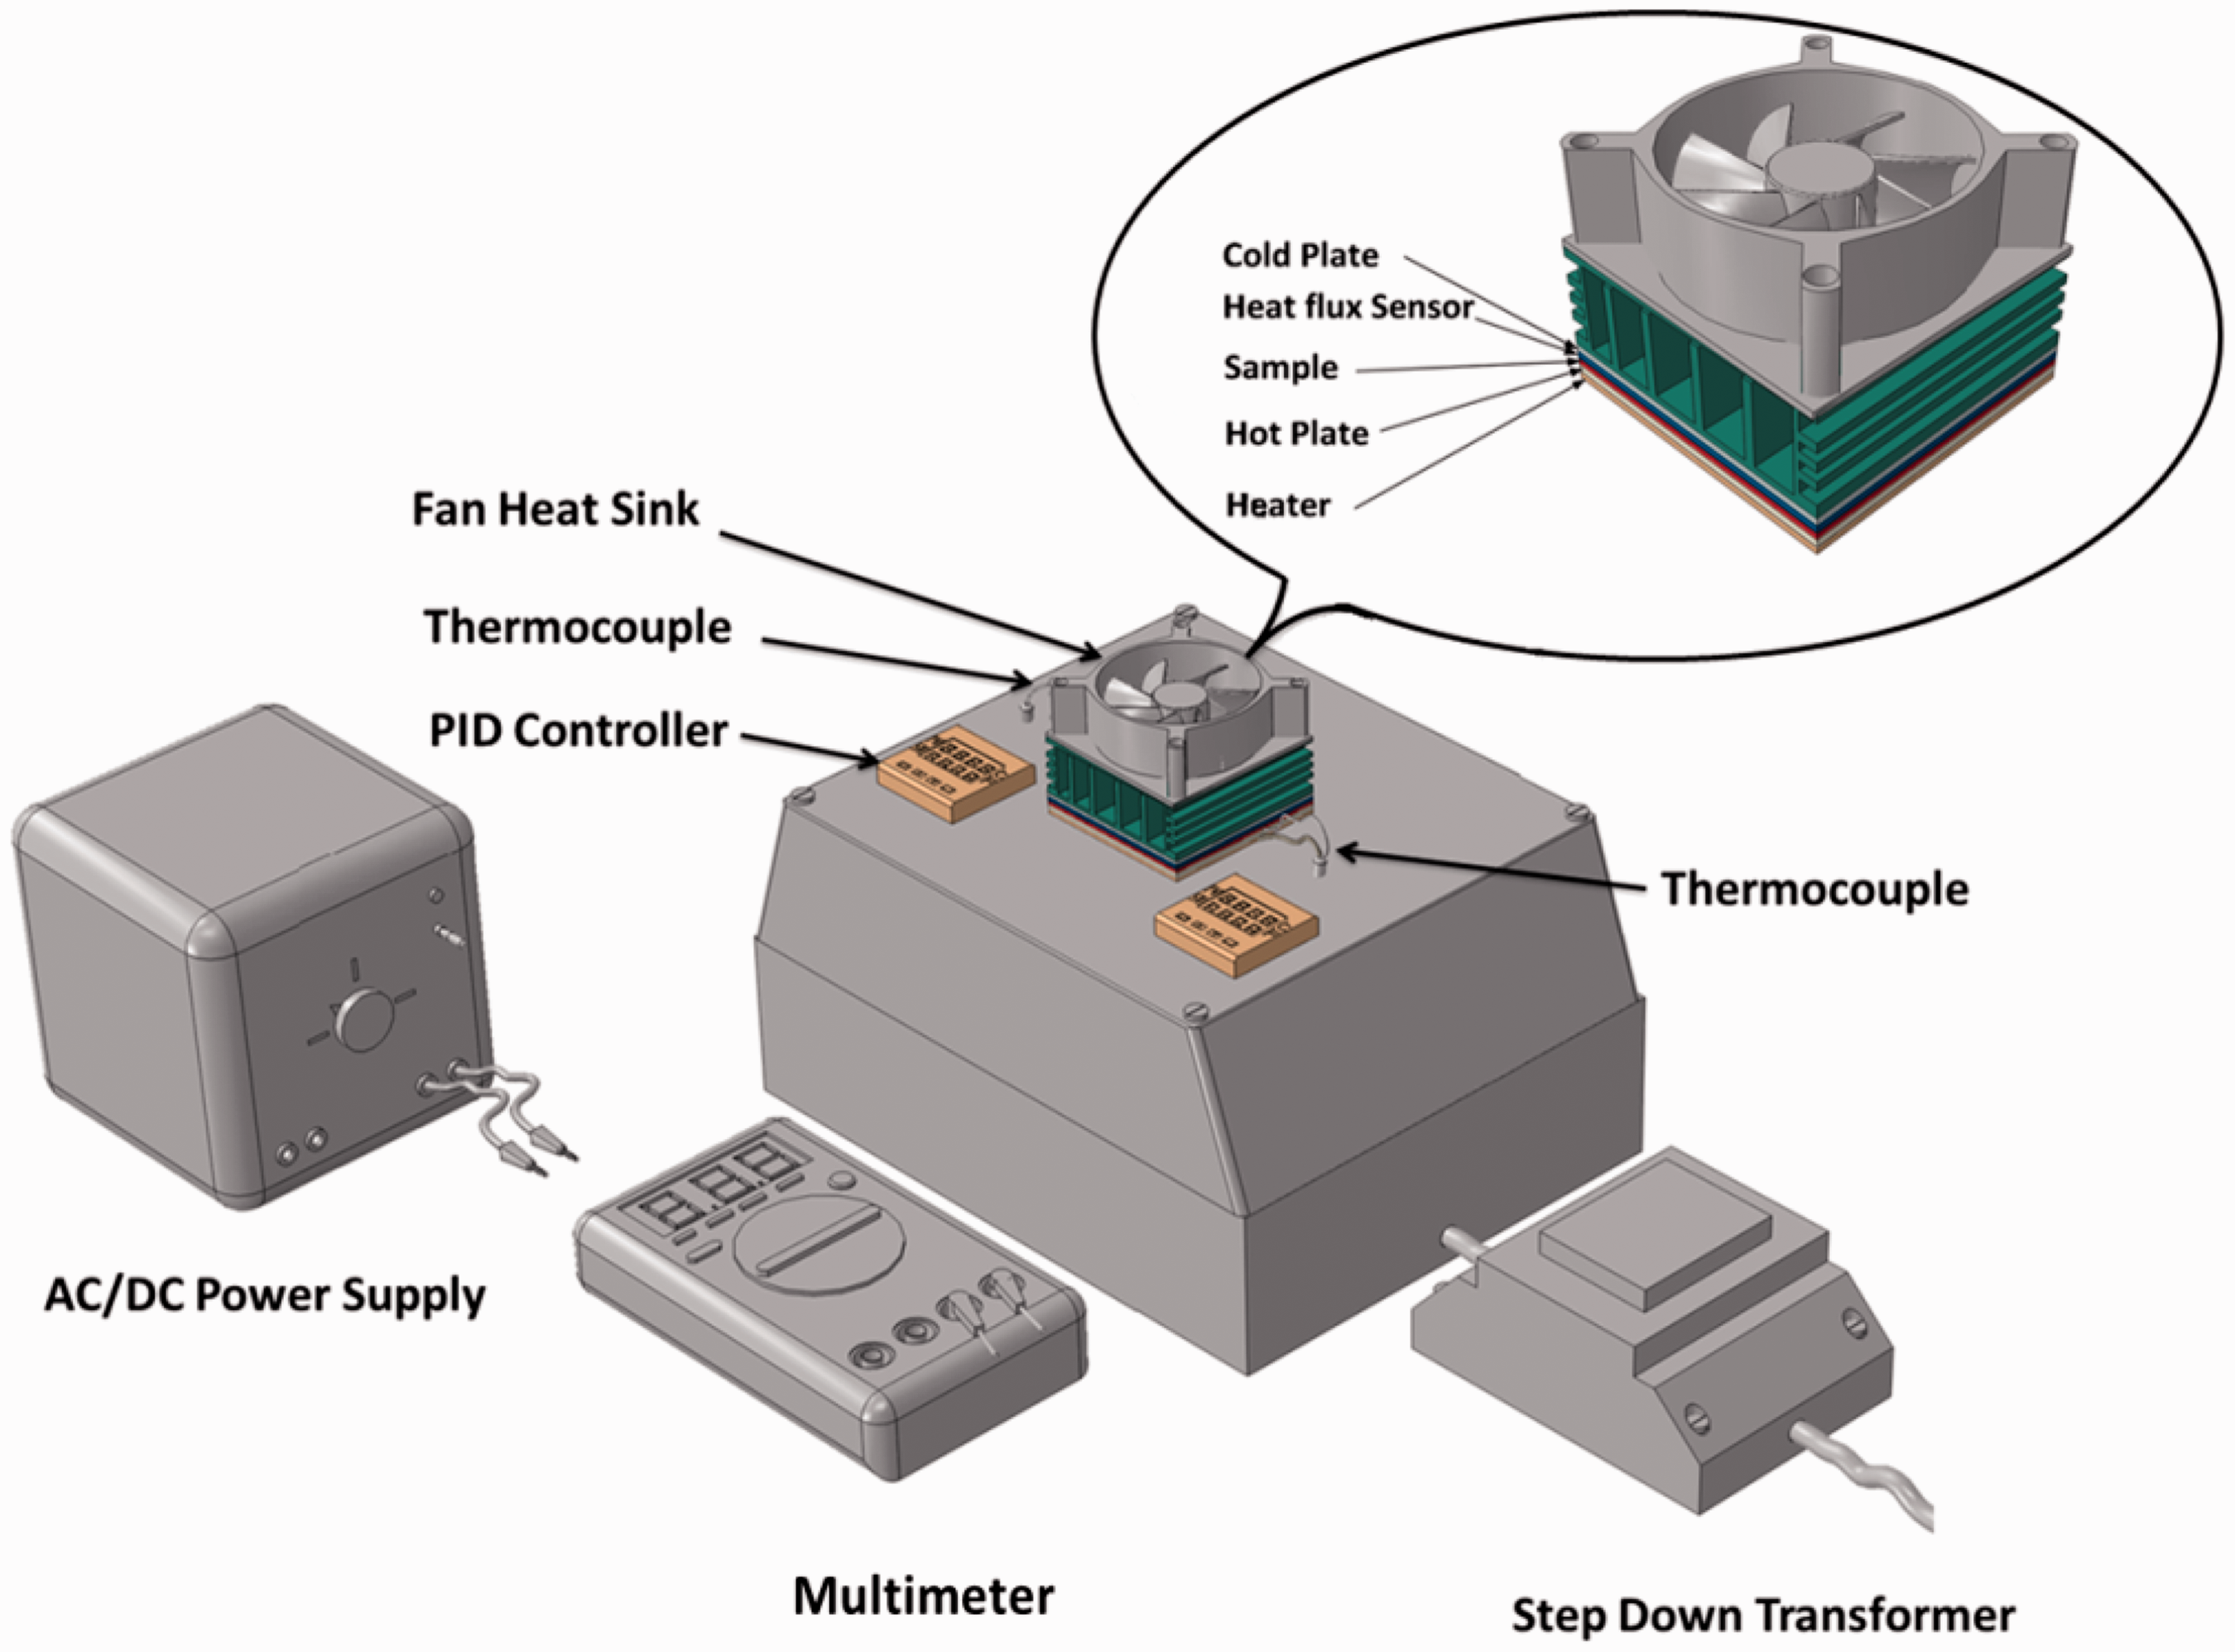
Figure 21 shows the comparison between the experimental and FE model predicted thermal resistance results. It shows good linear relationship between the two reflected by a correlation factor of 0.992378 and coefficient of determination of 0.9848. However, there is high absolute mean error (21.8267%) between the experimental and the predicted results, caused by the same reason explained above.
A comparison of thermal resistance between predicted by FE model and experiment. FE: finite element.
The next step is to evaluate the orientation of nonwoven fabric. For this purpose 2D FFT was utilised to measure the alignment fibres in nonwoven fabric. A 2D SEM image was utilised and a cropped portion between the two bonding points was taken for analysis of fibre orientation, presented in Figure 22.
Micrograph of sample-1.
Fibre orientation of thermally bonded nonwoven fabric has been evaluated by the following steps described by Ayres et al. [24]:
2D FFT was performed on grey scale image of thermally bonded nonwoven fabric. Only when the cropped image between bond points of an ImageJ oval plug-in was used to sum up pixel intensities along each radius from the origin of circle to the periphery; and the total pixel intensity value was used to plot FFT alignment with normalisation, shown in Figure 23(c). Fibre orientation: (a) Grey scale cropped image of sample-1, (b) 2D FFT frequency plot of sample-1 and (c) 2D FFT alignment plot of sample-1. FFT: Fast Fourier Transform.

Figure 23(c) shows that the peaks around 54°, whereas majority of fibres align between 30° and 80°. This can be explained by the fact that lower portion of circumference is almost symmetric to the upper portion. This method is unable to give the accurate fibre alignment between the bond point of thermally bonded nonwoven fabric because the structure of thermally bonded nonwoven fabric is not in flat. Further future research will be required to analyse the 2D reconstructed stack sliced image of nonwoven fabric to give the exact fibre orientations. When exact fibre orientations are defined, the thermally anisotropic values of fibre can be provided to enabling higher value of effective thermal conductivity and closer to experimental result.
Predicted results from nonwoven models
The models were further analysed in order to evaluate some properties which cannot be experimentally tested. The effect of fibre volume fraction and fibre thermal conductivity on the effective thermal conductivity and thermal resistance of nonwoven fabric has been studied.
Fabric insulation values mainly depend on fibre volume fraction and thermal conductivity of fibre at constant fibre orientation. For this purpose the validated model of sample-1 was chosen to analyse the effect of fibre volume fraction and thermal conductivity of fibre on overall heat transfer.
Effective thermal conductivity and thermal resistance at different fibre volume fraction.

a

(a) Relationship between fibre volume fraction and thermal conductivity of sample-1 nonwoven fabric and (b) relationship between fibre volume fraction and thermal resistance of sample-1 nonwoven fabric.
The validated model of sample-1 was taken further to analyse the effect of fibre thermal conductivity on heat transfer phenomena. For this purpose a transient heat transfer analysis has been conducted by considering two different types of fibres polyester and PP. Temperature-specified boundary conditions were applied. At wall “A” 308.15 K was applied and the rest of the walls were considered as 298.15 K as shown in Figure 25. It clearly shows that the temperature of the highlighted node in the fabric made of polyester fibre achieved temperature equilibrium faster than sample-1 made of PP fibre. This agreed well with the fact that polyester fibre has higher thermal conductivity (0.157) than PP fibre (0.11).
Temperature profile of highlighted node of polypropylene and polyester sample-1.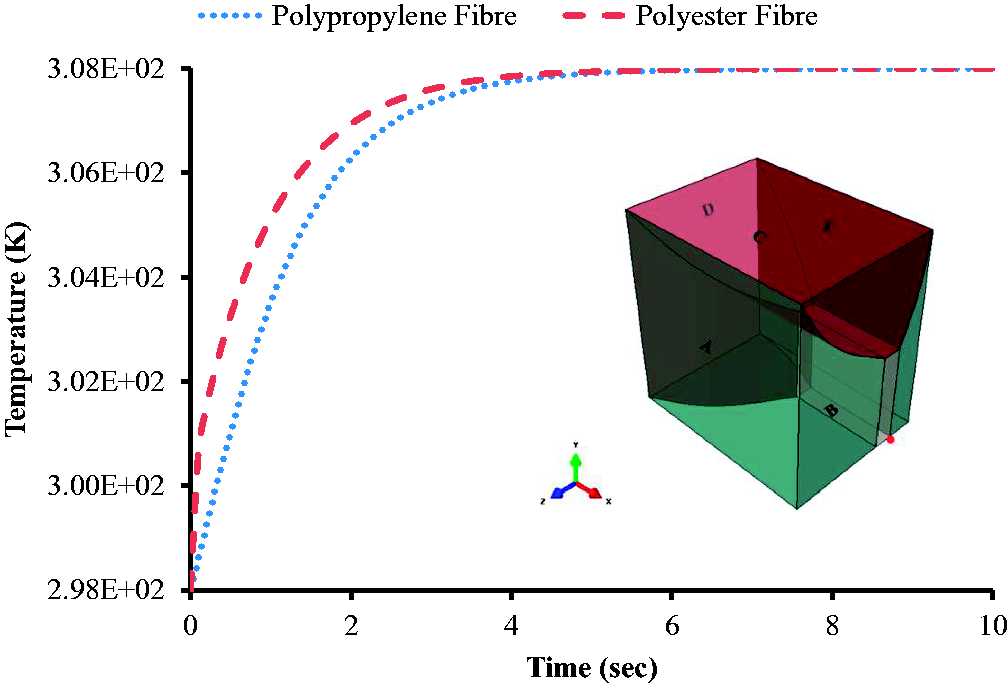
Conclusions
Research techniques have been successfully developed to predict the effective thermal conductivity and thermal resistance of thermally bonded nonwoven fabrics by using two different unit cell models. A good correlation coefficient and coefficient determination show the applicability of the developed techniques for the prediction of effective thermal conductivity and thermal resistance of thermally bonded nonwoven fabrics.
Mean absolute error between experimental and predicted results shows that the thermal anisotropy and fibre orientation have significant influence on the effective thermal conductivity and thermal resistance of nonwoven fabrics. They should be considered for successful FE model development by using the exact material orientation which can be obtained by image analysis of 2D reconstructed stack sliced image of nonwoven fabric. The validated models have been further used to study the effect of fibre volume fraction and thermal conductivity of fibre on the effective thermal conductivity and thermal resistance of thermally bonded nonwoven fabrics which cannot be directly tested through practice.
Footnotes
Declaration of Conflicting Interests
The author(s) declared no potential conflicts of interest with respect to the research, authorship, and/or publication of this article.
Funding
The author(s) disclosed receipt of the following financial support for the research, authorship, and/or publication of this article: This research is financially supported by NED University of Engineering and Technology, Karachi, Pakistan.