
Abstract
The research reports the development of geometrical models of woven fabric structures and evaluation of fabric thermal properties by using finite element method. A mesoscopic scale modelling approach was used to investigate the effective thermal conductivity and thermal resistance of woven textile structures. Various techniques, including scanning electron microscopy and experimental methods, have been adopted to obtain the actual three-dimensional parameters of the fabrics for finite element analysis. The research revealed that the thermal anisotropy of fibres, fibres material orientation and temperature-dependent thermal conductivity of fibre has a significant impact on the effective thermal conductivity of fabrics because experimental and simulated results were highly correlated with the consideration of above-mentioned factors.
Introduction
Clothing comfort can be categorised into three groups: psychological which is related to fashion, tactile which includes the mechanical interaction of the fabric with skin and has a strong relationship with fabric surface and mechanical properties, and thermal comfort related to the ability of a fabric to regulate the temperature of the skin through heat and moisture transfer [1].
Thermal insulation properties of textile materials play a significant role in engineering design of protective clothing. In case of extreme cold condition, it is necessary to restrict the heat flow from the body to the external environment; therefore, the purpose of a fabric is supposed to act as an insulator [2]. It means that the fabric is required to have low thermal conductivity or higher thermal resistance. The thermal conductivity is an important material property because it affects the heat flow in the material. Heat can be transferred from clothing to the environment to maintain its thermal balance through conduction, convection and radiation.
In the case of natural fibres, high-performance fibres such as Nomex® and Twaron® are widely used in fire protection and body armour clothing respectively [3–9]. The heat transfer behaviour of these materials is necessary to be analysed when they are subjected to the intense environment.
Heat flow through the clothing assembly mainly depends on the thermal conductivity of the fibrous material, fibre volume content, construction of the fabric, and orientation of fibre with respect to the heat flow direction [10,11]. Significant research work has been carried out to determine the effective thermal conductivity (Km) and thermal resistance of fabric by using mathematical modelling and numerical analysis. Schuhmeister [12] developed a relationship to calculate the thermal conductivity of the mixture of air and uniformly distributed solid fibres

The first part of the above equation describes that fibres are parallel to the direction of heat flow. The second part presents that fibres are oriented perpendicular to the direction of heat flow, which is demonstrated in Figure 1.
Heat flow mechanism in solid and gas are in: (a) series; and (b) parallel.
Farnworth [13] developed a theoretical model to evaluate the modes of heat flow in fibrous batts which were placed between the two plates having a temperature gradient. There was no significant evidence of convective heat flow even though the experimental conditions were favourable for convection heat transfer and heat transfer via radiation could be ignored when the temperature gradient is small [14]. The thermal and radiative conductivity (

Stark and Fricke [15] developed models to calculate the combined thermal conductivity of air and solid fibre. In their basic model, they considered the mean orientation of fibre in terms of Z which defined the fraction of fibre perpendicular to the direction of heat flow. On the basis of the assumptions of Bhattacharyya [16], they developed the relationship of combined thermal conductivity of solid fibre and air in the following equation

In the modified model they considered that the effect of thermal resistance was caused by the contact between fibres; the thermal conductivity of individual solid fibre, air and the coupling effects could be calculated. The diagram of thermal resistance is shown in Figure 2(a), where RBM, Rct and Rg represent the thermal resistance of the basic model, the contact resistance between fibres and the thermal resistance of air respectively. Figure 2(b) demonstrates the unit cell of solid fibre and the contact between two fibres. In the modified model, the unit cell height is (m+1).2r; however, in the basic model, it was expressed by m.2r which is less than that of the modified model. Furthermore, they compared the results obtained from the derived model with experimental results for model validation.
Stark and Fricke modified model. (a) Thermal resistances diagram of modified model, and (b) unit cell model of the modified model [15].
The relationship between heat transfer behaviour of clothing with their structural parameters has been investigated by many researchers, namely Ismail et al. [17], Kothari and Bhattacharjee [18], Yamashita et al. [19] Zhu and Li [20], Das et al. [21], Ran et al. [22], Matusiak [23]. However, all the foregoing research works related to the modelling of thermal conductivity of textile fabrics lack accuracy without consideration of the following that are very important elements need to be considered.
The actual cross-section of yarn in woven fabric
Cross-section of yarn has significant influence on fibre content in a model. Fibre content or volume fraction of fibre in a model can be defined as the ratio of fibre volume to the total volume of the model. A textile fabric as non-homogeneous material contains heterogeneous mixture of fibre substance and the air, usually. The thermal conductivity of air is less compared to that of textile fibres. If an inaccurate or non-realistic cross-section of yarn was used for geometrical modelling of woven fabric, this would give more amount of fibre than the actual case. The resulted overall thermal conductivity of the fabric will be more than it should be because the model has less air or vice versa.
Fibre orientation and influence of fibre anisotropy behaviour on the effective thermal conductivity of fabric
Textile fibres are transversely isotropic in nature; the transversely isotropic material is a special kind of orthotropic material. An orthotropic material is a subset of an anisotropic material. Transversely isotropic materials are those in which properties are symmetrical in one plane of fibre diameter (transverse) direction which is perpendicular to the other plane of longitudinal direction of fibre. The thermal conductivity of fibre is higher in the longitudinal direction than the transverse direction. Therefore, it is necessary to get the material orientation assigned for the material property during finite element modelling process. The assumption of yarn and fabric as isotropic material made by published research works [12,13,15,17–23] was incorrect and results from those models could give more deviation from the experimental results.
Temperature-dependent thermal conductivity of fibre
The thermal conductivity of fibre increases with the increase of temperature and a similar pattern is followed by the air. Therefore, to estimate the effective thermal conductivity in the high-temperature environment, it is necessary to consider the temperature-dependent thermal conductivity.
In this research work, all the aforementioned factors will be taken into consideration to evaluate the effective thermal conductivity and thermal resistance of textile structures by using finite element method. The models were validated by experimental results. Furthermore, the thermal properties of the fabrics were predicted based on the validated models.
Methodology
The following methodology is adopted to calculate the effective thermal conductivity and thermal resistance of woven fabrics:
development of finite element models of plain woven fabrics; calculation of the effective thermal conductivity of yarn; and investigation of the effective thermal conductivity and thermal resistance of fabrics by using finite element method.
Finite element model
Physical, mechanical and thermal properties of fabrics mainly depend on their structural parameters once a specific fibre material has been selected. In order to predict these properties accurately, it needs to define the correct geometrical models of the fabric structures. However, the fabric geometry is very complicated and it is difficult to consider a single cross-section of yarn because yarn cross-section is dependent on many factors such as the level of twist in yarn and normal force induced during the weaving process. In addition, the measurement of the accurate geometrical parameter is not an easy task.
If we consider one factor only, e.g. level of twist in yarn, for the sake of argument, then yarn would form a round bundle of fibres if yarn has a higher twist which will be less subjected to force to flatten the yarn. On the other hand, in the case of lower level of twist of yarn, the yarn crimp is also low, as a result, yarn will be flatter up to a single level of fibre [24].
In this research, the unit cell model of plain woven fabric is developed by using TexGen [25]. TexGen is open source software, distributed under the general public license and developed by Textile Composite Research group at the University of Nottingham. TexGen can generate woven geometrical structure by taking few input parameters such as yarn width, yarn height, yarn spacing and thickness of fabric.
In TexGen, yarns are generated by two-dimensional cross-sectional shapes of yarn sweep along the path of yarn. Yarn path can be defined by more flexible and generic way using discrete points and these points are interpolated by Bezier spline, natural cubic spline and linear spline [26].
The developed model of woven structure can be exported to computer-aided design (CAD) software. TexGen has the following advantages:
Yarn can be created with variable and combination of different shape cross-section because it contains hybrid section. Control point can be adjusted manually. Intersections between yarns can be avoided by using the above two options.
In order to develop the finite element model of plain woven fabric, it needs to find out the geometrical parameters which would be used as input parameters in TexGen.
Fabric geometric parameters.
Fabric specifications.

Nomex® III fabric is widely used for protective clothing which provides protection against fire. The purpose of selecting Nomex® III fabric in this study is to simulate the realistic effect of heat transfer when it is subjected to extreme temperature environment.
Protective clothing made of Twaron® fibre is used in body armour for ballistic protection. There is a common issue of thermal stress with body armour because of their almost impermeable structure required for high ballistic resistance. Body armour provides insulation to the body and limits the heat exchange to the environment. Clothing insulation property is determined by the thermal resistance and thermal conductivity that need to be studied for better understanding the thermal comfort of body armour.
Poly-viscose fabric is also selected in this research along with cotton and wool fabrics. These fabrics are used for normal wear clothing. In poly-viscose fabric, a special core spun yarn was used in weft and simple polyester yarn in warp.
To understand the thermal behaviour of the fabrics is important so as to determine their specific applications. Unit cell models of plain woven fabrics were created by using the actual parametric values of the fabric. For that purpose the following parameters are needed:
warp/weft yarn spacing ( fabric thickness (t); and width of the warp/weft yarn (
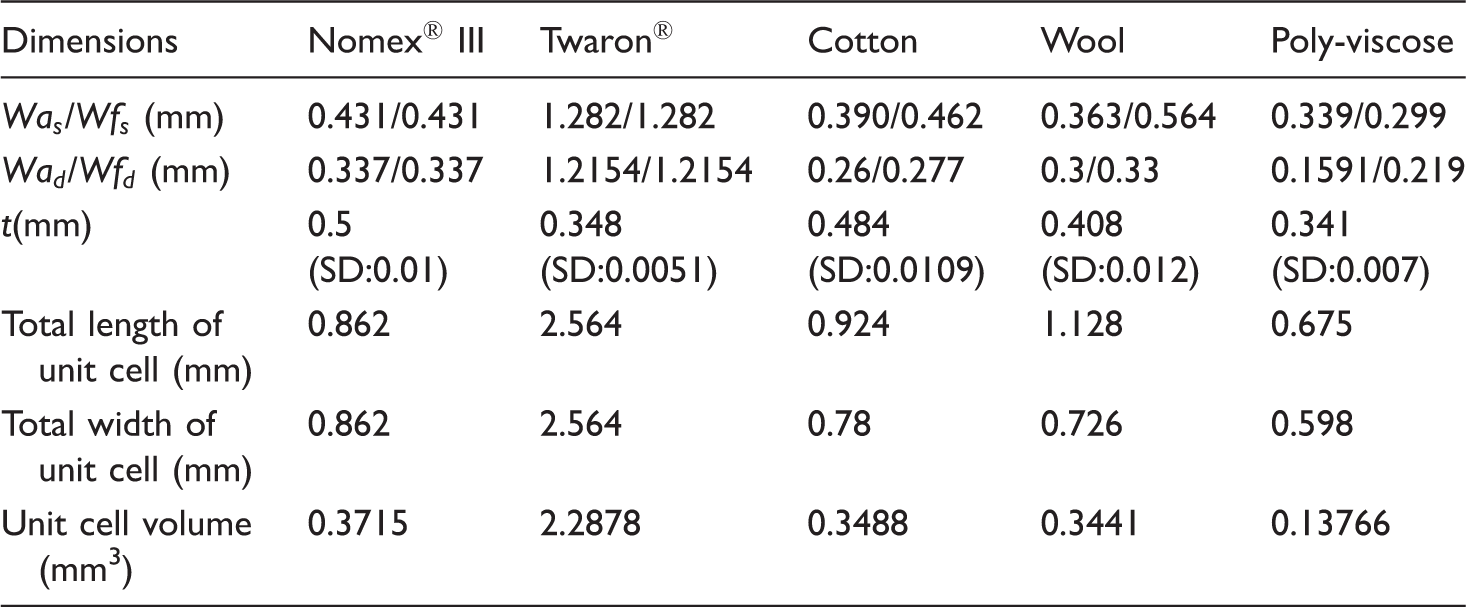
Measured geometric dimensions of an unit cell model.
There are several techniques available such as MicroCT, microscope, electron microscope, etc. which can be used to find out the cross-sectional image for further study of yarn width, yarn height, yarn cross-sectional shape and yarn path through image analysis.
In this, work Hitachi S-4300 SEM (Scanning Electron Microscope) was used to examine the geometry of yarn cross-section.
It is very difficult to obtain a very clear cross-sectional image of fabric; the reason is that when the fabric is cut fibres open apart which makes it difficult to obtain the correct dimension of the yarn cross section. In order to avoid this problem, fabric was first coated with acrylic binder without applying pressure. Acrylic binder was applied by brushing manually on one side of the fabric then dried and the same procedure was applied on the other side of the fabric. When fabric dried fully, it was then cured under specified temperature before the cross-sectional image was taken by SEM. The image was further analysed by ImageJ [29] which was developed at the National Institutes of Health. It is a public domain, Java-based image processing program. The yarn spacing, width, height and fibre volume fraction of the SEM image were measured in ImageJ. Figure 3 shows the micrograph of Twaron® plain woven fabric. During the image analysis, yarn cross-section was examined carefully because all the fabrics except Twaron® have an asymmetrical cross-sectional shape of yarn.
Micrograph of the cross-section of Twaron® fabric.
The measured geometric dimensions for the unit cell of the fabrics are listed in Table 2. Unit cell model of Twaron® plain woven fabric was generated from TexGen by using the actual parameters measured using the technique mentioned above and shown in Figure 4.
Twaron® fabric. (a) Unit cell model of Twaron® fabric, (b) cross-sectional view of Twaron® model, and (c) crosss-sectional view of micrograph of Twaron® fabric.
The cross-sectional image of the developed unit cell model of Twaron® fabric is comparable to the cross-sectional micrograph image from SEM. SEM image digitized in plot digitizer [30] which is a general public licensed software being used to find out the length of yarn in one unit cell. The length obtained from the SEM image and the model is 2.586 and 2.60319, respectively.
Figure 5(a) Shows the cross-sectional micrograph of Nomex® III fabric which clearly indicates that the cross-section of yarns is not exactly lenticular, initially the yarn cross-section was considered as lenticular but there was huge interference between the yarn. In order to remove the interference between yarns, a hybrid cross-sectional shape of yarn was used which consists of the combination of power ellipse cross-section of the yarn in TexGen. Figure 5(b) shows the unit cell model of Nomex® III fabric.
Nomex® III fabric. (a) Micrograph of the cross-section of Nomex® III fabric, and (b) unit cell model of Nomex® III.
The effective thermal conductivity of yarn was calculated based on the generated unit cell model of plain woven fabric developed by using actual parameters of the fabric.
Effective thermal conductivity of yarn
The effective thermal conductivity of textiles mainly depends on two components: conductive heat transfer through solid fibres and air within the fabric [31]. Therefore, it is substantial to determine the amount of fibre content or fibre volume fraction that is present in the unit cell of a woven fabric.
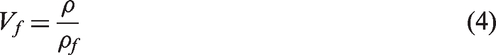
Fibre volume fraction.
Fibre volume fraction in a fabric (Vf) was calculated by using equation (4)
Fabric density can easily be calculated by the areal density of fabric and fabric thickness as shown in equation (5).

Fibre volume fraction of yarn (

Fibre volume fraction of same yarn count and the equal number of warp/weft sett of fabric can be calculated by the above equations. However, in the case of cotton, wool and poly-viscose fabrics, they have different yarn count and warp/weft sett; yarn count is utilised to calculate the fibre volume fraction in yarn by the following steps:
calculate the individual length of yarn; calculate the individual volume of yarn; multiply the length of yarn with the yarn count which gives the mass of fibre in yarn; convert the mass of fibre in yarn into volume of fibre in yarn through by dividing the mass of fibre in yarn by the density of fibre; and finally divide the volume of fibre in yarn by volume of yarn.
Fibre volume fraction of different yarn count.
Fibre volume fraction of yarn for different yarn count and different number of warp/weft per unit length can be calculated following the above-mentioned steps using equations (7), (8) and (9).


Fibre volume fraction of core spun yarn.
The weft yarn in the poly-viscose fabric is a core-spun yarn and warp yarn is simple polyester yarn shown in Figure 6. The core part of the spun yarn is polyester filament covered by viscose fibres. The effective density of fibres for the whole yarn was calculated on the basis of weighted proportion by using equation (10) [33].
Micrograph of poly-viscose fabric: (a) cross-section of warp yarn, and (b) cross-section of core spun weft yarn.

Weight proportion of fibre in core-spun yarn was calculated by using image analysis of SEM image. During image analysis, the area of respective fibre within the yarn was calculated firstly and then the weight proportion which was calculated by using equations (11) and (12).


Fibre volume fraction of yarn and unit cell.


Thermal properties of fibres.

Thermal conductivities values of Twaron® assumed same as Kevlar.
Assumed axial thermal conductivity value 10 times than the transverse [36].
Thermal conductivity of component fibres of the core spun yarn can be calculated by equation (14)

After the fibre volume fraction and air fraction in the yarn were calculated, the axial and transverse thermal conductivity of the yarn can then be calculated by a number of models which have been developed.
Yarn axial thermal conductivity (
Yarn transverse thermal conductivity (


Yarn thermal conductivity.

Application of finite element method
The following assumptions have been made for the finite element analysis of fabric thermal properties.
Unit cell model for analysis. Consider still air inside and over the surface of the fabric so the heat is only transferred by conduction. Only one mode of heat transfer was considered, i.e. conduction. Yarn is a porous material, consisting of both fibres and the air. Air in a fabric is considered as the fluid matrix (entrapped air between the plate and yarn as shown in Figure 7).
Heat transfer by conduction of fabric is calculated by Fourier’s law

The unit cell of fabric generated was imported and meshed in a commercial finite element simulation software ABAQUS/CAE. Two material sections were defined, one is for the entrapped air between the plates and the other is for the yarn. The thermal conductivity value of air is constant which is 0.026 W/m.K. In the case of yarn, three effective thermal conductivity values
Material orientation.
Yarn is considered as solid orthotropic material with the consideration of transversely isotropic. Figure 8 shows the material orientation in a yarn of woven fabric generated in Abaqus/CAE (computer-aided engineering); axis 11 refers to the axis which is parallel to yarn axis, axis 22 and 33 are transverse (perpendicular) to the fibre direction by using discrete orientation technique. Because of the waviness in warp and weft yarns, the material principal may vary from point to point. Unit cell model of one repeat unit length of woven fabric was imported in Abaqus in STP (standard for the exchange of product model data) format. A discrete orientation defines a spatially varying orientation at the centroid of each native or orphan mesh element. The orientation is based on the topology of the part, allowing defining a continually varying orientation. Once the normal axis and primary axis are defined, Abaqus/CAE uses these axes to construct a right-handed Cartesian coordinate system [37]. For that purpose, the surface of the yarn is divided into small faces by partition and the edges and surfaces are selected for the primary and normal axis.
Material orientation.
Meshes.
Four-node linear tetrahedral element (DC3D4) was used to mesh the unit cell of fabric because this is the most suitable mesh element to completely mesh the complex geometrical shape [37]. An optimal mesh density was obtained after the verification that further refinement cannot affect the results. Figure 9 shows the meshed unit cell model of Twaron® fabric.
Twaron unit cell: (a) Meshed unit cell with air fluid–matrix, and (b) Meshed unit cell without air–fluid matrix.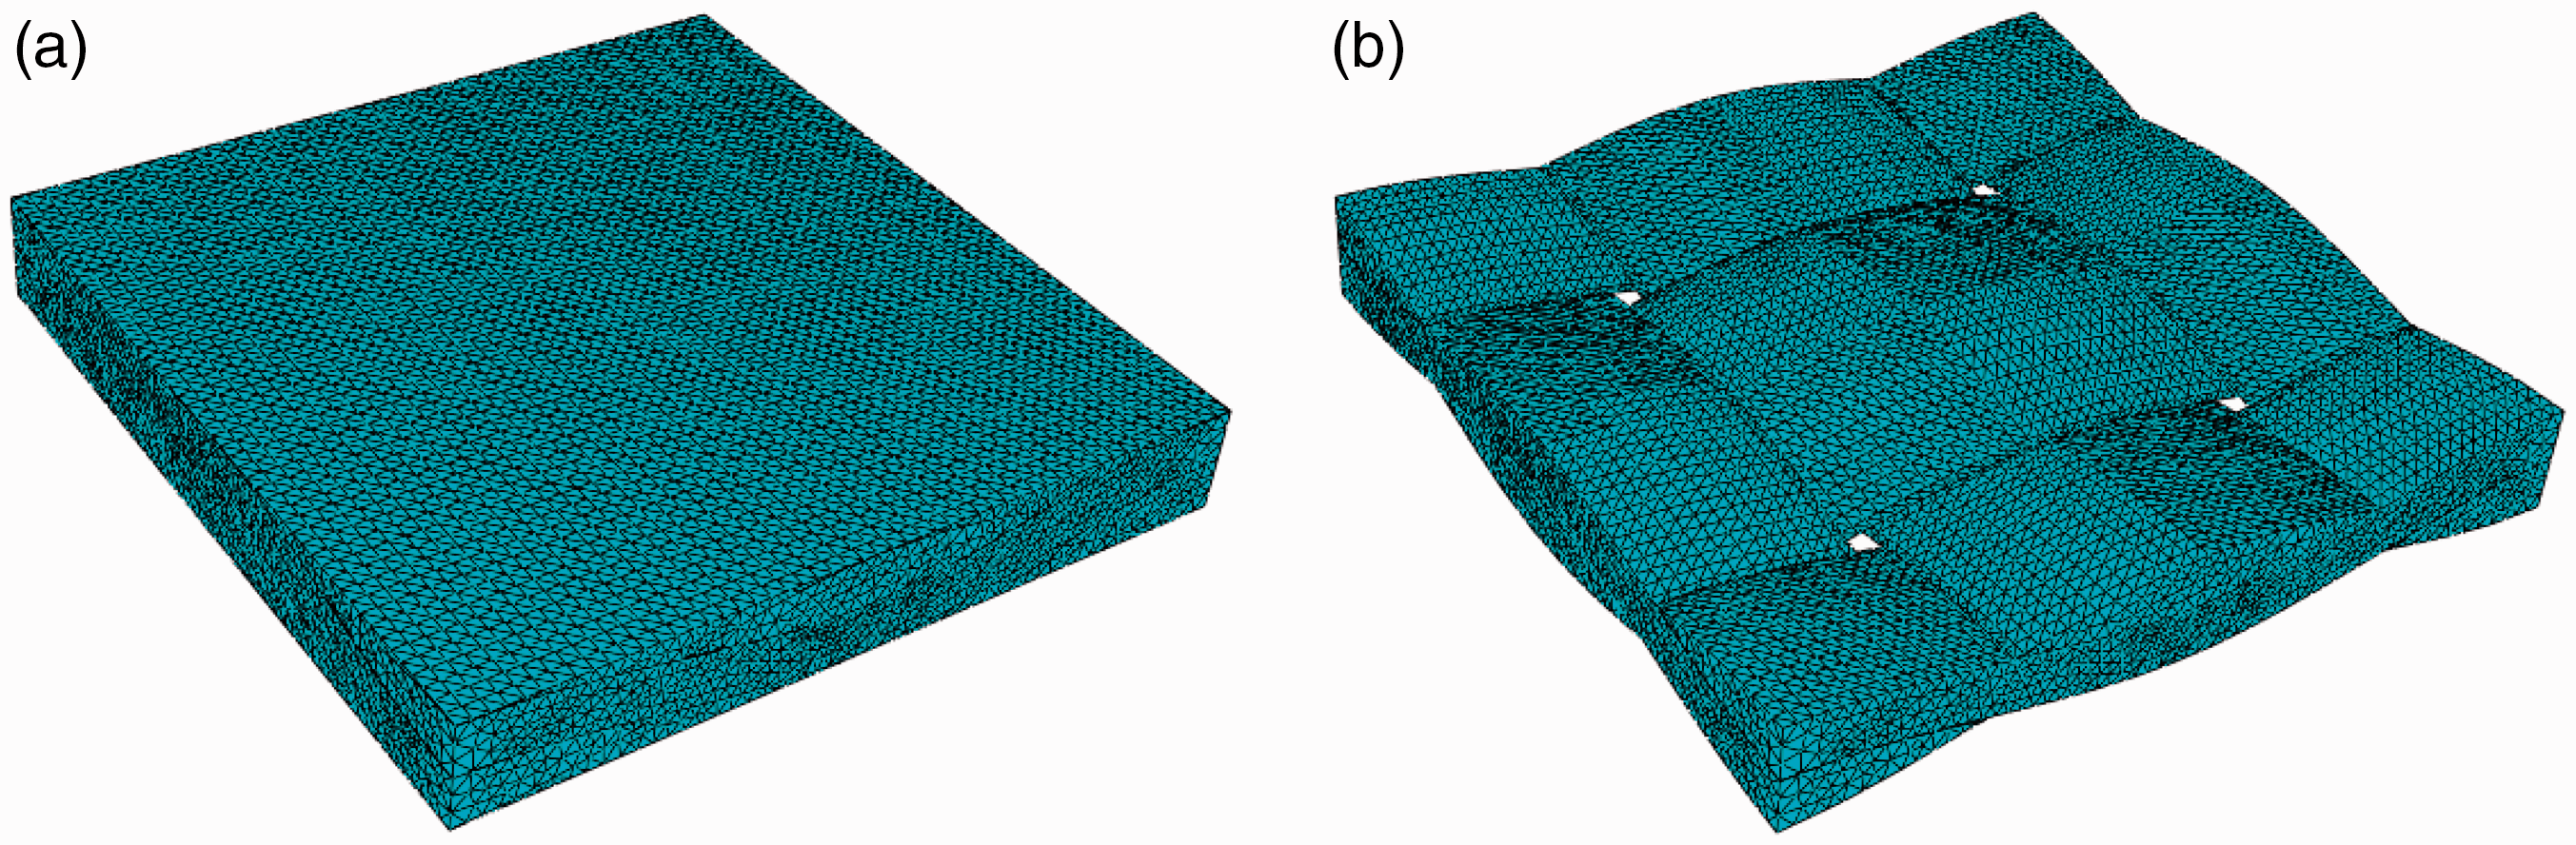
Boundary conditions and analysis.
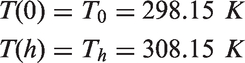
For 1D steady state heat transfer analysis across the thickness of the fabric (t), the specified temperature boundary conditions were used. The two specified temperature values were defined on both side of the fabric with the assumption of all the other surfaces of the fabric are perfectly insulated. The specified temperatures can be expressed as
The effective thermal conductivity across the thickness of fabric can be determined by using equation (18)

Qz of the unit cell can be calculated by using keyword script in the output section of the Abaqus which returns the total section heat flux (SOH) and surface area of the unit cell (SOAREA) [38]. The overall heat flux value along the z-direction can be calculated by using equation (19).


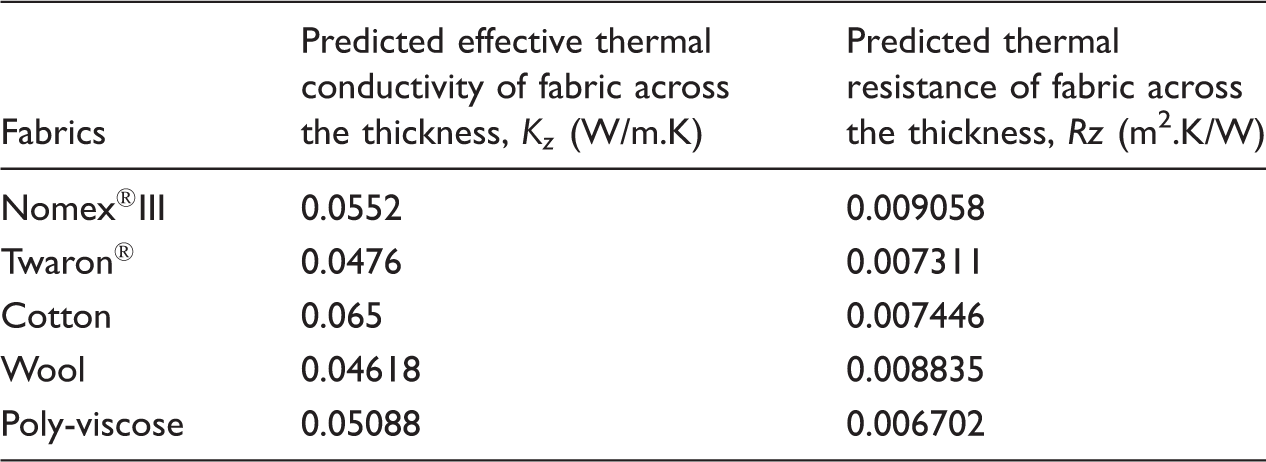
Predicted effective thermal conductivity and thermal resistance of plain woven fabric.

Heat flux and temperature distribution of unit cell: (a), (b) Twaron® fabric with air–fluid matrix, (c), and (d) Twaron® fabric without air–fluid matrix.
Validation of model
Experimental results of effective thermal conductivity and thermal resistance of plain fabric.

SD: standard deviation.
Figure 11 shows that the simulated results are very close to the experimental results, proving good agreement between the results from FE models and experiments.
(a) Comparison of predicted effective thermal conductivity with experimental results and (b) comparison of predicted thermal resistance with experimental results.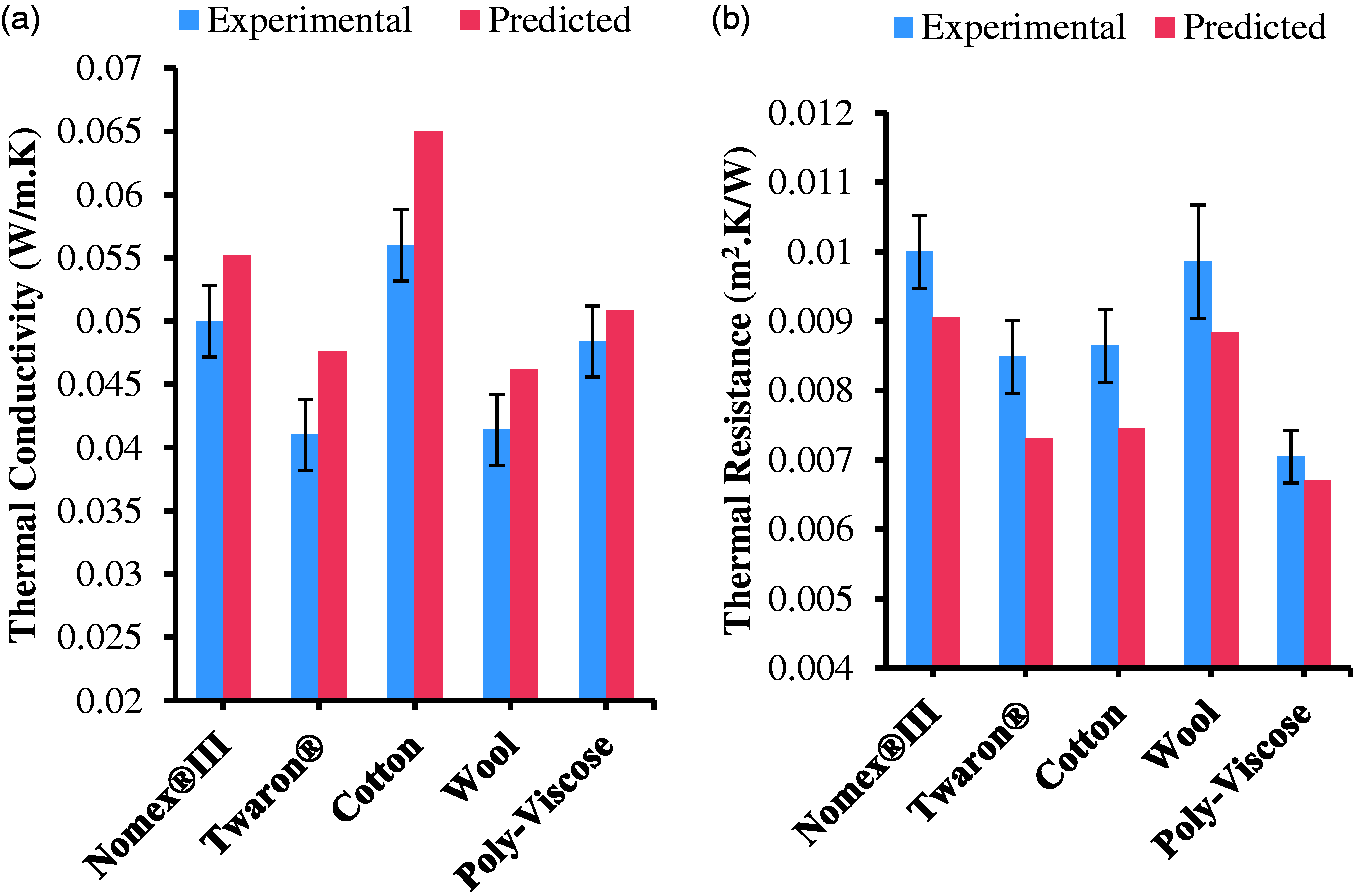
The predicted effective thermal conductivity and thermal resistance from the developed FE model were compared with experimental results as shown in Figure 12. The coefficient of determination between the predicted values by using anisotropic thermal conductivity of fibre (with consideration of transversely isotropic material) and experimental results of thermal conductivity and thermal resistance of fabric was found 0.9145 and 0.9278, respectively. The correlation coefficient of thermal conductivity and thermal resistance between FE and experimental results are calculated as 0.956 and 0.96, respectively.
(a) Comparison of FE and experimental values of effective thermal conductivity of fabric and (b) comparison of FE and experimental values of thermal resistance of fabric.
The predicted results of thermal conductivity are higher than the experimental thermal conductivity values as shown in Figure 11(a). The reason behind that was the pressure applied during the experiment which reduced the waviness of the yarn although the pressure is small. Therefore, the proportion of longitudinal thermal conductivity of yarn reduces in the effective thermal conductivity of fabric and vice versa for thermal resistance as shown in Figure 11(b).
Effect of thermal anisotropy of fibre on effective thermal conductivity
For comparison purposes, to study the effect of thermal anisotropy of fibre on the effective thermal conductivity, two finite element models have been developed by considering the anisotropic and isotropic material property respectively.
Comparison of effective thermal conductivity of fabrics.

The mean absolute error between the FE results and experimental can be calculated by equation (21)

The calculated mean absolute error of thermal conductivity is 11.85 when the anisotropic thermal conductivity of fibre was considered. In the case of an isotropic condition and without material orientation, the mean absolute error is much higher compared to the anisotropic condition. The calculated mean absolute error of thermal conductivity for isotropic conditions is 27.84. The predicted values from the anisotropic model agreed well with the actual test values. This means that the model is successful and can be used to predict the effective thermal conductivity of the fabric.
Temperature-dependent thermal conductivity of fibre
In this section, temperature-dependent heat transfer analysis was performed by using temperature-dependent thermal conductivity of Nomex® III fibre [34] and air [40] as shown in the following relationships
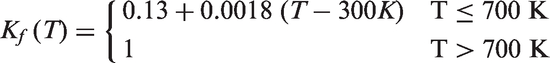

This equation shows that the thermal conductivity of Nomex® III fibres appears to remain approximately constant after about 700 K; this temperature is close to the temperature range at which thermochemical reactions begins to occur [3].
Nomex®III fibre has been mostly used in the heat protective clothing, for high temperature environment. Heat is transferred by means of radiation and convection outside the protective clothing and within the fabric and air gap, heat is transferred by conduction and radiation. The thermal conductivity value of fibre varies with temperature so that temperature-dependent thermal conductivity of fibre was utilized to calculate the yarn axial and transverse thermal conductivity between the temperature ranges from 270 K to 700 K.
Air properties were also considered as temperature dependent in simulating the realistic situation. Temperature specified boundary conditions were used for transient analysis. The temperatures applied on face and back of the fabric are 270 K and 700 K respectively, and the model was run for both cases with and without temperature-dependent thermal analysis. The only limitation in this analysis was that there was no consideration of radiative modes of heat transfer.
Figure 13 shows the heat flux distribution in both cases. Further investigation of the model to calculate the heat flux value across the thickness of the fabric is shown in Figure 14. Fabric analysed with temperature-dependent thermal properties allows more heat to flow because of the thermal conductivity both fibre and the air increases with the increase of temperature.
Heat flux distribution of unit cell: (a) Nomex®III with temperature-dependent thermal conductivity (b) Nomex®III without temperature-dependent thermal conductivity. Heat flux with and without temperature-dependent thermal conductivity.

Figure 15 shows the dynamic temperature change with respect to time taking an example node 23960 specified in Figure 13. The node temperature in temperature-dependent thermal conductivity model analysis achieved the equilibrium at 6.7 s, while in constant thermal conductivity model, 9.4 s is needed to reach the equilibrium temperature. This means that the heat flows quicker in temperature-dependent thermal conductivity analysis. This type of analysis is more significant in heat protective clothing because multilayer fabric is exposed in high temperature environment for a long time. Therefore, it is important to take temperature-dependent thermal properties to create the realistic environment for simulation of heat transfer of textiles.
Temperature of Node: 23960 with and without temperature-dependent thermal conductivity.
Effect of fibre volume fraction on effective thermal conductivity
Effective thermal conductivity of Twaron® with different fibre volume fractions.

Kya: yarn thermal conductivity in axial direction; Kyt: yarn thermal conductivity in transverse direction.

Relationship between fibre volume fraction and thermal conductivity of Twaron® fabric.
Conclusions
In this research work, the finite element geometric model of plain woven fabric was successfully developed and analysed by the commercial finite element software Abaqus/CAE. The model was validated by experimental results of effective thermal conductivity and thermal resistance of the fabrics. The validated model was further studied by the use of temperature-dependent thermal conductivity of fibre and different fibre volume fractions of fabric.
The following conclusions can be drawn:
Material orientation and anisotropic thermal conductivity have significant effects on the effective thermal conductivity of fabric. The effective thermal conductivity of fabrics was also affected by the anisotropy of thermal conductivity of fibres because fibres have higher thermal conductivity in the longitudinal direction as compared to the transverse direction. This explains the fact that heat also travels along the fibre direction in the yarn when determining the thermal conductivity across the thickness of the fabric. Temperature-dependent thermal properties have the significant impact on heat flow. In order to obtain simulated results that are close to realistic, it is vital to take temperature-dependent thermal properties when simulating fabrics for protective clothing to be exposed to an extreme temperature for a long period of time. The effective thermal conductivity of fabric can be calculated by considering still air within and outside of the fabric (air as a fluid matrix). The results of the parametric analysis show that the effective thermal conductivity across the thickness of fabric increases with the increase of the temperature and fibre volume fraction.
The methods developed in this research are restricted to 2D woven structures; it can be further extended to 3D and multi-layered textile structures with the consideration of radiation heat transfer at high temperature analysis.
Footnotes
Declaration of Conflicting Interests
The author(s) declared no potential conflicts of interest with respect to the research, authorship, and/or publication of this article.
Funding
The author(s) disclosed receipt of the following financial support for the research, authorship, and/or publication of this article: This research was financially supported by NED University of Engineering and Technology, Karachi, Pakistan.