
Abstract
Rubber–textile construction of conveyor belts is widely used in various continuous transport systems. Due to the fact that complex carcass is vulcanised, its observation and analysis are very difficult to perform. The methods used so far have been based on its violent extracting, often accompanied with the formation and existence of defects. Such an analysis does not allow distinguishing between defects caused by operation of the belt or defects caused by the process of extracting itself. This paper aims to verify a new approach to examining the inner carcass of rubber–textile conveyor belts with a focus on the possibility to obtain information about its condition. This has not been possible with the methods used so far. The main focus is on the measurement of distance between the individual fibres in the warp and weft of the carcass, and simple size analysis of the identified defects. Presented results prove that the method of industrial tomography clearly identifies the defects in the conveyor belt carcass. The method enables the identification of single fibres, punctures and separation of individual layers.
Introduction
Belt conveyors with rubber–textile conveyor belts are widely used in various industries, especially in the mining sector and transport systems. Textile reinforcement is a load-bearing part of the rubber–textile conveyor belts made of rubberised polyamide or polyester fabrics. Reliable operation of a conveyor depends above all on the correct functioning of the conveyor belt, which is a critical component of this equipment. Any equipment failure or dropout has significant adverse economic impacts. High costs are associated not only with the repair or replacement of the belt, but also losses caused by shutdown of the conveyor, in the case of conveyor belt damage. In many mining operations and quarries, belt conveyors are key elements. Their function is indispensable, and hence the reliability of the belt conveyors and their parts is the subject of much research.
Mazurkiewicz [1] dealt with the effectiveness of a conveyor belt diagnostic system. The solution to the problems of conveyor transport maintenance can be the implementation of a system for estimation of technical condition of conveyor belt joints. Fedorko et al. [2] had studied the dependence among the weight of sharp material falling on the conveyor belt, shatter height and force conditions to determine conditions under which the conveyor belt was damaged. Kabzinski [3] presented basic information about the design and fabrics of conveyor belts used in this type of composite. The most common case of damage to conveyor belts is their perforation by falling sharp material. Yang et al. [4] presented the algorithm for detecting longitudinal rip and belt deviation, which are serious threats to the mine safety production. The test equipment for analysis of rubber–textile conveyor belts with the help of industrial metrotomographs was designed by Michalik and Molnár [5]. Experimental analyses of conveyor components and inner structure of conveyor belt were presented in the literature [6–8]. The wear resistance and strength of the conveyor belt are the most important characteristics affecting their operational reliability and durability. The problem of degradation of rubber in conveyor belts was studied by Dobrotă [9], where the situation of rubber conveyor belts reinforced with metal insertions was analysed. Petrikova et al. [10] conducted experimental and numerical investigation of the behaviour of samples of conveyor belt made of carbon-black filled rubber reinforced by plain weave textiles. Bouda et al. [11] presented a procedure for material parameters calibration of rubber–textile composite. The main purpose of the study by Barburski [12] was to develop a new woven structure for pipe conveyor belts.
The mechanical properties of the composite materials depend on the inner structure and conditions. Mechanical behaviour of fibre-reinforced polymer composites is geared by the geometrical structure of the textile reinforcements. ElAgamy and Laliberte [13] traced the physical concepts used for modelling the geometrical structures of textile reinforcements at the mesoscale. Experimental investigations were carried out by Gopinath et al. [14] to determine the flexural behaviour of reinforced concrete beams strengthened with basalt textile-reinforced concrete under monotonic and low-cycle fatigue load. Researches on the impact behaviours can help in the development and optimisation of design for textile structural composites. Padaki et al. [15] studied the influence of interlacements in the multilayer woven interlocked 3D structures on the impact properties of the composite material reinforced with them. In the review of Ma and Gao [16], the development and features of three types of textile structures, including weaving, knitting and braiding were introduced.
The quality control and evaluation of the textile-reinforced composite materials are performed by various non-destructive methods. Several authors have presented the results of their experiments in this field. Valantin et al. [17] tested textile–rubber composites through peel tests, dynamic mechanical analysis, scanning electron and some other methods to evaluate fatigue impact on interfacial properties. Saboktakin and Vu-Khanh [18] evaluated the potential of three inspection techniques named ultrasounds, vibrations, dimensional measurement for detecting textile reinforcement defects in composites. Saboktakin et al. [19] experimentally investigated the capability of four non-destructive testing techniques to detect the layer orientation in textile composite laminates. Samples were inspected using C-scan ultrasonic, vibration analyser, X-ray micro-tomography and ultraviolet technique.
X-ray computed tomography (CT) provides an opportunity for a detailed examination of the inner structure of fibre-reinforced composites. 3D images, obtained with micro-CT, can be used for a realistic modelling of composite materials. Straumit et al. [20] presented automatic generation of voxel models of textile composites from X-ray CT data. Kim et al. [21] designed and constructed an experimental system to subtract information on the structural insight of the specimens. They confirmed the feasibility of the X-ray application for the textile composites and obtained useful X-ray sample images successfully. Bale et al. [22] used micron-resolution CT to capture 3D images of ceramic–matrix textile composites and performed a statistical analysis of the shape and positioning of the fibre tows in the 3D woven architecture. An approach employing high-resolution X-ray micro-CT was presented by Soltani et al. [23]. The methods for verifying dimensional and material properties on industrial CT were described by Kowaluk and Woźniak [24]. Authors in the literature [25,26] described generating virtual textile composite specimens using micro-CT. 3D analysis of the internal microstructure of textile and composite materials with CT was carried out by Hemberger et al. [27]. Tomography analysis of textile composite reinforcement deformation at the mesoscopic scale was presented by Charmetant et al. [28].
This article presents the verification of a new approach to examine the carcass of rubber–textile conveyor belts. Although the use of X-ray technology in the field of polymers and composites was described in many research papers, the research on the use of metrotomography, when examining the inner structure of textile–rubber conveyor belts, is very rare. The textile reinforcement of the belt strengthens the belt and significantly contributes to the load transfer. Carcass affects the quality and life cycle of the belts. That is why it is important to obtain detailed information about the condition of the textile component of the belt. This has not been possible by the methods used so far. Application of computed metrotomography allows us to display individual layers in 3D images and enables effective analysis of the textile carcass.
Material and methods
Inspection of the state and quality of rubber–textile conveyor belts is a very demanding process due to fact that the belt is a homogenous unit composed of various interconnected numbers of layers of polymers and industrial textiles (Figure 1). It features unique mechanical and elasticity properties. Due to these, rubber–textile conveyor belt is highly resistant to abrasion on its surface, though highly strong, mainly in axial direction, however, highly elastic. Thanks to its inner construction, it can absorb the energy produced in the process of conveyed material impact on its surface. The assessment of quality and state of the rubber–textile belts can be generally divided into two categories:
Assessment of quality and state of the rubber–textile conveyor belts as the whole, Assessment of quality and state of the rubber–textile conveyor belts’ parts.
Image of a 3D model of industrial textile used for the carcass manufacturing of rubber–textile conveyor belts.

Assessment of quality and state of the rubber–textile conveyor belts as the whole
There are several methods of assessment of quality and state of the rubber–textile conveyor belts being used nowadays, but they do not provide enough information or sufficient data. As a result of this, we can state that 100% continuous checking of the whole complex of composition of the conveyor belt is not possible in the course of its operation, though it would be really useful regardless to large amount of data generated in the process itself. That is why, such a continuous checking does not take place nowadays, and the conveyor belt is checked at regular intervals instead along with maintenance works on it which include verified, but insufficient methods of checking.
The assessment of quality and condition of the rubber–textile conveyor belts is, at present, mainly realised by visual inspection, experimental measuring method, destructive and non-destructive methods and their mutual combination. Visual method can assess the quality and condition of the belt only when clearly visible, mainly surface marks. These can include various cracks, dents and the like. This method implies simple measurements with a certain informative value (Figure 2), but can never be used to formulate definite conclusions. This is rather an approximate diagnostic method. One can never identify all the defects visually and state the quality of the belt in this way. The method does not provide independent information on condition of the inner structures of the conveyor belt. That is why, it should always be combined with other methods. The most frequent ones to employ are experimental measurements, destructive and non-destructive methods.
Example of visual assessment of damage to a rubber–textile conveyor belt.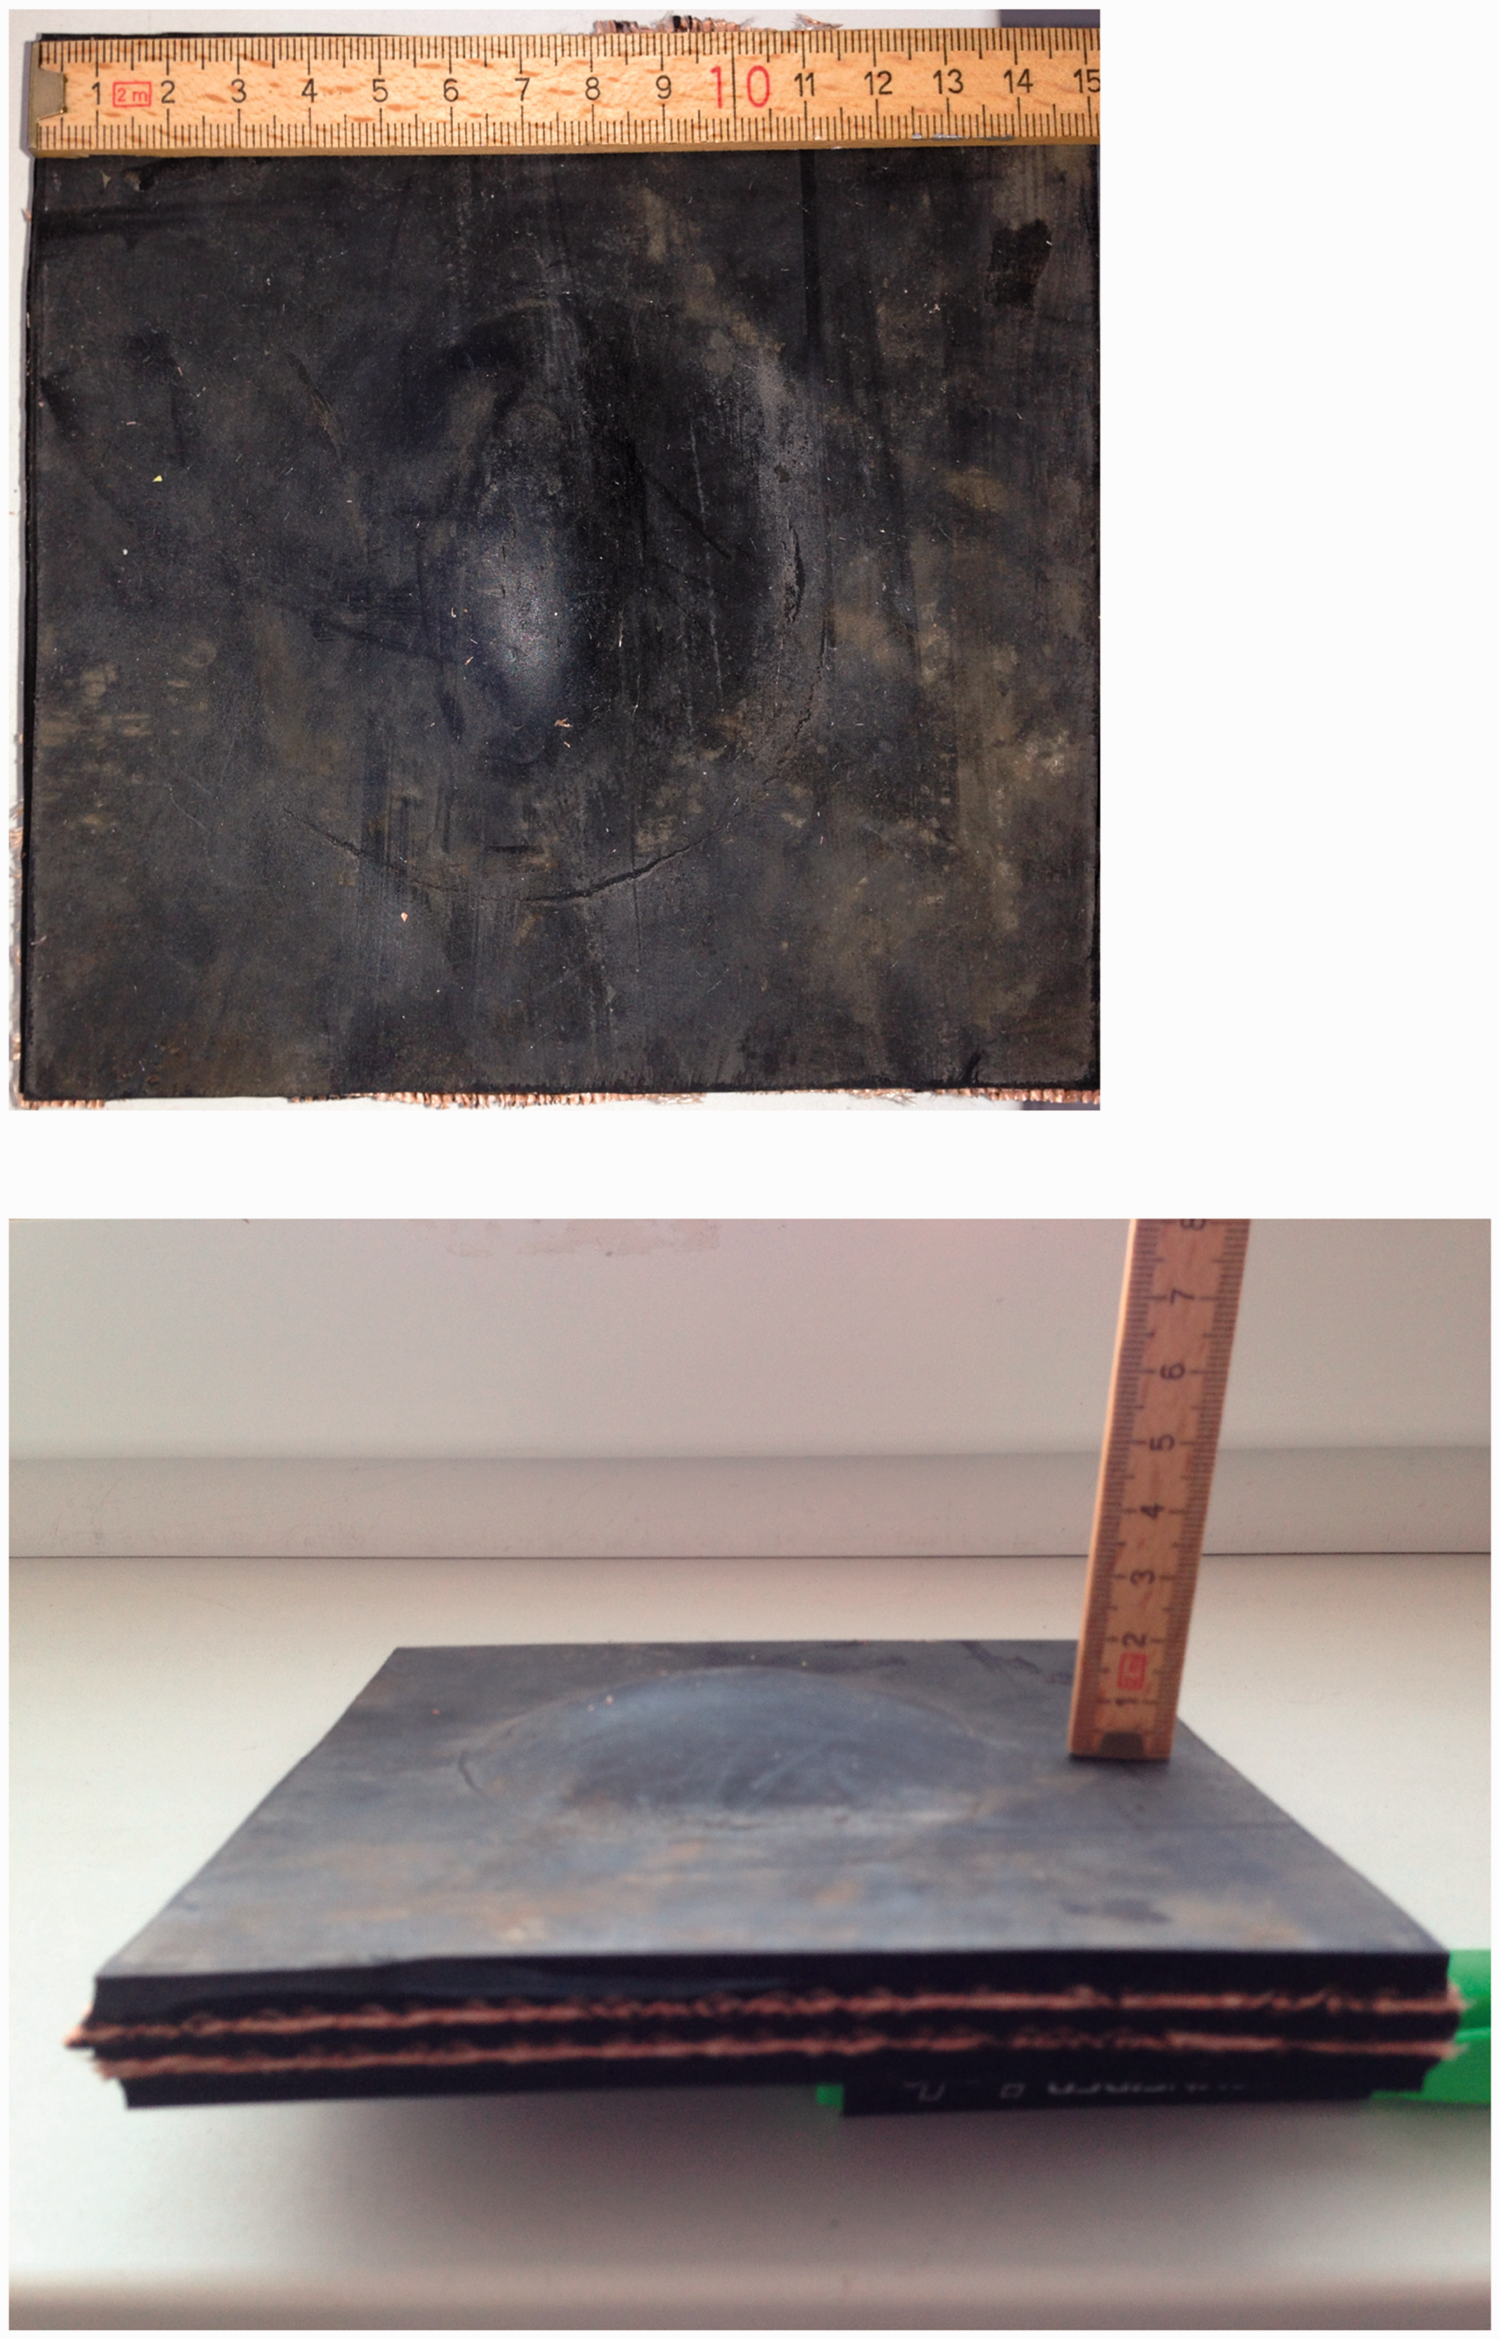
Assessment of quality and state of the rubber–textile conveyor belts’ parts
The assessment of quality and condition of carcass of the rubber–textile conveyor belts is a much more complex problem than the assessment of quality and condition of the conveyor belts as the whole. A simple employment of visual method is not possible in this case, since the individual parts of carcass (Figure 3) are embedded inside the belt and their observation is not possible without a special intervention or modification. For analysis of such a kind, destructive or non-destructive method can be used.
The alignment of carcass inside the conveyor belt.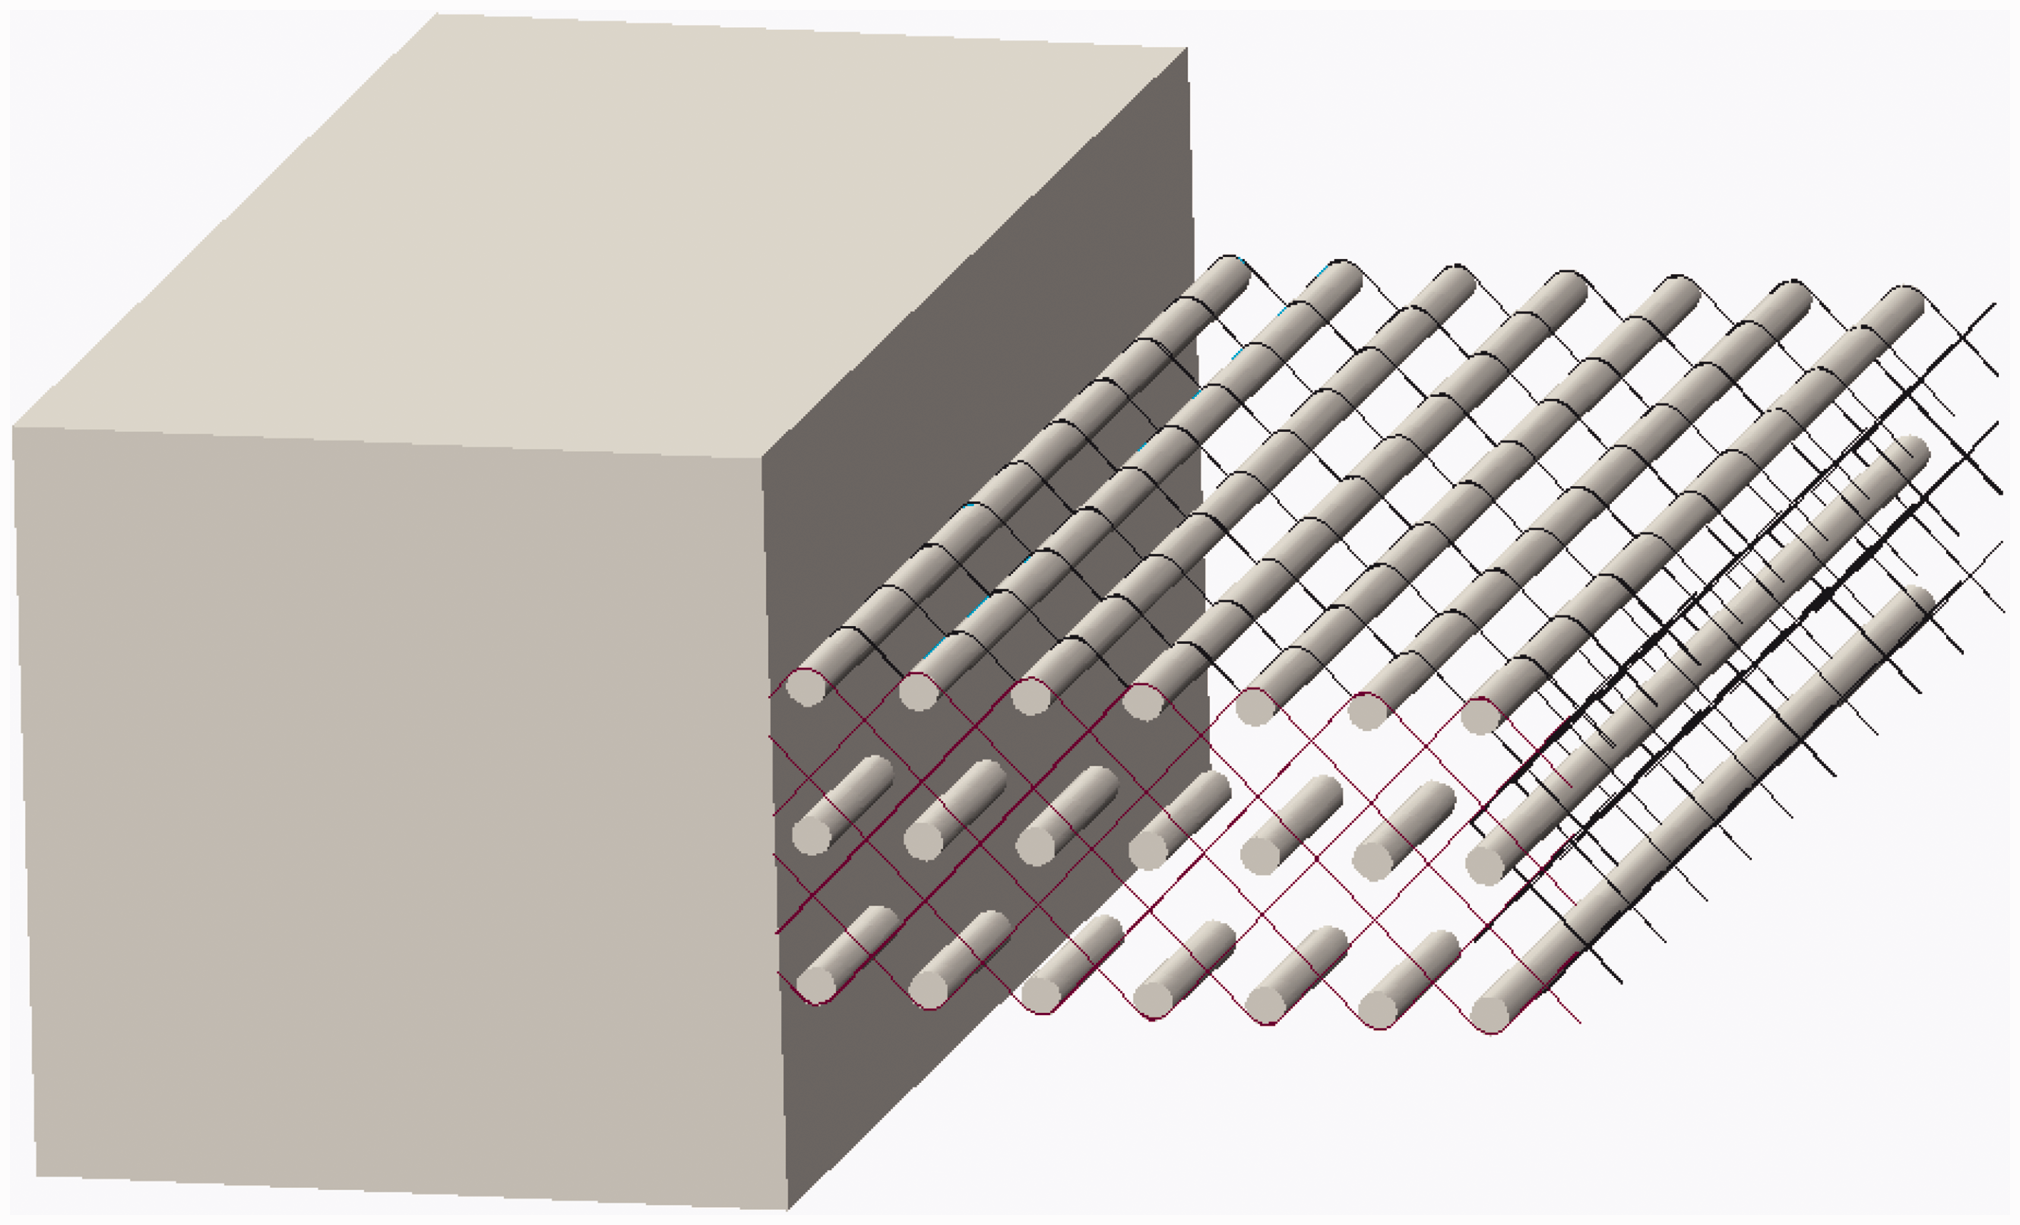
In a destructive approach, the conveyor belt is decomposed into individual construction components with the use of various methods (Figure 4). In particular, top cover layer of the belt, individual layers of rubber between plies, carcass and bottom cover layer are separated from each other. However, the process is truly demanding and cannot be performed without more or less serious mechanical damage to components which are being separated. As a result, it is not 100% possible to claim that damage found to the rubber–textile belt is the one that occurred in the course of its operation rather than in the process of destructive method employment.
Example of a destructive method of carcass extraction from a rubber–textile conveyor belt.
Non-destructive method enables a much more effective analysis of the carcass of the rubber–textile conveyor belt compared to the above-mentioned approach. Its execution most typically includes the use of classic X-ray images (Figure 5). They enable to observe and assess the condition of carcass of the rubber–textile conveyor belts. However, the methods of X-ray evaluation used so far have a disadvantage of displaying only 2D image of the conveyor belt composition. They do not allow us to extract the individual layers and display them in 3D images.
X-ray of the condition of inner structure of a conveyor belt [29] for two various cross-section of fabrics (a), (b) along the weft..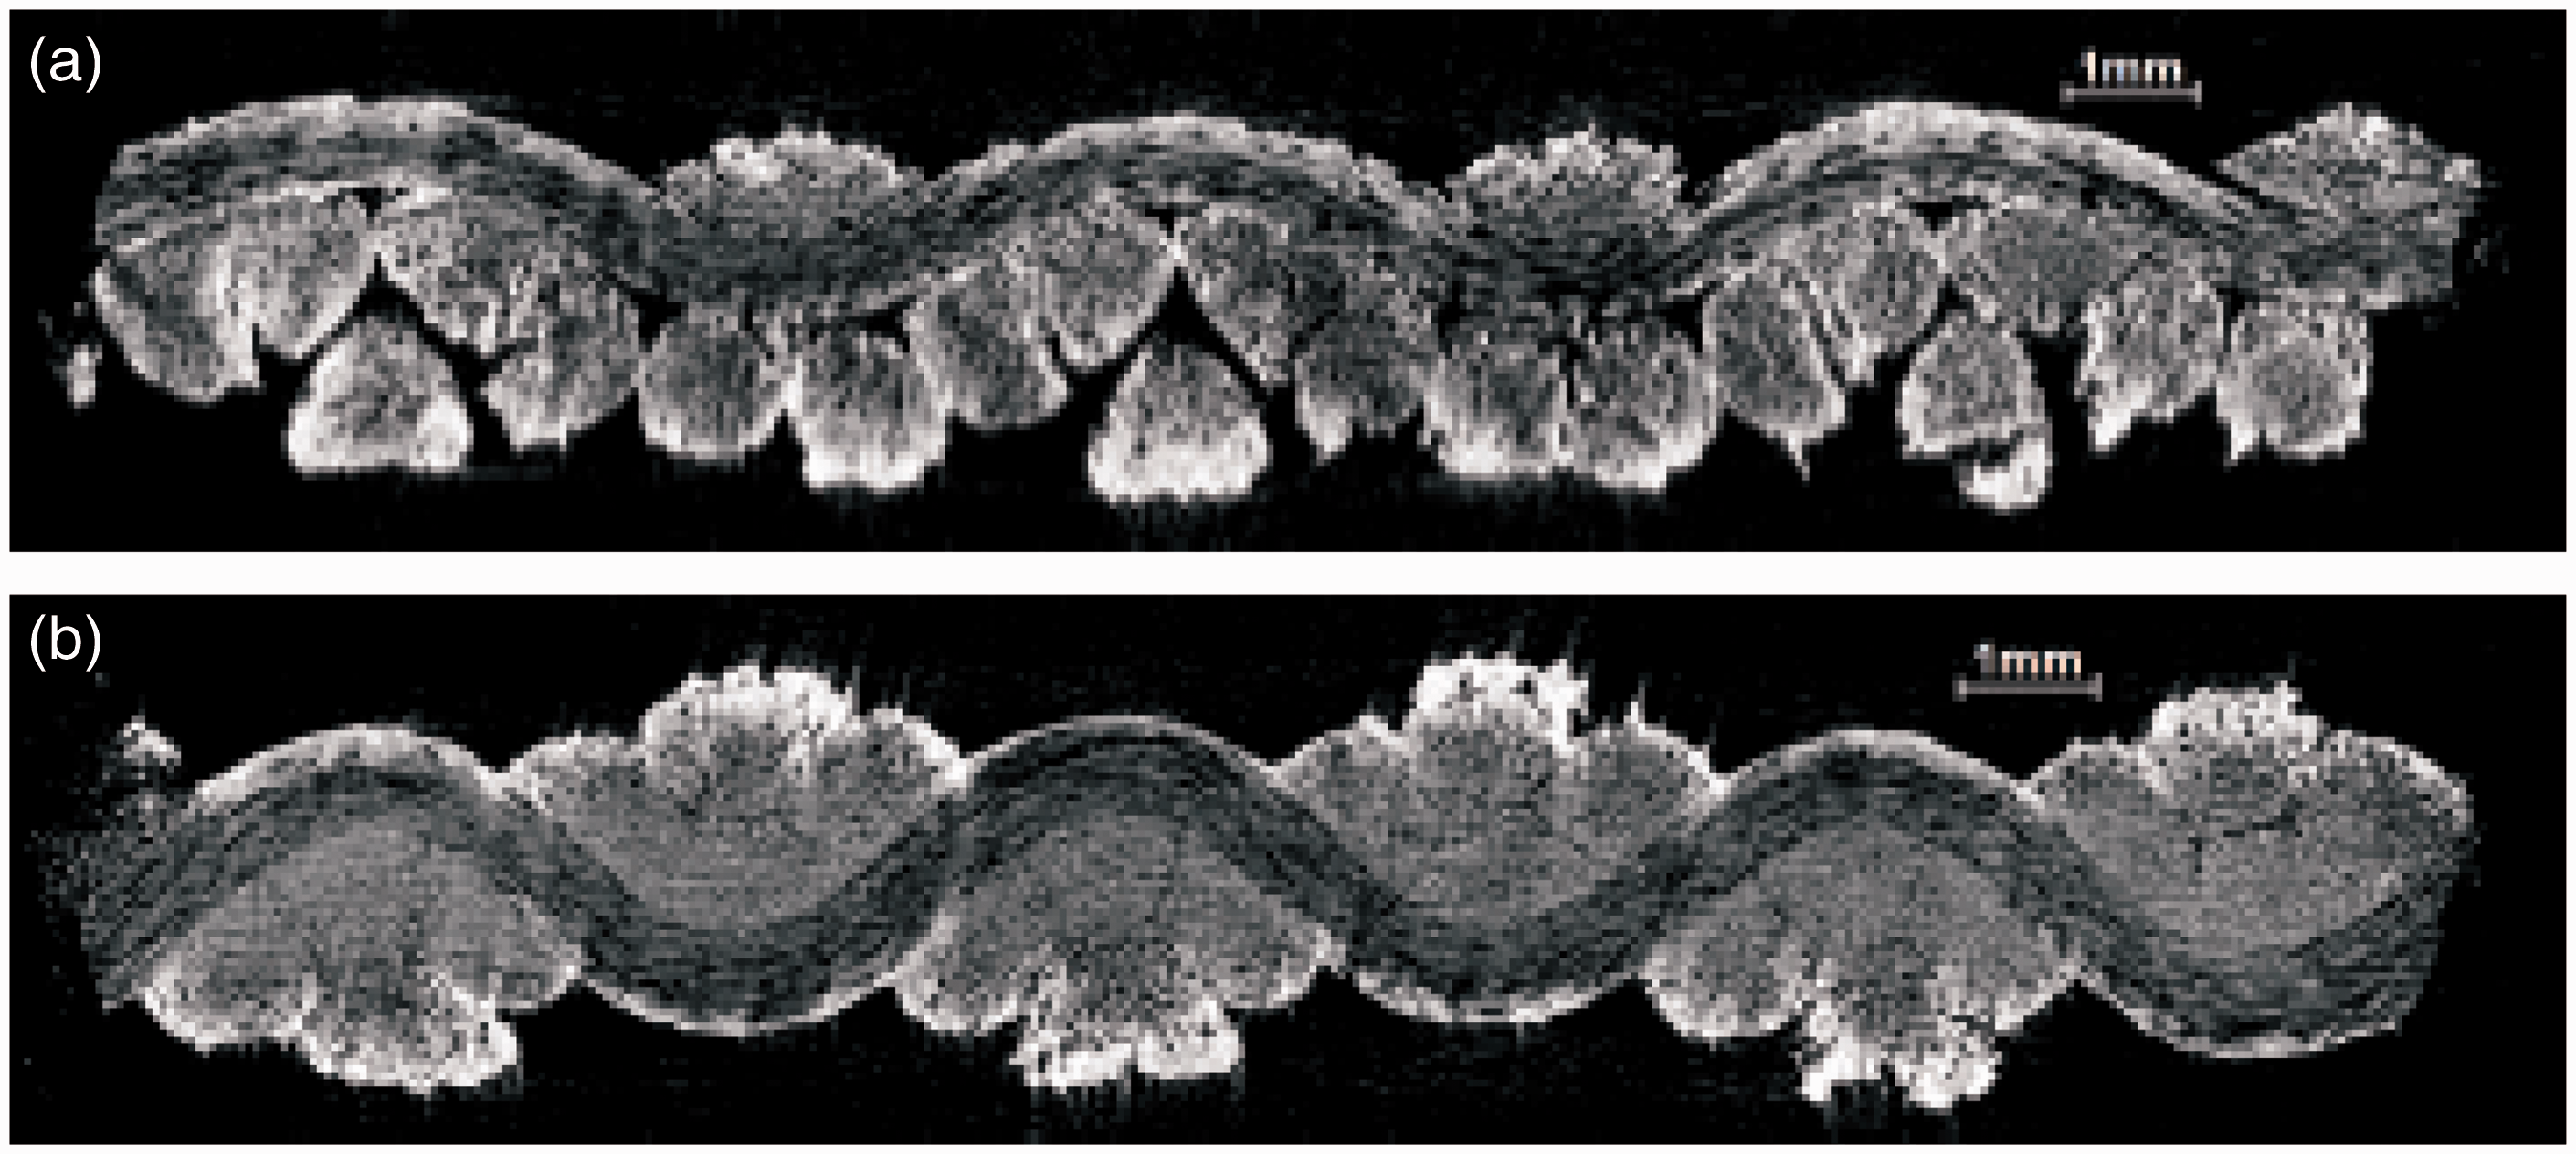
The use of X-ray to analyse the inner composition of rubber–textile conveyor belts is not satisfactory. For an accurate assessment, the methods need to be used in single layers along with execution of detailed measurements, providing a solid, analytical material. Present methods include such a kind which is industrial metrotomography.
Based on the above-mentioned facts, three basic hypotheses were stated, which were later on verified within the research on applying the computer metrotomography for the analysis of rubber–textile conveyor belts carcass.
The first hypothesis assumes that industrial metrotomograph can scan any point of the analysed sample of the conveyor belt. That means, besides analysis of the whole sample, the analysis of a particular preselected point will be possible. Whether the analysis will be possible due to the method or the structural construction of the facility will have no impact on successful confirmation of the hypothesis.
The second hypothesis assumes that the method of industrial metrotomography will allow the inspection of inner carcass of the rubber–textile conveyor belt. Due to this, various defects of the inner structure shall be identified, which was not possible to obtain with the methods having been used so far.
The third hypothesis assumes that computer metrotomography will allow us to perform basic dimensional analysis of the rubber–textile conveyor belt carcass. At the same time, simple dimensional analysis of identified defects in the carcass will be executed.
Theory/calculation – basics of industrial CT
CT as a technology of obtaining information for dimensional analysis and porosity analysis enables, besides the surface checking, checking of inner material defects, or checking of presence of unknown/foreign material detected on the surface. This method also provides data about surface and volume, and due to a contact-free evaluation, enables the measurement of dimensions which cannot be obtained with the use of other methods.
The source of X-radiation is an X-ray tube – the vacuum tube serving as an electron emitter. Scanner is a part of tomography device which absorbs the X-radiation that passed through the object being scanned. In case of industrial metrological computer tomographs, the X-ray tube and scanner are static, while the detected object rotates in between.
Basic kinematic system (Figure 6) usually consists of a rotary table for stepwise or continuous rotation of a scanned object, axis of movement in ‘x’ direction for positioning of rotary table between X-ray tube and the detector, axis of movement in ‘y’ direction for positioning of rotary table parallel to the detector, and from vertical axis of movement in ‘z’ direction for setting of the height of rotary table or positioning of X-ray tube and the scanner.
Schematic representation of a device using CT.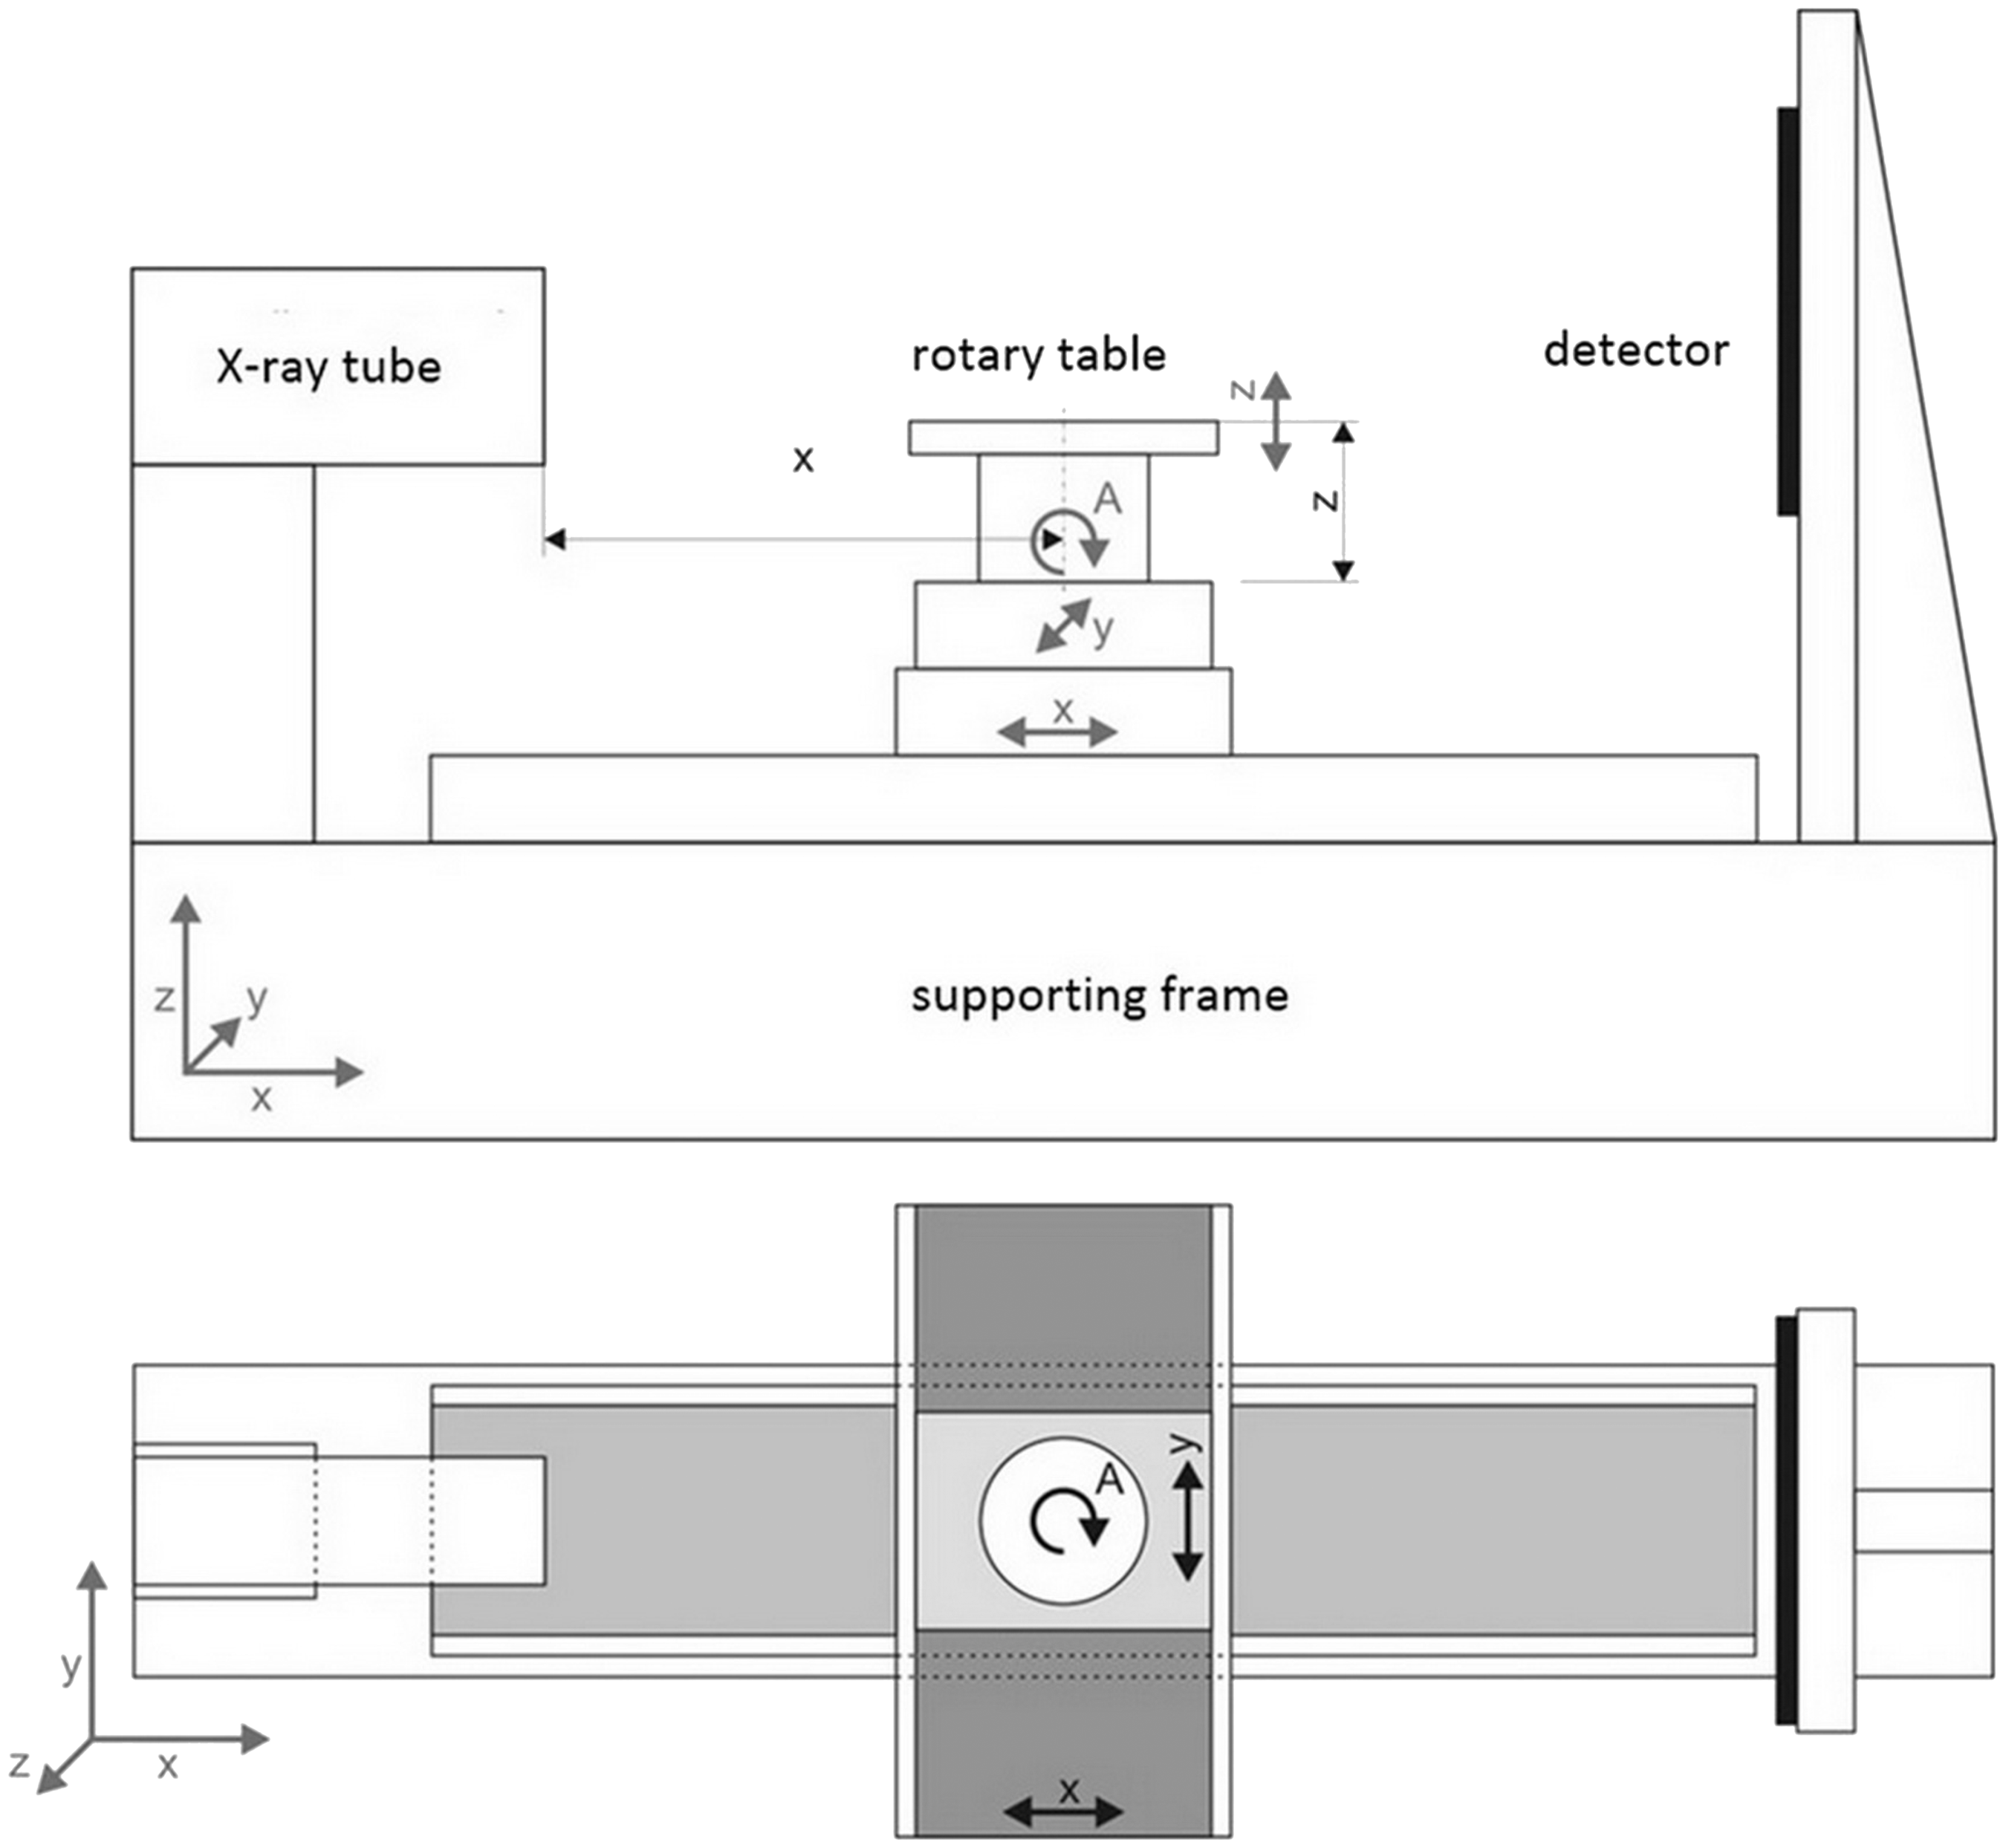
Individual components of the measuring device must feature high accuracy and stability (geometric and thermal) as they affect the result of scanning. The errors in position of the rotary table and its rotation can affect the quality of evaluation of volume data (point clouds). The errors in setting and stability of axis ‘x’ can affect the distance of scanned object from the X-ray tube thus affecting its resultant enlargement.
For object scanning, a few methods or their variations can be used. Nowadays, two basic strategies are being used: scanning only of a rotating object – used in combination with conical tow of X-ray radiation during which the object rotates once with scanned area always in the field of X-ray radiation, and scanning of a moving and rotating object – used in combination with flap tow and a linear scanner. The object is being scanned sequentially CT is being operated in laboratory conditions at temperature of 20℃ ± 2℃ and all the samples were acclimated prior to their scanning for at least 48 h. Standard X-ray systems only produce 2D data, thus do not enable to visualise volume data. CT enables to display the whole volume of the evaluated area while declared maximum permission error MPEE, in case of Metrotom 1500, is determined according to normative VDI/VDE 2630 part 1.3 at level (10+L/50) µm.
The accuracy of 3D object reconstruction is, besides others, affected by the following: accuracy and repeatability of kinematics of a CT device, identification of rotation axis, selection of voxel size, number of obtained projections, method of voxel and lengths calibration, reconstruction algorithm, algorithm for reduction of hardening of X-ray tow and noise, setting of algorithm for surface determination, material of detected object (attenuation and dispersion) and combination of materials.
Both mentioned types of tomographs can be used, with no limitations, for scanning of conveyor belts.
Results and discussion
As a part of research of computer metrotomography application, individual hypothesis were verified consequently, as well as the possibilities of obtaining information about condition of carcass of rubber–textile conveyor belt. The first hypothesis focused on variability of the whole analytical process of examining the carcass of the conveyor belt. As implied from Figure 7, it is possible to analyse any section of the conveyor belt sample including its inner structure. The inspected point is identified as a point of intersection with virtual section plane, clearly visible and passing through the whole sample.
Placement of section plane in the point of analysis of conveyor belt sample.
The above-mentioned process enables to obtain an accurate and detailed image of structure of the carcass of a rubber–textile conveyor belt (Figure 8). The placement of plane enables to identify whether there is some damage to the carcass, while the visual method enables its preliminary diagnostics and classification.
Visualisation of damage to carcass of conveyor belt in the section plane.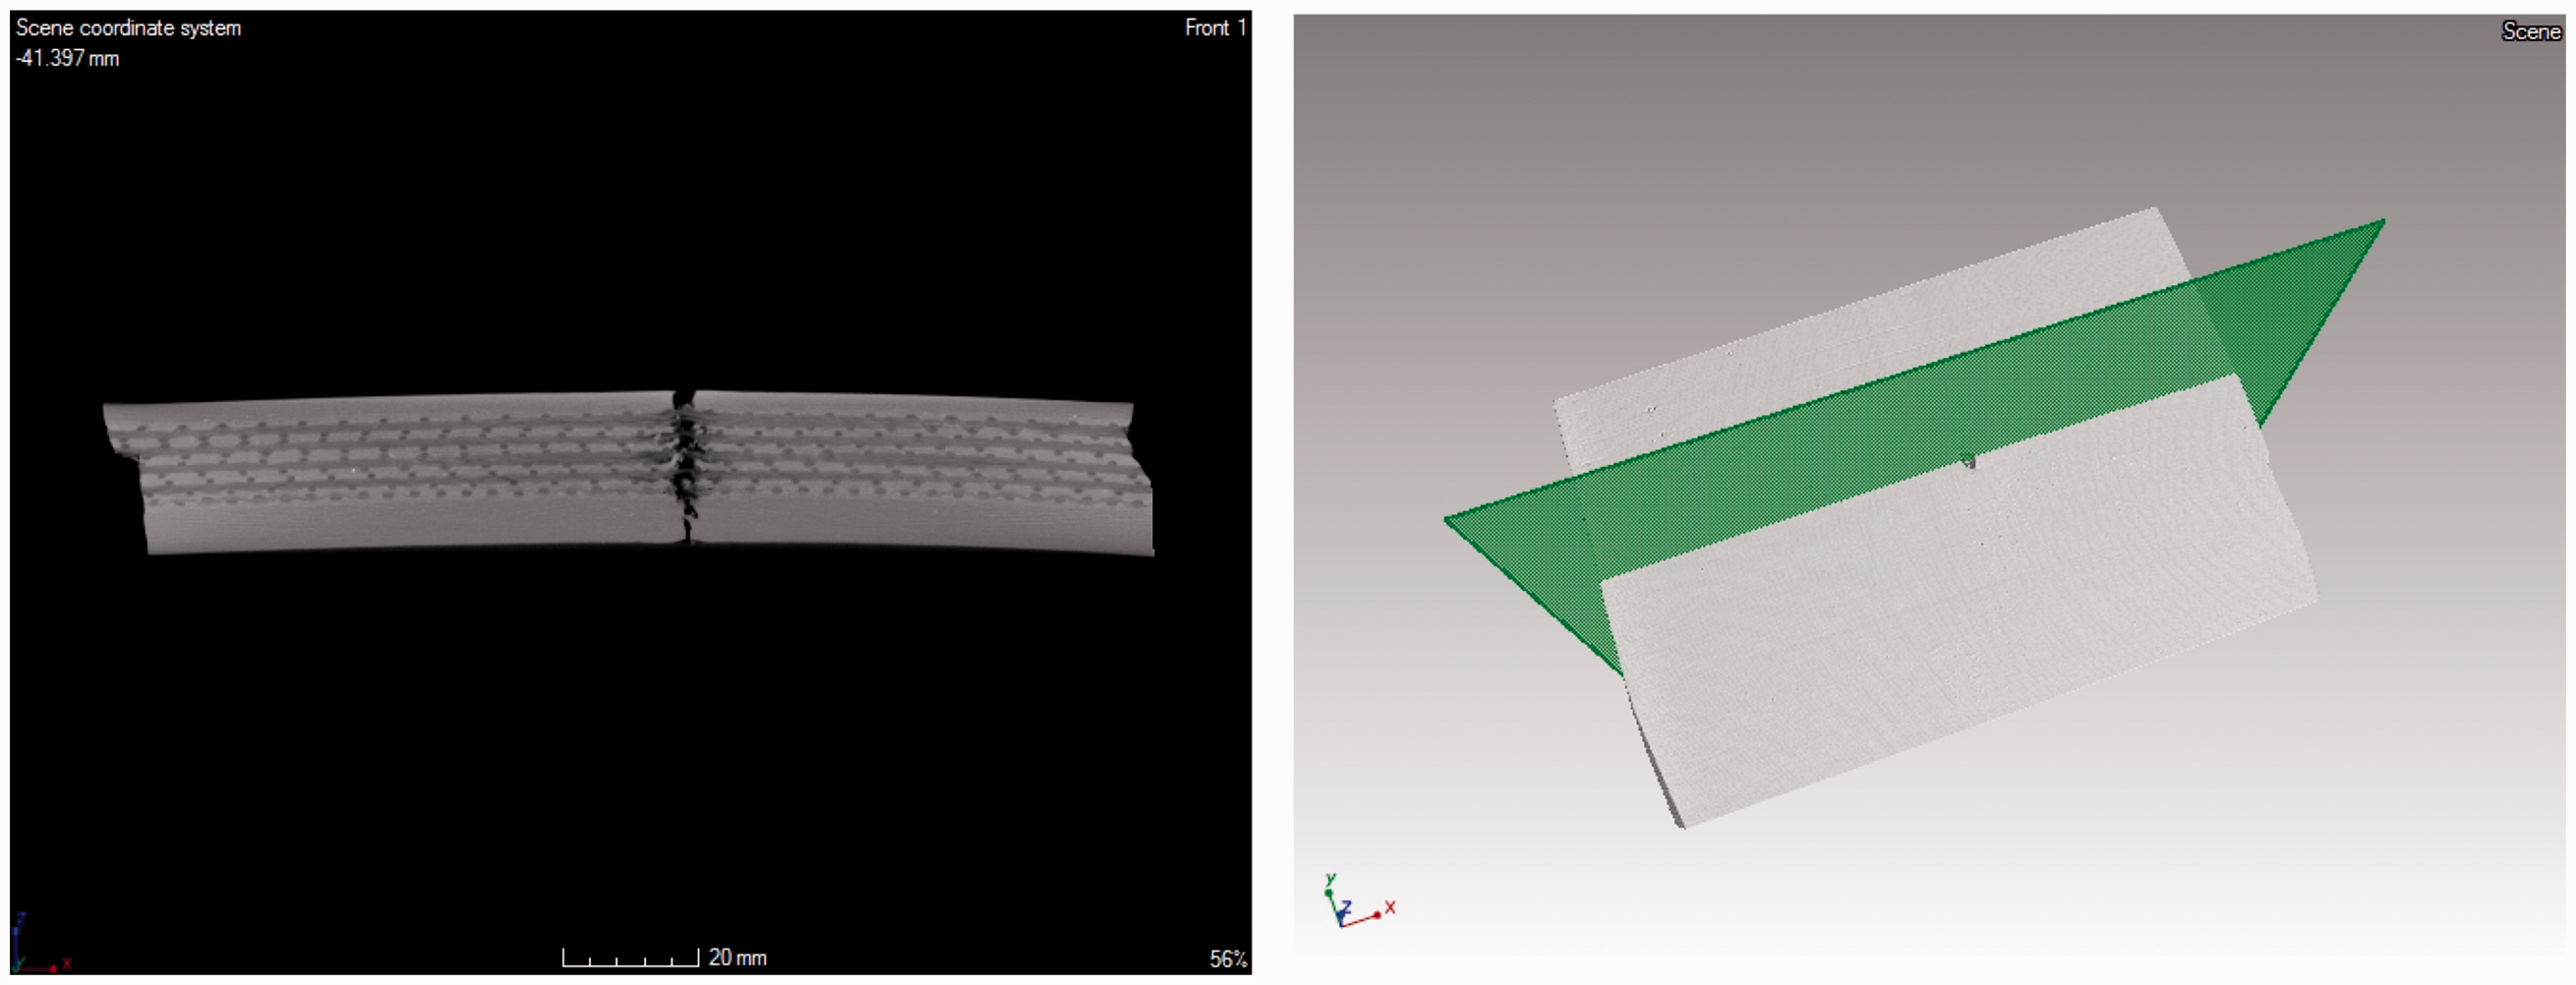
On the basis of above-mentioned facts, we can state that the first hypothesis was confirmed. In particular, the method of computer metrotomography makes it possible to analyse any point of rubber–textile conveyor belt followed by inspection of its inner carcass. The second hypothesis comes out of the assumption that the data obtained by industrial metrotomography method will allow us to evaluate and inspect the textile component of rubber–textile conveyor belt. The method of industrial metrotomography enables various forms of analysis of inner structure of the rubber–textile conveyor belt (Figure 8), which can be performed very conveniently.
As can be seen in Figure 9, the sample features individual fibres and the way of their inter weaving into a single monolithic unit. The image makes it possible to formulate the conclusions easily about whether the carcass is damaged in the particular point; eventually, the point of interest can be determined for further analysis. The analysis can be done for textile fibres in the warp as well as in the weft.
Details of a carcass of rubber–textile conveyor belt.
When inspecting the perforation of rubber–textile conveyor belts and their resistance to it, the primary defects can be accompanied with secondary defects in form of various cavities and inner microcracks. Their identification and localisation have been difficult one with the use of current methods of evaluation, and only approximate, based on the series of secondary signs. The application of industrial metrotomography, however, enables a very accurate identification, localisation and subsequent analysis. Figure 10, besides displaying main, visually easily identified defect, also displays the secondary defect. The defect is triggered by a local absorption of kinetic energy of a falling mass. The defect is not only seen as perforation of the rubber–textile conveyor belt in the point of falling mass, but the other defect occurred in which the textile fibres of the conveyor belt got separated from its rubberised component. This has resulted in a possible inhomogeneity of the conveyor belt.
Identification of damaged conveyor belt beyond the area of main defect.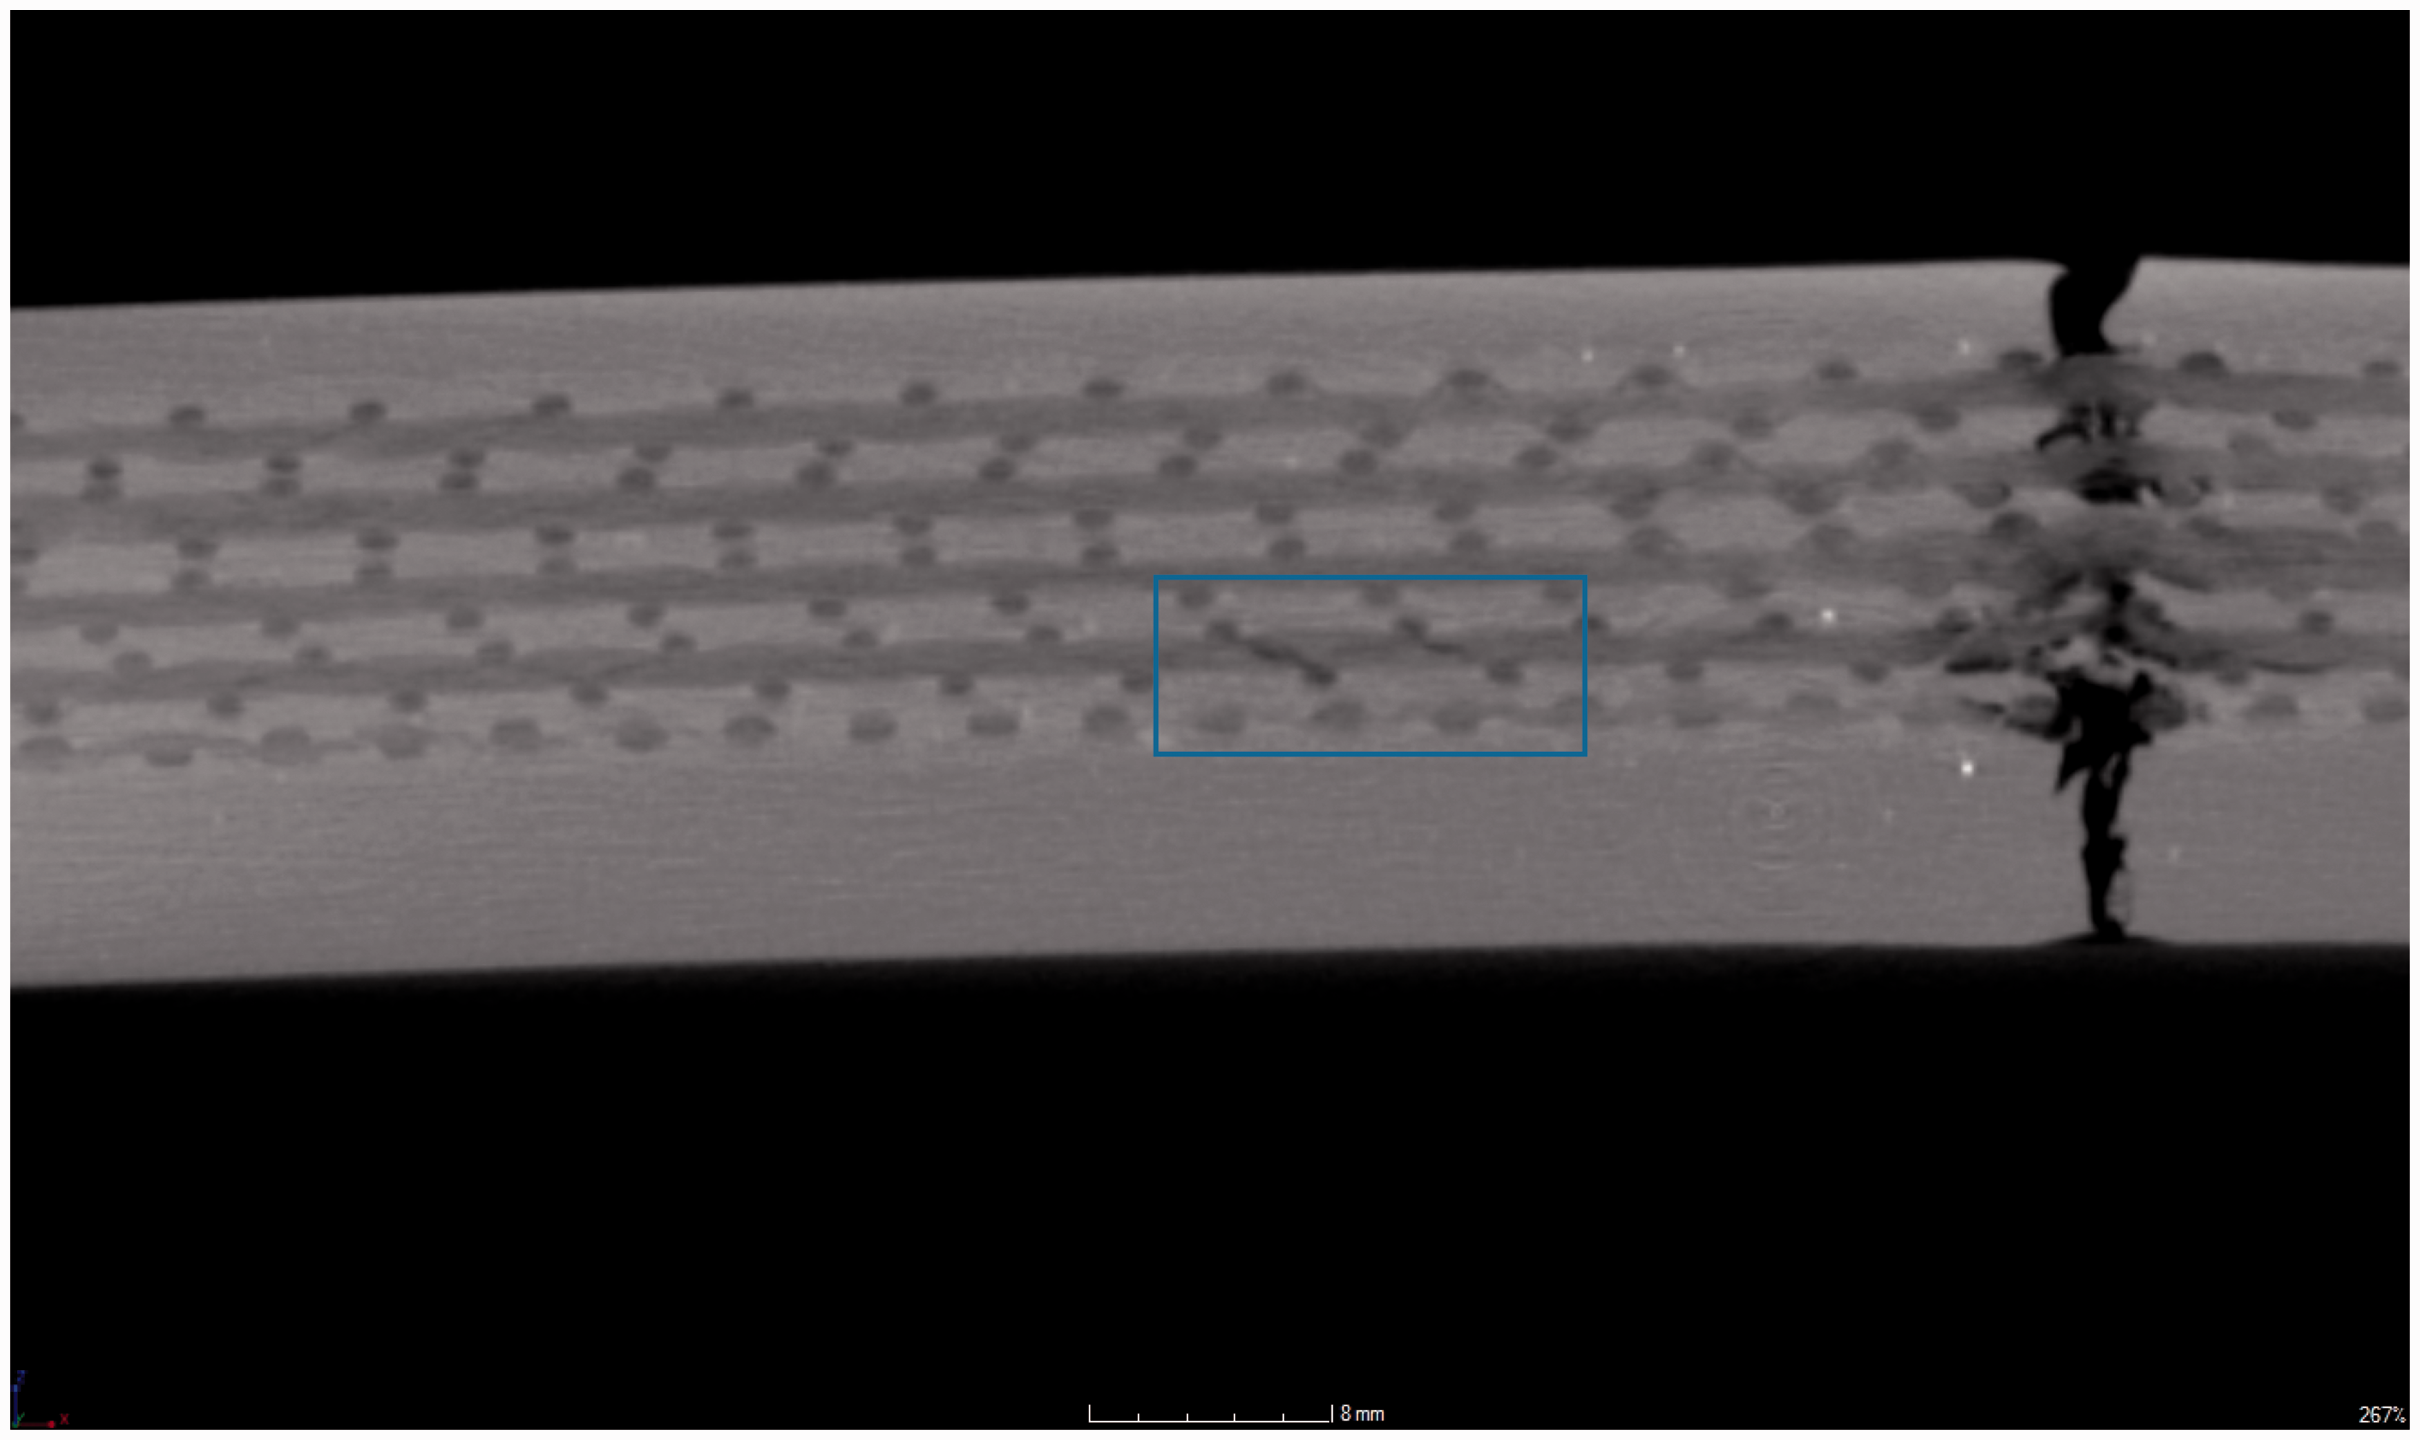
All the findings fully support the second hypothesis and extend it significantly. Due to this, a very detailed analysis of individual fibres can be done.
The third hypothesis deals with the size analysis of carcass of the rubber–textile conveyor belt. Size analysis, despite reservations of some conveyor belt users who claim it is useless, has a very important role, often not fully realised.
Size analysis enables significant evaluation of the conveyor belt quality not only at the time of its purchase and installation, but also in the course of its operation.
First of all, when purchasing the rubber–textile belt, random samples enable the evaluation to confirm whether the belt meets all the specifications as declared by its manufacturer. This means, we can find out whether the quality of sold product is on a required quality level. The operators of conveyor belts are able to evaluate the condition and quality of the belts in the course of their operation, thanks to the size analysis. On the basis of analysis, they can also decide about its replacement, predict its lifespan or adjust conditions of the belt operation. For example, determining the change in distance between textile fibres indicates the error in the consistence of inner layer. This fact can never be underestimated, as it may result in outer or inner perforations of the conveyor belt or even worse, the belt rupture which might be fatal for the belt’s user.
The conveyor belt operator should always evaluate and compare individual size analysis of the rubber–textile conveyor belts as a part of their regular maintenance. Figure 11 shows a simple size analysis in the longitudinal/axial direction, where size analysis can be performed at individual points or the whole tows of textile fibres. As can be seen, the distance between individual fibres can be analysed in vertical as well as horizontal direction.
Size analysis in longitudinal direction of the rubber–textile conveyor belt.
Its results can show unwanted processes in the carcass of the conveyor belt demonstrated in form of changes of distance between the textile fibres. Individual textile fibres are interconnected and surrounded with rubber all around. In standard conditions, any permanent change of distance between fibres is unwanted, and its existence means a very serious damage to rubber–textile conveyor belt.
Similar type of analysis can be performed in various views in combination with gradual section through the entire thickness of the conveyor belt. Figure 12 shows a cross-section in the point of destruction, where the distances between fibres in longitudinal as well as transversal directions are measured with the use of caliper. The shape of fibres is deformed and the fibres are not in the same cross-section plane. The deformation is seen as darker shade and is, more or less, of round shape.
Size analysis in the longitudinal direction of the rubber–textile conveyor belt.
As mentioned before, the analysis enables us to identify possible defects contributed to carcass of the conveyor belt. Figure 13 shows a defect in the top cover layer, but the attention should be given to dark stains in carcass, too.
Size analysis in the longitudinal direction of the rubber–textile conveyor belt with defects visualisation.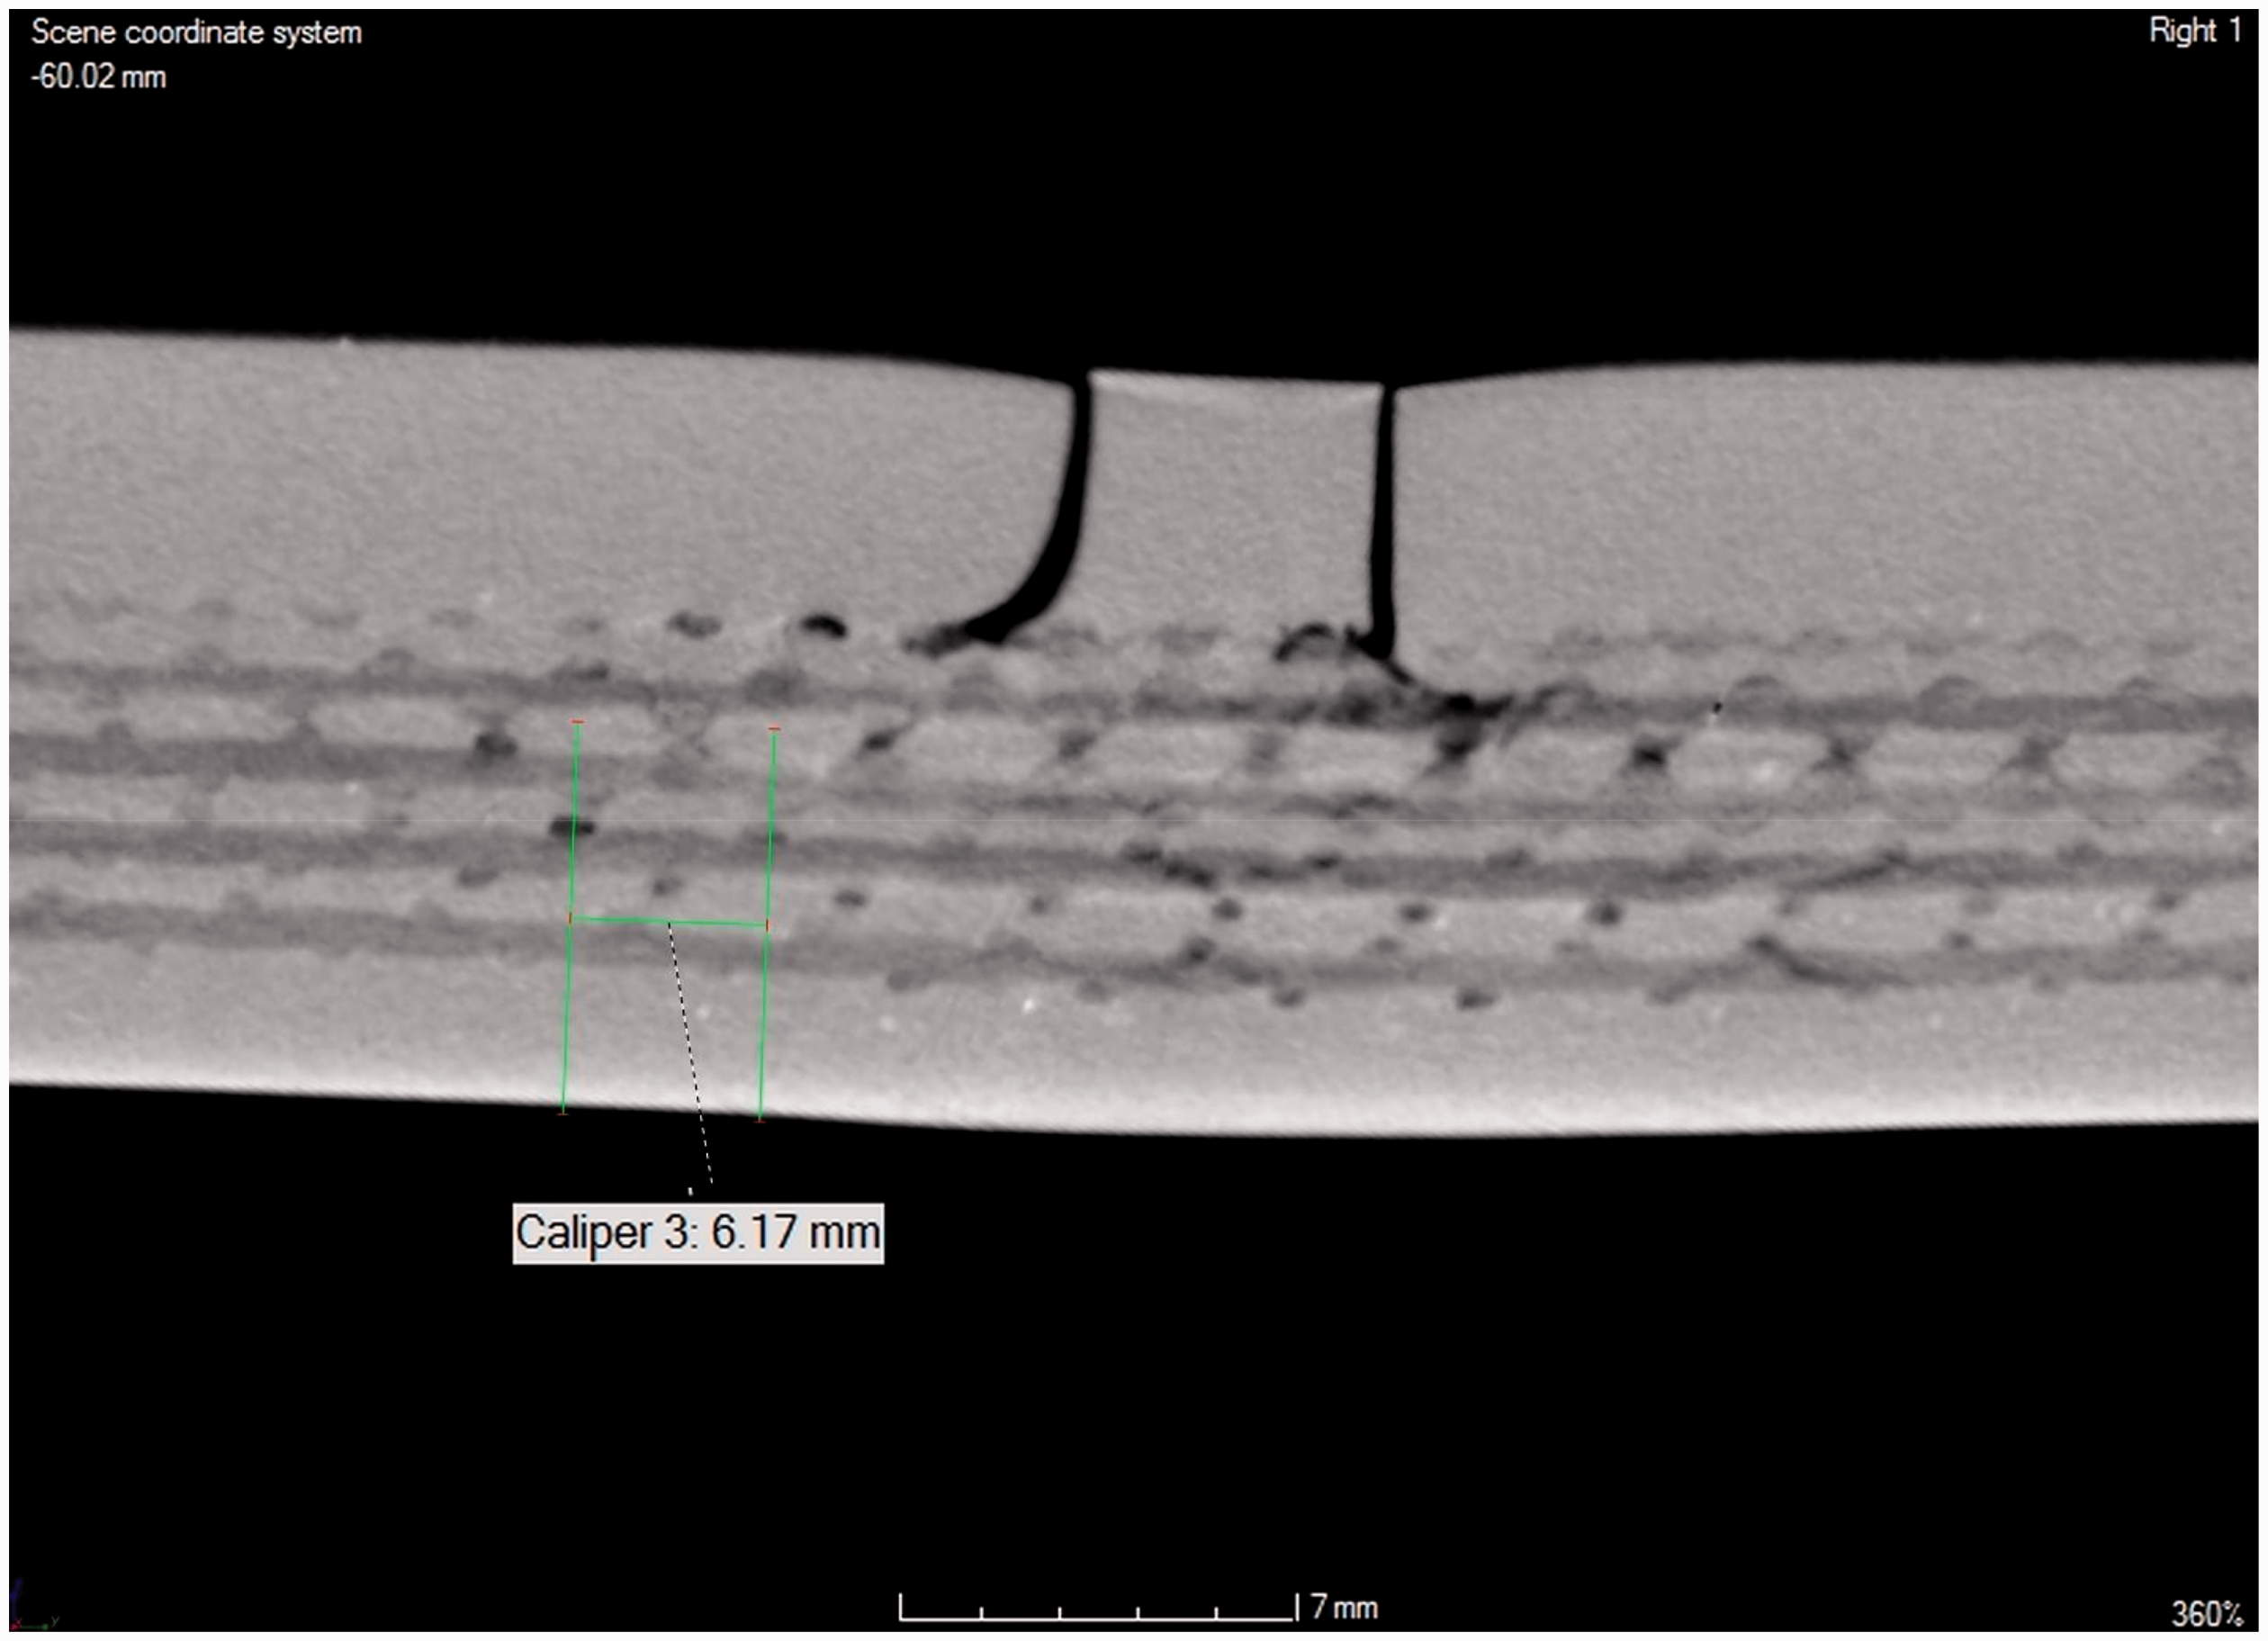
The method of industrial metrotomography is a suitable one to be used to observe carcass of the rubber–textile conveyor belt (Figures 14 and 15). Due to different density of rubber and textile, material density was manually set in the way to approach the fabric density with the use of VGStudio MAX software. Then, the region Region of Interest (ROI) was created and separated, on the basis of the fabric density (Figure 15).
Carcass of the conveyor belt. Failure of the carcass.

Conclusions
Rubber–textile conveyor belts play a significant role in continuous transport of raw materials in many industries. They affect the efficiency of various technological processes. As a tool, they require a high investment from their users. Thus, all the users of rubber–textile conveyor belts strive to achieve their maximum life cycle. Their attempt can be significantly supported with a regular observation and assessment of the conveyor belt condition. Carcass affects the qualities and life cycle of the belts a lot.
Destructive methods having been used so far are not sufficient and suitable enough. The research presented in the article has verified and proved the validity of initial hypotheses, which enable efficient evaluation of the carcass. Further research in the area should address the way of carrying out such an analysis with maximum sample size, respectively, at any point of the rubber–textile conveyor belt. This method can be applied in the laboratory conditions, but this situation is fully sufficient. In this way, the research and the dimensional analysis of the rubber–textile conveyor belts are significantly move ahead. The resulting effect of this method can be achieved by extending its use in real operating conditions in order to capture any adverse changes in the textile carcass of the conveyor belt.
Footnotes
Declaration of Conflicting Interests
The author(s) declared no potential conflicts of interest with respect to the research, authorship, and/or publication of this article.
Funding
The author(s) disclosed receipt of the following financial support for the research, authorship, and/or publication of this article: This work is a part of the following projects: APVV-15-0149, VEGA 1/0258/14, VEGA 1/0063/16, KEGA 018TUKE-4/2016