
Abstract
Coated technical textiles are widely used for several industrial applications. Most of these coated fabrics are made with a polyester fabric and a polyvinyl chloride (PVC) coating but in order to reduce the environmental impact, the producers are willing to substitute PVC by thermoplastic polyurethane (TPU). However, a technological lock of the calendering of TPU on polyester fabric is the ability to get a good adhesion of the coating on the fabric. Producers could increase the temperatures of extrusion of the coating but TPU have a short range of extrusion temperatures making it difficult to extrude. One solution is to make a blend with another polymer which has a higher extrusion temperature range. In the present work, the studies of the addition of low density polyethylene (LDPE) and linear low density polyethylene grafted maleic anhydride (LLDPE-g-Ma) in polyurethane coating on the tensile strength of the sheet and on the peel strength with a polyester fabric have been studied as well as the influence of the extrusion temperature. SEM observations, FTIR spectrums, and viscosity measurements have been performed to understand the behavior of the different blends. Results show that extrusion temperature and penetration depth of the coating in the fabric have a positive influence on the peel strength.
Introduction
Coated technical textiles are widely used for several applications like sails, big tops, paragliders, or inflatable boats and the demand is still on the rise. These very light technical textiles are usually manufactured with a polyester fabric and a polyvinyl chloride (PVC) matrix. However, environmental constraints force the manufacturers to find a substitute material for the PVC which is harmful and difficult to recycle [1]. Thermoplastic polyurethane (TPU) is a good substitute material for the PVC. Depending on its formulation and the components, TPU can have good properties [2] such as UV resistance [3, 4], abrasion resistance [5], solvent resistance [6], tensile strength [7], or high elongation [8]. These properties make TPU an attractive material for coated textiles [9] or for leather like products [10]. These TPU coated textiles are used for inflatable boats, flexible tanks, or more technical applications like lighter-than-air systems for high altitude applications [11].
Despite all these good properties, there is still a technological lock. Some industrials report that they are recalcitrant to use polyurethane sheets for coated textile because of very low peel strength of the sheet on the polyester fabric after calendering. To the best of our knowledge, industrials are more willing to use other processes like knife-over-roll coating or air-knife coating. These two methods are especially used for tightly fabrics where a low thickness of polyurethane is required like waterproof garments or materials for small inflatable boats [12, 13]. But if a more important thickness is needed, these methods are quite difficult to use and manufacturers do not have any other choice than using calender coating or rotary-screen coating which are also cheaper than the others [12]. To use both mentioned processes, they have to make special surface treatments on the fabrics. Six theories have been proposed to explain the different mechanism of adhesion: mechanical interlocking [14], wetting [15], diffusion [16], electrostatic [17], chemical [18], and weak boundary layer [19]. All these theories show that the adhesion between two materials is linked with the interface as outlined by Mittal [20]. Further studies explain that the quality of adhesion between the fabric and the matrix is a key parameter to obtain good mechanical performance of the composite [21]. As a consequence, several treatments have been developed to enhance the quality of the interface. Previous researches used different treatments for the fabric such as atmospheric air or corona plasma treatments to modify the surface energy of the fabric and increase the adhesion of the coating. For example, Leroux et al. [22] showed that the adhesion of a silicon resin on a polyester fabric after atmospheric air plasma treatment has been multiplied by two. There are numerous other papers that deal with plasma treatment and their influence on the hydrophilicity increase of the treated fabric [23–29]. However, Novak and Florian [30] showed that the shelf-life of these treatments for a polypropylene material with polyvinyl acetate was only about 50 days due to the loosening of the surface oxidation. Other research used corona treatments [31–33] or chemical treatments [34, 35] to increase the wettability of the fabrics.
One possibility is to increase the extrusion temperature in order to modify the viscosity and the surface energy. The problem is that TPU has a short range of extrusion temperatures and an increase of only 5℃ can generate a drop in the viscosity of the polymer making it impossible to calender on a fabric. Hence, we propose to make a blend with low density polyethylene (LDPE) and linear low density polyethylene grafted maleic anhydride (LLDPE-g-Ma). The aim of this blend is to extrude the sheet at higher temperatures in order to get a better adhesion with a polyester fabric.
Because of their high difference of polarities and their high interfacial tension, polyurethane and polyethylene are two immiscible materials. However, previous researches explain that it is possible to have a compatibility if the PE is grafted with maleic anhydride [36, 37] or secondary amine [37]. These compatibilizers are capable to stay at the interface and entangling with both sides. The final material is then prepared by calendering the sheet of TPU/LDPE blend on a polyester fabric. According to the literature, there is no previous research about the influence of this blend on the plastic sheet adhesion on a polyester fabric. However, we can notice that Song et al. [38] show that the adhesion of a polyurethane paint was greater on a polyolefin/TPU blend substrate than on a simple PO substrate.
This paper proposes a new solution to enhance the adhesion of the sheet on the fabric. It suggests a modification of the plastic sheet that is extruded before being calendered. Thanks to an experimental design, the influences of extrusion temperature as well as the influence of LDPE and PE-g-Ma percentage in the blend on the peel strength and the mechanical performance of the film is analyzed. The value of the adhesion of the sheet on the fabric is the main proof of the influence of the blend. The sheet viscosity, the miscibility of the LDPE and PE-g-Ma in the TPU, the penetration depth of the coating in the yarns of the fabrics, and the FTIR analysis are used to analyze and explain the results of the adhesion.
Materials and methods
Materials characterization
The coating.
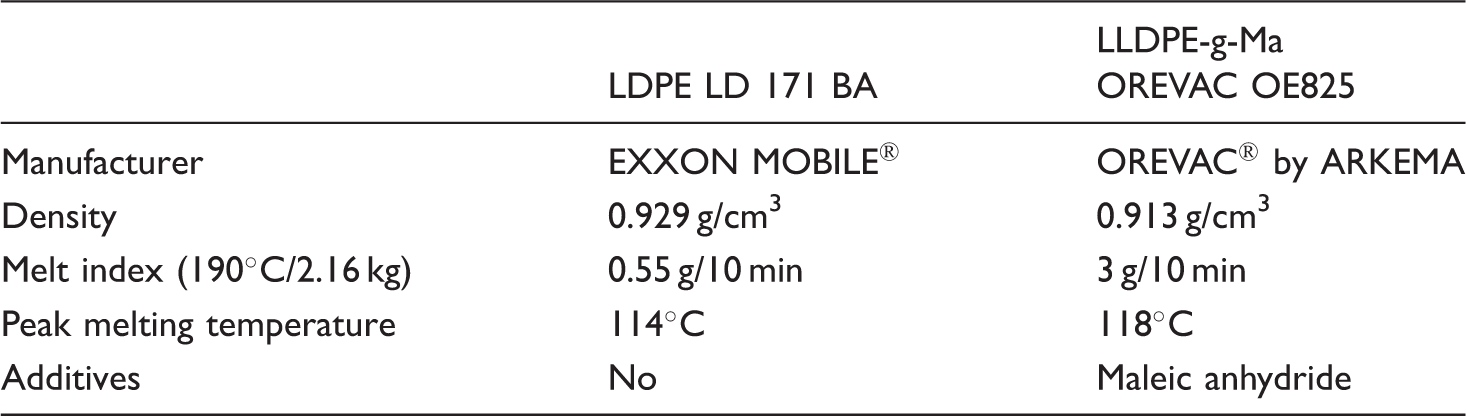
Main properties of LDPE (low density polyethylene) and LLDPE-g-Ma (linear low density polyethylene grafted maleic anhydride).
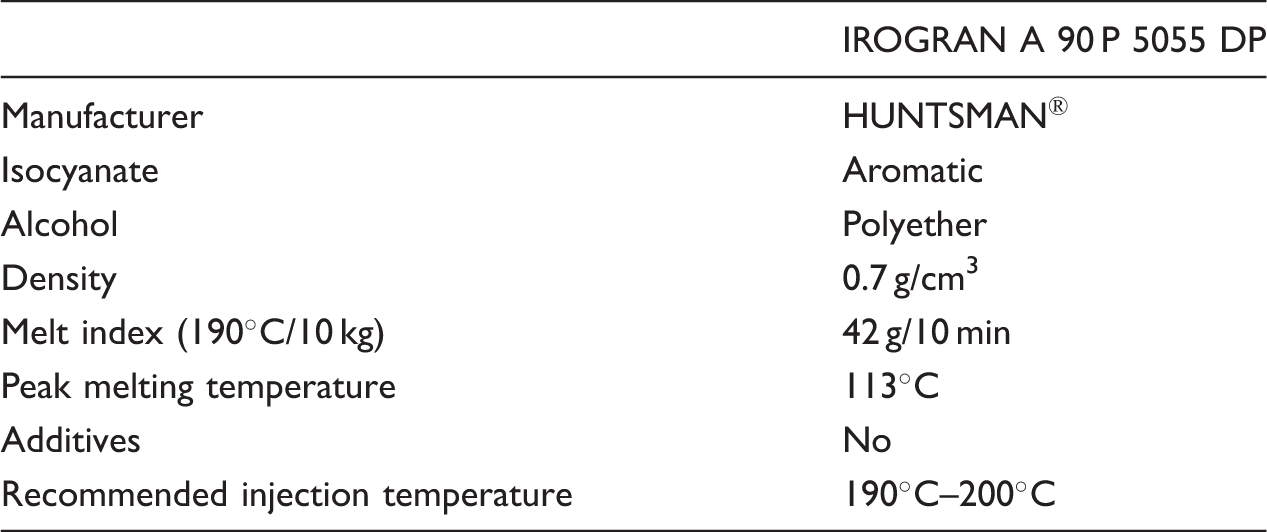
Main properties of TPU.
The fabric.
Main properties of the fabric.
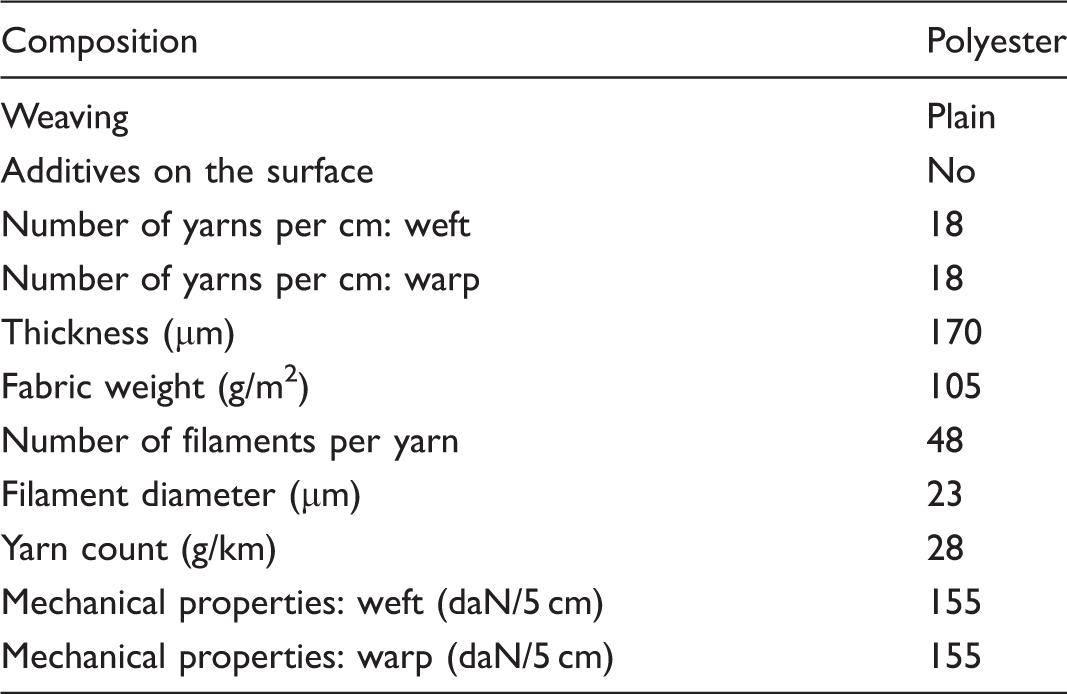
This fabric (Figure 1) has been woven without the use of any additives like sizings on the surface of the yarns to avoid a decrease of the wetting capacity [39].
Modelization with a TexGen© software of the plain fabric used in the study.
Experimental methods
Experimental design
Composite design.

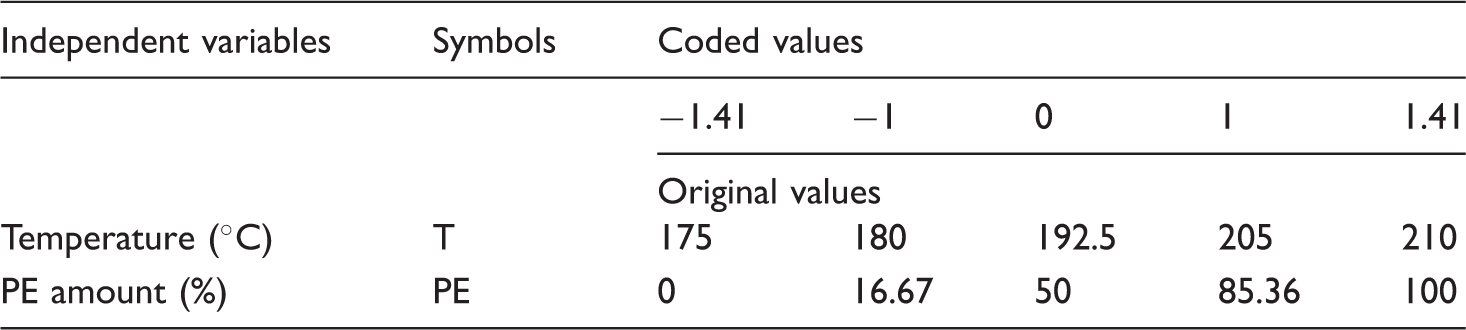
Actually, the most popular response surface method based on a rotatable CCD with five levels and two factors was applied to investigate the influence of process factors on multiple responses including: adhesion (Y1) and mechanical characterization (Y2).
Original and coded values of the independent variables of the extraction process.

Process parameters.

where the notation
A statistical test of the model fit is made by comparing the variance due to the lack of fit to the pure error variance using the F-test. The fitted model is considered adequate if the variance due to the lack of fit is not significantly different from the pure error variance [43–45]. The adequacy of the model is further tested using three check points [43].
The search for experimental conditions which optimize the five responses simultaneously requires the use of the desirability function approach. The method consists in transforming the measured property of each response to a dimensionless desirability scale di defined as a partial desirability function. This makes possible the combination of the results obtained for properties measured on different scales. The scale of the desirability function ranges between d = 0, for a completely undesirable response, and d = 1, if the response is at the target value. Once the function di is defined for each of the responses of interest, an overall objective function (D), representing the global desirability function is calculated by determining the geometric mean of the individual desirabilities. Therefore, the function D over the experimental domain is calculated using equation (2) as follows (43–46)

Taking into account all requirements for all responses, we can, thus, choose the conditions on the design variables that maximize D.
One can see that a high value of D is obtained only if all individual desirabilities di are high. The values of D computed from the observed responses allow us to locate optimal region.
Blend preparation
The LDPE/TPU blends have been prepared in two steps. First the pellets of TPU and LDPE (and/or LLDPE-g-Ma) have been well mixed in a container and then extrusion film experiments have been carried out using a single screw extruder with a Maddock mixer following.
Extrusion–calendering process
Extrusion has been performed with a laboratory-scale extruder Polylab system composed of a HAAKE RheoDrive4 motor coupled with a HAAKE Rheomex 19/25 OS single screw extruder with a Maddock mixer.
The system was piloted by PolySoft OS software to set and control temperature zones and screw speed. The extruder unit was equipped with a fish-tail designed die of 100 mm wide and 450 µm thick to process the molten polymer into a film. The extruder was connected to the air network which provides ambient temperature air to cool the hopper zone. The calendering was performed on only one face of the fabric using a three-roll laboratory calender from THERMO SCIENTIFIC according to Figure 2. The rolls were 200 mm wide and were cooled with a HAAKE Phoenix II P1 thermostat (THERMO SCIENTIFIC) with oil and regulation pump speed.
Scheme of the calendering process.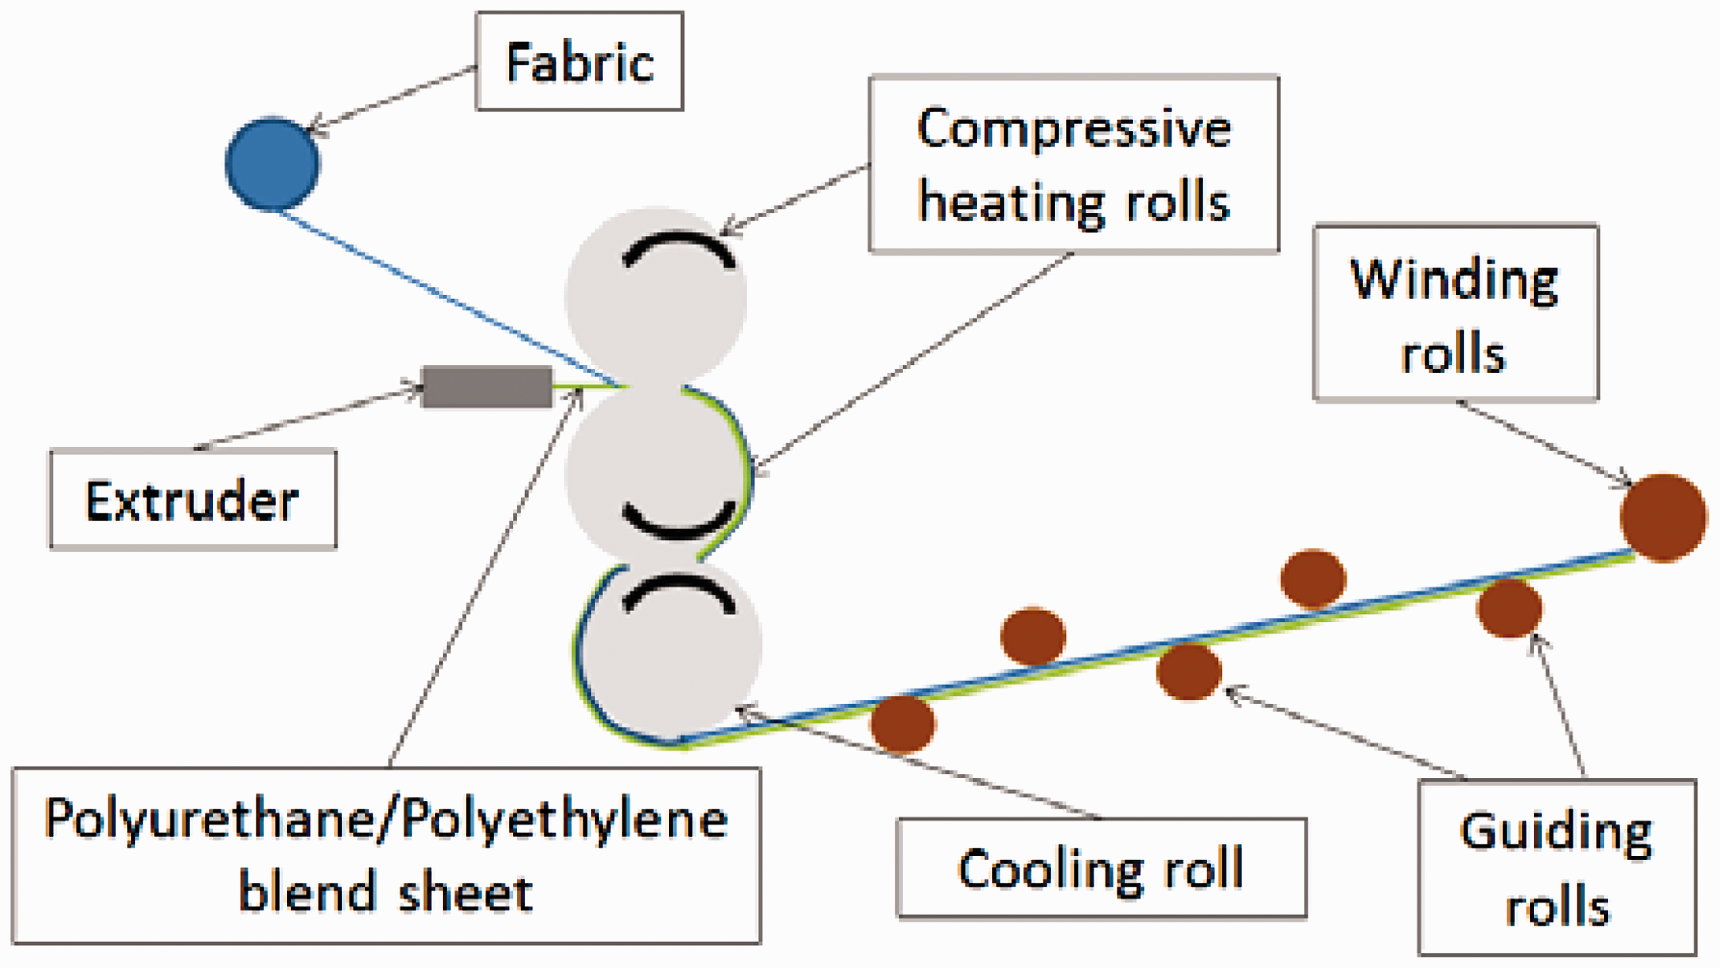
The Table 6 collects all the process parameters for the extrusion–calendering.
In the purpose to have the ability to test the mechanical performance of the films that were calendered on the fabric, the same films were prepared with the same parameters but without fabric.
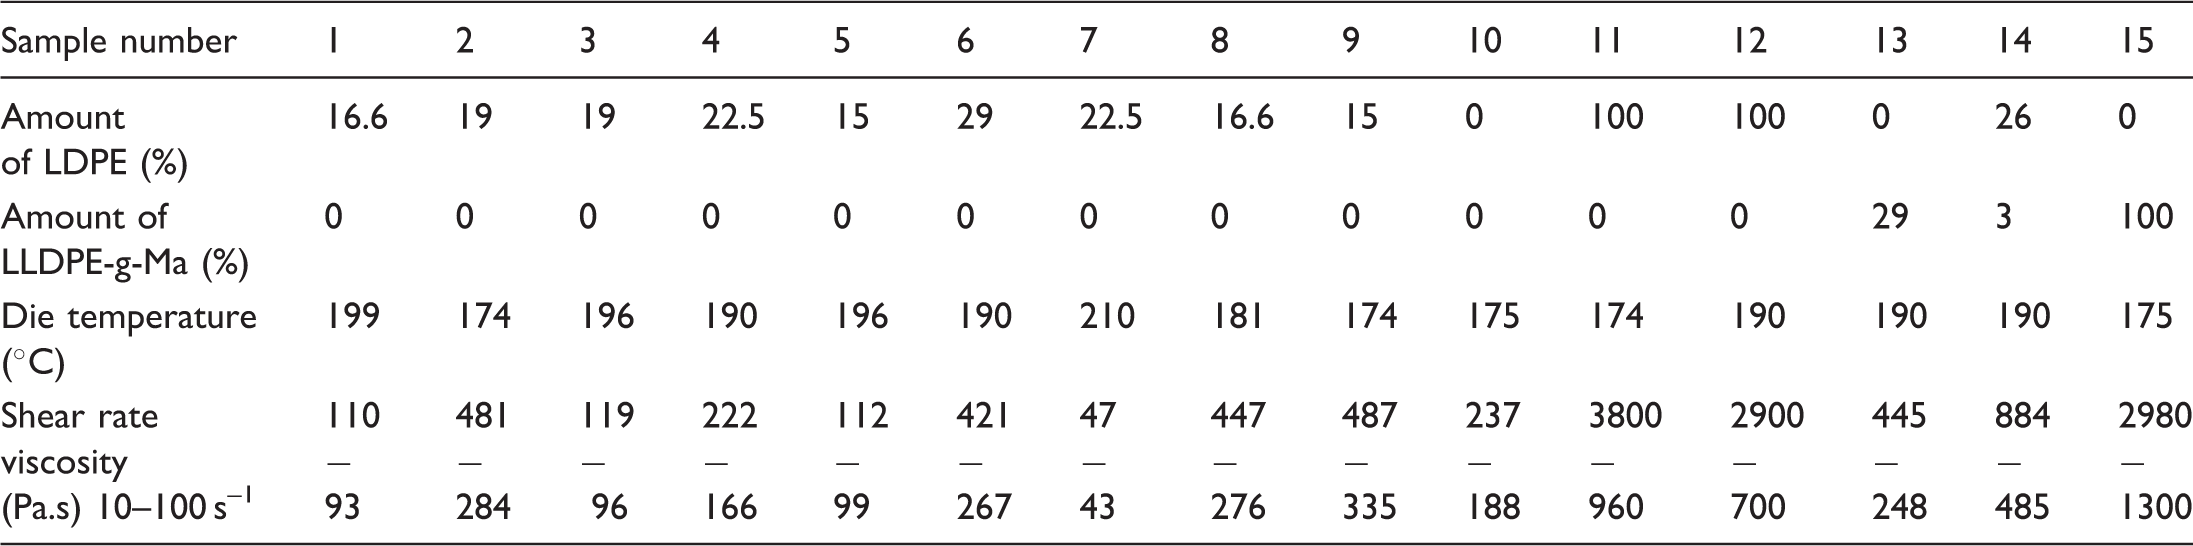
Composition and extrusion temperatures of the different blends.

The films produced had a thickness of 200 µm corresponding to the gap between the compressive heating rolls of the three-roll laboratory calender. This is the lower thickness that it was possible to obtain with the calender. This thickness has been chosen to get the lighter material as possible.
The different heating zones of the extruder are presented in the Figure 3 [47].
Scheme of the extruder and temperature zones [47].
Analysis of the peel strength.
The peel strength of the coating sheet on the fabric has been determined by a peel test carried out on a Zwick Z010 according to the standard NF EN ISO 2411. Samples were cut from the middle of the coated fabrics to avoid edge effects. The coating was first separated from the fabric using a tweezer and a cutting blade. The 50 mm width coating sheet and the fabric were clamped separately on the machine with a distance of 50 mm between grips (Figure 4). A crosshead speed of 100 mm/min and a 0.5 kN cell was chosen. During the test the force was recorded as a function of displacement thanks to TestXpert® II software (Zwick). Reported data are the average of five samples.
Scheme of the peel strength test according to standard NF EN ISO 2411.
Analysis of the mechanical properties of the sheet.
Tensile strength of blends sheets has been measured during a tensile test on a Zwick Z010 with a crosshead speed of 500 mm/min and a 0.5 kN cell. Strip-shaped samples were prepared with a cutting press. The length and width of samples is 40 and 10 mm, respectively and the thickness is measured for each samples. The distance between grips is set at 40 mm to avoid slippage in the grips.
During the test, the force has been recorded as a function of the displacement thanks to TestXpert® II software (Zwick). Reported data are the average of 10 samples. The tensile strength was obtained by dividing the force applied at the breaking by the initial section of the sample.
Analysis of the shear viscosity of the blend.
The dynamical rheological measurements have been performed on disks using a strain controlled rheometer ARES (TA Instrument) equipped with a 25 mm parallel plates geometry in continuous shear mode at the same temperatures than those used for the different calendering tests. According to prior experiments consisting in determining the linear viscoelastic domain for which the behavior of the polymer does not depend of the strain, the frequency sweep at strain was kept at ɛ = 3% and the pulsation ω was in the range of 0.1–100 rad/s. Nitrogen was used to decrease the aging of blends. Disk samples of 1.8 mm thick and 25 mm wide were prepared by injection. The gap was set at 1.5 mm. The result is the average value of three samples.
Analysis of the coated textile sections and of the blends morphology
The section of the coated textile has been analyzed with a scanning electron microscope using the detection of backscattered electrons and a magnification of ×500.
The penetration of the coating on the fabric has been measured as following. Red arrows in Figure 5 indicate the depth of coating penetration
Measurement method of the coating penetration on the fabric.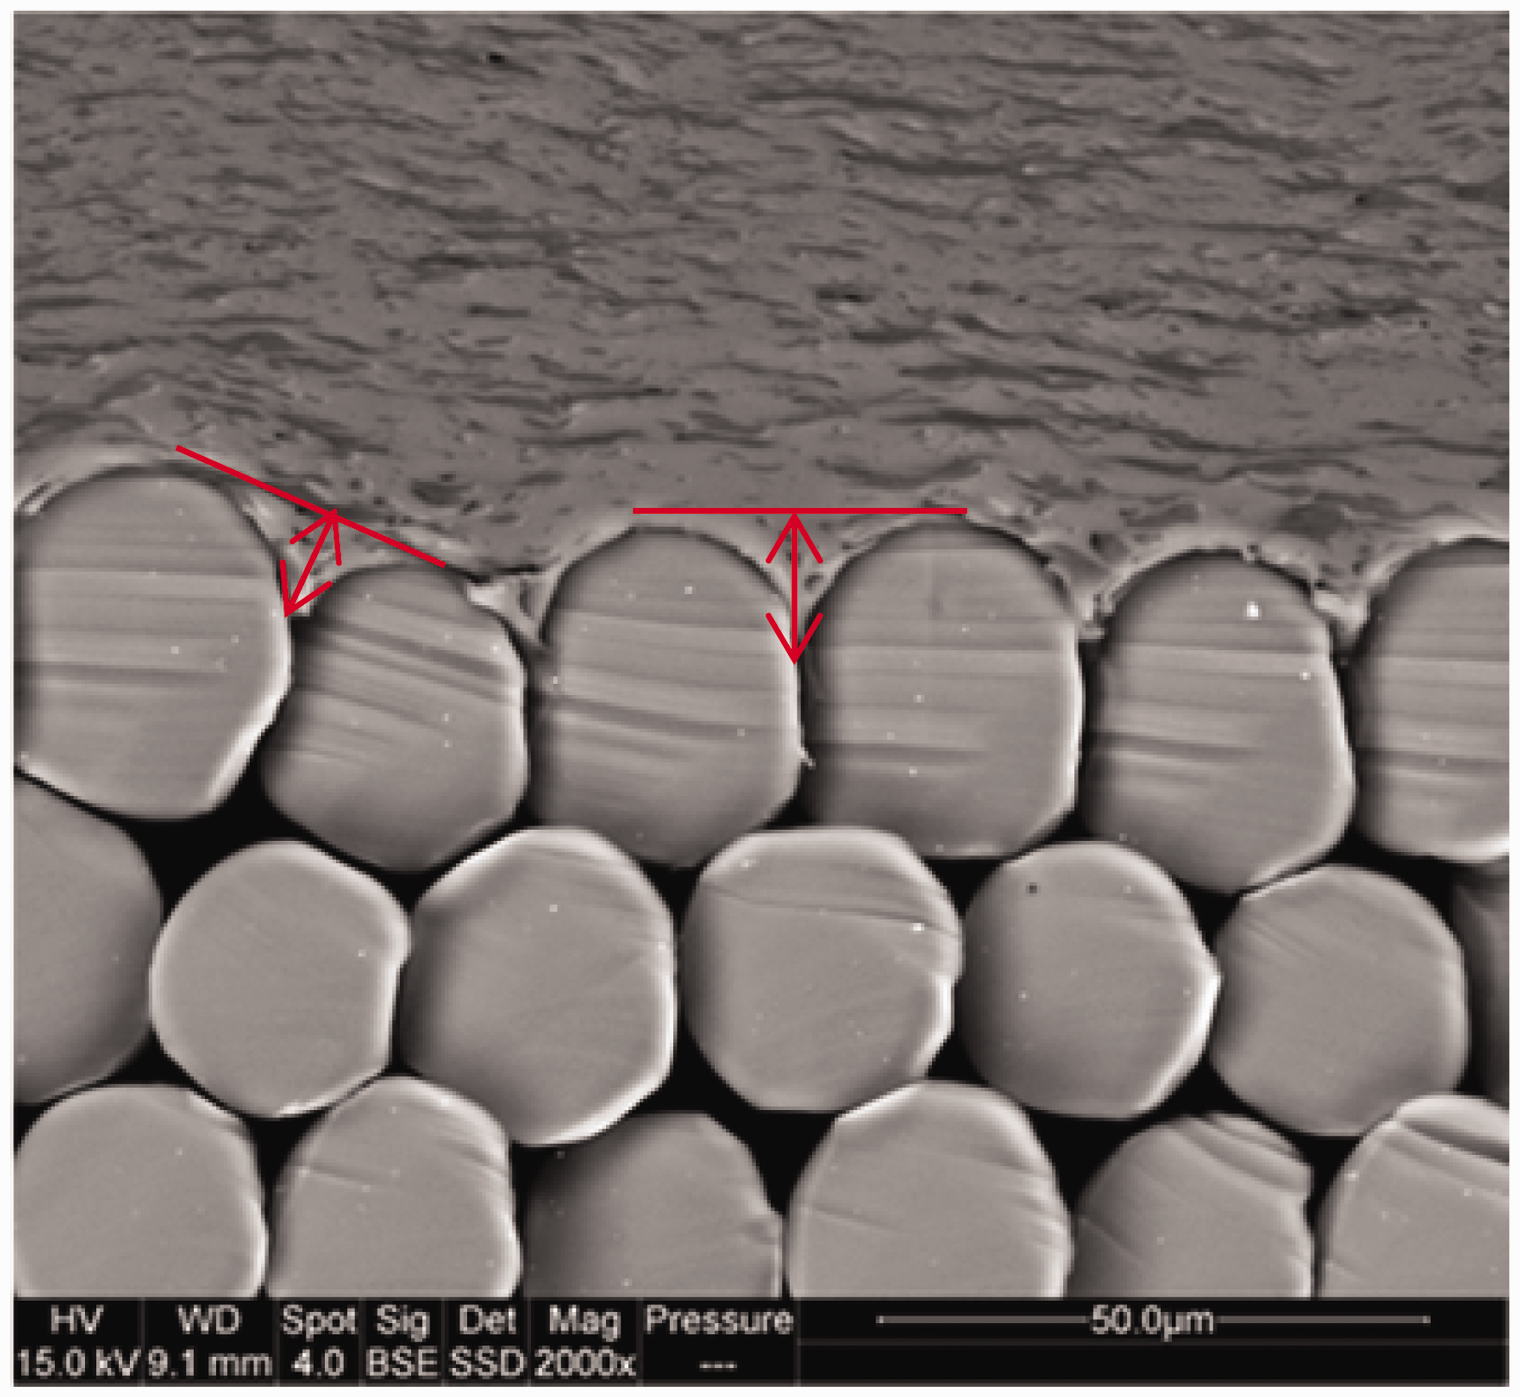
The analysis of the compatibility between TPU and PE was realized by the observation of the presence of PE particles in TPU with the same scanning electron microscope using the detection of backscattered electrons and a magnification of ×1000. The morphology gave information about the compatibility between these two materials.
Analysis of the chemical composition
Infrared measurements at room temperature were performed on a Perkin–Elmer Spectrum One FT-IR (Fourier Transformed Infrared) Spectrometer with 32 scans and a resolution of 2 cm−1 in the absorption mode to determine the chemical composition of the different blends.
Results
Peel strength of TPU/LDPE blends
Peel strength of neat TPU, neat LDPE, and TPU/LDPE blends.

For a same amount of LDPE, an increase of the extrusion temperature seems to increase the peel strength. For example, for a same amount of 19 wt% of LDPE (samples 2 and 3) but different extrusion temperatures (174℃ and 196℃, respectively), the peel strength is doubled (13.02 and 27.43 N/50 mm, respectively). The same trend is observed with samples 1 and 8, while the opposite trend is observed with samples 4 and 7. This can be explained by the very high die temperature employed for sample 7 that may cause a degradation of the blend. This is further correlated to an important decrease of the tensile strength.
Conversely, for a same extrusion temperature, the amount of LDPE seems to have a slight influence on the peel strength. For example, experiments 2 and 9 have been both performed at 174℃ with 19 and 15 wt%, respectively of LDPE but the peel strengths are nearly the same (13.02 and 13 N/50 mm, respectively). This observation is also true for experiments 4 and 6 and experiments 3 and 5.
Tensile strength of TPU/LDPE blends
Tensile strength of neat TPU, neat LDPE, and TPU/LDPE blends.

Analysis of experimental design optimization
CDD design matrix along with the experimental responses.

Model equations.
Results of experiments of the CCD design are used to estimate the model coefficients (without using the check points). The fitted models expressed in coded variables are represented by equations (3) and (4).
Interfacial adhesion (Y1):
Tensile strength (Y2):


Statistical analysis and validation of the models.
Analysis of the responses of the CCD design.

Note: NS: non-significant at the level 95%.
significant at the level 95%; **significant at the level 99%; ***significant at the level 99.9%.
Numerical results for check points.

The measured values were very close to those calculated using the model equations. Indeed, the differences between calculated and measured responses were not statistically significant when using the t-test as shown in Table 12 (equivalent student values in function of both the response). It could be concluded that the second order models were adequate to describe the two response surfaces and could be used as prediction equations in the studied domain.
Interpretation of the response surface models.
Following the validation of the model, the isoresponse curves were drawn for each response by plotting the response variation against both the factors. (Temperature in ℃ vs. PE amount in wt%). If zones of interest boundaries are set (according to the targets: adhesion and tensile strength), these curves are very useful. Below are discussed the results corresponding to the two studied responses:
Interfacial adhesion ( Tensile strength ( Isoresponse curves in the plane: (a) interfacial adhesion (Y1) and (b) tensile strength (Y2).

The examination of all the results obtained by means of the isoresponse curves, allows us to deduce that it is not obvious how one can find experimental conditions that can optimize both the responses simultaneously. The desirability functions allow to reach a compromise which can better satisfy conflicting objectives.
Optimization.
The partial desirabilities of the two responses established based on the study of the behavior of some TPU/LDPE mixtures are shown in Figure 7. A target is fixed at 28 N/50 mm and 25 MPa for the interfacial adhesion and tensile strength responses, respectively. After calculation by the NEMRODW 2015 software, a three-dimensional plot of the global desirability function D can be represented as shown in Figure 8. We can note the rather flat area corresponding to the optimal conditions (D = 0.84).
Individual desirability function of the responses (d1: interfacial adhesion (N/50 mm) and d2: Tensile strength (MPa)). Response surface of the global desirability function.

To choose the best coordinates of the acceptable compromise, we take into account the economic and process aspects of the mixture preparation. Thus, the acceptable compromise is selected at the point: XT = 190℃ and XPE = 29% giving an interfacial adhesion of 28 N/50 mm and a tensile strength which reaches a value of 24 MPa. The choice has been made in the purpose of promoting the flexibility and the fuel resistance properties of the material. The LDPE has poor fuel resistance properties so it is necessary to have a material with a major part of TPU.
Thanks to the experimental design, we have chosen the composition and the extrusion temperature to have the highest value of peel strength but also a high value of tensile strength (>22 MPa). However, the value of tensile strength of the blend for the chosen extrusion temperature was still lower than that of the two components due to the incompatibility of TPU and LDPE [38]. For the next part of our study, we added three other compositions with maleic anhydride which is a compatibiliser for these blends [37]. The LLDPE-g-Ma was not used in the first part of the study because of the important price of it compared to the price of LDPE. The blend 13 was composed of 71 wt% TPU and 29 wt% of LLDPE-g-Ma. We substituted the LDPE by LLDPE-g-Ma to check its influence on the peel strength. The blend 14 was composed of 71 wt% of TPU, 26 wt% of LDPE and 3 wt% of LLDPE-g-Ma. The purpose of this blend was to get a blend similar to the best one determined before with the addition of 3% of Ma to increase the tensile strength. Then the experiment 15 was the neat LLDPE-g-Ma which was a reference like experiments 10, 11, and 12.
Peel strength and tensile strength of experiments 13, 14, and 15.

Analysis of the compatibility TPU/LDPE, TPU/LLDPe-g-Ma, and TPU/LDPE/LLDPE-g-Ma
The analysis of the film surface of the blends shows three different morphologies: nodular, co-continuous, and continuous (Figure 9). For all the LDPE/TPU blends (experiments 1–9), the morphology is nodular (Figure 9(a)) which is a proof of the immiscibility of the LDPE in TPU. Also the smooth interface between the two components indicates that there is a poor interfacial adhesion. A co-continuous morphology was observed for LDPE/LLDPE-g-Ma/TPU (experiment 14) (Figure 9(b)) and almost continuous for LLDPE-g-Ma/TPU blend (experiment 13) (Figure 9(c)) which means that there is a better miscibility between TPU and LLDPE-g-Ma. As said previously in the introduction, the g-Ma is a compatibiliser for LDPE and TPU so these results are in agreement with the literature [36]. On the pictures it is clear that the polymer is oriented in one direction. This is due to the process and especially to the rolls of the calendering unit.
SEM pictures of the film morphologies for: (a) nodular (experiment 5), (b) co-continuous (experiment 14), and (c) continous (experiment 13).
Analysis of the chemical composition
FTIR Spectrum of neat LDPE and neat LLDPE-g-Ma are very similar (Figure 10). The Ma group can be seen around 1700 cm−1 and 1800 cm−1 (Figure 11) as explained on previous research for PP-g-Ma [48, 49] and EPDM [50]. Figure 12 shows the FTIR spectrum of experiments 2 and 6. Although the peel strength is very different (sample 6 displayed a peel strength almost three times higher than sample 2), the two spectrum are similar. No difference was observed on the FTIR spectrums of the blends 1–9. The FTIR spectrums of experiments 6, 13, and 14 are presented in Figures 12 and 13 and the same conclusion can be made. The percentage of Ma in the blends 13 and 14 is so weak that it is almost not visible on the FTIR experiment except for the peak around 1730 cm−1 as it can be seen on the Figure 13. The large peak around 1700 cm−1 is a peak from TPU corresponding to the urethane group (C=O) [51] and cannot been attributed to Ma.
FTIR spectrum of neat LDPE and neat LLDPE-g-Ma. FTIR spectrum (1650–1900 cm−1) of neat LDPE and neat LLDPE-g-Ma. FTIR spectrum of experiments 2, 6, 13, and 14. FTIR spectrum (1650–1900 cm−1) of neat TPU and experiments 6, 13, and 14.


In conclusion to these analyses, no significant difference on the FTIR spectrum has been observed between all the blends. It means that there is no new-bonds creation by mixing TPU and LLDPE or LLDPE-g-Ma so the noted better adhesion is not due to a chemical link between the fabric and the coating.
Analysis of the shear viscosity of the blend
Shear rate viscosities of neat TPU, neat LDPE, neat LLDPE-g-Ma and of the different blends at the corresponding processing temperatures and for a shear rate between 10 and 100 s−1.
At the same die temperature, the viscosity of neat LDPE and neat LLDPE-g-Ma is seven times higher than the viscosity of neat TPU. Although the viscosity of LLDPE-g-Ma is lower than LDPE ones, the blend of LLDPE-g-Ma/LDPE/TPU (experiment 14) has a viscosity twice higher than that of experiment 6 for a same temperature of process. This must be linked with the miscibility of the different materials and it should be compared with the mechanical performance and the morphology of the blends. For the same LDPE/TPU blends, the higher the process temperature is, the lower is the viscosity. For example, for an amount of 22.5 wt% of LDPE and a shear rate of 10 s−1, the viscosity is about 421 Pa.s for a temperature of 190℃ and 47 Pa.s for a temperature of 210℃.
Analysis of the coated textile sections
Penetration depth of the coating for each blend in the fabric.


Sections of the coated textile: (a) experiment 11 and (b) experiment 7.
Discussion
Analysis of the peel strength increase
According to the literature, the coating peel strength on a substrate is directly related to the six adhesion theories mentioned in introduction. However for this case, the theories of the weak boundary layer, electrostatic and diffusion cannot be used to explain the results.
FTIR shows that no new chemical bonds have been created in any of the different blends. Indeed, despite the large difference of peel strength, all the FTIR spectrums are identical. It means that the peel strength difference is not due to the creation of a new chemical bond between the fabric and the coating.
Regarding the theories of wetting and mechanical interlocking, the observations of the coating penetration depth in the fabric give good information. As expected, the lower is the viscosity, the better is the penetration. According to the results, peel strength seemed to increase when coating penetration was higher than 7 µm For example, on sample 7, the penetration is about 14 µm and the peel strength is 21.2 N/50 mm while penetration is only 2 µm for sample 10 and the corresponding peel strength 1.8 N/50 mm. But this trend could not be generalized; in fact sample 6 displayed a 30 N/50 mm peel strength with a penetration depth of only 7 µm. The conclusion is that the coating penetration depth in the fabric, and the related viscosity, has a strong influence on the peel strength but is not the only parameter involved.
Actually, the temperature seems to have a strong impact on the peel strength. The temperature dependence of surface energy has been shown by previous papers [55–57]. This modification of surface energy could lead to a better affinity between the fabric and the coating. As said previously, for a same amount of LDPE an increase of the extrusion temperature leads to an increase of the peel strength until a maximum value for a temperature of 190℃. For higher temperatures (experiments 1, 3, 5, and 7), the peel strength decreases as a consequence of the polymer degradation, which could be observed by the decrease of the tensile strength.
The low significance value obtained with the experimental design means that there is a good correlation between the model and the experiments. The experimental design also allows us to determine the best coating composition and the best extrusion temperature to get the highest possible value of peel strength and a good value of tensile strength.
Maleic anhydride influence analysis
As observed previously, the complete substitution of LDPE by LLDPE-g-Ma has a negative impact on the peel strength, but a substitution of only 3 wt% of LDPE by LLDPE-g-Ma did not degrade this property while it increases its tensile strength. The LLDPE-g-Ma is needed to get good peel strength and also good tensile properties.
Actually, the addition of maleic anhydride in the blend created a modification of the initial nodular morphology to a co-continuous morphology for blends with 3 wt% of Ma and to almost continuous morphology for blends with 29 wt% of Ma. This is in perfect accordance with the literature [36–38]. Other tests like tear strength or measurements of interfacial tensions using the Palierne’s model have been performed on the blends. The results will be published soon in another paper. The interfacial decreases significantly with the addition of maleic anhydride. This is a proof of the compatibilisation of the blend. One interesting point is the difference of viscosity between experiments 6, 13, and 14 which have the same amount of LDPE or LLDPE-g-Ma. At the same temperature, LLDPE-g-Ma has a lower viscosity than LDPE. But also for a same temperature, the viscosity of the blend 14 made of 26 wt% of LDPE and 3 wt% of LLDPE-g-Ma is two times higher than the viscosity of the blend 6 made with 29 wt% of LDPE and blend 13 with 29 wt% of LLDPE-g-Ma. This increase of viscosity means that there is a good compatibility between LDPE and LLDPE-g-Ma. The complete substitution of LDPE by LLDPE-g-Ma seems to not have any impact on the viscosity of the blend at 190℃ as it was found by comparing experiments 6 and 13.
Conclusion
In the present paper, the impact on peel strength of the addition of low density polyethylene and linear low density polyethylene to a TPU sheet calendered on a polyester fabric has been studied. This study has been divided into two parts.
In the first part, the study has shown that the addition of LDPE in the TPU coating has no direct impact on the peel strength while the die temperature has a strong influence. It has been shown that an increase of the extrusion temperature leads to an increase of the peel strength. However, it is important to note that the best peel strength is obtained for an extrusion temperature of 190℃ which is not the highest temperature. This must be due to a degradation of the film at higher temperature as shown by analyzing the tensile strength. The increase of the peel strength can be attributed to several phenomena among which the penetration of the coating in the fabric which creates a mechanical interlocking, and the extrusion temperature which create a different surface energy of the coating resulting in a better affinity with the fabric. This theory will have to be proved for our study in a future work by using a pendant drop experiment as previously realized by Kwok et al. [58].
In a second part, the influence of maleic anhydride as a compatibiliser between TPU and LDPE has been studied with the addition of LLDPE-g-Ma. It has been shown that the substitution of LDPE by LLDPE-g-Ma has a negative impact on the peel strength but hugely increases the tensile strength. However, the substitution of only 3 wt% of LDPE (among 29 wt%) by LLDPE-g-Ma has no impact on the peel strength but still increases the tensile strength.
In future work, this experimental investigation will be continued firstly with a study of the extruded coating sheet surface energy depending on the die temperature. The effect of the temperature on the surface energy will be helpful to confirm the theory proposed in our conclusion to explain the better adhesion. Also, it will be important to focus on the other kind of bonds among polymers and interfaces to explain the better adhesion.
Footnotes
Declaration of Conflicting Interests
The author(s) declared no potential conflicts of interest with respect to the research, authorship, and/or publication of this article.
Funding
The author(s) received no financial support for the research, authorship, and/or publication of this article.