
Abstract
In the current scenario, the paperboard industries are experimenting the reinforcement of their products with various natural fibers. Based on affordability, low weight, biodegradability and recyclability, natural fiber-reinforced composites have attracted the attention of industrial researchers. In the present work, investigations have been carried out to find the suitability of the Passiflora foetida fiber for paper board industry. The physico-mechanical and chemical compositions in the fiber are analyzed with the help of standard methods. The average density and diameter of the fibers were 1.22 g/cm3 and 98.48 ± 5.65 µm, respectively. The fibers showed a tensile strength of 0.32 ± 0.21 MPa, Young’s modulus of 19.42 MPa and strain-to-failure of 2.05 ± 0.18%. The maximum peak of depolymerization is obtained at 361.7℃ in DTG curve. These properties make the Passiflora foetida fibers suitable for replacing the existing fiber in the paperboard composites.
Introduction
More than thousand species of natural fibers are available and a few of them have been investigated as raw material for the reinforcement of composite. Natural fiber-reinforced composites have replaced the existing materials due to their enhanced load-bearing capabilities, increasing life time, eco-friendly qualities as well as their availability. The physical, chemical, mechanical, thermal, and structural properties of natural fibers are varied due to climate conditions, in addition to type of soils and water resources. The physical properties of natural fibers such as density and diameter are the most important properties to make the composites light in weight. The tensile properties such as tensile strength, modulus, and strain-to-failure of natural fibers play an important role in deciding the properties of polymer composites.
Many researchers have identified different natural fibers and carried out the fiber characteristic studies to identify their hypotheses and their reinforcement in polymer–matrix composites. Sathishkumar [1] investigated the newly identified Sansevieria ehrenbergii fibers from snake grass natural plants which were extracted by water retting process, and these plants were cut and immersed in a water tank for three weeks. Then the fibers were stripped from their plants by hand, washed, and dried in the sunlight. After drying, the unwanted matter that might still be clinging to them was removed by washing it with NaOH. Sathishkumar et al. [2] also examined the density of the fiber by pycnometer according to ASTM D578-89. The fibers were dried for 48 h in nonhygroscopic desiccator containing calcium chloride and the obtained fiber density was 0.887 g/cm3. The diameter of this fiber using optical microscope was found to be 25–250 µm. By using a scanning electron microscope (SEM), the diameter was found to be 40–165 µm. The Young’s modulus of this fiber was 7.8 GPa including the machine compliance. Rajeshkumar et al. [3] extracted the Phoenix fiber from Phoenix sp plant. The microfibril angle of 11.67° was measured from the global deformation, and the tensile strength of 348.95 MPa and Young’s modulus of 7.62 GPa were measured using universal testing machine. Abdul Khalil et al. [4] suggested that the chemical compositions of the whole Kenaf stalk (core and bast) were still within the range of the wood chemical composition except for the ash content. Based on the anatomical characteristics and properties of kenaf stems, the potentials of using such material in wood panel, pulp and paper manufacturing were examined. Panthapulakkal et al. [5] examined the various properties of wheat straw fibers, such as chemical constituents, surface morphology, physical, mechanical and thermal properties.
Sathishkumar et al. [6] investigated the tensile properties of randomly oriented Snake grass fiber-reinforced polyester composites and found that they increased with increase in fiber length. The optimum fiber length was found to be 30 mm for tensile and flexural properties, and 50 mm for impact properties. Harish et al. [7] reported the tensile, flexural and impact strength of the 17.86 MPa, 31.08 MPa and 11.49 kJ/m2, respectively for coir-epoxy composites. El-Shekeil et al. [8] analyzed that the thermal stability decreased with increase in fiber loading. However, thermal stability of composites was much better than that of Kenaf fibers.
Alemdar et al. [9] reported the embodiment of rigid cellulosic microfibrilsin a soft hemicellulose and lignin matrix. Cellulose was the fibrillar component of plant cells. Cellulose was found to be a linear polymer of (1→4)-linked β-
Xie et al. [14] found considerable improvements in the interfacial adhesion due to chemical bonding between the organo-functionalities of silanes and the matrices. Rosa Morsyleide et al. [15] reported that alkali treatment reduced the natural fiber diameter and thereby increased the aspect ratio, improving the mechanical characteristics of the composites. Lei et al. [16] concluded that in 30% bagasse or wood fibers, the modulus of the recycled high density polyethylene (RHDPE) increased by about 50%, but the tensile and impact strength obviously decreased. Barari et al. [17] investigated the silane-treated Kraft fiber which showed the mechanical behavior superior to that of the untreated samples. Cheng et al. [18] investigated the elastic moduli of Chicken feather fiber (CFF) with poly lactic acid composites and found that they were significantly higher than that of pure poly lactic acid as a result of CFF reinforcement. The stiffness of the composites increased from 3.6 to 4.2 GPa with an addition of 5 wt.% Chicken feather fiber.
Liu et al. [19] investigated the poor dispersion of higher %Vf of PALF fiber with matrix, and it was not too surprising that the mechanical strength was low due to the stress concentrations in the composite. Martinez-Hernandez et al. [20] reported that the Keratin biofiber-reinforced composites had good thermal stability which was clearly observed in the measured decomposition temperatures.
Obi Reddy et al. [21] suggested that the thermal stability of Napier grass fibers was studied in a three-stage degradation process. The first stage was 50–125℃, where there was elimination of moisture and other volatiles. The second stage was 220–300℃, where there was degradation of hemicellulose and some part of lignin. Finally, the third stage was 300–400℃, where there was degradation of cellulose and lignin of fiber. Manfredi et al. [22] reported higher residual mass in thermogravimetric analysis (TGA) results, which was another indication of char formation.
Brindha et al. [23] concluded that Passiflora foetida fibers (PFFs) with different cellulose, hemicelluloses and lignin content were appropriate for different grades of paper generation. Sharma et al. [24] suggested that the chemical analyses of some common weeds were more suitable for pulp and paper making.
From the above literature survey, the extraction of natural fibers from the plants was done by simple water retting with manual process. The contents of natural fibers, for example, cellulose, hemicelluloses, lignin, wax, and ash were examined. In addition, the physical heterogeneity of the fibers was studied. We concluded that the cellulose fiber-reinforced composites are more suitable for paper board composites.
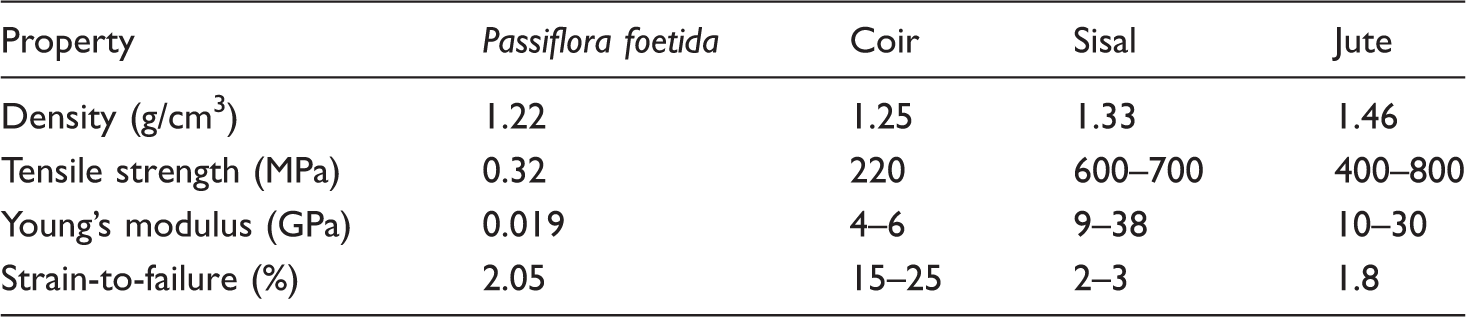
Physical and mechanical properties of PFFs with other natural fibers.
Material and experiments
Natural benefits of Passiflora foetida L. plants
Passiflora foetida L. (Figure 1) plant is a fast-growing perennial vine, found in west USA and extended to the Asian countries like India. It is a fast growing and spreading vine mostly found in riverbeds, dry forest floors, wayside thicket, covering the top of thorny shrubs and also growing near hamlets. These plants are collected from the roadside thickets and riverbed of Erode, Tamil Nadu, India. The botanical nomenclature of the plant is duly identified by using standards and cross-checked with records kept at the Herbarium of Botanical survey of India, Southern circle Coimbatore, TNAU, Tamilnadu, India. Each and every part of the plant is of notable socio-economic value for people. Passiflora foetida plant.
It (stinking passion flower) is a perennial herbaceous evergreen broadleaf, herb of the family Passifloraceae. The whole plant has an unpleasant odour, but the ripe fruit is edible. The decoction from the leaves and fruits of this plant weed is used to treat asthma and hysteria. The leaf paste of Passiflora foetida is applied for headache and to treat skin diseases. The structure of this plant consists of two leaves in dark green color.
Extraction of PFFs
Initially, the leaves, branches, flowers, and roots were removed and the remaining stems were washed thoroughly with distilled water and air dried for 8 h. For each plant, 3–4 cm long stems were collected from the basal portion (Figure 2(a)).The PFFs were extracted from the skin or bast surrounding the stem of the Passiflora foetida L. plant by water retting method (Figure 2(b)). (a) Passiflora foetida stems and (b) Passiflora foetida fibers (PFFs).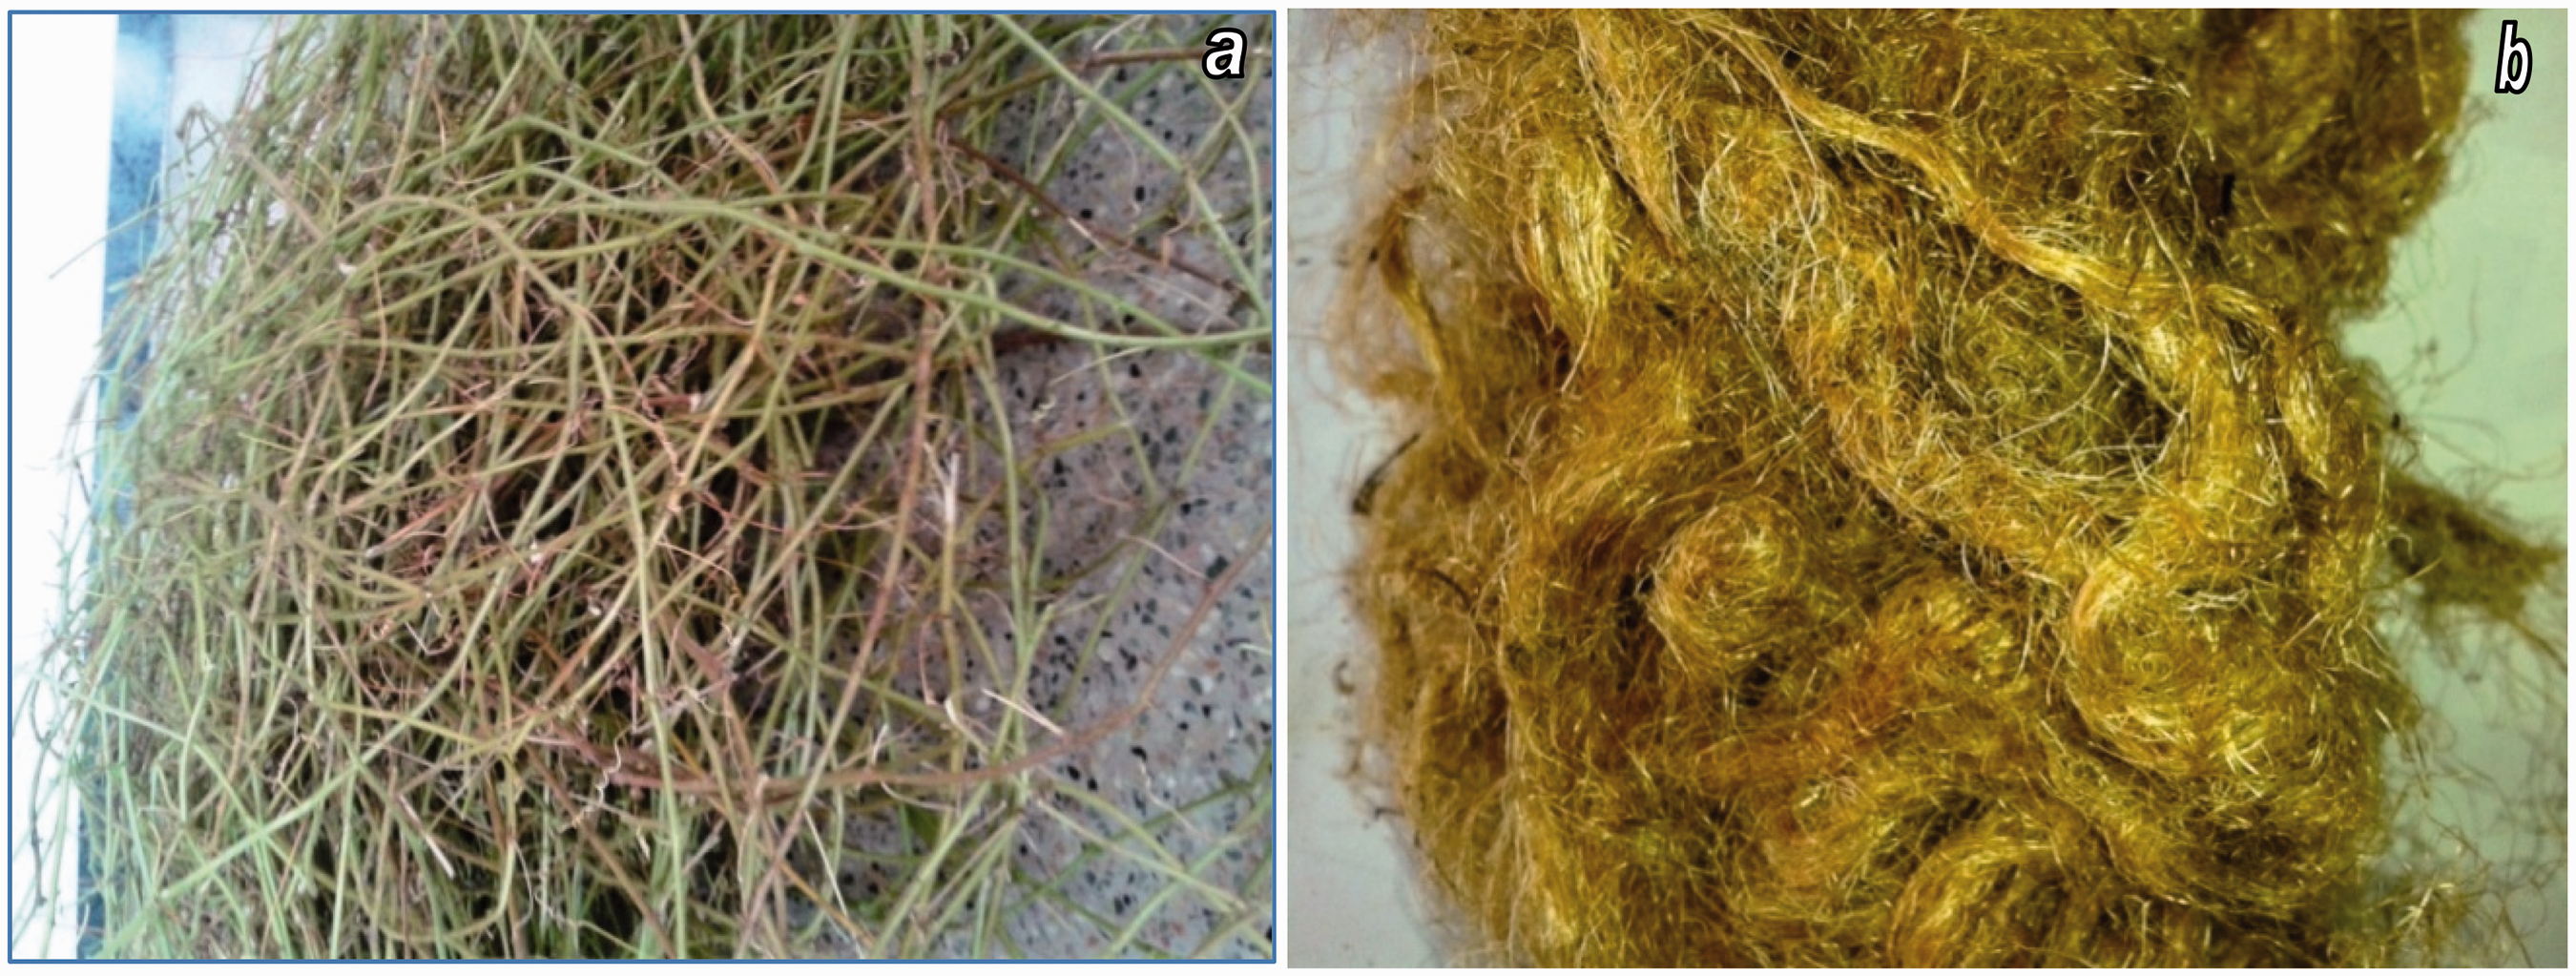
The Passiflora foetida L. stems were cut in definite size and immersed in water for 21 days at room temperature. The wet stems were thoroughly washed with distilled water to remove the plant juice materials except the fibers which were dried at room temperature and also dried at 60℃ in a hot air oven. Reinforcing efficiency of the extracted PFFs depends upon the nature of cellulose presented in it and the chemical formula is C21H20O10. The fiber contains the cellular residues such as lignin and hemicellulose, which cement to form the fibers.
Physical analysis of PFFs
Runkel’s ratio (equation (1)), slenderness ratio, and flexibility coefficient are significant derived indices to determine the suitability of material for paper board making. The Runkel’s ratio is 0.66, slenderness ratio is 120, and flexibility coefficient is 60 of this PFFs. If the Runkel’s ratio is less than 1, slenderness ratio is more than 33, and flexibility ratio is between 60 and 70, such type of fibrous materials are good for paperboard making because fibers are more flexible, easily collapsible and form a paper board with large bonded area [23,24]. It was then examined for the density and diameter of fiber
Density of PFFs
The density of the Passiflora foetida was found using pycnometer as per ASTM D578-89 procedure. The fibers were mixed with methylbenzene (known as Toulon) immersion liquid. Before evaluating the density of the fibers, they were initially impregnated in methyl benzene for 2 h to remove the micro bubbles available in the fibers. Initially, the fibers were dried for 48 h in air tight non-hygroscopic desiccator containing calcium chloride. The density of the Toulon (ρT) is 0.8669 g/cm3 at 20℃. The fibers were cut into length of 10 mm and kept into the pycnometer. The density of Passiflora foetida was calculated [2] by the following relation
Diameter of PFFs
Figure 3 shows the elliptical shape of PFFs which was measured in 50 ?m scale using high vacuum SEM atChemical Engineering Laboratory in Indian Institute of Technology Madras (IITM), Chennai, Tamil Nadu, India. The following specifications were used for scanning the image: Figure 3(a) resolution (700×), condition (vacc 3.0 kV, WD 12.8 mm) and Figure 3(b) resolution (700×), condition (vacc 3.0 kV, WD 12.9 mm). (a) and (b) Cross-sectional dimensions of raw PFFs.
In elliptical structure, the minor cross section diameter varies from 34.8 µm to 58.3 µm and major cross section diameter varies from 98.9 µm to 178 µm. The diameter of PFFs was measured at six points of fiber with equal spacing with the help of Leitz, Metallux 3 digital optical microscope (Calibration: 1 pixel = 0.64 µm), at the physical metallurgical laboratory in the Indian Institute of Technology Madras (IITM), Chennai, Tamil Nadu, India.
The images of the fiber were post-processed through ‘Leica application suite V4’ software to determine the fiber diameters. Figure 4 shows the diameter of PFFs at varying six points. The diameters of the cross sections of fiber varied along the length of the fiber. PFFs’ diameters at six points.
Tensile properties of PFFs
According to the ASTM D3379-75 [25], the tensile test of single PFF was performed using a universal tensile test machine, Model INSTRON 3365, Composite Technology Centre in the Indian Institute of Technology Madras (IITM), Chennai, Tamil Nadu, India. The tensile properties of natural PFFs such as tensile strength, modulus, and strain-to-failure had been determined after measuring the cross-sectional area and diameter of fiber. Twenty samples of single fiber were tested at ambient temperature of 21℃ and humidity of about 65% for 40 mm fiber gage length. In testing, the individual fiber was clamped with a pneumatic gripper, and the cross-head speed of fiber testing was 0.2 mm/min and the strain rate of 0.00008/s was used. A 1 kN static load cell was used to record the load and displacement curve (tensile strain) of each fiber at 40 mm gage length. The average values of the tensile strength, strain, modulus, and strain-to-failure were obtained. The testing compliance of the stacking and holding system was computed by acquiring the load versus displacement conduct of the fiber. The aggregate cross-head removal (δt) during fiber testing was communicated using the following expression
Chemical analysis of PFFs
The PFFs consist of cellulose, hemicelluloses, lignin, pectin, and waxes. The spirally oriented rigid lignocellulose is the main reinforcement material in the natural fiber. Hemicellulose is different from cellulose. The cellulose is held together to form amorphous hemicelluloses. Fibers are cemented together in the plant by a three-dimensional structure of lignin, which is commonly known as plant cell adhesive. Natural fibers with 34% and more of cellulose and less than 30% of lignin are suitable for paperboard production [23,24].
Cellulose content
Cellulose is a natural polymer consisting of Danhydroglucose (C6H11O5) repeating units joined by β-1, 4-glucosidic linkage at positions C1 and C4. The cellulose content of natural PFFs had been evaluated by Kurshner and Hoffer’s method.The bundle of fibers was washed in distilled water for removing the impurities present on the surface of the fibers and dried in an oven at 80℃ for 24 h. The samples of beat fibers (150 mg) were hydrolyzed with a mixture of ethanol and 95% nitric acid. The bundle of fibers was taken out from the mixture and kept in an oven to dry at 60℃ until constant weight reached. The cellulose content representing insoluble fraction of samples was weighed.
Hemicellulose content
Hemicellulose comprises a group of polysaccharides composed of a combination of five and six carbon ring sugars. It differs from cellulose in three aspects, firstly, it contains several sugar units, and secondly, they exhibit a considerable degree of chain branching with pendent side groups which give rise to ion crystalline nature. Third one is degree of polymerisation. Hemicellulose is very hydrophilic, soluble in alkali, and easily hydrolyzed in acids. The hemicellulose content of the natural fiber was determined by calculating the difference between holocellulose and cellulose. The holocellulose of PFFs is determined by placing the fiber in an Erlenmeyer flask. And then 160 ml of distilled water, 0.5 ml of glacial acetic acid and 1.5 g of sodium chloride were added successively. The flask was kept in a water bath and heated at 75℃ for an hour. Then 0.5 ml of glacial acetic acid and 1.5 g of sodium chloride were repeatedly added twice an hour. The flask was cooled in an ice bath below 10℃. The holocellulose was filtered and washed with acetone, ethanol and water, respectively. Afterwards, it was dried at 105℃ before weighing.
Lignin content
Lignin is a complex hydrocarbon polymer with both aliphatic and aromatic constituents and it is totally insoluble in most of solvents and cannot be broken down into monomeric units. Lignin is considered to be a thermoplastic polymer having a glass transition temperature around 90℃ and melting temperature around 170℃. It is totally amorphous and hydrophobic in nature. It is not hydrolyzed by acids, but soluble in hot alkali, readily oxidized and easily condensable with phenol. The lignin content of the PFFs is determined based on Klason lignin of APPITA P11s-78 method [2]. The samples of crushed fibers (300 mg) were hydrolyzed with 72% of sulfuric acid and stirred frequently for 1 h at a controlled temperature of 30℃. The treated sample was mixed with a solvent solution of methylene chloride (CH2Cl2) and kept in an autoclave at 125℃ for 1 h and dried. Then, the sample was cooled in a desiccator and the lignin was filtered through insoluble representation until a constant weight was obtained. The percentage of lignin content was computed using the following expression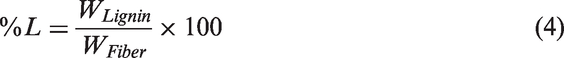
Wax content
Wax makes up the last part of fibers and it consist of different types of alcohols. The wax content of the natural fiber was determined by Conrad method with Soxhlet extraction. The samples of PFFs were preconditioned before wax extraction process. The bundle of fibers was washed in distilled water to remove the impurities on the surface of fibers and dried in an oven at 80℃ for 24 h. Then, the chopped fiber of 10 mm was held in ethanol solution for 6 h. The wet fiber was transferred to a separator funnel. After that, chloroform was added for wax extraction from substances such as waxes, fats, resins, photo sterols, and nonvolatile hydrocarbons, low-molecular weight carbohydrates, salts, and other water-soluble substances. Then purified water was added for separating the chloroform and other substances, after which the chloroform was evaporated by heating the funnel and leaving the wax. The percentage of wax content was measured by the following expression
Ash content
The ash content of the PFFs was determined by a colorimeter. The initial weight of the raw fibers was kept inside the colorimeter at 250℃. The residue of heating fiber was obtained as ash. The percentage of ash content was measured by following expression
Moisture content
The moisture content of the natural PFFs was determined by normal weight loss method. The raw fibers (20 g) were kept in an oven to dry at 100℃ until the constant weight was obtained. The time taken for constant weight was 4 h and 30 min. The percentage of moisture content in the fibers was measured by following expression
Fourier transform infrared spectroscopy analysis
Fourier transform infrared spectroscopy (FTIR) spectroscopy of PFFs was recorded using an Agilent Technologies Spectrum Cary 630 Series FTIR spectrometer, Chemical laboratory, Indian Institute of Technology Madras (IITM), Chennai, Tamil Nadu, India. The spectrum was identified with a scanning rate of 2 cm/s. The total wave number region was recorded from 500 to 4000 cm−1 at room temperature of 31℃ and relative humidity of 65%. The bundle of fibers was chopped approximately 2–3 mm and ground into powder form using mortar and pounder. The powder form PFFs were mixed with KBr matrix and pelletized using pressurization [26]. The pellet was used to record the spectra.
X-ray diffraction analysis
The wide angle X-ray diffraction (XRD) spectrum of the PFFs was recorded with a PAN analytical X-ray diffractometer X’pertPRO, Metallurgical Laboratory, Indian Institute of Technology Madras (IITM), Chennai, Tamil Nadu, India. An X-ray tube produces monochromatic Cu Kα radiation. It has a rotating anode generator with angle powder goniometer. It was operated at 45 kV and 30 mA. The reflection mode at a scan speed of 0.02℃/min with high intensity spectrum of PFFs was identified and it estimated the crystallinity index [27]. All samples were scanned at an angle of 10–90°. A wide angle X-ray diffraction spectrum was collected by apparatus to detect the crystalline structure of cellulose in PFFs. The full width at half maximum (FWHM) of the diffraction peaks of raw PFF samples was analyzed. The crystallinity index, which was adapted only to crystalline cellulose I, was calculated by using the expression
Thermogravimetric analysis
Thermograms of the PFFs were recorded from NETZSCH STA 449F3, Center of Excellence for Industrial and Home Textiles Laboratory, PSG Institute of Technology and Applied Research, Coimbatore. The testing condition was dry nitrogen atmosphere at a heating rate of 10℃/min in the temperature range of 30–500℃ [28,29] followed by an isothermal setup for 50 min. About 10 mg of the sample PFFs was heated at the flow rate of nitrogen gas of 30 ml/min. During this test, the weight loss in terms of temperature was recorded in graphs. This test was obtained at controlled atmospheric condition with 65% RH and 30℃.
Scanning electron microscope
The PFFs in surface structures and impurities were obtained from 50 µm to 500 nm SEM image of S 4800 SEM machine, Chemical Engineering Laboratory, Indian Institute of Technology Madras (IITM), Tamil Nadu, India. The following specifications were used for scanning the image: magnifications (7000×, 700×, 8000×, and 30,000×), conditions (vacc 3.0 kV, WD 12.8 and 7.3 mm).The surface structure and impurities were observed by these images.
Results and discussions
Microstructural analysis of Passiflora foetida L. stem
Figure 5(a) shows the transverse section of Passiflora foetida stem which has a big hollow in the centre, and soft and hard tissues, and fibers. The plant shows micro holes which are present in the cross section. The PFFs present itself with voids on the microfibrils’ bundles. The fibers were observed in the green surface of the plant. The fiber was available in the skin (green layer) of Passiflora foetida L. plant which was classified as skin fiber. The fiber richness was 17.7% and fiber yield was around 7.6%. The structural fibers provide strength and stiffness for the stem of the plant. The fibers present in the skin of the plant stem were having higher diameter and found to be more in number. The fibers were nearer to the green layer of the plant (Figure 5(b)). Small diameter fibers were found to be less in number. SEM image of Passiflora foetida stem: (a) transverse section (40×, 100×), (b) longitudinal section (40×, 100×).
In the EDS of Passiflora foetida L. stem presented in Figure 6, it was observed that the major constituents were found to be carbon (58.88%), boron (35.59%), oxygen (3.38%), potassium (0.08%), calcium (0.94%), chloride (0.19%), molybdenum (0.16%), silicon (0.03%), and magnesium (0.04%). Carbon was the major constituent of all natural fibers which makes a good bonding with polymer. EDS of Passiflora foetida stem.
Physical and microstructural analysis of PFFs
Diameter and cross-sectional area of PFFs from optical microscope.

Diameter and cross-sectional area of PFFs from SEM analysis.
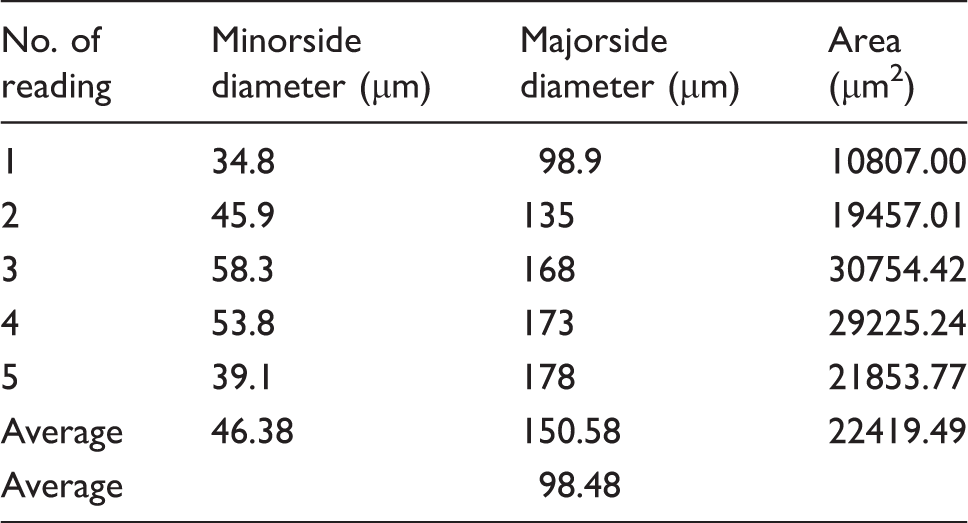
Therefore, measuring the diameter of fiber at the various points resulted in more accurate reading and the average diameter is around 98.48 µm. This average diameter is taken as the actual diameter of PFFs and the area of PFFs is 22419.49 µm2.
Figure 7 shows the cross section of PFFs. The micro structural fibers are very significant because they never break during the extraction process. SEM of PFFs: (a) transverse section of fiber, (b) longitudinal section of fiber, (c) fiber with surface impurities and (d) fiber with impurities and holes.
Figure 7(a) shows that the transverse cross section of the semi-elongated fiber is usually found layer by layer in the stem. Figure 7(b) shows that the longitudinal section contains more number of the surface cracks and caves on the fiber surface which will make the better adhesion between the polymer and fiber. Figure 7(c) shows that more impurities adhered to the surface of the PFFs even though after complete removal of the plant material from the PFFs. Figure 7(d) shows the fiber cellulose with impurities and uneven holes in the fiber. These impurities and uneven holes have to be removed by treating the fiber with various chemicals which will make fibers to have better adhesion with various polymer matrixes. From the EDS data of raw PFFs (Figure 8), it is found that there is 52.65% and 47.35% of oxygen. A high percentage was found in carbon and we found that absorption with matrix is the best in polymer composites. EDS of raw PFFs.
Analysis of chemical composition of fiber

The constituents are varied due to growth rate, age, microstructure, climate conditions, type of soil and type of extraction of natural fiber. Hence, these are having minimum and maximum constituent values. The PFFs contain 40% cellulose, which is greater than Bamboo, Coconut leaf sheath, Piassava and Rice husk natural fiber. Its cellulose content is equal to Coir fiber. The lignin content of PFFs is less than Banana, Coir, Bamboo and coniferous. The wax content of natural fiber involves the interfacial bond between the fiber and matrix during composite fabrication. The wax content of PFFs is less than Sisal, Abaca and Flax, which will make better bonding strength with matrix. Therefore, to improve the interfacial bonding between the PFFs with resin, chemical treatment is to be done in order to remove the wax and moisture.
Tensile properties of PFFs
The tensile properties of PFFs are calculated for five samples, where it shows a linear increase in tensile stress with increasing tensile strain within the elastic limit. In failure state, the lower stress value was found in high strain of specimens. Figure 9(a) shows that all the samples display a linear Hookean range at low strain followed by a softening region, which is at approximately 10%. It is worth nothing that the maximum tensile stress is 0.44 MPa and the minimum tensile stress is 0.15 MPa. Hence, most of the samples are above 0.32 MPa. The variation in the results depends upon the instrument precision, strain rate, gripper type and machine compliance. Also the results depend upon the growth rate, age of fiber, climate conditions, type of soil, type of extraction, and microstructure of fibers. Also in PFFs, the properties are varied due to high percentage of moisture, flaws and porosity of fiber. These mechanical properties quickly result in failure stage with less tensile load, which reduces the load-carrying capacity of the fiber. This shows the lowest tensile strength and Young’s modulus. But it shows a good ductile property of fiber. This property is more suitable for paperboard production. (a) Tensile stress versus tensile strain of the PFFs (b) Tensile load–deflection curves.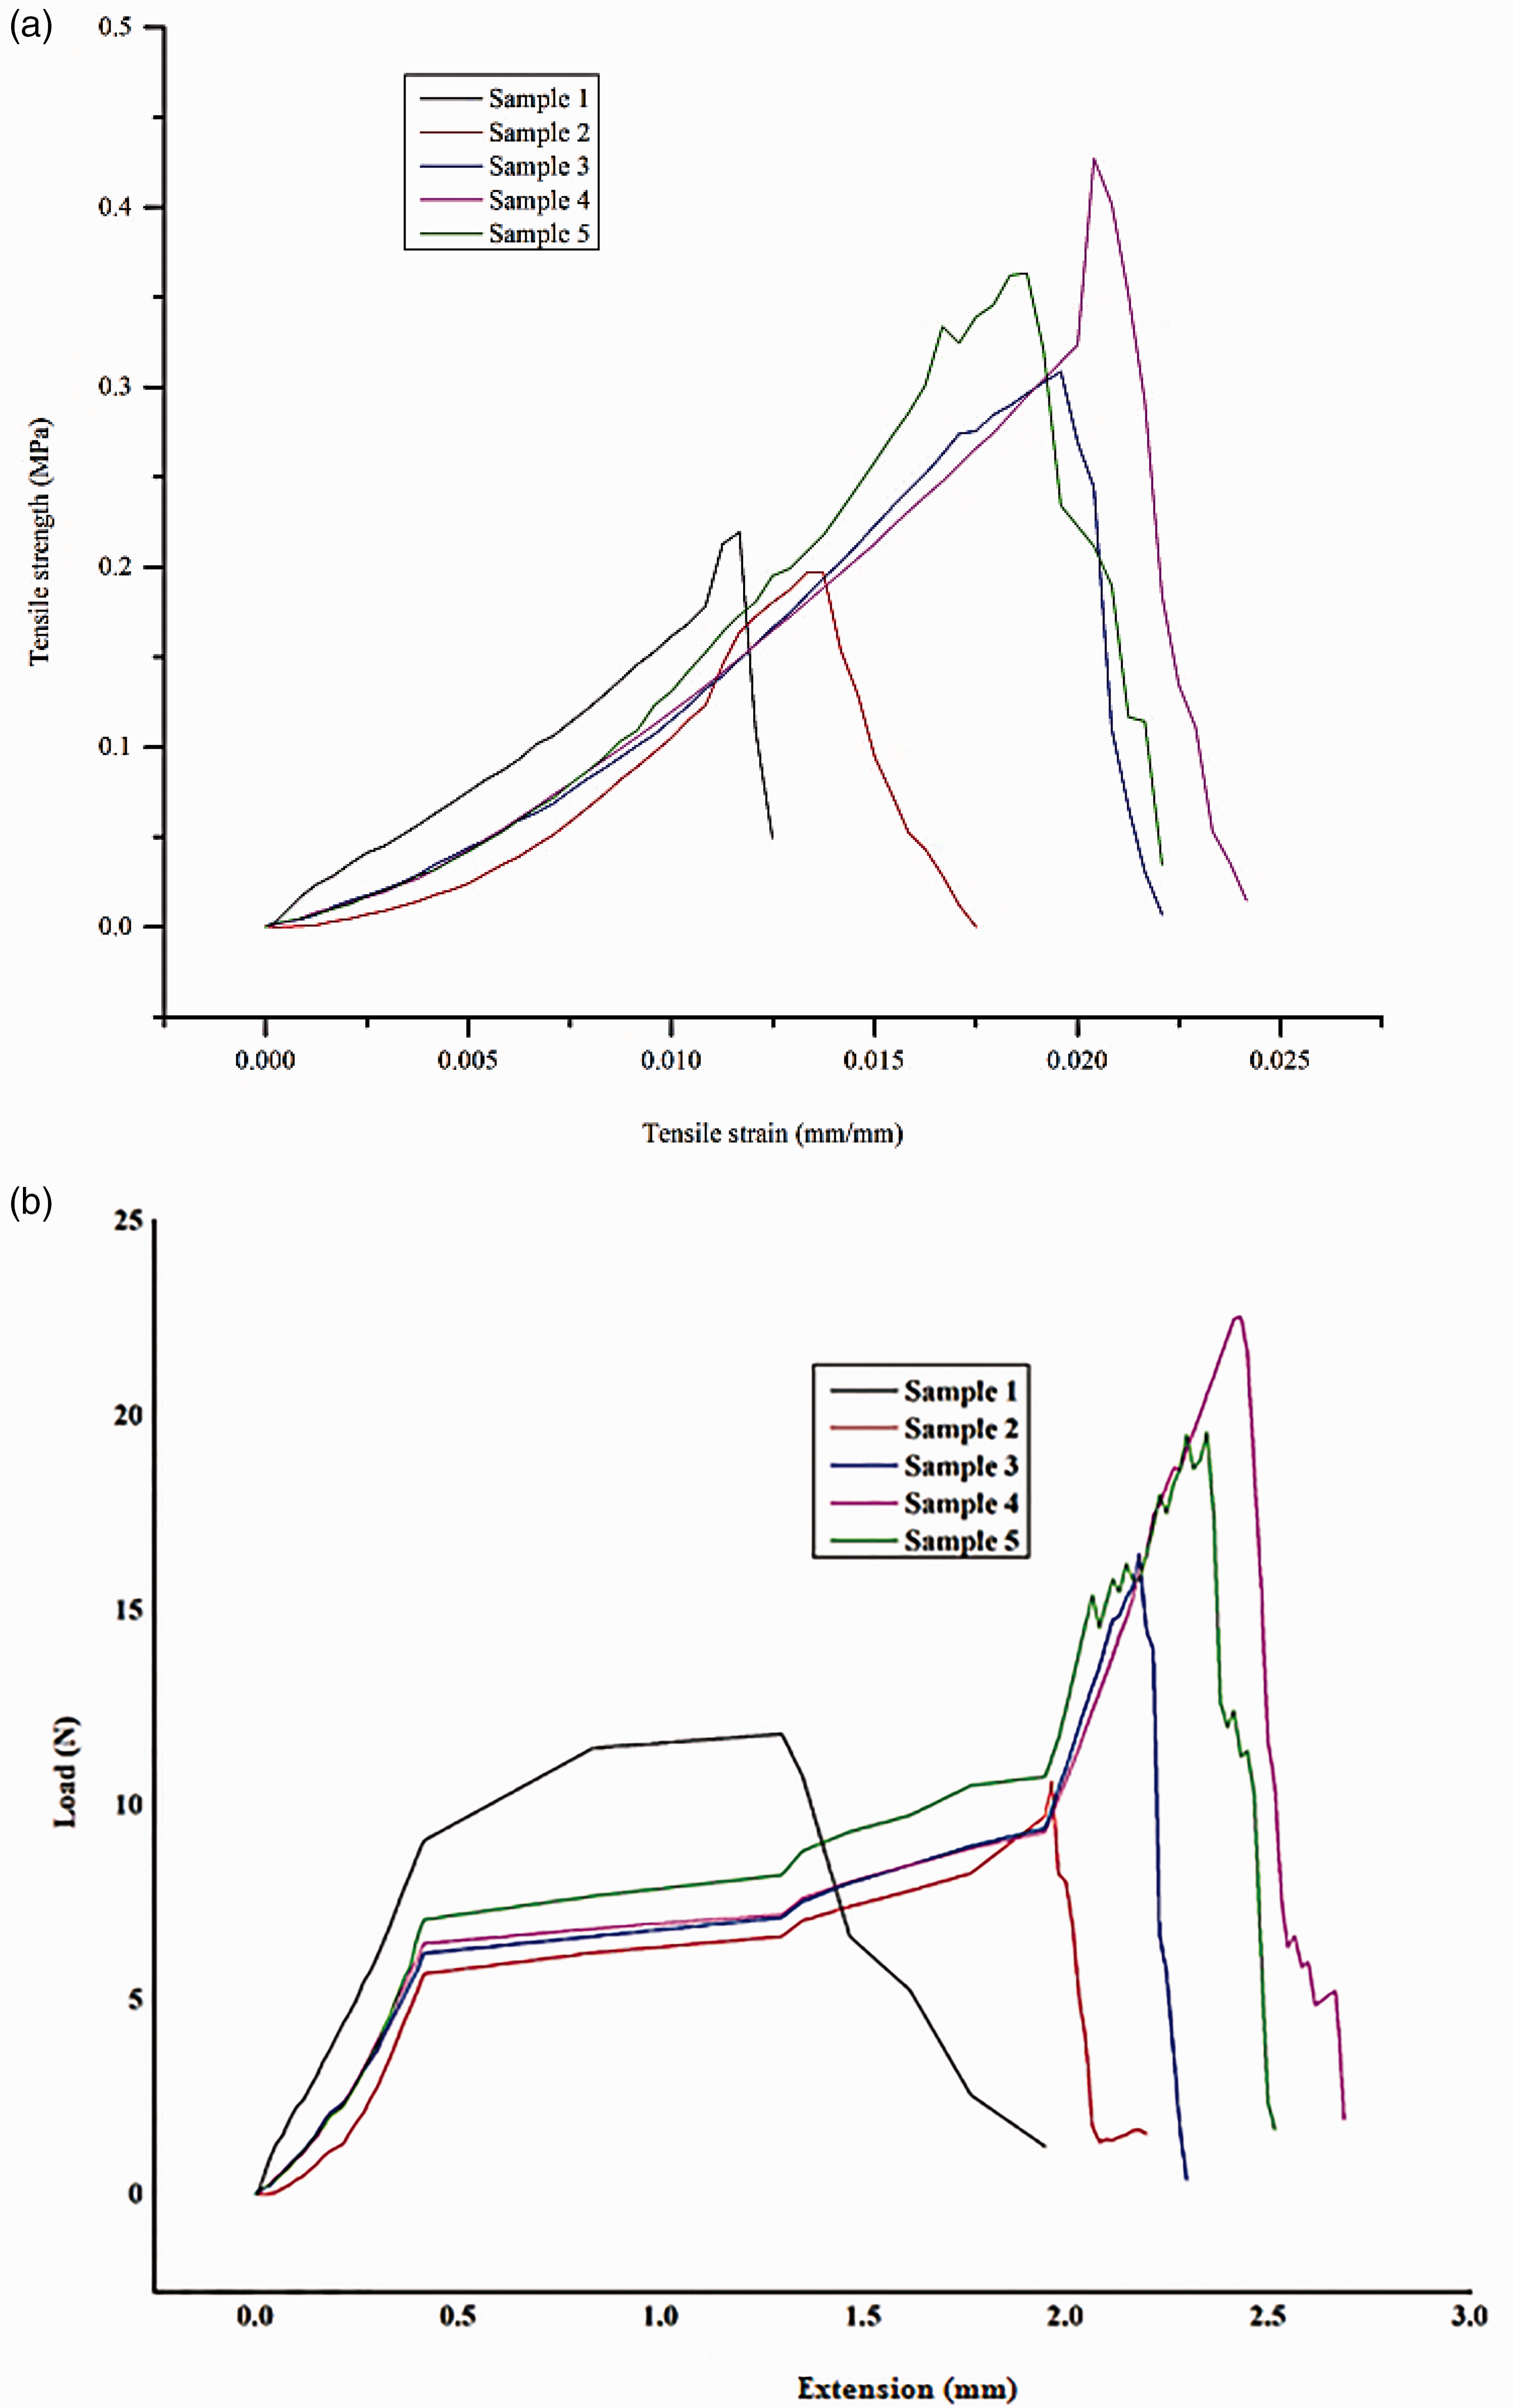
Figure 9(b) shows the load- extension curves of the PFFswith the upper and lower values of the loads and extensions for specimens under tensile test. These load- extension values are obtained at tensile fracture, beyond which the slope of curves decreases gradually to zero. According to this criterion, it is aclear failure of plasticized PFFs with great contribution of deformation. In this case, tensile properties of these unidirectional fibers are factually controlled by their resistance to failure. Based upon the reservations of the PFFs, there is an initial region of high stiffness, which decreases in the next region due to the fragmentation of constituents in the fiber.
The PFFs exhibited variability in tensile strength which is quite characteristic of all natural fibers. These variations are due to distribution of defects within the fiber and fiber surface. The quite difference in microstructure associated with the different samples of PFFs could also result in some variability.
Fourier transform infrared spectroscopy
Figure 10 reflects the FTIR spectrum of raw PFFs with wave number in the range of 500–4500 cm−1. The FTIR spectrum of PFFs is very similar to soy hulls and wheat straw fibers [9]. The broad absorption band has various chemical groups presented in the fiber such as cellulose, hemicelluloses, and lignin. The multifarious principal components are alkenes, phenolic hydroxyl group, aromatic groups, B-glucosi linkages, and the functional groups of ester, ketone and alcohol with oxygen groups. A broad absorption band corresponds to the characteristic of alkane stretching vibration and hydrogen bond of the hydroxyl groups present between 3018.49 and 3703.07 cm−1. The stretching vibrations of the phenolic hydroxyl group in the lignin components and hydroxyl group of the glucopyranose unit in the cellulose are observed in the band between 3018.49 and 2912.74 cm−1. The C=C extending vibration of the alpha keto carboxylic acid in lignin or ester bunch in hemicelluloses peaks is seen with a little ingestion at 1738.11 cm−1. The C≡C stretching vibration of the acetyl group in lignin and hemicellulose is seen from 1534.16 to 1656.91 cm−1. The stretching vibration peaks from 1240.5 to 1534.16 cm−1 show the C–H bonding vibration and C–O group of aromatic ring of hemicellulose. The sharp peak of 1166.65 cm-1 shows the CH2 symmetric bond which proves the presence of hemicellulose xylene, wax and impurities of fiber. The characteristic bands of C–H stretching vibration from CH and CH3 in cellulose and hemicelluloses components are shown in sharp peak of 791.05 cm−1 (aromatic), 1109.25 cm−1(alkenes) and 1142.3 cm−1. Also, the stretching vibration of 1191.4 cm−1 presents fluoride and 652.25–701.34 cm−1 presents chloride in cellulose and hemicellulose [31–33]. FTIR spectrum for raw PFFs.
X-ray diffraction
The XRD spectrum of raw PFFs from 0 to 90° is shown in Figure 11. The spectrum shows two diffraction peaks which are diverse in nature for fiber indicating that the PFF shows semi-crystalline structure [34]. Two peaks are found between 0deg and 30deg, the first peak at 2θ = 16.09° and the second peak at 2θ = 22.62°. The monoclinic structure is attributed to cellulose. The non-cellulose materials such as hemicellulose and lignin of fiber are found in the broadening of peak at 2θ = 16.09°. The cellulose in the fiber is found in the next peak at 2θ = 22.62°. The crystalline planes (1 0 1) and (0 0 2) are attributed by the first two peaks [2] and the crystallinity index (CI) of cellulose is measured by using equation (8). The degree of crystallinity for raw samples is 51.92%. The crystallinity index is less than 55%, and the reinforcement composites have lower mechanical properties than pure resin. Hence the properties of reinforcedpolymer composites are to be increased by treating of raw fibers. XRD analysis of raw PFFs.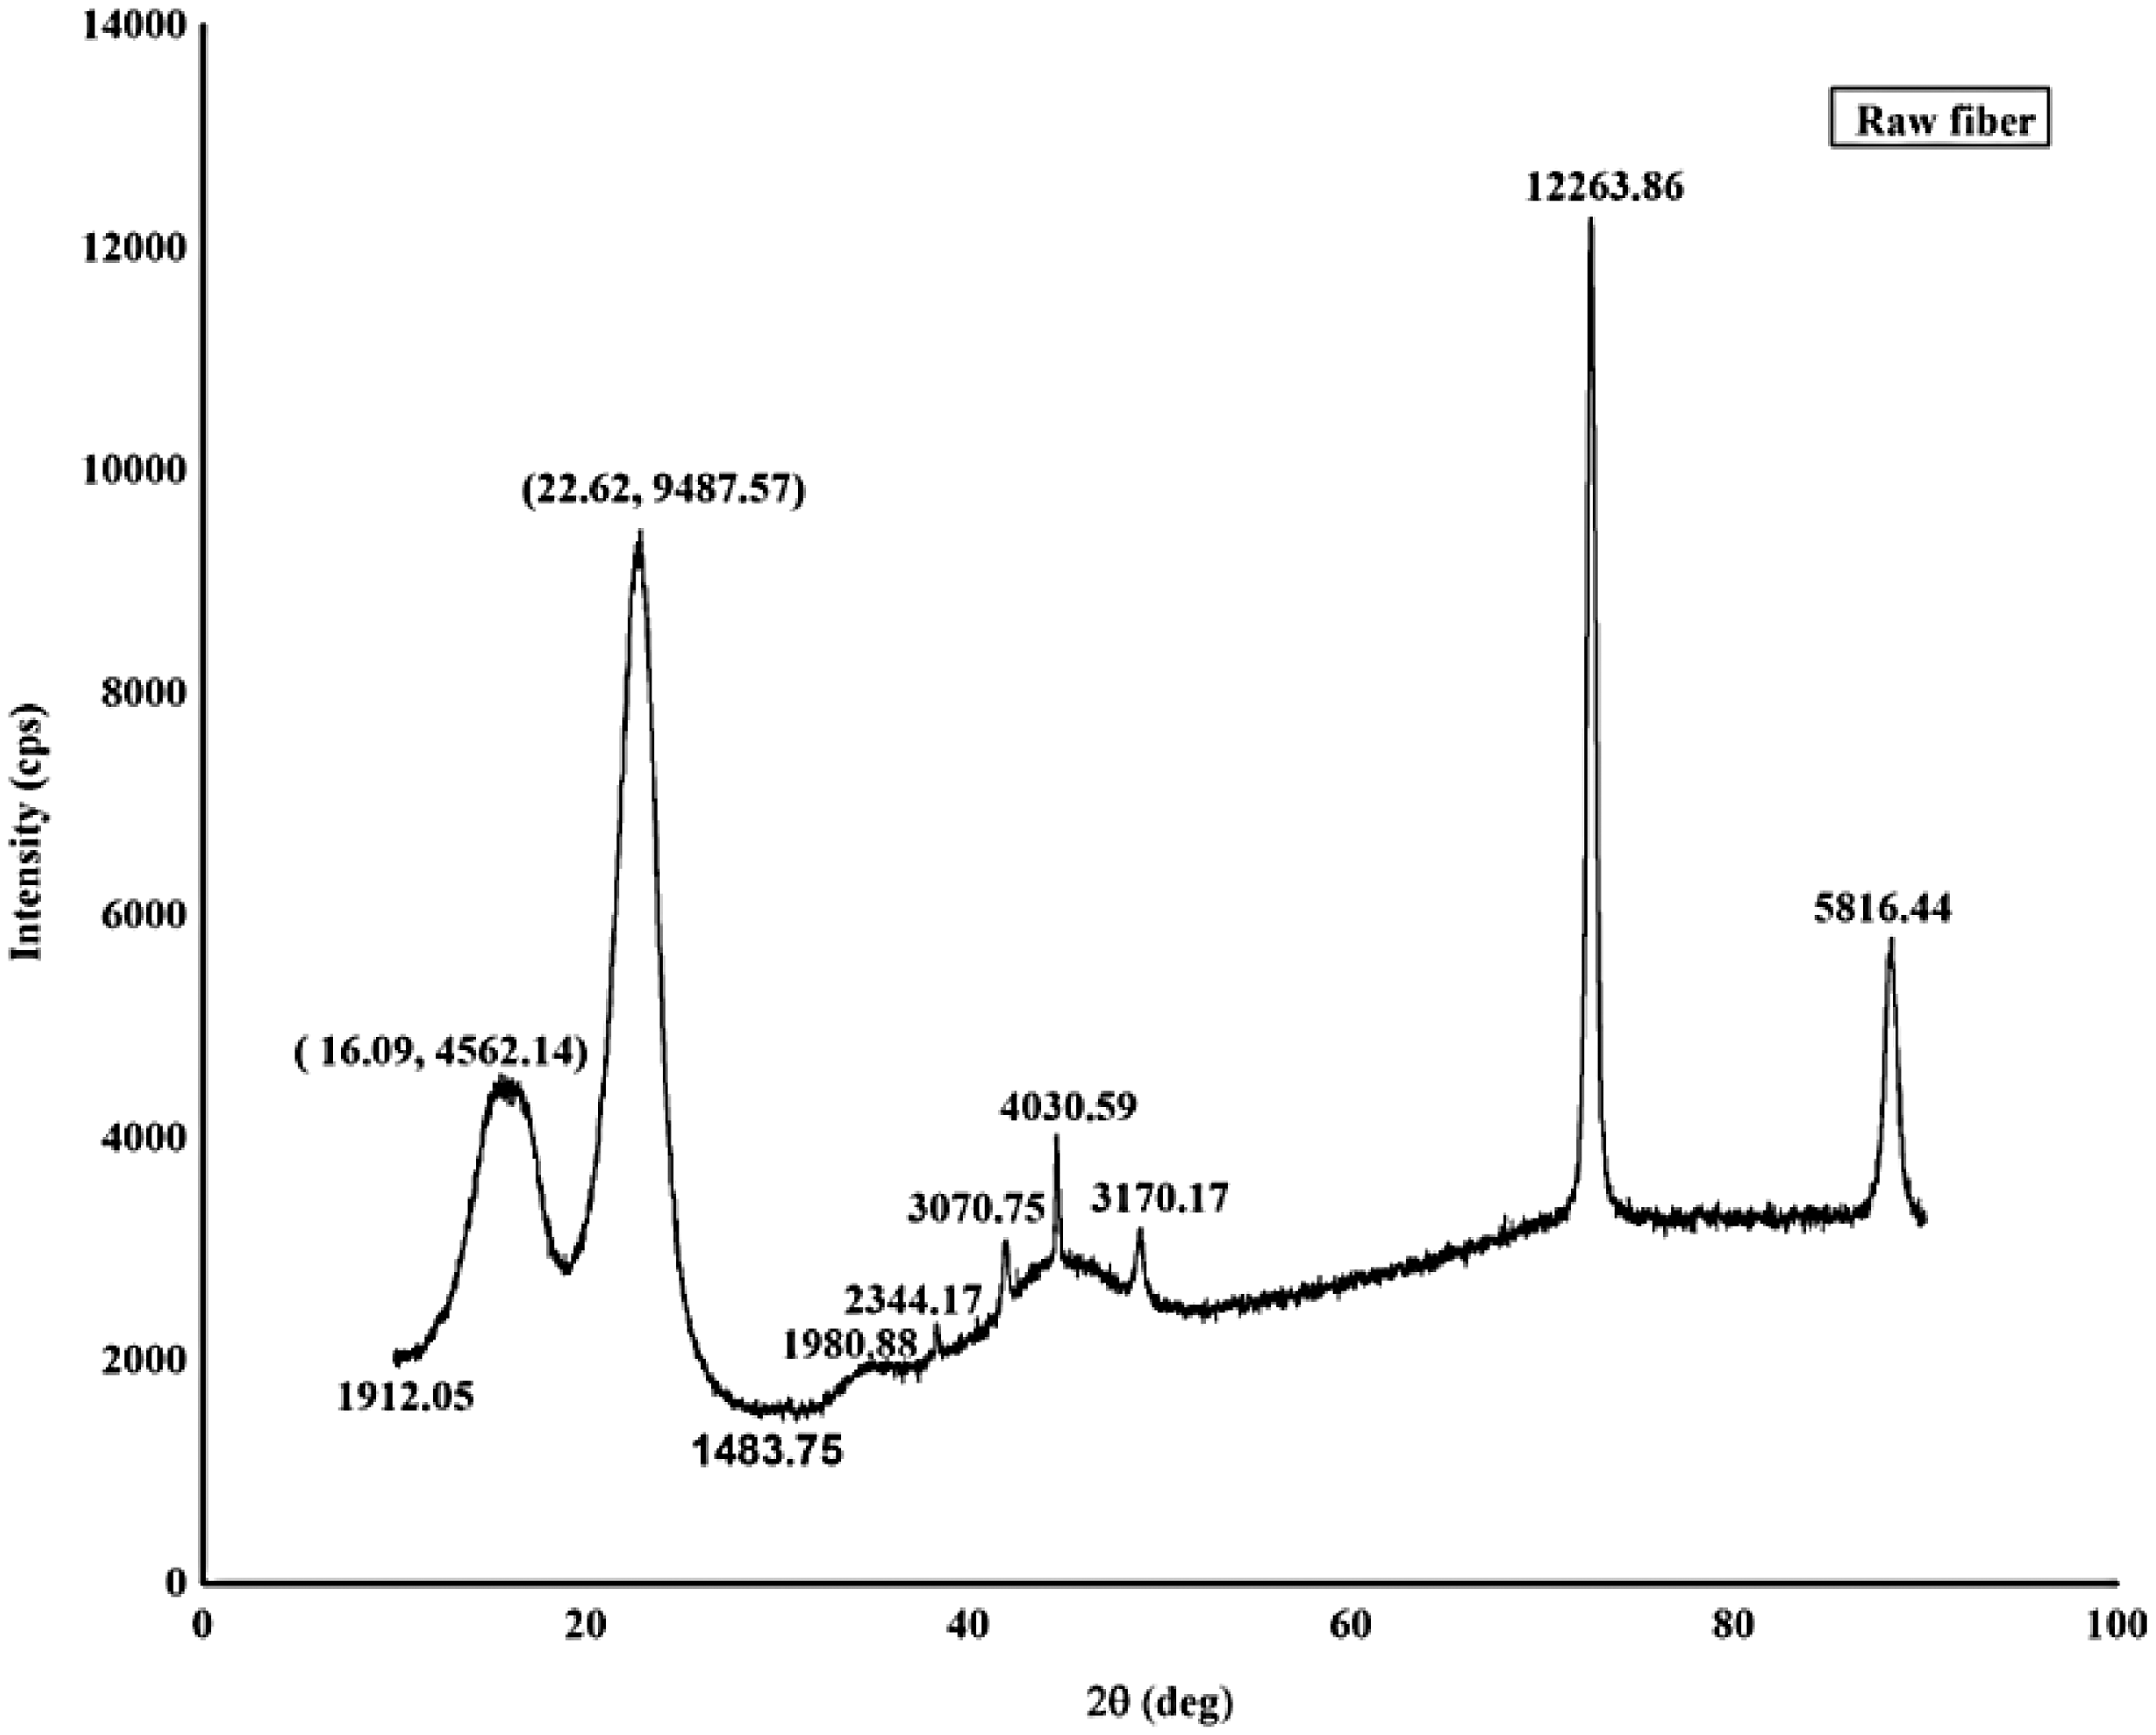
TGA/DTG
Figure 12 shows the thermogravimetric analysis (TGA)/differential thermogravimetric analysis (DTG) curves of the raw PFFs with temperature range from 30 to 500℃. In the TGA curve, the dehydration and degradation of lignin is associated with weight change from 50 to 273℃. The higher weight change is recorded from 275 to 375℃ in which the cellulose is decomposed [35,36]. At 375℃, almost all cellulose content is decomposed in the PFFs. The weight change is associated with the loss of water in the fiber alone with fiber compositions which proved the thermal stability PFFs. TGA/DTG curves of raw PFFs.
In DTG curve, the evaporation of water shows the initial peak at 80℃. The water evaporation starts at 10℃ to end at 80℃. The thermal depolymerization of hemicellulose and the cleavage of the glycosidic linkage of cellulose are observed in the second peak at 361.7℃ of the PFFs. The calefactive rate and thermal depolymerization of wax and other substance of the PFFs are decomposed at 373.6℃ which is in the third peak. The depolymerization of cellulose temperature of PFFs is lower than coconut and okra fiber. In raw PFFs, the molecules are not closely packed, which leads to more penetration of water in the fibers. The higher value of moisture content in PFFs requires pre-drying and chemically treating them before making composites.
Conclusions
The microstructure, physico-mechanical and chemical properties of PFFs are studied. It is found that the density is 1.22 g/cm3 and the cross-sectional diameter is 98.48 µm of fiber which have been used to develop the light weight materials in paperboard industry. Hence, the fiber cellulose of 40%, lignin of24%, Runkel's ratio of 0.66, slenderness ratio of 120, and flexibility ratio of 60 are satisfied the paperboard composite properties. The tensile strength is 0.32 MPa, Young’s modulus is 0.019 GPa, strain-to-failure is 2.05% and moisture absorption is 7.1% and it has good ductility which is a suitable alternate for paper board materials. Also the fiber has good bonding due to 64% of carbon in chemical compositions. The crystallinity index is less than 55%, and it is recommended that the chemical treatment of raw fiber is to be carried out to remove the juice materials in the fiber for composite preparations. Usually, PFFs have good thermal stability, which can be utilized as a part of the paperboard industry. Taking into account the above finding, the PFFs demonstrate that it is an optional fiber-material in paperboard industry.
Footnotes
Acknowledgements
The Indian Institute of Technology Madras(IITM), Chennai, and Indian Institute of Science (IISc), Bangalore gave full support for taking all results. The technical staff members of mechanical engineering, Kongu Engineering College is gratefully acknowledged for facilitating the experimental works.
Declaration of Conflicting Interests
The author(s) declared no potential conflicts of interest with respect to the research, authorship, and/or publication of this article.
Funding
The author(s) received no financial support for the research, authorship, and/or publication of this article.