
Abstract
A complementary study to our previous research to aid in the optimisation of the thermal bonding machine components for improved thermally bonded nonwoven production is introduced. The effect of the conveyer belt on the nonwoven’s thermo-fluid flow behaviour is investigated in detail. A hybrid model consisting of the discrete conveyer belt geometry and the continuum porous nonwoven web, is presented. A comparison study to predict the thermal and flow field differences in 3D and 2D formulations of the same problem is elucidated. The thermal and fluid flow distributions within the conveyer belt, nonwoven and the air domain are predicted with particular focus on the conveyer belt component of the Low & BONAR pilot machine. It has been shown that the developed 2D model provides accurate results for the conveyer belt temperatures. The three-dimensional flow effects on the thermal boundary have been predicted. The 3D approach is shown to be superior in depicting the wake behind the central conveyer belt thread. The amplitude of the wavy geometry is determined to be introducing different degrees of geometric three dimensionalities in the wake. The industrial partner Low & BONAR (former COLBOND bv.) provided technical data for the nonwoven and machine components.
Introduction
Nonwovens are a sheet, web, or batt of natural or man-made fibres or filaments, excluding paper, that have not been converted into yarns, but are bonded to each other by any of several means [1]. The European Disposables & Nonwovens Association (EDANA) [2] defines a nonwoven as a sheet of fibres, continuous filaments, or chopped yarns of any nature or origin that have been formed into a web by any means and bonded together for instance by friction, and/or cohesion and/or adhesion, excluding paper or products, which are woven, knitted, tufted, stitch bonded incorporating binding yarns or filaments or felted by wet milling, whether or not additionally needled with the exception of weaving or knitting. Unlike traditional fabrics that are made by mechanically interlacing (weaving) or interlooping (knitting) yarns composed of fibres or filaments, nonwoven fabrics are made by mechanically, chemically, or thermally interlocking layers or networks of fibres and filaments. For a comprehensive list of different definitions, the reader may refer to Hutten [3].
The current study utilises the dry formed nonwoven product COLBACK®, which has been manufactured for primary and high-grade backing; for example, in flooring or the automobile industry as support medium for cabin air filters or carpets. Nonwovens have been a research topic since a long time, as they have a wide application area. Various topics within the nonwoven technology have been investigated related to the process, used materials and the simulation so far. Sample studies such as that from Randall [4], comprising process investigations have been followed by many studies, considering many aspects of the technology [5], including the machinery as well [6]. Modelling-aided research has been conducted since many years. Studies such as that from Ramaswamy and Holm [7] or Mao and Russel [8] have been followed by Tafreshi and Pourdeyhimi [9]. The increasing interest and contribution of various research groups led to a better understanding and improvement of the technology.
For the present study, thermal bonding of the thermoplastic fibres through convective hot air is considered. The nonwovens are produced from continuous filament fibres. Bi-component fibres made of sheath-core fibres are utilised. In the cross section of these fibres, nylon (polyamide) 6 (PA6) polymer forms an outer sheath phase surrounding the inner core made of polyester (PET) of the second phase. Each phase has its own material properties and contributes to an overall property of the fibre. A schematic of a typical thermal bonding machine is illustrated in Figure 1.
Schematic view of a typical thermal bonding machine and components [10].
The thermal bonding machine has a perforated drum, a wire-mesh drum cover and a wire-mesh conveyor belt. The drum and drum cover are enclosed by a hood with an open section to enable the conveyor belt and the transported web to enter and exit the thermal bonding machine. The nonwoven web at room temperature is transported by the conveyor belt, enters the machine and is then subjected to hot air flow, which is at or just above the melting temperature of the sheath fibre material. The web is located such that it is wrapped around the drum, sandwiched between the conveyor belt and the drum cover. First, it travels through the machine’s heating zone facilitating the bonding of the contacting fibres, and then it is briefly subjected to a cool air flow before leaving the machine [11,12].
The hot air flows through the conveyer belt, then through the porous nonwoven web and ultimately through the drum cover and the drum (Figure 1). All components enter the heating zone at different but much lower temperatures than the air temperature, thus absorbing a significant amount of energy from the air [11]. For details about the flow and heat transfer inside the machine together with experimental measurements, see Peksen et al. [11]. In our previous studies, the thermal bonding process has been investigated using computational fluid dynamics (CFD) [10–15]. Process parameters have been systematically assessed and suggestions for improved production rates and energy efficiency could be given [12]. In another study, the melting-solidification process of the thermoplastic fibres during the nonwoven web formation has been elucidated. The fibres’ geometrical information, describing the material behaviour was mathematically described and implemented within the CFD code FLUENT®. Properties such as fibre thickness, sheath fraction, melting temperature, latent heat of fusion and the liquid fraction were successfully investigated. These enabled the assessment of different fibre types and to determine the properties of the fabric. The thermal gradients inside the web were determined [13]. Our recent studies investigated the effect of component material type on the thermal bonding production rate and the energy efficiency of the system components. It was shown that the conveyer belt has the highest effect on the energy efficiency in COLBACK® manufacturing. The process control and attempt to optimise the current through-air bonding process showed the importance of the conveyer belt [12]. From an industrial point of view, a thorough understanding of the conveyer belt, however, requires a discrete modelling of its geometry to exploit its effect on the porous nonwoven’s thermo-fluid flow behaviour. The current study has been performed to understand and improve the knowledge of utilising the conveyer belt within the thermal bonding process. The pilot machine facilities at Low & BONAR (former COLBOND bv), the Netherlands are used for the study. A hybrid model approach composing of discrete belt and continuum phase porous web is presented. A conjugate heat transfer approach has been introduced to investigate the thermal behaviour of the solid conveyer belt component. A comparison study to predict the differences in 3D and 2D formulations is presented. The results will shed light on the suitability of the models for future studies. The thermal and fluid flow distributions within the conveyer belt, nonwoven and the air domain are predicted with particular focus on the conveyer belt component of the BONAR pilot machine.
Methodology
To perform the CFD analyses, the solid geometry of the conveyer belt has been generated for a thorough understanding of the architecture and its effect on the nonwoven’s thermo-fluid flow behaviour. The conveyer belt has a very complex woven structure. The accurately presented solid model will not only provide an understanding of the influence of geometry, but will give an insight into interpreting the results. It will shed light on the limits of employing a 2D analysis compared to a detailed 3D design analysis. The woven structure is characterised by the orthogonal interlacing of two sets of metal threads, running perpendicular to the direction of the other. Each steel thread is being undulated when it passes over or under another thread, i.e. a plain weave structure. This issue makes it difficult to model the metal threads rather than assuming straight cylinders.
Hybrid modelling approach
A hybrid model, composing of discrete and continuum phases is presented. A comparison study to predict the differences in 3D and 2D formulations is elucidated. The belt structure used is not a layered laminate; therefore, the interleaving effect that is caused due to multiple stacked layers is neglected. In this case, the thickness t of the belt is
3D micro modelling of the hybrid system using CFD
The CFD modelling of the 3D belt structure is a challenging problem. The computational domain requires an air domain, surrounding the 3D conveyer belt and the porous nonwoven layer. This is performed to enable the air to flow through the nonwoven web and to render possible heat transfer between the air and the solid belt structure, which leads to another challenge, i.e. to perform a conjugate heat transfer analysis using the CFD technique. Figure 2 illustrates the computational domain and its dimensions. The wire radius is 0.6 mm and the nonwoven thickness 0.909 mm, respectively, which has been measured [11].
Computational domain consisting of air, belt and web.
Figure 3 shows the computational grid and the applied boundary conditions. The computational grid consists of 777,683 elements built of tetrahedral elements. The mesh is finer resolved at the belt compared to the nonwoven fabric each having 299,912 and 7291 elements, respectively.
Computational grid and applied boundary conditions.
Utilised boundary conditions for the calculations.

Inlet boundary conditions are given as velocity and air temperature that are typically used during the thermal bonding process. The mathematical formulation of the governing equations has been given in detail in our previous studies and will not be repeated here [11,13,15]. The material properties are taken from Peksen et al. [11,12]. Outflow condition is given at the outlet; the front–rear and sides are specified as symmetry boundaries.
The analysis is performed using the computational facilities at Loughborough University, UK utilising the ANSYS FLUENT® Software. A grid interface utility is used to couple the two different domains, i.e. the air and the belt region on the interface with congruent mesh on the interface. This prevents to define additional boundary conditions on the air–belt interface. No-slip conditions are applied on the walls of the belt. Because the continuum web is considered to be as porous media, i.e. a special type of fluid domain, an additional interface is not needed to be defined. The computation is first performed within the intersection between the interface zones that comprise the boundary. The resulting intersection produces an interior zone where two interface zones overlap. The grid interface is exactly in the same shape as the belt threads. The analysis used is a time-dependent transient one. The coupled heat transfer calculations for convection and conduction are carried out for a duration of 22.4 s. This is the time the system is subject to heat within the heating zone of the machine that is required for the conveyer belt to transport the web with a speed of 5 m/min through the heating zone [11,12]. Radiation is negligible when compared to convection and conduction, hence it is not used for the simulations. The coupled grid interface is defined between the air interface and walls of the solid belt, and another coupled grid interface is defined between the air interface and walls of the tips of the solid belt. The 2D model considers the cross section of the physical domain, considering the air, conveyer belt and again the porous nonwoven COLBACK®. The two models are compared in terms of thermo-fluid flow.
Results and discussion
To compare and test the limits of a 2D analysis to a 3D approach, a transient conjugate heat transfer analysis using the CFD technique is performed for both approaches. The thermal and flow field behaviour of the hybrid systems is investigated to understand the differences between the two approaches.
Temperature field analysis
Figure 4 shows the contour plot results of the temperature distribution of the surface plane obtained from the 3D analysis, and the 2D approach with the same constituent’s dimensions including web, air domain, belt thread diameter, and their location in the computational domain. The rectangular area adjacent to the circular belt threads represents the boundary of the porous web domain. Boundary conditions consisting of inlet, outlet and symmetry together with the same specified values are valid for both 3D and 2D analyses. The inlet and outlet distances are set to the exact positions as used in the 3D analysis. Hence, the comparison uses the same legend to perform an exact comparison. The performed analyses are plotted such that the first plot presents the 3D analysis and the second one shows the result for the 2D analysis. The nonwoven web is under the conveyer belt threads highlighted in black boundaries.
Temperature contour plot results of the 3D vs. 2D comparison; t = 2−4 s.
The contour plots of the temperature profile reveal that in the first 4 s, the belt temperature reaches around 85℃ for both cases. The separation point of the flow shows similar behaviour; however, it is forced a little rear in the 3D case.
According Saha et al. [16], the separation points in flow over circular cylinders vary with the Reynolds number and hence they should be fixed in the present case at the leading front edges. But it is visible that three-dimensional disturbances affect the flow distribution in the 3D analysis due to the flow interaction in z-direction causing the thermal boundary showing no more a symmetric shedding on the sides and varies in the wake (the region of recirculating flow immediately behind the obstacle) behind the thread.
This is due to the different wavelength and the amplitude of the belt thread waviness, introducing different degrees of geometric three-dimensionality in the wake as it was detailed in the work of Darekar et al. [17]. The effect of an introduced stagnation point on a wavy cylindrical structure causes different wake topologies for cylinders with the waviness at both the leading and trailing edge surfaces, which is the case in the presented 3D analysis. In contrast to the standard flow past a non-wavy cylinder as it is simulated in the 2D case, there are now two additional length scales, i.e. the wave length and the amplitude, introduced.
The reason for the 3D disturbance effect is the pressure drop caused due to the wavy structure. In the experimental investigations of Lam et al. [18], this effect was shown. The wavy structure leads to drag reduction and the fluctuating lift coefficients of the wavy cylinders result in lower values than that of the straight circular cylinders.
As can be seen from the contour plots, the temperature of the porous web is affected from this waviness the most at the region in the wake behind the central thread. Due to the cut of the plane, the central thread is on a position not as close to the web as the threads on either side. Therefore, the air in the 3D case is able to flow at this region, as well as from the z-direction. This is not the case in the 2D configuration.
Figure 5 illustrates the contour plot results of the temperature distribution of the surface plane obtained from the 3D and 2D analyses for the instants 8 s and 12 s. Results show that the belt temperatures are in good agreement with each other. The nonwoven temperatures are similar except for the region of the wake of the central cylinder. The convective effect decreases as the temperature in the computational domain approaches the air temperature.
Temperature contour plot comparison; t = 8 s–12 s for 3D and 2D.
The gradient at the wake region under the central belt thread retains as visible in the previous time intervals, suggesting that the flow behaviour at this region remains steady and is not affected over time. The air domain in the 3D case shows a uniform distribution at these time instants, surrounding the wake regions, whereas in the 2D case a clear boundary is visible. This can be attributed to the flow in z-direction, which is in all plots visible and streams in higher temperature values among the belt threads. This leads to the fact that the wake region becomes warmer but narrower compared to the 2D case.
Figure 6 depicts the temperature distribution at 16 s and 22.4 s. The results for both the 3D and 2D analyses show a temperature value of approximately 174–175℃ for the belt threads. The gradients within the nonwoven are visible where temperatures vary from 192℃ at regions inside the wake of the belt up to the air temperatures. This is also visible at time frame 22.4 s, where the temperature of the belt reaches approximately 195℃.
Temperature contour plot results at t = 16 s−22.4 s for 3D and 2D.
From the predicted temperature values, it is obvious that the 2D analysis reflects the same results for the thermal behaviour of the belt as the 3D analysis, which suggests the use of the 2D case for future parametric studies.
The affects observed on the temperature distribution within the porous web in the 3D case show that the 2D analysis could not capture the thermal effect of air in the wake behind the central belt thread. The differences in the flow behaviour are not crucial compared to the belt temperature values, which is the main focus of the current study rather than the airflow through the system.
Therefore, the compared 3D and 2D results for the belt support the use of the 2D model which as well saves significant computational time and effort compared to the 3D model. Moreover, the difficulties in generating and analysing the 3D structure are additional issues suggesting the use of the 2D model instead of the 3D one. Another reason to attempt the 2D approach is that no thermal gradients are visible within the steel belt thread, which is an expected issue due to the thermal conductivity order differences of the air and the steel material.
Flow field analysis
Figure 7 illustrates the velocity field comparison of the 3D and 2D analyses. The rectangular domain below the circular belt threads represents the boundary of the porous web domain. The contours of the plot are set to be continuous to visually better capture the fluctuations in the 3D analysis.
Velocity contour plots of the 3D vs. 2D comparison.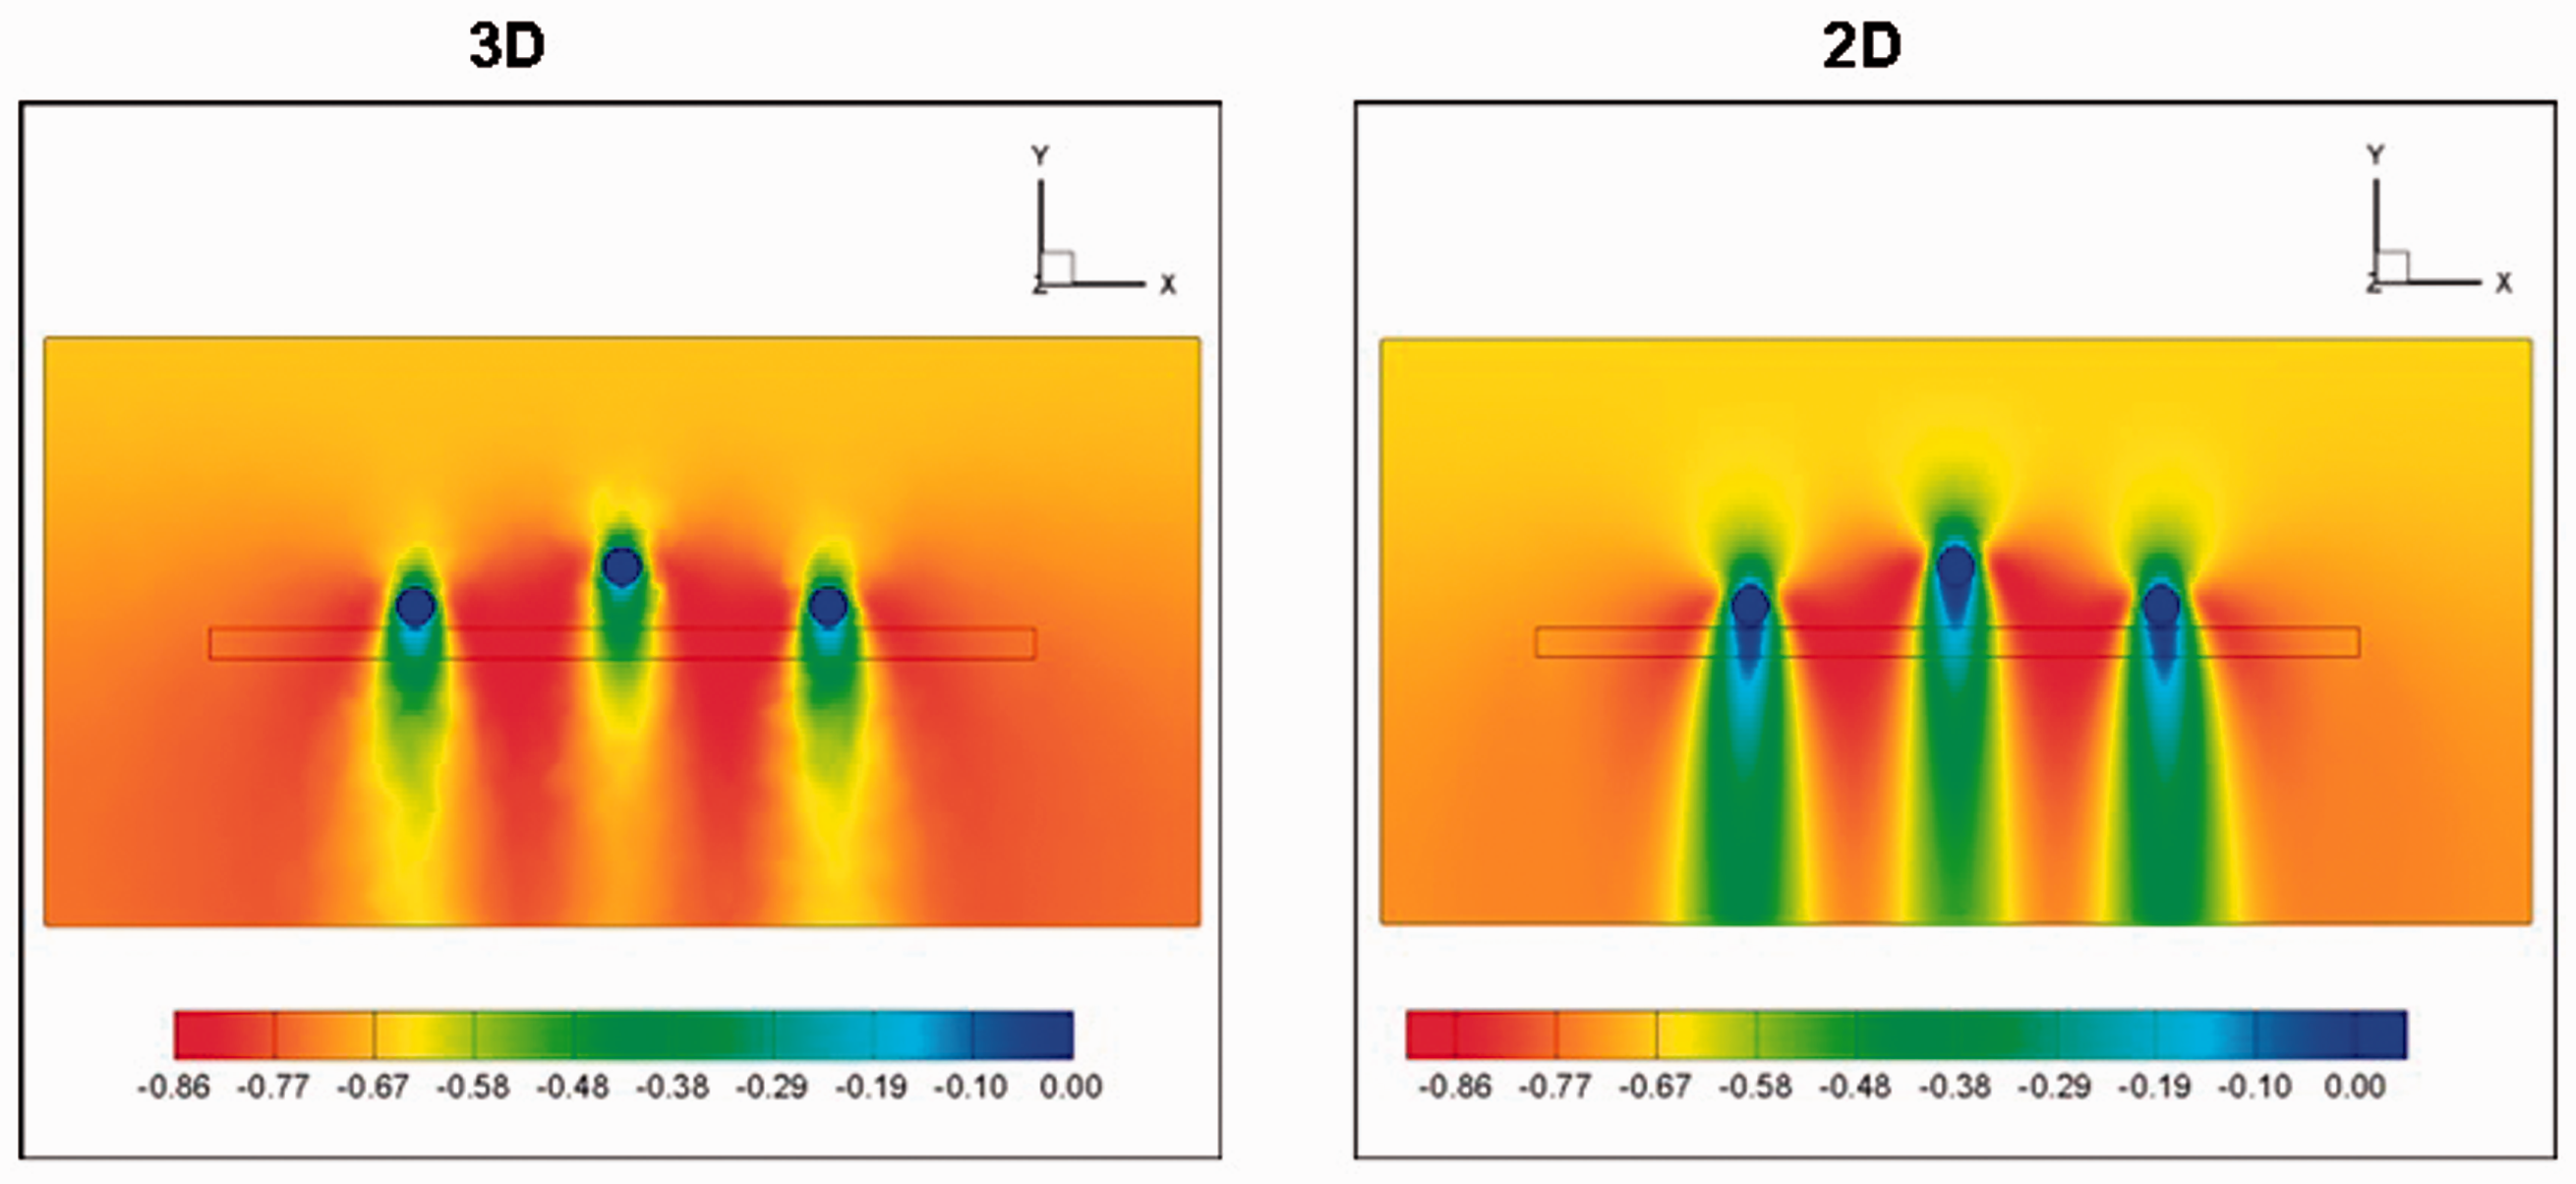
The results show that in the 3D case, the air velocity reaches higher values in the wake behind the threads and just a small region behind the closest point to the surface of the threads approaches to values very close to zero, whereas in the 2D case this region is longer and is clearly visible extending till into the porous web. This shows clearly the contribution of the air flow in z-direction, disturbing the flow and is supporting the idea that the pressure gradient is lower in the 3D case compared to the 2D case where the effect of the waviness of the structure is not considered. Therefore, the air velocity values are higher and increase rapidly after passing the body, i.e. the belt hindering the flow.
This also explains the higher temperatures in the wake behind the central thread. The zoomed-in views comparing the velocity contour plots in Figure 8 depicts this case in detail illustrating clearly that the region in the wake behind the belt threads reaches higher velocity values than it is predicted for the 2D case.
Velocity distribution of the hybrid system in 3D and 2D, together with a closer view of the central belt thread, web and the wake.
The wake is longer in the 2D case. The region with lower velocity values is wider than for the 3D analysis and passes through the whole porous web, whereas in the 3D case the wake shows higher velocity values and at the same time is narrower.
Conclusions
In this paper, a hybrid model for the conveyer belt and nonwoven web has been introduced to improve the understanding of the effect of conveyer belt component on the thermo-fluid flow behaviour of the nonwoven web. The data are based on the conveyer belt component and porous web (COLBACK) used on the pilot machine at Low & BONAR (former COLBOND bv), the Netherlands. A comparison study to predict the differences in 3D and 2D formulations was presented. It was shown that the 2D model provides accurate results for the belt temperatures, which suggests the use of the developed 2D model for further parametric studies. The 3D model is shown to be superior for capturing detailed thermal effects in the wake behind the central belt section. It was shown that the 2D case could not capture the thermal effects in the in this region. This is due to the three-dimensional flow disturbances, which affect the flow distribution in z-direction. This prevents the thermal boundary to show a symmetric shedding on the sides, and flow variation in the wake behind the thread. The differences of the flow behaviour are not crucial compared to the belt temperature values. The study implied that the geometrical features of the belt need further assessment, using the developed 2D model. In particular, the effect of different belt configurations and material types on the thermal and flow distribution, as well as on the nonwoven will further improve the understanding.
Footnotes
Declaration of Conflicting Interests
The author(s) declared no potential conflicts of interest with respect to the research, authorship, and/or publication of this article.
Funding
The author(s) disclosed receipt of the following financial support for the research, authorship, and/or publication of this article: We gratefully acknowledge the financial and technical support provided by Low & BONAR (former COLBOND bv), The Netherlands, for this research.