
Abstract
Intrinsically conducting polymer polypyrrole/polyester textile composites were prepared by in situ chemical oxidative polymerization of polypyrrole on a polyester fabric. As an oxidizing agent ferric chloride was used, p-toluenesulfonic acid was used as a dopant. Polymerization conditions (concentration of monomer, polymerization time and temperature) were investigated and optimized by the help of Design of experiment methodology to obtain fabric with electromagnetic shielding efficiency at least 12 dB for frequency 1.5 GHz. Moreover, weight increase, macroscopic color shade of images and scanning electron microscopy images of samples were evaluated. It was found that all selected factors and their interactions have statistically significant effect on resulting electromagnetic shielding effectiveness, whereas monomer concentration has the highest positive influence. Experimental data were used to derive an empirical model linking the output and inputs. Optimized parameters (polymerization temperature 6.7℃, polymerization time 10 h and monomer concentration 5.8 g/l) for creating polypyrrole/polyester textile composite with electromagnetic shielding ability higher than 12 dB were successfully verified.
Keywords
Introduction
Numerous sources of electromagnetic emission in our environment produce electromagnetic (EM) waves that can cause interference in electronic and electrical devices. Sources of such emissions could include generation and transmission of electricity, domestic appliances and industrial equipment, telecommunications and broadcasting. Over the last few years, there has been mounting concern about the possibility of adverse health effects resulting from exposure to radiofrequency EM fields, such as those emitted by wireless communication devices. In 2011, the World Health Organization/International Agency for Research on Cancer (IARC) has classified radiofrequency electromagnetic fields as possibly carcinogenic to humans (Group 2B), based on an increased risk for glioma, a malignant type of brain cancer, and associated it with wireless phone use [1]. One the other hand, despite many studies, the evidence for biological effects of electromagnetic fields on human body when exposed to levels that are below the official threshold values [2] was not unambiguously confirmed. Nevertheless, electromagnetic emissions have to be reduced as possible and simultaneously there is a growing need for suitable materials, which can act as barrier against electromagnetic waves. Actually, shields such as copper or other metallic compounds are used as electromagnetic screens. However, recently electromagnetic shields based on flexible materials have been developed for many applications, especially for protective clothing.
Conductive textile structures have obtained increased attention for electromagnetic shielding and anti-electrostatic purposes in recent years. This is mainly due to their desirable flexibility and lightweight. Conductive fabrics based on use of metallic materials in form of bulk sheets, meshes, plating coatings, powders in filled polymer composites and fibers (filaments) embody excellent shielding effectiveness [3–7], but possess high weight, corrosion, and oxidation problems. Carbons are also used in EM shielding applications, mainly as fibers, particles, powders, filament, and tubes due to their electrical conductivity, chemical resistance, and low density [8–10], but the conductivity and EM shielding performance of carbon-based materials in not good enough.
Intrinsically conducting polymers (ICPs) are attractive alternative for EM shielding. Since the discovery of ICPs in late 1970s, textile structures integrating ICPs for EMI shielding, as well as electrostatic discharge have been developed and evaluated by many papers [11–17]. These materials combine high electrical conductivity (as compared with carbons), ease processability, low density (e.g. density of polypyrrole (PPy) is 1.5 g/cm3 far less than that of metals, such as 8.9 g/cm3 for copper), and corrosion resistance together with absorption shielding mechanism (differing from the reflection one for metals). One of the most widely used approaches to fabrication of electrically conductive textiles from inherently conductive polymers is to use a submicron thick coating of an ICP onto an existing textile substrate. While a lot of research papers describe development of ICPs/textile composites with different set-up of input parameters (different types of oxidizing agents, dopants and their concentrations, polymerization time and temperature, monomer concentration, material of substrate), little attention has been dedicated to investigation of coating formulation that is sufficiently robust for all various input parameters and disposed for particular product.
In this paper, the process for the preparation of conductive fabrics composed of 100% polyester (PET) yarns coated with conducting polypyrrole is described. Polyester was chosen as a substrate because it has been one of the most popular fibers measured by production quantity in recent years. Polyester fibers have many desirable properties, such as relatively high tenacity, low creep, good resistance to strain and deformation, high glass transition temperature, and good resistance to acids and oxidizing agents. On the other hand, hydrophobic nature of polyester fibers makes them difficult to dye and to finish in aqueous media. This creates challenge to investigate and develop methods of surface modifications of polyester-based textile structures. The key process parameters for the preparation of PET/PPy composites through oxidative polymerization in aqueous solution were studied by the help of Design of experiment (DoE) methodology to develop textile composite with electromagnetic shielding efficiency 15 ± 3 dB for frequency 1.5 GHz. It means that electromagnetic shielding effectiveness (SE) cannot be lower than 12 dB, but excess of upper limit is not forbidden. This requirement has arisen from the statement that for personal shielding (general use), electromagnetic SE value should be in the range from 10 dB to 20 dB in the frequency spectrum of 0.8–2.5 GHz [18]. As an oxidizing agent, ferric chloride (FeCl3) was used, and as a dopant p-toluenesulfonic acid (PTSA) was used in fixed amount. As input parameters, polymerization temperature, time, and monomer concentration were chosen. The key, main, and interaction effects of the input variables on the output variable (electromagnetic SE) were analyzed and the settings for acceptable performance were introduced. Moreover, weight increase, macroscopic color shade of PPy-coated samples, and scanning electron microscopy images of samples were evaluated. Optimized input parameters for creating PET/PPy textile composite with at least 12 dB electromagnetic SE were successfully verified.
Polypyrrole-coated fibers
As stated in this paper [15], ICPs are termed as organic polymers that possess electrical, electronic, magnetic, and optical properties of a metal while retaining the mechanical properties, processability, and so on commonly associated with a conventional polymer, and more commonly known as “synthetic metals”. In 1977, Hideki Shirakawa, Alan MacDiarmid, and Alan Heeger published their discovery that led to the 2000 Nobel Prize in chemistry. Since the early 1980s, development has been great and today the inherently conductive polymers, such as polyaniline (PANI), polypyrrole (PPy), polythiophene (PT), and poly(perinaphtalene) (PPN) have achieved a level where many industrial applications have become reality [19]. The level of conductivity achieved in ICPs depends on the molecular structure of the polymer backbone, the degree of doping, and the nature of the counter ion species incorporated [19]. Today, a wide variety of conducting polymers is available. Of all of the known conducting polymers, polypyrrole is the most frequently used in commercial applications, due to the long-term stability of its conductivity and the possibility of forming homopolymers or copolymers with improved mechanical properties [20].
One of the most widely used approaches for fabricating electrically conductive textiles from intractable inherently conductive polymers is to use a submicron thick coating of an ICP onto an existing textile substrate [21]. Usually, electrically conducting textiles are prepared through oxidative polymerization of monomer on the surface of various textile materials. Conducting polymer-based textile structures can be fabricated by in-situ polymerization and a two-step process.
In-situ polymerization consists of adsorption of monomer on the surface of the substrate followed by oxidation polymerization. This process is industrially applicable because it can be performed using standard textile dyeing equipment using aqueous solution for both aniline and pyrrole. The in situ polymerization of pyrrole to form an electrically conductive textile was first reported by Kuhn [17]. The process for forming the polypyrrole-coated textiles is based on the immersion of a fabric into an aqueous solution containing pyrrole and oxidative polymerization conducted by adding an oxidant agent solution. In the extensive literature on the polymerization of pyrrole, the influence of the counter ion on the electrical conductivity has been widely discussed. Oxidants such as iron (III) chloride (FeCl3) [22–24] or ammonium peroxydisulfate (APS) are often used. Usually, aromatic sulfonic acids such as p-toleunesulfonic acid (PTSA) or anthraquinon-2-sulfonic acid (AQSA) [22,23] are used as dopants, see Figure 1. The selection of the dopant anion affects both the surface resistivity and thermal stability of the polypyrrole-coated textiles. The literature indicates that the ratio of monomer units to oxidant agent to dopant is varied between 1:9:3.5 and 1:1.2:0.3 [22,24–35]. Using dilute solutions of pyrrole (0.004–30 M [24,25,30,33,35]), the polymerization reaction occurs on the surface of the fiber and leads to the formation of a precipitate in the bulk liquid phase. The influence of the polymerization temperature and the solvent used has also been investigated. For practical reasons, water is more often used as a solvent [34]. Lower temperatures are the most appropriate for obtaining the best conductivities in aqueous solutions of ferric salts. As a substrate, synthetic [8,11,23,26–28], semi-synthetic [25], and natural [24,29,32,33] textile structures were successfully used. The conductivity of these PPy-coated textiles could be varied from 10−1 to 10−4 S/cm and the electromagnetic shielding efficiency could be varied from 5 to 30 dB for frequency of around 1.5 GHz by controlling the polymerization time, number of repeating polymerizations, the concentration of the reactants in the polymerization bath, and the type of anion used to dope the PPy coating. In general, polymer conductivity is a function of monomer and oxidant agent concentrations, solvent, time of synthesis, and temperature of the synthesis.
Chemical structure of: (a) pyrrole (Py), (b) polypyrrole (PPy), (c) p-toluenesulfonic acid (PTSA), and (d) ferric chloride (FeCl3).
Besides using an in-situ polymerization of conductive polymer to form an electrically conductive textile substrate, other researchers have adopted a two-step process. The major advantage of this procedure is that it can be easily adapted into a continuous process for industrial applications. Several variations to the two-step process include first immersing the textile support in a solution containing the oxidant and desired dopant anion and then exposing the impregnated textile structure to either conductive polymer vapor or polymer dissolved in an aliphatic solvent to initiate the polymerization reaction. Alternately, the textile support may be first exposed to polymer vapor and then immersed into an aqueous solution containing the oxidant and desired dopant anion [22].
Experimental
Materials
Polyester, more precisely polyethylene terephthalate (PET) fabric (white color, 100 % PET, weight: 176 g/m2, thickness: 0.5 mm, weft and warp fineness 35 tex, warp sett 25 cm−1, weft sett 22 cm−1 and plain weave), was used as a substrate. Samples of uniform dimensions 13.5 × 14.5 cm were cut using laser system Marcatex 150 Flexi to prevent fraying of sample edges. All samples were washed at 40℃ using any detergent, thus minimizing impurities on the surface of these fabrics.
Reagent grade pyrrole (≥98%) and p-toluenesulfonic acid monohydrate (≥98.5%) were purchased from Sigma Aldrich (Germany), and iron (III) chloride anhydrous was purchased from Lach-Ner (Czech Republic). All chemicals including pyrrole were used without further purification as received. Deionized water was used in all reactions.
Design of experiment
Our experience has shown that the process operating conditions of in-situ polymerization of pyrrole on textile substrate significantly affect coating quality and performance (e.g. electric conductivity, electromagnetic SE). In many cases, these effects are not strictly additive – process parameters can interact both synergistically and antagonistically. Although successive experiments can yield incremental improvement in quality or performance, the data from these experiments do not usually enable the researcher to identify and qualify interaction effects. Further, in trial and error experiments, full randomization is not possible. Also, studying several process parameters by trial and error is extremely inefficient.
The correct approach to dealing with several factors is to conduct a factorial experiment. This is an experimental strategy in which factors are varied together, instead of one at a time [36]. DoE methods include the factorial experiments, overcome the limitations of trial and error method described above, and quickly give the kind of understanding and results that are needed. The primary goal is usually to show the statistical significance of an effect that a particular factor exerts on the dependent variable and to find the optimum setting of factors to get desired level, small variability of dependent variable, or to minimize uncontrollable variables.
Input variables, units, and levels.

Polymerization of Py
For chemical oxidative polymerization of Py on textile substrate, the sample dyeing instrument with dying pots (stainless steel tubes of capacity 300 ml) was used. Tubes were placed in the water system of the internal bath in which temperature was controlled. The prepared samples were first placed into the dying tube together with the plastic grid to separate the sample by an empty space from the tube side so that the solution can circulate and to support the stability of the plain sample in the tube. Each sample was then soaked in aqueous solution (of about 250 ml) of very low concentration (<0.01%v/v) of Spolion 8 wetting agent to improve wetting of fabric substrate. After this, iron (III) chloride hexahydrate (oxidant) and p-toluenesulfonic acid monohydrate (dopant) were dissolved in 30 ml of distilled water and poured into the dying tube. After 5 min of diffusion, pyrrol monomer (0.2, 1 and 1.8 ml corresponding to 0.64, 3.22 and 5.80 g/l) was added to the tube. Finally, distilled water was added in to the tube up to volume of 300 ml and then the tube was closed, stirred, and placed into the dyeing instrument. The weight ratio of the monomer, oxidizing agent, and dopant was 1:5:3. Polymerization was carried out between 5 and 25℃ and between 1 and 15 h, see Table 1. After polymerization process finished, samples were cleaned in large amounts of water, dried at room temperature and stored flat in an air conditioned laboratory at 20 ± 2℃ and 40 ± 2% RH. Residual PPy which was polymerized onto smooth walls of dying pots was removed mechanically using detergent before next usage of pots.
Evaluation of electromagnetic SE
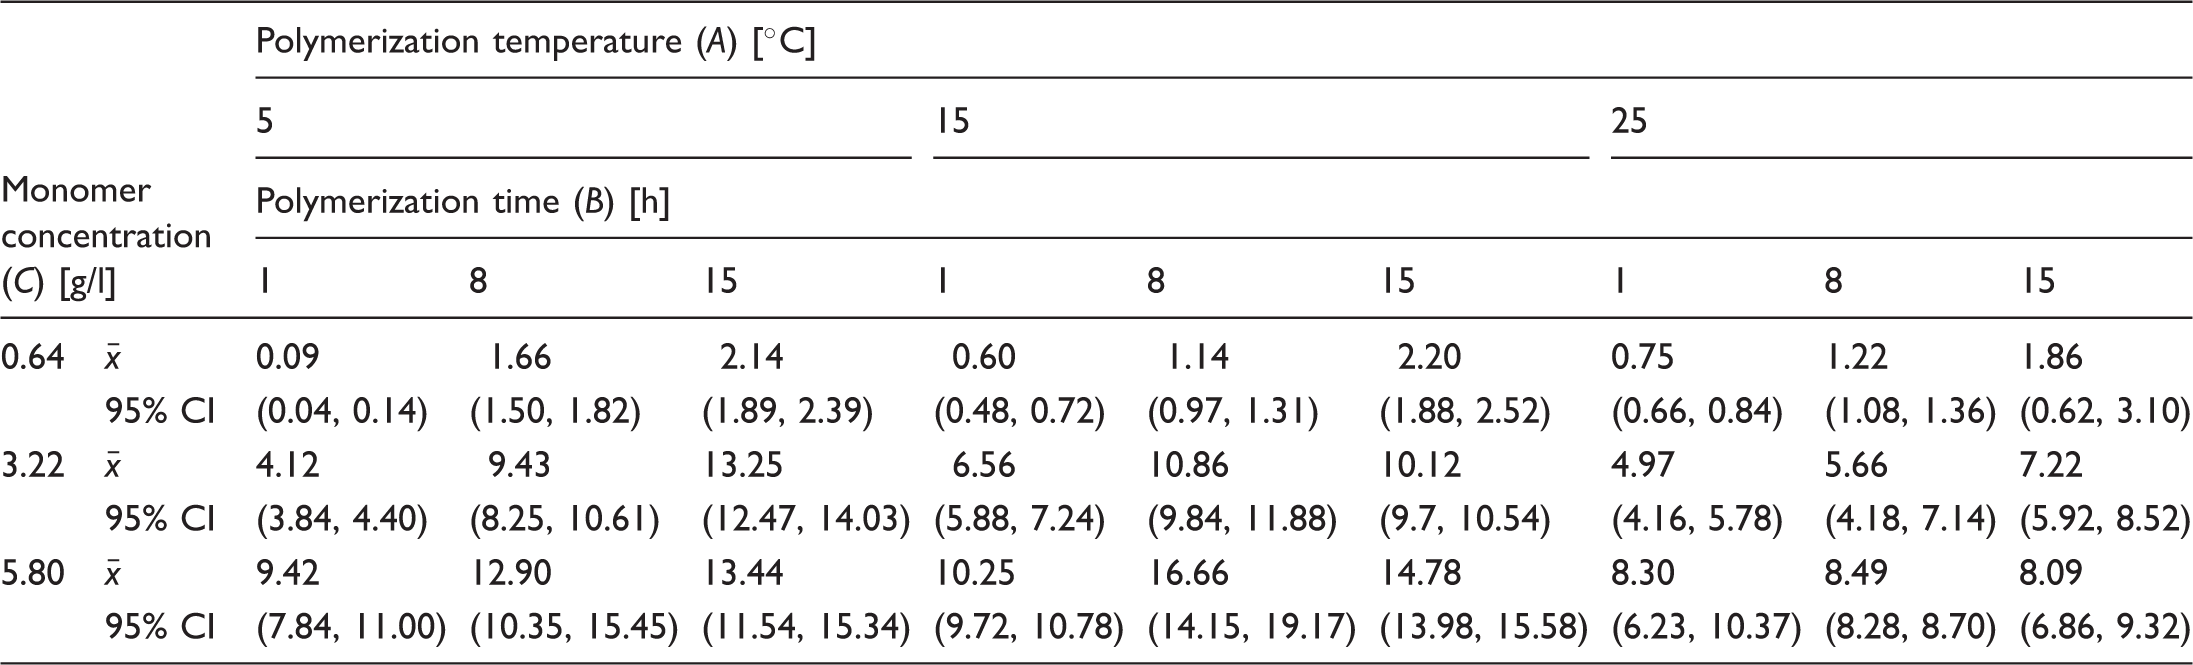
Electromagnetic SE of the PET/PPy textile composites was measured according to ASTM D 4935-10 [37], for planar materials using a plane-wave, far-field EM wave. SE of samples was measured in the frequency range of 30 MHz to 1.5 GHz. The set-up consisted of a sample holder with its input and output connected to the network analyzer. A shielding effectiveness test fixture (Electro-Metrics, Inc., model EM-2107A) was used to hold the sample. The design and dimension of sample holder follows the ASTM method mentioned above. Network analyzer Rohde & Schwarz ZN3 was used to generate and receive the electromagnetic signals. The standard mentioned above determines the SE of the fabric using the insertion–loss method. A reference measurement for the empty cell was required for the shielding-effectiveness assessment. A “through” calibration by the help of the reference sample was made first. A load measurement was performed on a solid disk shape sample subsequently. The reference and load specimens must be of the same material and thickness. Sample (both reference and load) geometries according to ASTM D 4935-10 are shown in Figure 2. One measurement was made at each sample. Three replicates of sample prepared at unique setting of input parameters were prepared; therefore, the sample mean values and 95% confidence intervals of SE for frequency 1.5 GHz are summarized in Table 2.
Illustrations of (a) reference and (b) load sample for measurement of electromagnetic shielding effectiveness. Sample means and 95% confidence intervals (in parentheses) for electromagnetic shielding effectiveness measured at frequency 1.5 GHz [dB].
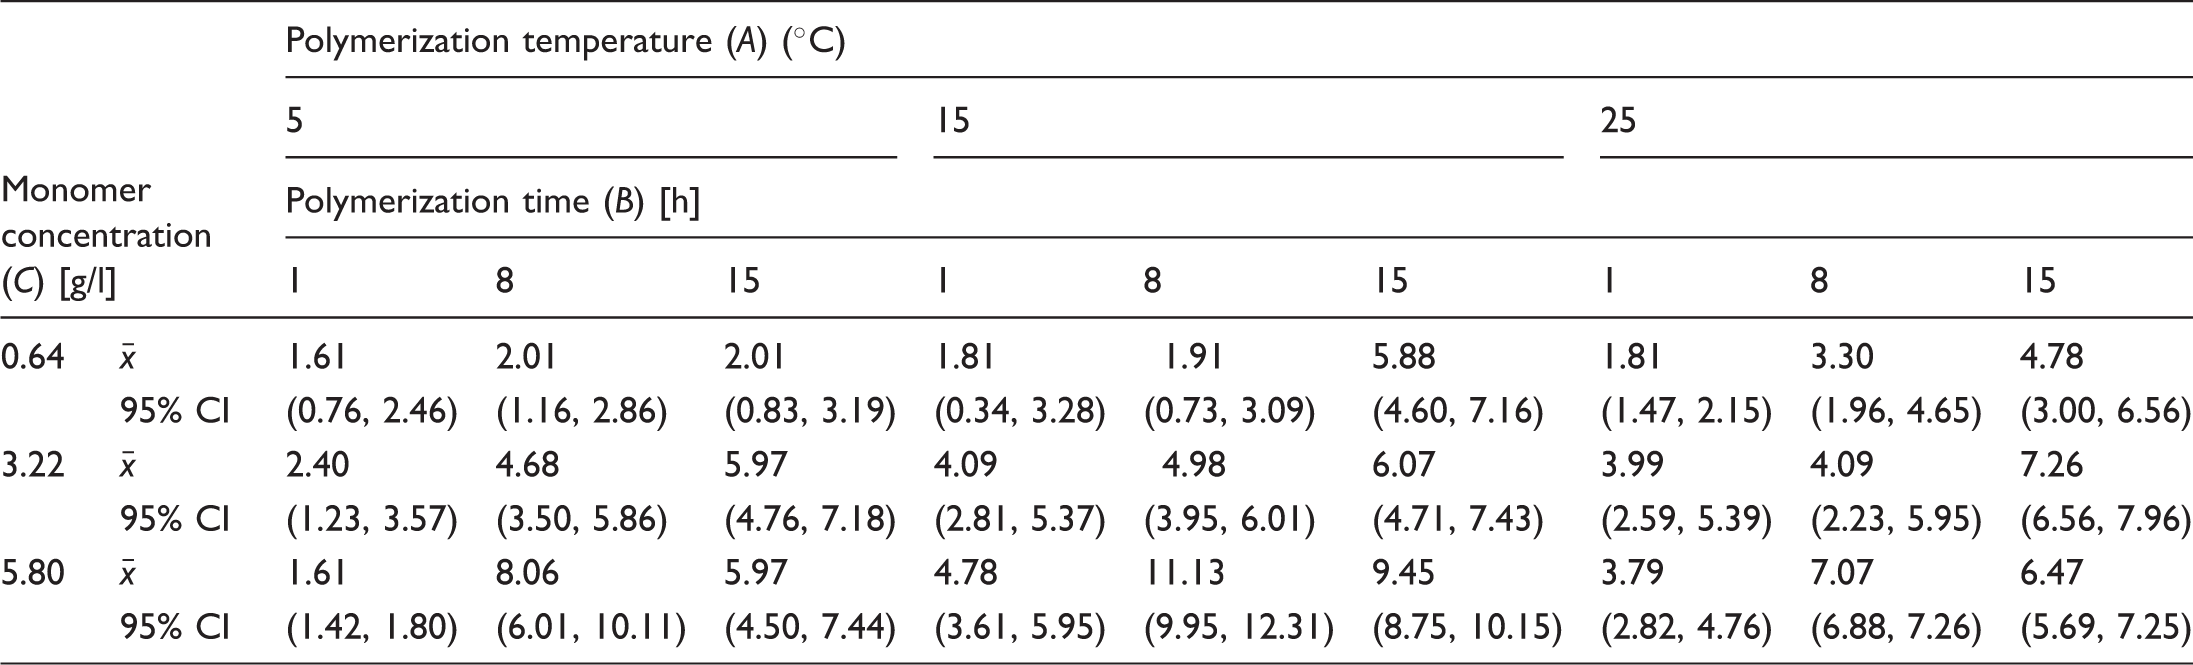
Weight increase

Sample means and 95% confidence intervals (in parentheses) for weight increase (%).
Estimation of gray level from images of PPy coated samples

Sample means and 95% confidence intervals (in parentheses) for gray level obtained from sample images [–].

Results and discussion
Frequency dependent analysis of electromagnetic shielding efficiency
It is clear (see Table 2) that PET/PPy textile composites with electromagnetic SE ranging from almost 0 to 17 dB at frequency 1.5 GHz were prepared by the help of different settings of input parameters (polymerization temperature, polymerization time, and monomer concentration). Frequency of 1.5 GHz (maximum point of measured range) was found interesting as compared to lower frequencies because it is close to working frequency of particular electric devices (for example many GSM phones support 1.8 GHz band). This particular frequency (1.5 GHz) was used for further analysis of factorial design and correlations.
Figure 3 shows the variation in SE for three representatives of PET/PPy textile composites with low, intermediate, and the highest SE for incident frequency in the range of 30–1500 MHz. Electromagnetic SE increased logarithmically with the increasing frequency for samples with higher SE (SE > 2 dB), while dependence of SE on frequency for samples with very low SE (SE < 1 dB) was possible to approximate by negative exponential function. Crimped lines represent measured values of SE, while smooth lines show approximation of measured values by the models described above. Parameters of these models were obtained by minimizing the sum of squared errors.
The dependence of shielding effectiveness on frequency for three representatives of PET/PPy textile composites: sample with low SE (polymerization temperature 5℃, polymerization time 1 h and monomer concentration 0.64 g/l); sample with intermediate SE (polymerization temperature 25℃, polymerization time 15 h and monomer concentration 3.22 g/l), and sample with the highest SE (polymerization temperature 15℃, polymerization time 8 h and monomer concentration 5.8 g/l).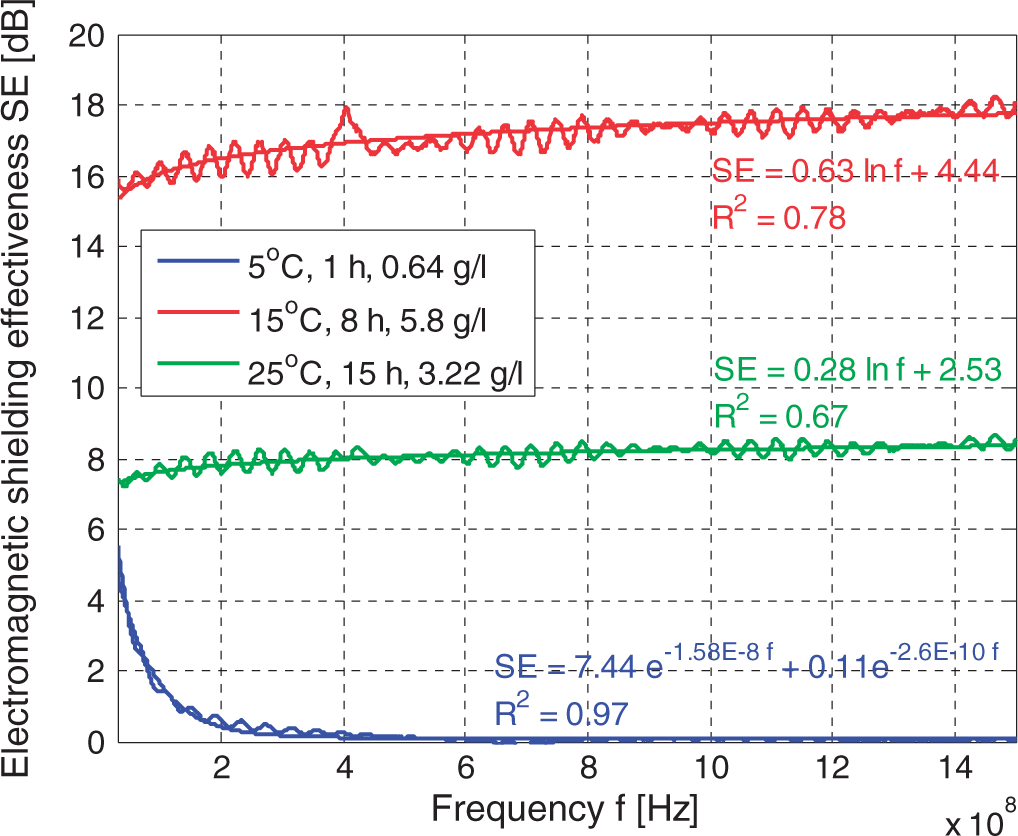
Factorial design analysis
Analysis of variance for the factorial design.

The effects of three main factors are plotted in Figure 4. The main effect plots show that both variables Time (B) and Concentration (C) have positive main effects, i.e. increasing the variable moves the electromagnetic SE upward. The main effect of Concentration is much higher than that of Time.
Main effect of: (a) temperature (A), (b) time (B), and (c) concentration (C) on average electromagnetic shielding effectiveness [dB] measured at frequency f = 1.5 GHz.
Figure 5 shows the interaction plots to visualize interaction between two factors. The parallel lines indicate no interaction; out of parallel lines indicate interaction; and crossing lines indicate strong interaction between the two factors. The plot in Figure 5(a) shows that the effect of polymerization time on the SE depends on the polymerization temperature for low temperatures only. At a high temperature (25℃), the effect of time is negligible. A similar result can be seen from Figure 5(c). Moreover, the SE differs for lower temperature and longer times. The polymerization temperature has a very small effect in a short time (1 h). The effect of monomer concentration on SE is increasing for any value of polymerization temperature. Figure 5(b) shows that the increase is most steep for the middle level of temperature (15℃) and less steep for the higher temperature (25℃). The interaction is not linear. The same results are shown in Figure 5(c). The higher differences between values of SE were observed for the middle level of temperature, while at high temperature these differences are lesser. The effect of monomer concentration on SE is increasing independently on polymerization time (Figure 5(d)). The interactions seem to be weak in these cases. Nevertheless, at higher polymerization times (8, 15 h), SE increases a little steeply than at short time (1 h). The weakness of interaction between concentration and polymerization time can be seen also in Figure 5(f).
Interaction plots displaying interaction effects on average electromagnetic shielding effectiveness [dB] (f = 1.5 GHz) for all combinations of factors.
Electromagnetic SE of the PET/PPy textile composites, which ranged from 0 to almost 17 dB at frequency 1.5 GHz, successfully covered the target range of the experimental region 15 ± 3 dB. Several mathematical approximation models were used to construct the fitted response surface. Akaike Information Criteria (AIC) [38], along with traditional null-hypothesis testing during regression analysis was used in order to determine the model that best describes the factors that influence the electromagnetic SE of the sample. The main aim was to choose a model which would be able to capture the true relationship between the variables of interest while not losing generality from overfitting the data [38]. The best model is then the model with the lowest AIC score


Summary of ANOVA for regression analysis and AIC results.

Model 5 received the lowest AIC score (AIC = 86.81), indicating that this model is the most parsimonious model for given data. There is decisive evidence in favor of quadratic polynomial models to the linear polynomial models based on higher R2 and lower AIC score. The final equation has the form

Obtained model (11) can be also used for graphical representation of the experimental region. The response-surface plot (Figure 6) shows how response relates to two continuous design variables, while holding multiple variables in the model at specified levels. It is visible that higher SE (SE > 14 dB) can be reached using higher time (B > 10 h) and higher concentration at a relatively low temperature (see Figure 6(a) and (c)). To get higher SE, temperature of about 5–12℃ and high concentration of monomer (5.8 g/l) at intermediate polymerization time (10 h) is favorable (Figure 6(b)). To obtain PET/PPy textile composites with electromagnetic shielding efficiency with at least 12 dB for frequency 1.5 GHz, optimizer tool available, e.g., in Minitab (optimization for target value) was used. Globally determined optimized parameters for PET/PPy textile composite with SE mentioned above are shown in Table 7.
A response surface plot showing the quantitated effects of (a) polymerization time and monomer concentration, (b) polymerization temperature and monomer concentration, (c) polymerization temperature and time on electromagnetic shielding efficiency. The optimized parameters and the corresponding results.

Experimental verification of proposed model
Optimized input parameters for creating PET/PPy textile composite with at least 12 dB electromagnetic SE at frequency of 1.5 GHz were verified using subsequent experiment. PET substrate was prepared in the same way as in the previous experiments and chemical oxidative polymerization of Py on textile substrate was repeated according to the procedure described above. In this experiment, pyrrol concentration was 5.8 g/l, polymerization temperature was 6.7℃, and polymerization time was 10 h. The weight ratio among monomer, oxidizing agent, and dopant retains 1:5:3. Overall, 18 PET/PPy textile composite samples were prepared by application of the polymerization process with this particular setting and were evaluated according to their electromagnetic shielding ability. Table 7 presents the mean values and basic statistic evaluation of electromagnetic SE of PET/PPy textile composites at frequency of 1.5 GHz. Figure 7(a) presents the box plot for the electromagnetic SE. This box plot indicates that the distribution of SE is fairly symmetric around the central value and there are no outliers. The normal probability plot of the data in Figure 7(b) confirms the assumption that the electromagnetic SE is normally distributed (supported by Lilliefors test). The objective of this experiment was to demonstrate that the electromagnetic shielding of PET/PPy textile composite sample exceeds 12 dB, and therefore one-sided confidence interval was calculated. Consequently, the condition that SE > 12 dB was satisfied, as 95% lower bound was 12.81 dB (see Table 8).
(a) Box plot and (b) normal probability plot for electromagnetic shielding effectiveness [dB] (f = 1.5 GHz) measured on 18 PET/PPy textile composites prepared during verification of proposed model. Descriptive statistics and results of one-sample t-test of SE measurement.

Relation between weight increase and electromagnetic SE
Polymerization of Py resulted in black PET fabrics, meaning that the conductive polymer completely coated the surface of the fibers. The amount of polymer was evaluated by measuring the weight increase of PET/PPy textile composites compared to uncoated PET sample. The aim of this section is to find out if there is some relation between weight increase and electromagnetic SE. The dependence of electromagnetic SE (measured at frequency 1.5 GHz) on weight increase of PET/PPy textile composites is shown in Figure 8(a). The solid line in this graph corresponds to the linear regression model with parameters obtained by the minimizing sum of squared errors. Corresponding coefficient of determination R2 = 0.60 indicates the good quality of fit. It is clear that SE increases with increasing weight increase of PET/PPy samples and therefore weight increase can be used as an indirect indicator of required electromagnetic SE or electric conductivity.
Relation between grayscale shades and electromagnetic SE
Originally, PET substrate was in white color (mean value of gray level L = 250). As mentioned above, polymerization of Py resulted in gray/black PET fabrics. It seemed that the darker color was achieved, and the sample with the higher electromagnetic SE of samples was prepared. On this account, the relation between electromagnetic SE (measured at frequency 1.5 GHz) and mean gray level of pixels of PET/PPy textile composites images was studied (see Figure 8(b)). It is visible from Figure 8(b) that when increasing the mean value of gray level (sample is lighter), the electromagnetic SE of the sample starts decreasing. This dependence can be approached by power function displayed by the solid line. Corresponding coefficient of determination R2 = 0.61 indicates the sufficient quality of fit. On that ground, mean value of gray level can be also used as an indirect indicator of the required electromagnetic SE or electric conductivity. This phenomenon is limited for usage of light color fabrics as a substrate for the polymerization of PPy. Images of samples with different electromagnetic shielding ability and different mean value of gray level (for better visualization PPy coated sample with the highest, intermediate and the lowest mean value of gray level was chosen) are shown in Figure 9.
The dependence of electromagnetic shielding effectiveness (SE) on: (a) weight increase W [%], (b) mean value of gray level L [–].
Morphology of PPy coated PET fabrics
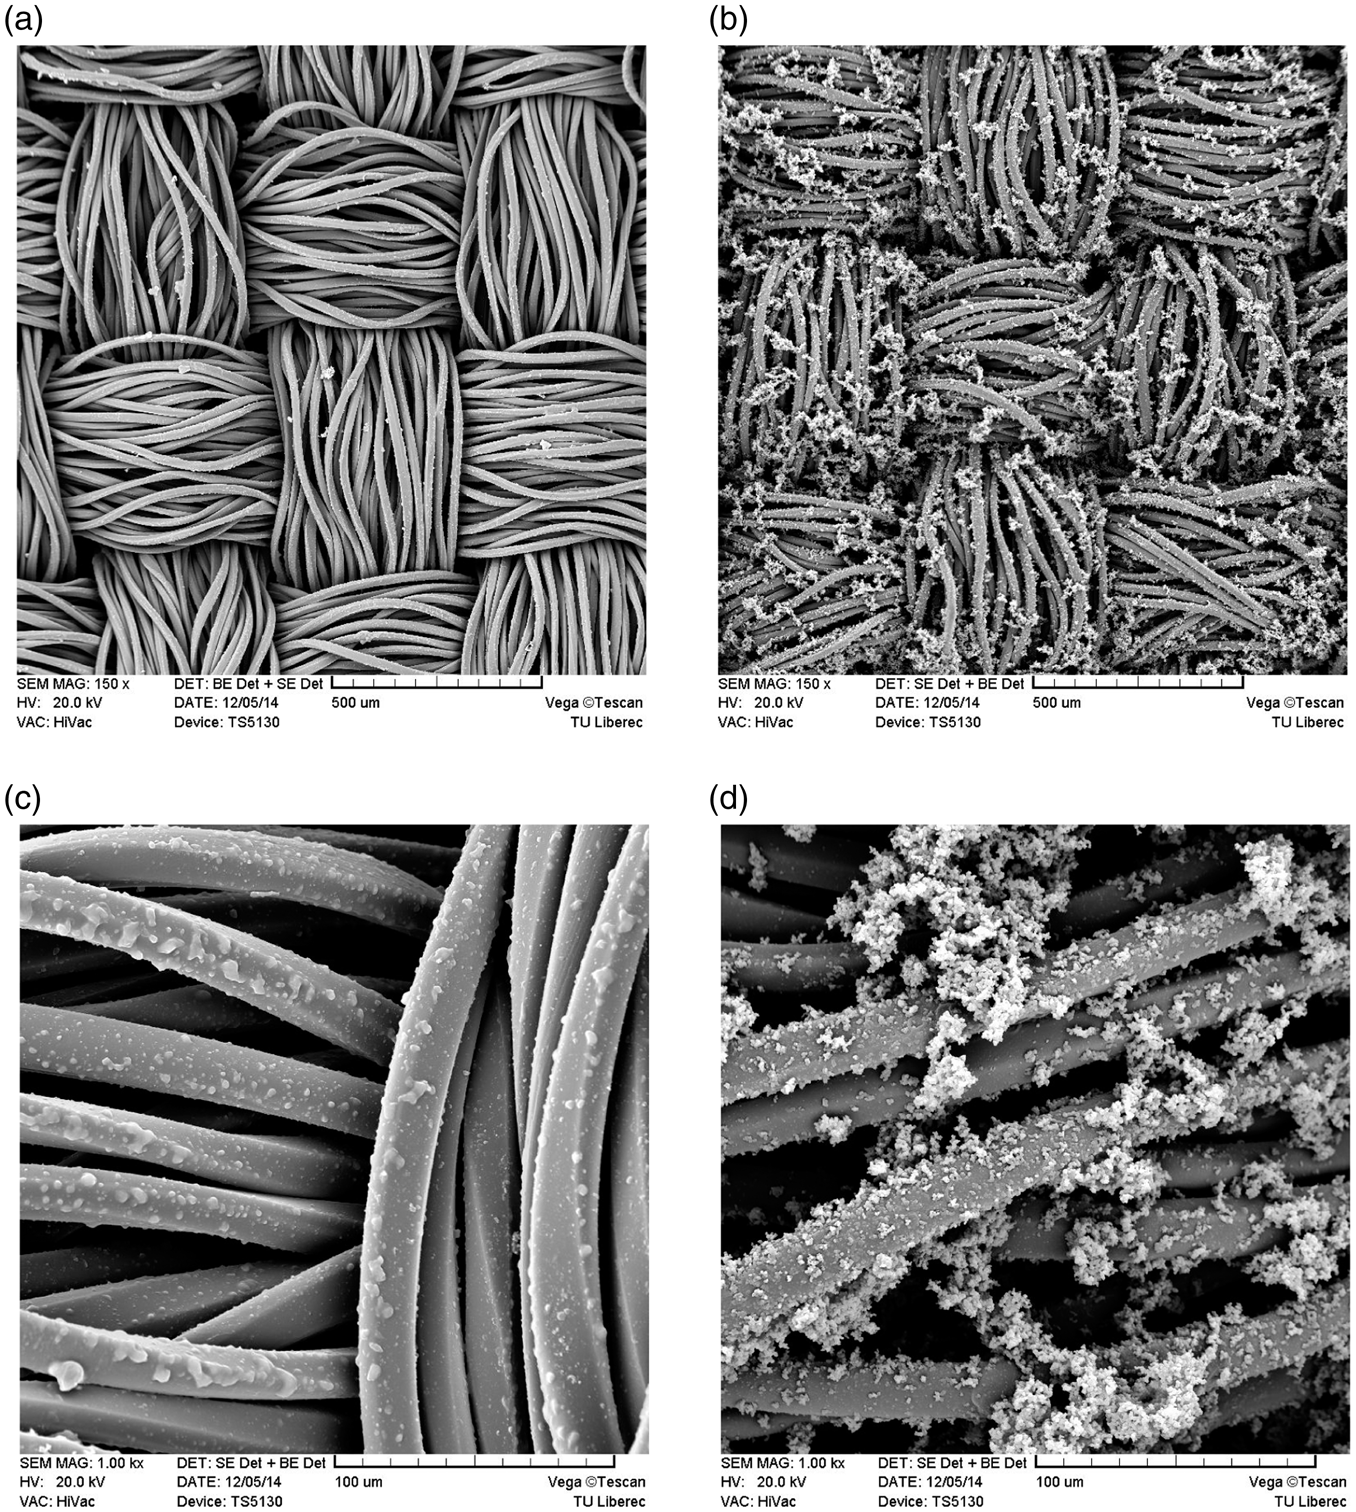
Morphological analysis of PPy-coated PET fabrics was performed by means of scanning electron microscopy (SEM). SEM pictures of PET/PPy textile composites surface prepared with different inputs (Py concentration, polymerization time and temperature) are shown in Figure 10. For better representation, the sample with low amount of PPy (prepared by following adjustment: 5℃, 1 h, 0.64 g/l, accompanied by low SE) and high amount of PPy (prepared by following adjustment: 15℃, 15 h, 5.8 g/l, accompanied by high SE) was chosen. Untreated PET fibers are characterized by an extremely smooth surface without any pore to the inside. After Py polymerization, fibers appeared homogenously coated with a film of PPy (Figure 10). Dendrite-like structure of PPy attached to the PET substrate can be observed especially at the crossover of warp and weft polyester yarns. Their amount seemed to slightly increase with increasing monomer concentration in solution. It is expected that these loosely incorporated clusters of PPy on the surface of the substrate can be probably removed by mechanical stress or stronger washing cycles. The described phenomenon is also visible from cross sections (Figure 11). As the amount of Py in solution increased, the film texture became more compact and polymer aggregates grew into larger size and higher density. The thickness of the PPy layer increased as function of input parameters discussed above, especially of the monomer concentration in solution, which is in good agreement with the kinetics of weight increase. It is supposed that monomer did not penetrate and diffuse into the polyester fiber matrix because of the substrate nature, but rather formed a PPy/PET composite with a skin-core structure. In all PET/PPy textile composites, individual fibers did not stick to each other but stay well separated.
Images of PET/PPy textile composite samples with different electromagnetic shielding ability and different mean value of gray level prepared with the following process parameters: (a) 5℃, 1 h, 0.64 g/l (L = 142, SE = 0.09 dB), (b) 15℃, 1 h, 0.64 g/l (L = 74.2, SE = 0.6 dB), (c) 15℃, 15 h, 5.8 g/l (L = 30.6, SE = 15 dB). SEM pictures of PET/PPy textile composites prepared by following adjustments: (a),(c) 5℃, 1 h, 0.64 g/l, (b),(d) 15℃, 15 h, 5.8 g/l. Two different magnitudes were used: 150× and 1000×.
Conclusion
In-situ chemical oxidative polymerization of polypyrrole on a polyester fabric was performed in order to obtain relatively high conductive textiles for electromagnetic shielding purposes. As an oxidizing agent, FeCl3 was used, and as a dopant PTSA was used. Statistical optimization of process parameters (concentration of monomer, polymerization time and temperature) using DoE was performed to achieve fabric with electromagnetic shielding efficiency of at least 12 dB for frequency 1.5 GHz. The macroscopic color shade and scanning electron microscopy images of samples were also evaluated.
It can be summarized that electromagnetic SE of PET/PPy textile composites ranged from 0 to 17 dB at frequency 1.5 GHz depending on process parameters of polymerization. The highest electromagnetic SE (16.7 dB at frequency 1.5 GHz) was exhibited by a sample prepared with the following input parameters: 15℃ polymerization temperature, 8 h polymerization time, 5.8 g/l monomer concentration. It was also found that all selected factors and their interactions have statistically significant effect on resulting electromagnetic SE, whereas monomer concentration has the highest positive influence. Higher SE can be reached using higher polymerization time ( > 8 h), high monomer concentration (5.8 g/l), and relatively low temperature (5–12℃). Experimental data were used to derive an empirical model linking the outputs and inputs. The proposed model can be used for prediction of electromagnetic SE of PET/PPy textile composites at specific settings of input parameters. By the help of this model, optimized parameters for creating polypyrrole/polyester textile composite with SE > 12 dB were found (polymerization temperature 6.7℃, polymerization time 10 h and monomer concentration 5.8 g/l) and successfully experimentally verified.
Evaluation of weight increase and color of coated samples confirmed that there is a relation between these two parameters and electromagnetic SE of samples. The highest weight increase (11%) was achieved by a sample prepared by following setting of input parameters at 15℃ polymerization temperature, 8 h polymerization time, and 5.8 g/l monomer concentration. The darker the sample, the more PPy is deposited on the sample (higher weight increase) and therefore the higher the electromagnetic shielding ability of the sample. These findings were also supported by morphological analysis of PET/PPy textile composites SEM pictures. Weight increase and color of the PET/PPy textile composites therefore appear as a suitable simple indirect predictor of electromagnetic shielding ability, instead of direct evaluation of electromagnetic SE, which needs to use special devices.
For future, it is also necessary to explore stability of this surface modification applied to nonconductive textile substrate by monitoring changes of electromagnetic shielding ability and electric conductivity after rubbing, abrasion, or washing/drying cycles. Also, time stability accompanied by increased relative humidity and temperature of air and/or UV stability should be revised. These requirements could play significant role when preparing final application.
The described results and proposed models are limited to the certain polymeric systems, but the introduced concept should be applicable for other synthetic substrates and inherently conductive polymers. It seems that in-situ chemical oxidative polymerization of conducting polymer onto a textile structure can be easily applicable to obtain conductive textile structures, because the manufacturing method is simple and there is no necessity of special equipment. Moreover, the mechanical properties of the substrate remained.
Cross section SEM pictures of PET/PPy textile composites prepared by following adjustments: (a),(c) 5℃, 1 h, 0.64 g/l, (b),(d) 15℃, 15 h, 5.8 g/l. Two different magnitudes were used: 150× and 1000×.
Footnotes
Acknowledgement
This paper is original and has not been presented or published till now.
Declaration of Conflicting Interests
The author(s) declared no potential conflicts of interest with respect to the research, authorship, and/or publication of this article.
Funding
The author(s) disclosed receipt of the following financial support for the research, authorship, and/or publication of this article: This work was supported by the research project FR-TI1/122 “Electromagnetic field protective textiles with improved comfort” of Czech Ministry of Industry.