
Abstract
Intelligent energy shunting fluid/fabric base structure which utilizes well-processed shear thickening fluid has been developed. The shear thickening fluid has been synthesized by a powerful mechanical stirrer to disperse 12 nm silica particles into polyethylene glycol 200 g/mol at three concentration levels from low to near maximum packing as 15, 25 and 35 wt%. Examining the rheological behavior of the shear thickening fluid indicates that the increase of shear thickening fluid concentration leads to significant increase in the suspension’s initial, critical and ultimate (up to 104 Pa.s) viscosities, reduction of the critical shear rate, increase of viscoelastic modulus and instability of the suspension. The quasi-static puncture test results demonstrate with the increase of shear thickening fluid concentration, the maximum bearable load by the 15, 25 and 35 wt% shear thickening fluids-treated Twaron® composites increases by 132, 315 and 362%, and the energy absorption increases by 143, 159 and 209%, respectively, compared to the neat fabric. Regarding penetrator structure and dimension, by using rounded penetrators, windowing and pull-out mechanisms would be expected at low velocities. However, sharp-nosed penetrators most likely cause yarns to push aside that is not taken into account as a perfect criteria for investigation of puncture resistance performance. Also, larger penetrators have a larger presented area of impact and, as a result, break more number of yarns to penetrate the fabric.
Keywords
Introduction
During the last decade, some research works have focused on new and intelligent generation of energy-absorbing fluid-fabric base structures which have a light weight, good adaptability, high flexibility, low thickness and improved puncture resistance for cutting or puncture base threads. These capabilities are important in the manufacture of protective equipment such as gloves [1–3]. One way of improving the puncture resistance of woven fabrics is to impregnate them with a shear thickening fluid (STF) [4,5]. The STF is a class of field-responsive smart non-Newtonian fluids that has the ability to transition from low viscosity to high viscosity under an imposed deformation field [6,7]. The STF is a compound of a large number of fine solid particles which is consistently dispersed in a liquid phase [8,9]. The effect of rheological parameters on the characteristics of STF has been studied in many research works [8–15].
The impregnation of STF into high modulus fabrics has attracted much attention owing to the fact that it induces little increase in the thickness, weight and stiffness of the fabrics [16,19]. It is proven that, by infusing the STF between fibers of Kevlar and nylon fabrics, the puncture and impact resistance and the energy absorption capacity of the fabric-fluid composite against needle, spike and knife significantly improve relative to the neat (untreated) fabric [5,16–26].
Kalman et al. [12] have investigated the effect of particle hardness on the puncture resistance of fabric-STF composites. Their findings indicate that the improvement in the composite’s puncture resistance is due to the transfer of viscose stress, friction and the physical entrainment of hard particles into the filaments [12]. The effects of padding pressure and the concentration of STF on the tensile strength of fibers and the impact energy dissipation of fabric-STF composites have been explored and it has been found that the increase of padding pressure leads to the reduction of STF in the fabric and the increase of impact energy absorption [27]. The experimental observations indicate that the neat samples experience larger local deformations than the treated samples where the load is applied [27,28]. The influence of molecular weight of polymer medium [9,15,29] and silica nanoparticle size [10,12,30,31] on rheological and mechanical properties of the fabric-STF composite have already been discussed. The performance enhancement provided by the STF is suspected to be due to the increased frictional interaction between the yarns [3,12,29–33]. The increased friction resulting from the presence of nanoparticles between the filaments and the shear thickening phenomena as well as the friction between the filaments and the penetrator lead to the higher occurrence of fiber breakage than the sliding of fibers under high-velocity impact loading [4,12,20,34].
For a better understanding of the puncture behavior of the STF-coated fabric system, rheological and mechanical tests and analyses are required. Although the same STF application has been reported by several researchers for the development of soft body protective equipment, the available literature in stab and puncture resistance is rather limited. In addition, a quantitative comprehension of effect of STF concentration (weight fraction of solid phase in the suspension) specially at much high concentrations on rheological behavior and puncture resistance mechanism of STF-treated fabrics in QS state is not yet clearly understood.
STF rheology is known to be greatly sensitive to particle volume fraction. Therefore, it is possible that the local composition and behavior of the coating varies relative to the original bulk STF properties [12]. Since the STF concentration undoubtedly is one of the dominant parameters affecting shear thickening phenomena and subsequently on the puncture behavior of the STF-treated fabrics [2,10], in the present study, rheological tests of shear rate sweep, strain sweep and frequency sweep have been carried out for the STF at three concentration levels from low to near maximum packing (saturation threshold) of suspension as 15, 25 and 35 wt%. Afterwards, QS puncture tests have been conducted for the untreated and treated fabrics and bearable load and energy absorption of the STF-impregnated fabric composite have been obtained.
Experimental procedures
Materials
Particles size analysis of AEROSIL 200 by the SAXS (A = 10–10 m).

Figure 1 shows the field emission scanning electron microscope (FESEM) images of AEROSIL 200 at magnifications of 20,000 and 50,000.
FESEM images of AEROSIL 200 at: (a) × 50,000; (b) × 20,000 magnifications.
The fabric used in the experiments (Twaron® D2200, Teijin Co., Netherlands) is made of high tenacity P-aramid fibers and has the plain weave, areal density of 235 g/m2, weight density of 1.45 g/cm3, linear density of 1670 dtex, fabric density of 17 × 17 yarn/in 17 × 17 yarn/in, elongation at break of 2.6%, elasticity modulus of 117 GPa and breaking strength of 360 N.
Synthesis of the STF samples
The STF samples have been synthesized at three concentrations of 15, 25 and 35 wt%, by gradually and continuously adding the AEROSIL 200 to the PEG200. Because of the complexity and difficulty of synthesizing process of the STF with 12-nm silica particles to concentration levels near maximum packing (saturation threshold), a 10 Hp mechanical stirrer rotating at 5700 r/min was used. The mixing process manipulated carefully and continued until all the nanoparticles were completely dispersed in the continuous phase and a homogeneous stable suspension was obtained. Eventually, to expel the air bubbles, the suspension was left undisturbed for 24 hours at room temperature.
The primary particles formed in the AEROSIL 200 process are virtually spherical and are free from pores. These particles fuse to irreversible aggregates because of high free energy and these aggregates are hydrophilic due to the presence of hydroxyl groups (Si–OH) on the surface [35]. In the formation of the primary particles, aggregate bodies are formed which accumulate reversibly into agglomerates [36]. Figure 2 shows a transmission electron microscope (TEM) photo of AEROSIL 200, in which the primary particles, aggregates and agglomerates can be seen clearly.
TEM photo of AEROSIL 200 [36].
Siloxane and silanol groups are situated on the surface of AEROSIL 200 particles. This latter type of functional group in particular is responsible for the hydrophilic behavior of AEROSIL 200.
If AEROSIL 200 fumed silica is dispersed in PEG, the silanol groups of silica aggregates located on the surface preferentially interact either directly or indirectly via the PEG molecules. This affinity is attributable to the hydrogen cross-linking and results in a temporary three-dimensional network structure (non-flocculated suspension) which becomes visible macroscopically as thickening [35,36]. If subjected to mechanical loads, whether in the form of intensive stirring or shaking, the network is broken down again and the viscosity of the system is reduced. When static, the AEROSIL 200 particles interact again and the viscosity rebounds in the original value. This process is referred to as thixotropy and is represented schematically in Figure 3 [36].
Schematic graph of the shear thinning effect of AEROSIL 200 particles in fluids [36].
Fumed silica STFs exhibit a shear thickening phenomenon even at low solid content. This phenomenon is explained by the existing form of silica particles in STFs. Fumed silica particles are low-density aggregates containing continuous pores in STFs. The open nature of fractal aggregates allows fumed silica particles to occlude considerable amounts of liquid. Hence, the liquid-filled aggregates behave as single entities contributing to a much larger effective solids volume fraction which contributes to higher viscosity. Higher viscosity leads to weak Brownian motion, so the shear force can easily drive particles together to form clusters at lower shear rate, as Brownian motion is no longer capable of restoring the equilibrium microstructure. Therefore, fumed silica-STFs exhibit a shear thickening phenomenon even at a low shear rate as what is induced by mixing process [37,38]. Agglomerates could be formed even by adding a little amount of silica nanoparticles to carrier fluid. Although, blending process can somewhat reduce size of agglomerates.
The primary structure of the fumed silica consists of branch-shaped aggregates (size: 300–400 nm) [15]. For the AEROSIL 200 in PEG 200, the sample exhibited agglomerates in the size range of 500–1000 nm [39]. The fumed silica nanoparticles formed aggregates, as shown in Figure 4. According to dynamic light scattering measurement, the size range of the aggregates in 20 wt% STF suspension was observed from 50 to 200 nm [40].
TEM images of fumed silica in STF [40].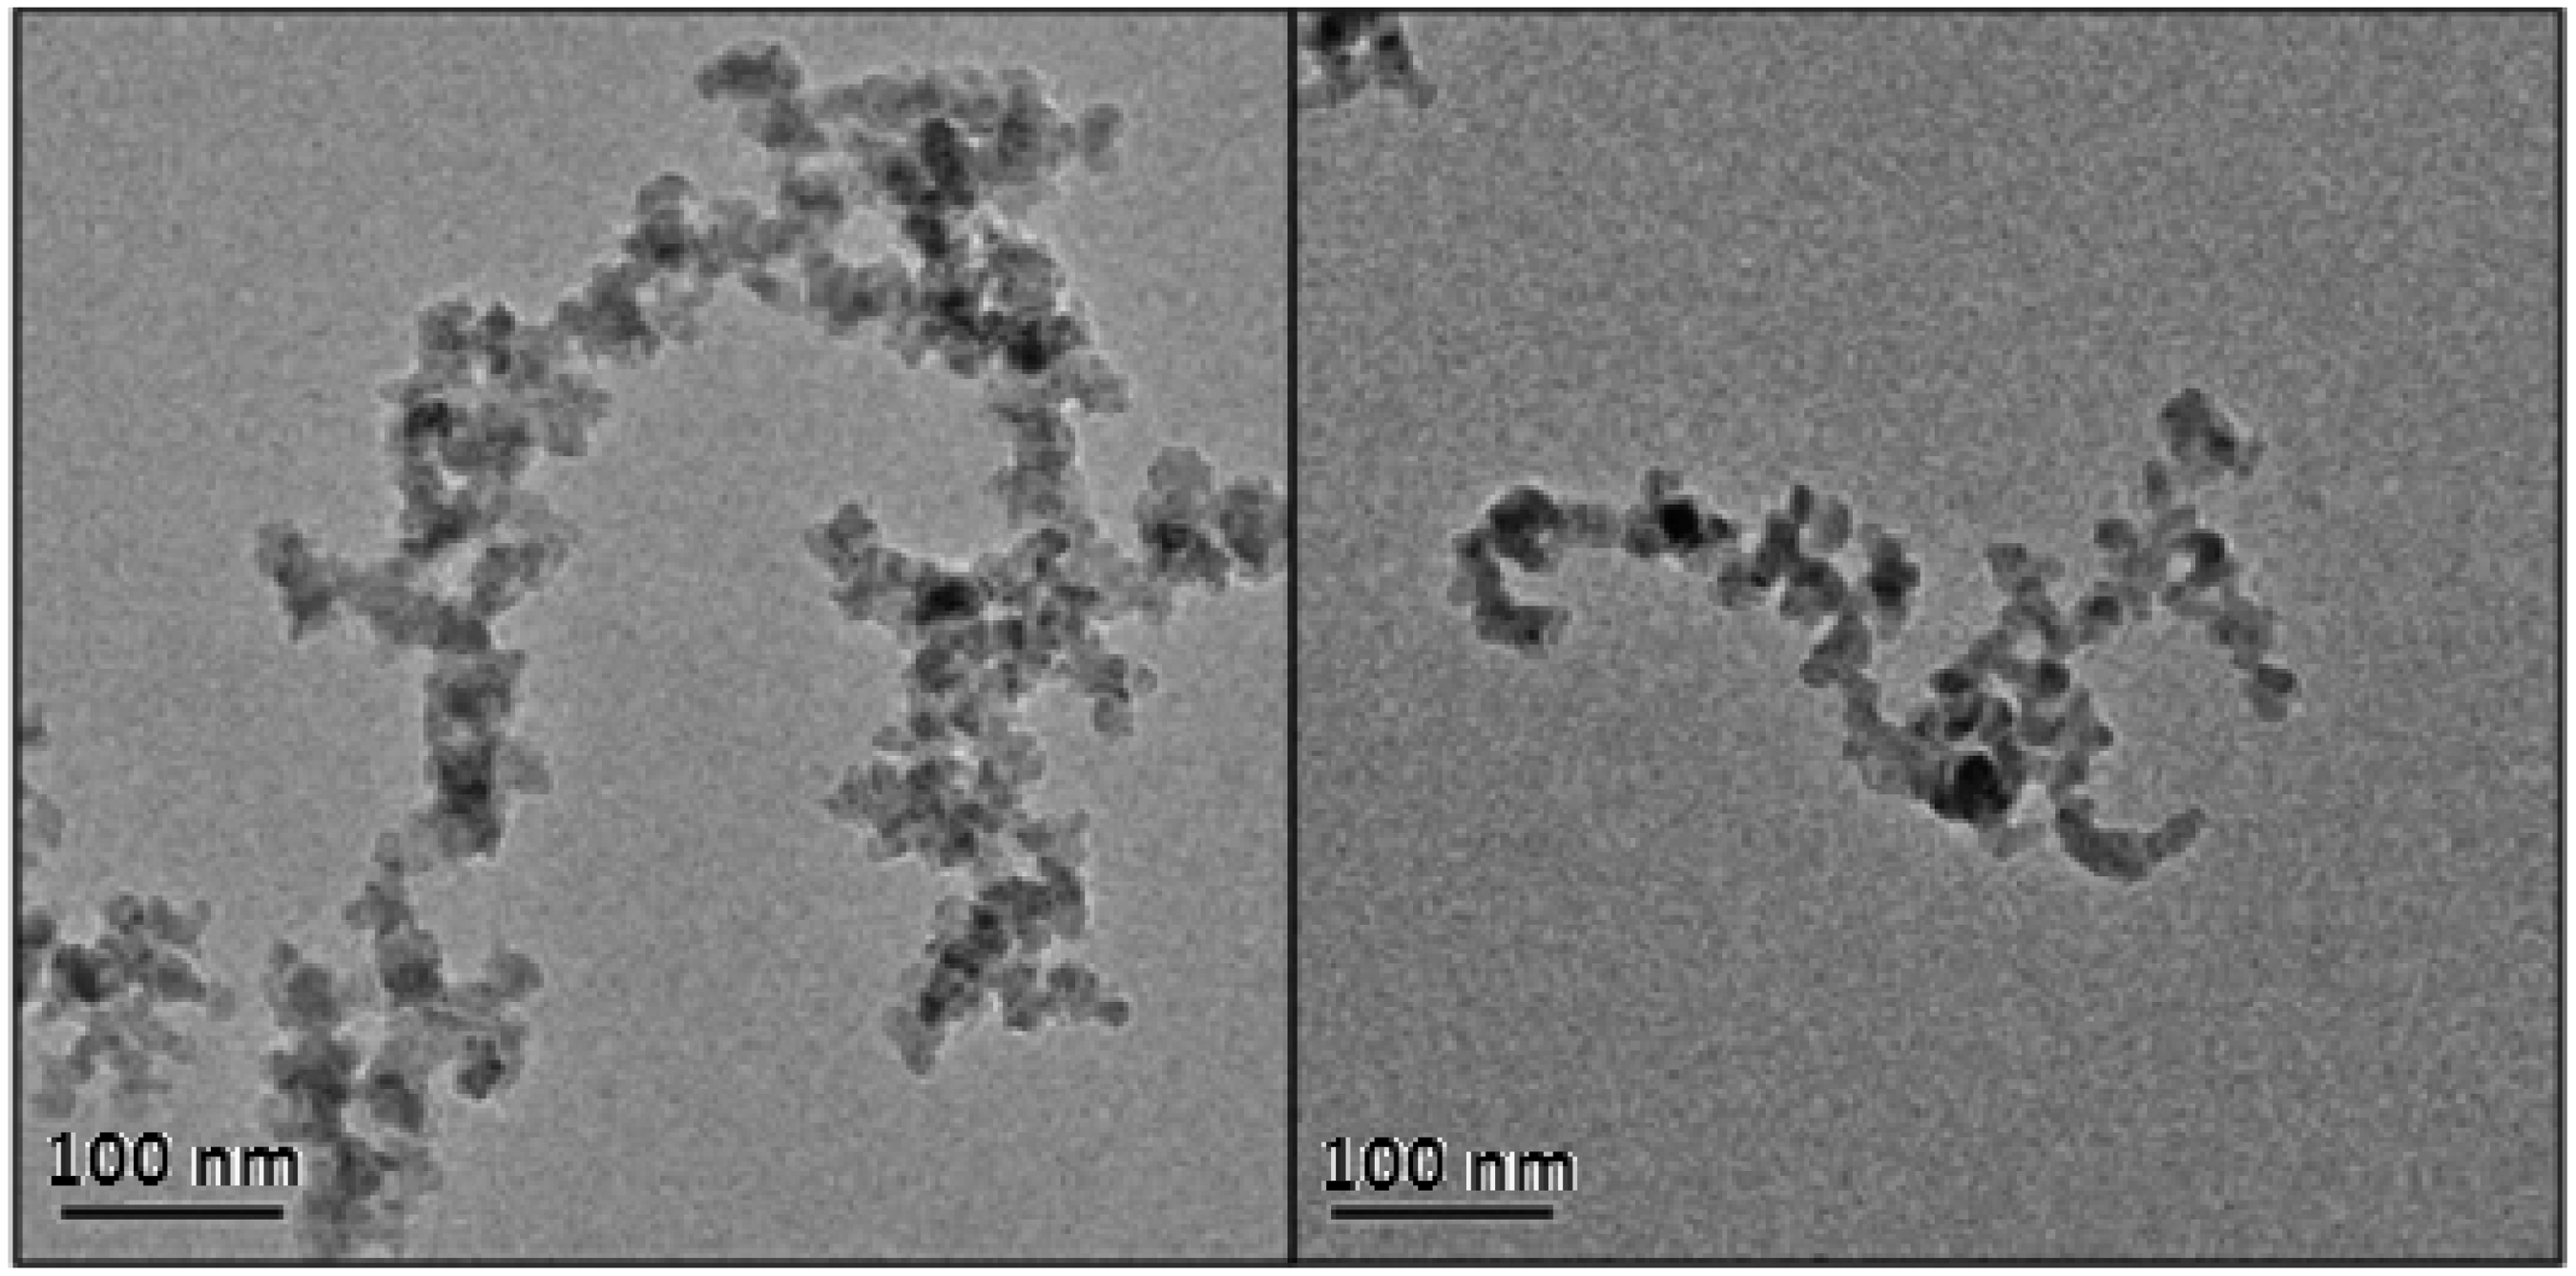
Preparation of the STF-Twaron composite
In impregnating the Twaron fabric with STF, for better infusion of the STF into the fibers, all three STF samples were diluted with absolute ethanol in approximate weight ratio of 1:3 (STF: ethanol) by the mechanical stirrer rotating at 5100 r/min for 15 min until a diluted homogeneous solution was obtained. Each 152 × 152 mm2 Twaron layer, which was already stitched at the edges, was immersed in the diluted solution for 2 min. Then, each sample was compressed by a 5-kg cylindrical roller, rolling back and forth on the fabric, so as to properly infuse the solution into the fibers and to drive out the excess solution from the fabric. Finally, the samples were placed inside an oven at 50℃ for 20 min in order to evaporate the ethanol and obtain the Twaron-STF composite.
If the exact weight ratios of 1:3 (STF: ethanol) were used, the average weight of absorbed STF in the fabric would be slightly increased by increasing the concentration of the STF, which impacts on the puncture resistance of composite. That should be the same percentage when studying the effect of the concentration of the STF. Therefore, as mentioned, ethanol in approximate weight ratio was employed so as to adjust the ultimate weight of all samples alike. It means that the amount of ethanol used to dilute the dispersion increased a little by increasing the concentration. This way, the average weight of absorbed STF in the fabric (actual add on) at all the three samples were about 24% as weight.
Characterization and testing
Rheology of STF
The rheological behaviors of 15, 25 and 35 wt% STF samples were investigated by modular rheometer (MCR 300, Anton Paar Physica Co., USA). The shear rate sweep, strain sweep and frequency sweep tests were carried out a few days after the samples were prepared. This delay in performing the tests gave the suspension an opportunity to undergo structural changes and to reach a steady state. To make sure of air bubbles ejection, before conducting the tests, each sample was pre-sheared for 5 min at shear rate of 1.0 s−1. All tests were carried out in the CP-50 mode (cone-plate geometry with a cone base diameter of 50 mm and apex angle of 1°).
SEM image
To observe the absorption and distribution of the STF in the Twaron fabric, the images taken by the SEM (Phillips XL30) have been used.
Quasi-static puncture test
The quasi-static (QS) puncture test has been conducted according to the American Society for Testing and Materials (ASTM) standard D6264, by INSTRON-1484 test device at the speed of 6 mm/s. In this test, maximum bearable load by the sample versus local displacement has been analyzed in untreated and treated fabrics. Figure 5(a) and 5(b) shows the QS puncture test machine and a Twaron fabric during the test which has been deformed under the applied load, respectively. As is observed in Figure 5(c), to apply the QS load on the 152 × 152 mm2 fabric, a rounded tip steel penetrator with the diameter of 12.7 mm and length of 25 mm has been used. According to Figure 5(d), each sample is set fixedly between two joined steel frames with the thickness of 40 mm and length and width of 200 mm by four screws. At the center of the frames, there are blank circular spaces with diameter of 127 mm for the application of QS load. In order to have no gap left between the fabric and frames, an O-ring is employed to hinder the fabric slippage during application of load. Therefore, boundary conditions of samples are considered to be entirely fixed in all directions.
Quasi-static puncture test: (a) INSTRON-1484 test machine; (b) Twaron fabric during the applied load; (c) rounded tip penetrator; (d) screw joined steel frames.
Results and discussion
Rheological analysis
The rheology of shear thickening fluids considerably depends on the volume fraction of the suspension. To observe the effects of shear thickening, volume fraction should be sufficiently high in order for the particles to feel each other’s presence. This means that, the force field and the behavior of particles are affected by the other particles surrounding them [8,10,13].
The hydro-cluster formation theory has considered the formation of hydro-clusters due to the prevailing of the hydrodynamic forces over the repulsive steric and Brownian forces as the cause of shear thickening phenomenon. In other words, the shear thickening phenomenon can be described by the transition of the particles’ microstructure from an equilibrium state (which has been established through the repulsive Brownian forces) to a flocculated (agglomerated) state when the volume fraction is high enough [8,9,13,41]. The slope of viscosity increase is an important factor for STFs. If the slope is very steep, it is said that discontinuous shear thickening has occurred [6].
In Figure 6, the shear rate sweep test diagrams of 15, 25 and 35 wt% STF samples are presented. To analyze the steady behavior of the samples, the shear rate sweep test has been performed at different shear rates. Shear rate test has been carried out after the dynamic tests; because it normally causes discontinuous shear thickening in the STF, which can alter the STF’s structure.
Shear rate sweep diagrams of 15, 25 and 35 wt% STF samples.
As the Figure 6 shows, in all three samples, the response of viscosity to shear rate is non-Newtonian, and completely nonlinear. At very low shear rates, the initial viscosity of the STF is almost high. With the gradual increase in shear rate, viscosity diminishes; this outlines the shear thinning region. When the suspension is stagnant, the particles line up in an orderly and hexagonal fashion inside the suspension. This structure is formed by the existing repulsive forces between the particles, including the steric, electrostatic and Brownian forces. At low shear rates, the increase of shear force causes fluid layers to slide more easily, and leads to the reduction of viscosity. In other words, the 3-D structures that are normally present in the STF break down with the increase of shear rate, regular layers form, and as a result, viscosity diminishes. With the increase of STF concentration, more severe drop of viscosity (shear thinning) is observed; because at higher concentrations, due to increase in the effective volume fraction of solid phase in the suspension, there are more 3-D structures. Therefore, with the increase of shear force at lower shear rates, more structural breakups occur, and more ordered structures take form; thus, the viscosity reduces with a steeper slope [9,13,28].
In all three diagrams of Figure 6 it is observed that, as the shear rate increases to a certain value which called critical shear rate, the viscosity suddenly increases; because, according to the hydro-clusters formation theory, with the increase of shear rate, the hydrodynamic forces become stronger and overcome the repulsive forces between the nanoparticles, which causes the particles to become disordered, and leads to the formation of 3-D structures and ultimately the increase of suspension viscosity [9,14,28]. This increase of slope is milder for the 15% sample and sharper for the 25% and 35% samples (discontinuous shear thickening); because, with the increase in the weight fraction of solid component, the transfer of force by the agglomerates in the suspension becomes quicker and more intense.
With the increase in the concentration, the onset of shear thickening occurs at lower shear rates. The reason is the increase in the number of more compact silica agglomerations in the suspension, which facilitates and speeds up the transfer of stress. As the distance between the particles reduces, the lubrication forces become greater and the particles are more easily arranged in gravitational field of each other; thus, less shear rate is needed for overcoming the repulsive forces and for the onset of shear thickening. Moreover, the increase of STF concentration leads to significant increase in the initial, critical and ultimate viscosities of the suspension; because the increase in number of nanoparticles inside the suspension further restricts relative movement of fluid layers to one another and thus increases the viscosity [10,13,21]. The ultimate viscosity of 35 wt% STF reaches 104 Pa.s.
To explore the behavior of STF samples at a constant frequency and different strains, strain sweep tests have been conducted for the 15, 25 and 35% STF samples. The strain sweep test is a prerequisite for the frequency sweep test. Since the strain range determines the type of linear viscoelastic (LVE) behavior for each STF sample, the frequency sweep studies should be carried out in this range; because outside this domain, nonlinear state take places, in which the sample behavior becomes unpredictable. The strain sweep test diagrams of 15, 25 and 35 wt% STF samples at the constant frequency of 10 rad/s are illustrated in Figure 7.
Strain sweep diagrams of 15, 25 and 35 wt% STF samples.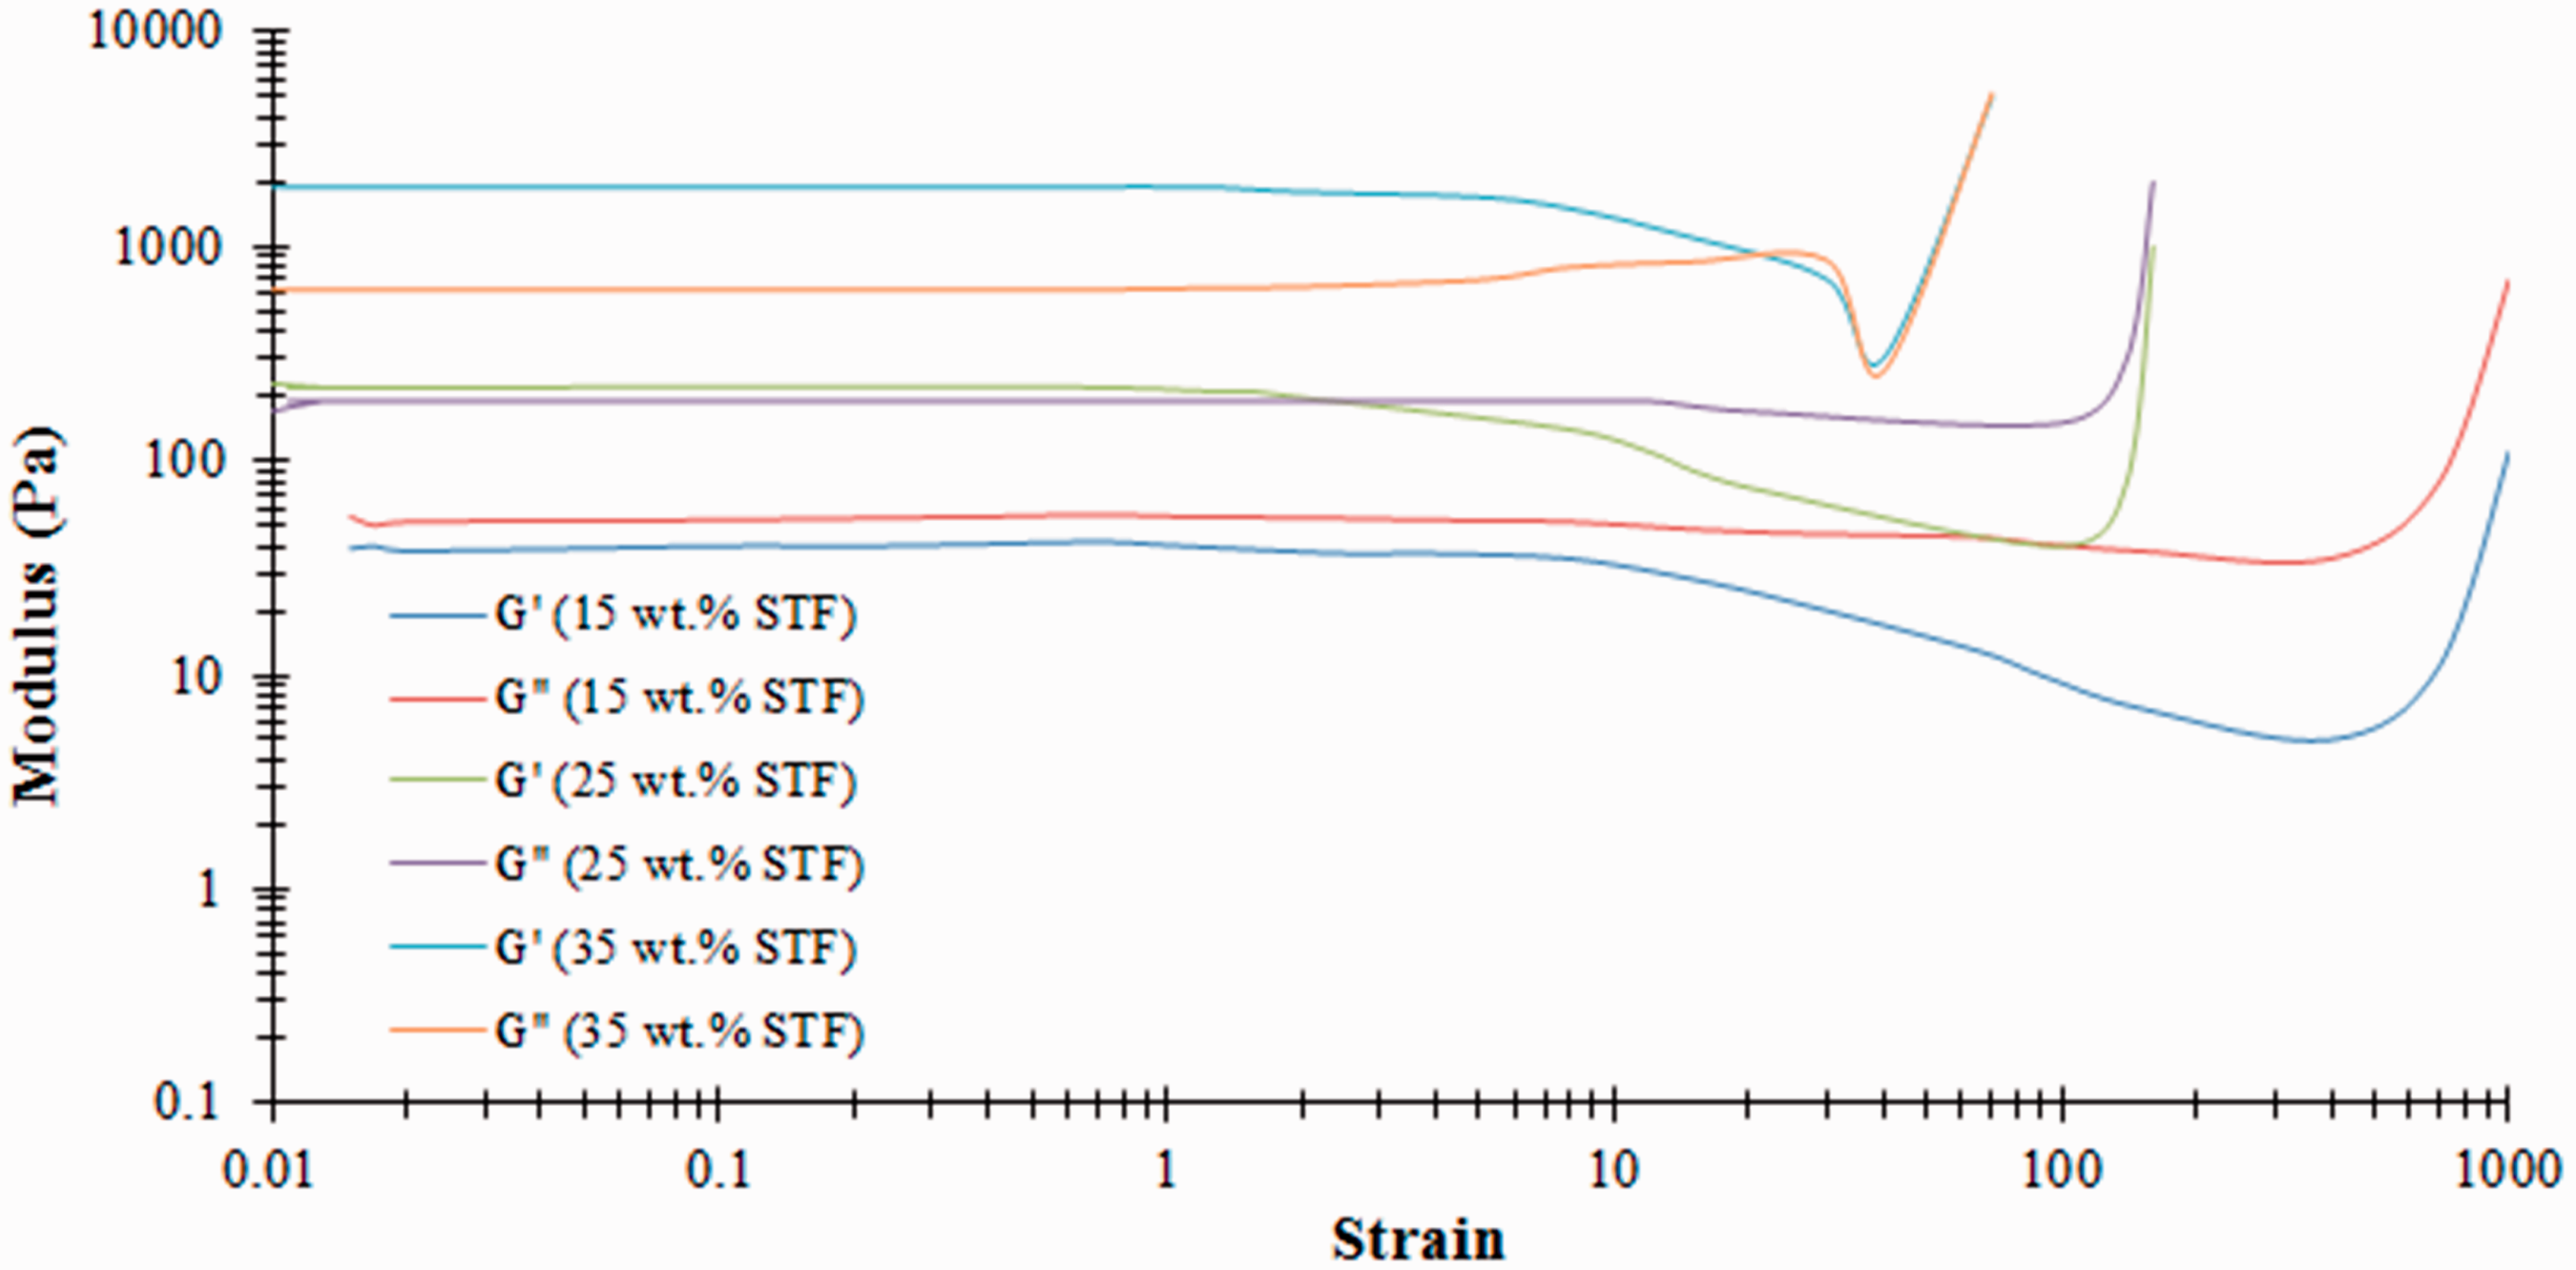
G′ and G″ are elastic modulus and loss modulus, respectively. The loss modulus indicates the gelatinous or pseudo-liquid behavior of the suspension; whereas the elastic modulus characterizes its pseudo-solid behavior. Thus, when loss modulus G″ is higher than elastic modulus G′, it means that the viscous behavior of the fluid has prevailed over its elastic behavior and shows the suspension stability. When the G′ curve is higher than the G″ one, it means that connected lattice structures normally exist in the sample, and the sample has a solid-like or pseudo-elastic state. It should be mentioned that, the greater difference between G′ and G″ means the greater magnitude of pseudo-network in the suspension and thus the higher elastic contribution in the system.
By examining the viscoelastic behavior of the 15 wt% sample, it is observed that the curve of the loss modulus G″ is always higher than that of the elastic modulus. Therefore, the 15% sample shows a completely viscous behavior. For the 25% sample, at low strains, the curve of G′ is higher than the curve of G″. This means that connected lattice structures normally exist in the sample, and the sample has a pseudo-elastic state, up to a strain of 2%. Beyond that point, the slope of the G′ curve decreases and the curves of the two modules intersect each other at a point called the percolation point. At this point, the elastic structure of the material breaks down and henceforth, level of G′ curve becomes less than G″ curve. For the 35% sample, also, at low strains, the G′ curve is higher than that of G″. However, the difference in the curves of the two dynamic modules at low strains is much greater than their difference in the same region for the 25% sample. Therefore, it can be said, for the 35% sample, at low strains, the STF has a more elastic, pseudo-solid and unstable structure. For the 35% sample, with the increase of strain, the elastic structure of the material reaches a complete viscoelastic state.
It can be seen that, with the increase of strain in all three samples, shear thinning occurs first, followed by shear thickening (according to the hydro-cluster formation theory). On the basis of the previous results, the decline in the critical strain can be justified by the increase in the concentration of the suspension. Moreover, it is observed that, with the increase of STF concentration, the viscosity and elastic modulus also increase, and that the elastic modulus goes higher than the loss modulus; i.e. the instability of suspension increases. This is due to the increase in the effective volume fraction of the solid phase and the formation of continuous 3-D structures, and thus a better and more complete load transferring. This means that the stress resulting from the applied strain is efficiently transferred throughout the suspension; because at higher concentrations, extensive hydro-cluster networks exist which transfer the stress more effectively and lend a greater elasticity to the STF [8,9].
Figure 8 demonstrates the frequency sweep test diagrams of the 15, 25 and 35 wt% STF samples. This test has been performed at a constant strain and different frequencies in the LVE region to find out the flocculation or lack of flocculation of the STF. Regarding the strain sweep tests, in all the tests, a constant strain of 1% has been considered and the frequency has been changed from 0.1 to 100 rad/s. This test is particularly useful for finding the specific relaxation time (SRT). The SRT frequency corresponds to the point at which the curves of dynamic modules G′ and G″ intersect each other, i.e. the frequency beyond which the viscoelastic response of the suspension tends toward a pseudo-solid behavior and the value of G′ becomes greater than G″. It means the elastic state overcomes the viscous state.
Frequency sweep diagrams of 15, 25 and 35 wt% STF samples.
In view of Figure 8, it is observed that, for the 15 wt% sample, in all the frequency ranges, G″ is higher than G′ (completely viscous behavior) and the curves of two modules intersect each other at about the 100 rad/s frequency (SRT frequency). This means that, at all the frequency ranges up to 100 rad/s, the 15% sample is not flocculated. For the 25 wt% sample, the curves of the two modules intersect each other at a lower frequency than the 15 wt% sample; because with the increase of the effective volume fraction of the solid phase and the formation of more extensive 3-D network structures, a lower frequency would be needed for the elastic modulus to overcome the viscous modulus. For the 25% sample, beyond the SRT frequency, the G′ curve stands higher than the G″ curve, and the STF structure actually becomes unstable. For the 35% sample, in the whole frequency ranges, G′ is higher than G″, meaning that the 35% sample has an elastic and solid-like behavior in this range. Thus, the 35% sample is flocculated, and it has a volume filling network structure which has not changed at all in the considered frequencies. With the increase of concentration in all the cases, the viscoelastic modules go up, due to the increase in viscosity and the increase in the effective volume fraction of solid component; which agrees with the previous findings [8,9].
SEM
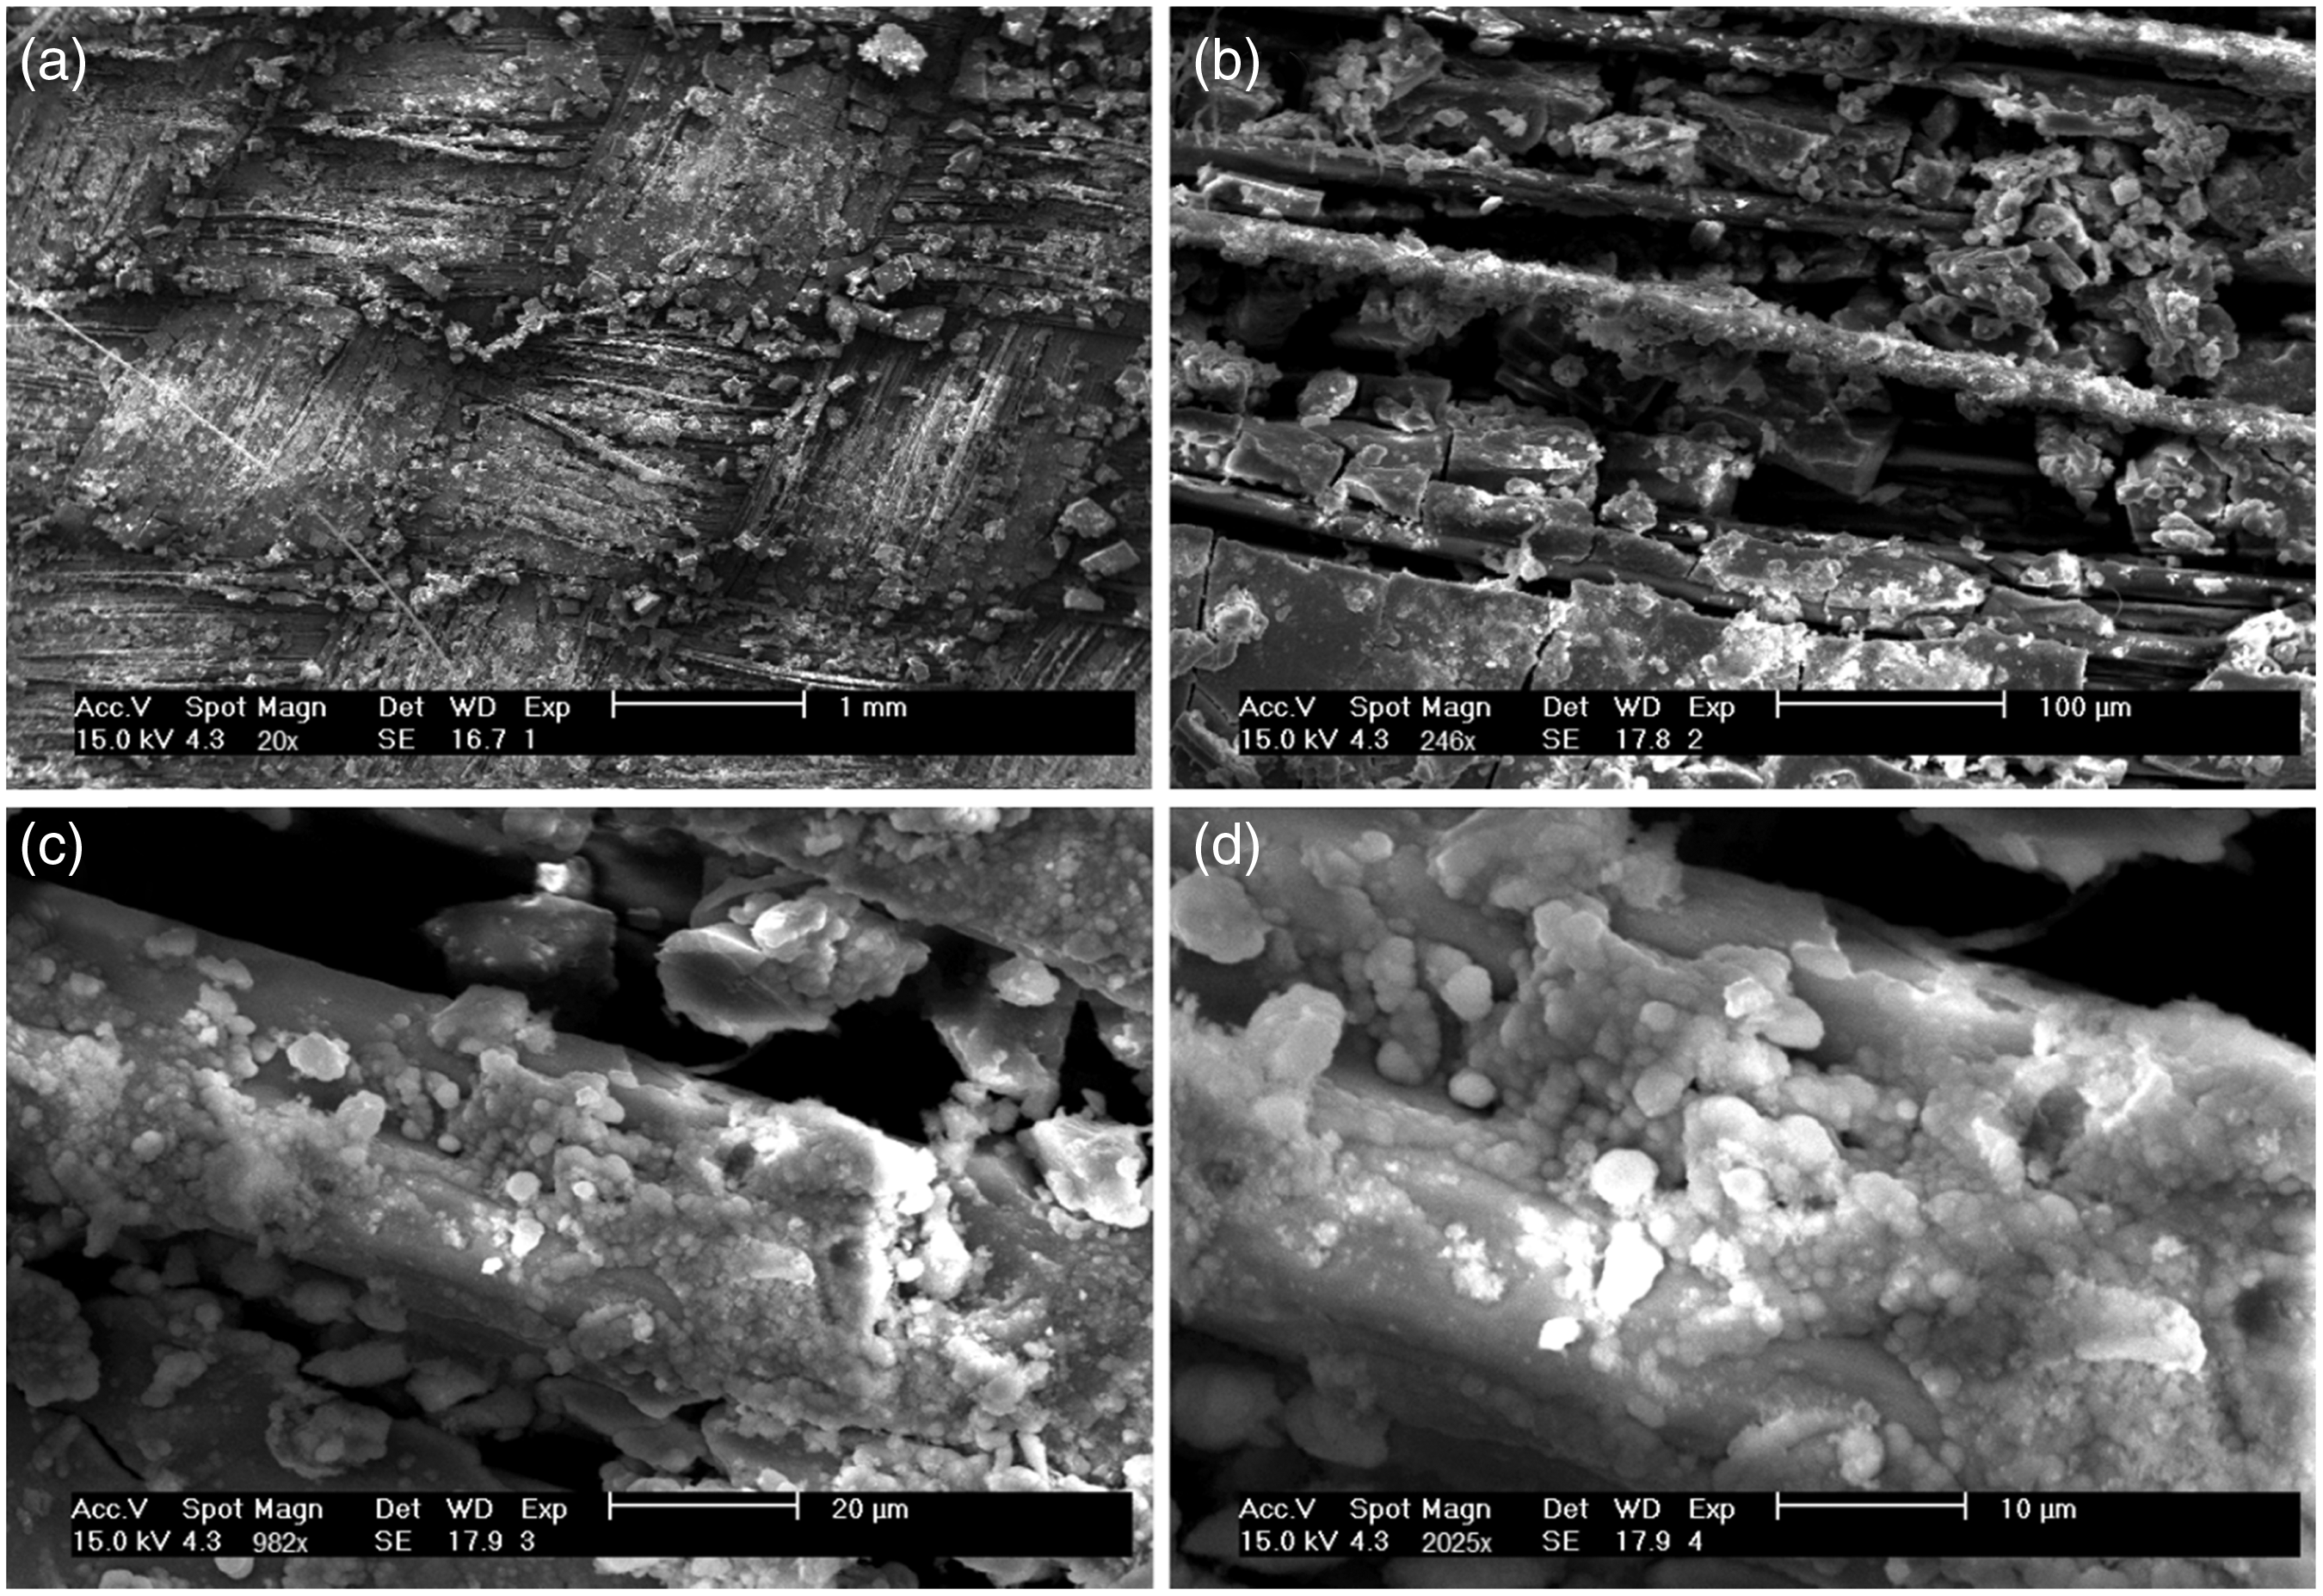
Figures 9 through 11 illustrate the SEM micrographs of 15, 25 and 35 wt% STF-impregnated Twaron composites at different magnifications.
SEM micrographs of 15 wt% STF-coated Twaron composites at: (a) × 20; (b) × 238; (c) × 1006; (d) × 2036 magnifications.
As can be observed in the SEM images, in all the STF-impregnated Twaron composites of various concentrations, the STF has been well incorporated between the fibers. The SEM images confirm the efficiency of the fabric impregnation process to infuse the STF into the Twaron fibers.
With the increase of STF concentration, it is observed that the STF has distributed throughout the Twaron more completely, the amount of STF between the fibers has increased and the gaps between the fibers have been filled more uniformly and thoroughly. Also, the gaps between yarns at yarn crossover areas have been well coated by the STF. Higher magnifications of SEM images clearly show that with the increase of STF concentration, Twaron fabric has been covered more integrally by the STF.
QS puncture tests
Using the diagrams obtained from the QS puncture test, the puncture resistances of the untreated and the STF-treated Twaron composites are evaluated. The composite begins to deform as the QS load is applied by the rounded tip penetrator. Thus, the curve of the maximum bearable QS load versus the displacement of the part of sample which is under QS loading by the penetrator can be plotted in the untreated and treated samples.
Load-displacement diagrams resulting from the QS puncture tests for the neat Twaron and 15, 25 and 35 wt% STFs-impregnated Twaron composites are presented in Figure 12. These diagrams demonstrate the effect of increase of STF concentration on the puncture resistance of Twaron-STF composites. As is observed, the STF-coated Twaron exhibits a much higher puncture resistance than the untreated Twaron. All puncture test results have been obtained with five-repetition.
Since Twaron fibers have a high breaking strength, the QS load needed for satisfying the failure criteria of fibers (fibers breakage) is higher than the required load for satisfying the criteria of puncture mechanisms including yarns and fibers sliding over each other, pushing aside them and forming an opening (windowing) and pulling out (extraction) them because the friction between the fibers and yarns which is the unique criteria of puncture mechanisms in both the neat and treated sample is not as high as the breaking strength of Twaron fibers. Consequently, these puncture mechanisms play the role of the failure criteria of fabric in the QS puncture tests [12,20].
Owing to the low speed of the penetrator, as the QS load is applied to the untreated Twaron, the applied stress is transferred along the yarns to the fixed edges of the fabric [23,33,40]. However, because of a lack of sufficient friction between the fibers and penetrator, between fibers themselves and between the yarns at yarn crossover areas, the penetrator passes through the fabric by puncture mechanisms.
Shear thickening occurs even in QS puncture tests. “The transitional behavior of a STF is fundamentally triggered by critical stress levels” [12]. Normalizing the typical puncture force by penetrator tip surface area provides tentative value of shear stress within the fabric of 106–107 Pa, high enough to induce transition (many orders of magnitude higher than STF transitional stresses of ∼10–10000 Pa). Therefore, “The stresses encountered by the STFs intercalated in the small gaps between the fibers are likely to be sufficient to trigger shear thickening” [12].
Therefore, as soon as the QS load is applied to the STF-coated fabric, based on the non-Newtonian and nonlinear reaction of the STF intercalated between the fibers, the nanoparticles accumulate around the load application point, and the viscosity of the STF increases [28,41]. The nonlinear increase of STF viscosity causes the considerable increase of friction between fabric and penetrator, between fibers themselves and between the yarns at yarn crossover areas. This way, the fibers better keep their order and arrangement, and the penetrator encounters a higher resistance by the coated fabric when trying to push aside and pull out the yarns.
In addition, relative to the untreated sample, more yarns participate in the puncture mechanisms and hence, it becomes more difficult to penetrate the composite. Thus, in the STF-coated composite, compared to the neat fabric, puncture resistance increases considerably [15,26]. Moreover, as the SEM images demonstrated, the STF-coated composite has more continuity, integrity and uniformity compared to the neat fabric so that gaps between fibers and yarns are coated with the STF, which leads to a better stress distribution in the composite.
The QS puncture experiments performed in this study explore fabric puncture mechanisms that are naturally dependent on the effects of mobility of the yarn and filament. To study fabric defeat mechanisms including yarn and fiber compression or fiber shear and tensile failure, some other tests such as yarn pull-out and ballistic penetration experiments are needed. It should be noted that these mechanisms can be broadly characterized as being dependent on either mechanical properties inherent to the yarn filaments or the effects of mobility of the yarn or filament. In other words, puncture mechanisms such as yarn sliding and windowing are most directly modified by restricting the ability of fibers and yarns to reorganize and move relative to each other. In contrast, compression, shear and transverse failure are more directly related to the mechanical properties of the fabric filaments [3,12,33,34,42–44].
Figure 13 depicts the comparison between maximum bearable load and maximum energy absorption by the untreated and 15, 25 and 35 wt% STFs-treated composites. As a result, the puncture resistance or the maximum bearable load by the 15, 25 and 35 wt%-treated Twaron composites during QS puncture test increases by 132, 315 and 362% and the energy absorption increases by 143, 159 and 209%, respectively, compared to the neat fabric. The maximum energy absorption of each sample was calculated by the area under the curve.
With the increase of STF concentration, the maximum bearable load by the Twaron-STF composite or, in other words, the puncture resistance of the composite increases significantly. The increase of STF concentration leads to a more drastic shear thickening, higher viscosity of STF intercalated between fibers, higher friction between fibers and between yarns (the increase of friction directly depends on the concentration of STF), keeping better fibers arrangement, more consistent, uniform and integrated fabric coating, less gaps, less yarns and fibers sliding, extracting and windowing under QS loading and better stress distribution and energy absorption in the Twaron-STF composite.
Figure 14 shows the pictures of failed samples including untreated and 15, 25 and 35 wt% STFs-treated Twaron composites after the QS puncture tests.
SEM micrographs of 25 wt% STF-coated Twaron composites at: (a) × 20; (b) × 238; (c) × 1006; (d) × 2036 magnifications. SEM micrographs of 35 wt% STF-coated Twaron composites at: (a) × 20; (b) × 238; (c) × 1006; (d) × 2036 magnifications. Load-displacement diagrams of the Twaron fabric: (a) neat; (b) 15 wt% STF-treated composite; (c) 25 wt% STF-treated composite; (d) 35 wt% STF-treated composite. Maximum bearable load and maximum energy absorption by the untreated and 15, 25 and 35 wt% STFs-treated Twaron composites. Pictures of failed samples after the QS puncture tests: (a) neat Twaron; (b) 15% STF-Twaron composite; (c) 25% STF-Twaron composite; (d) 35% STF-Twaron composite.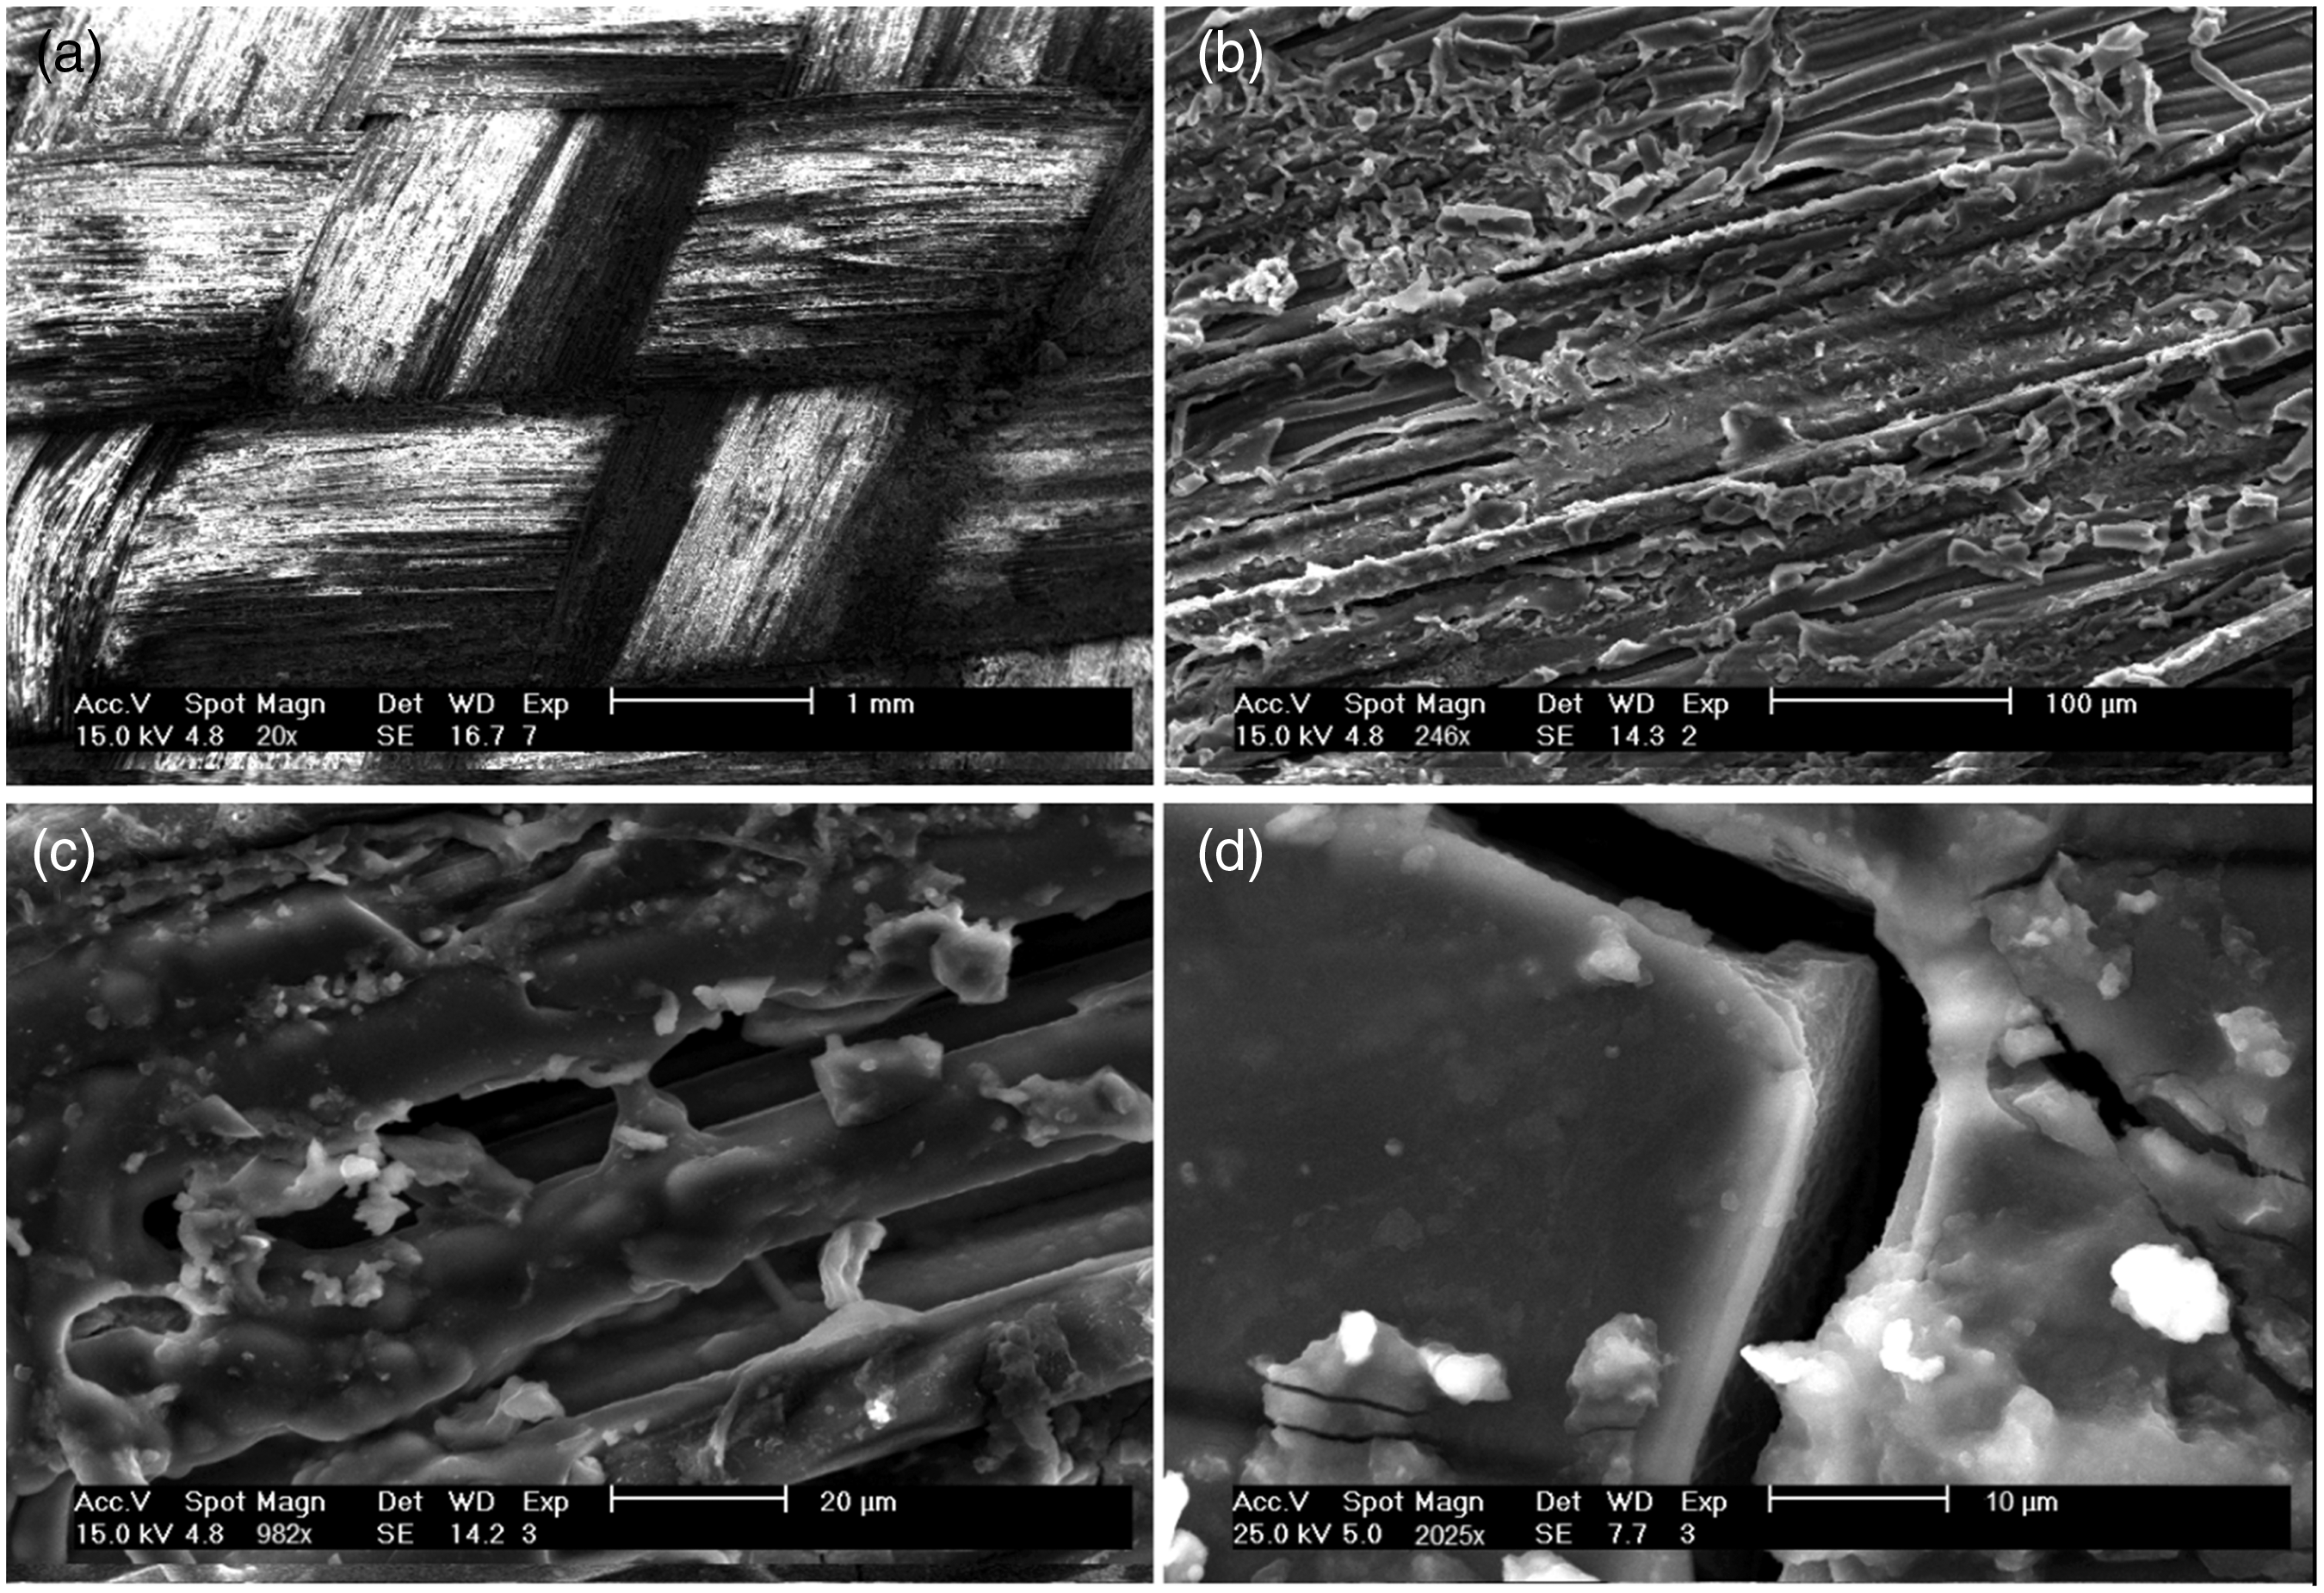


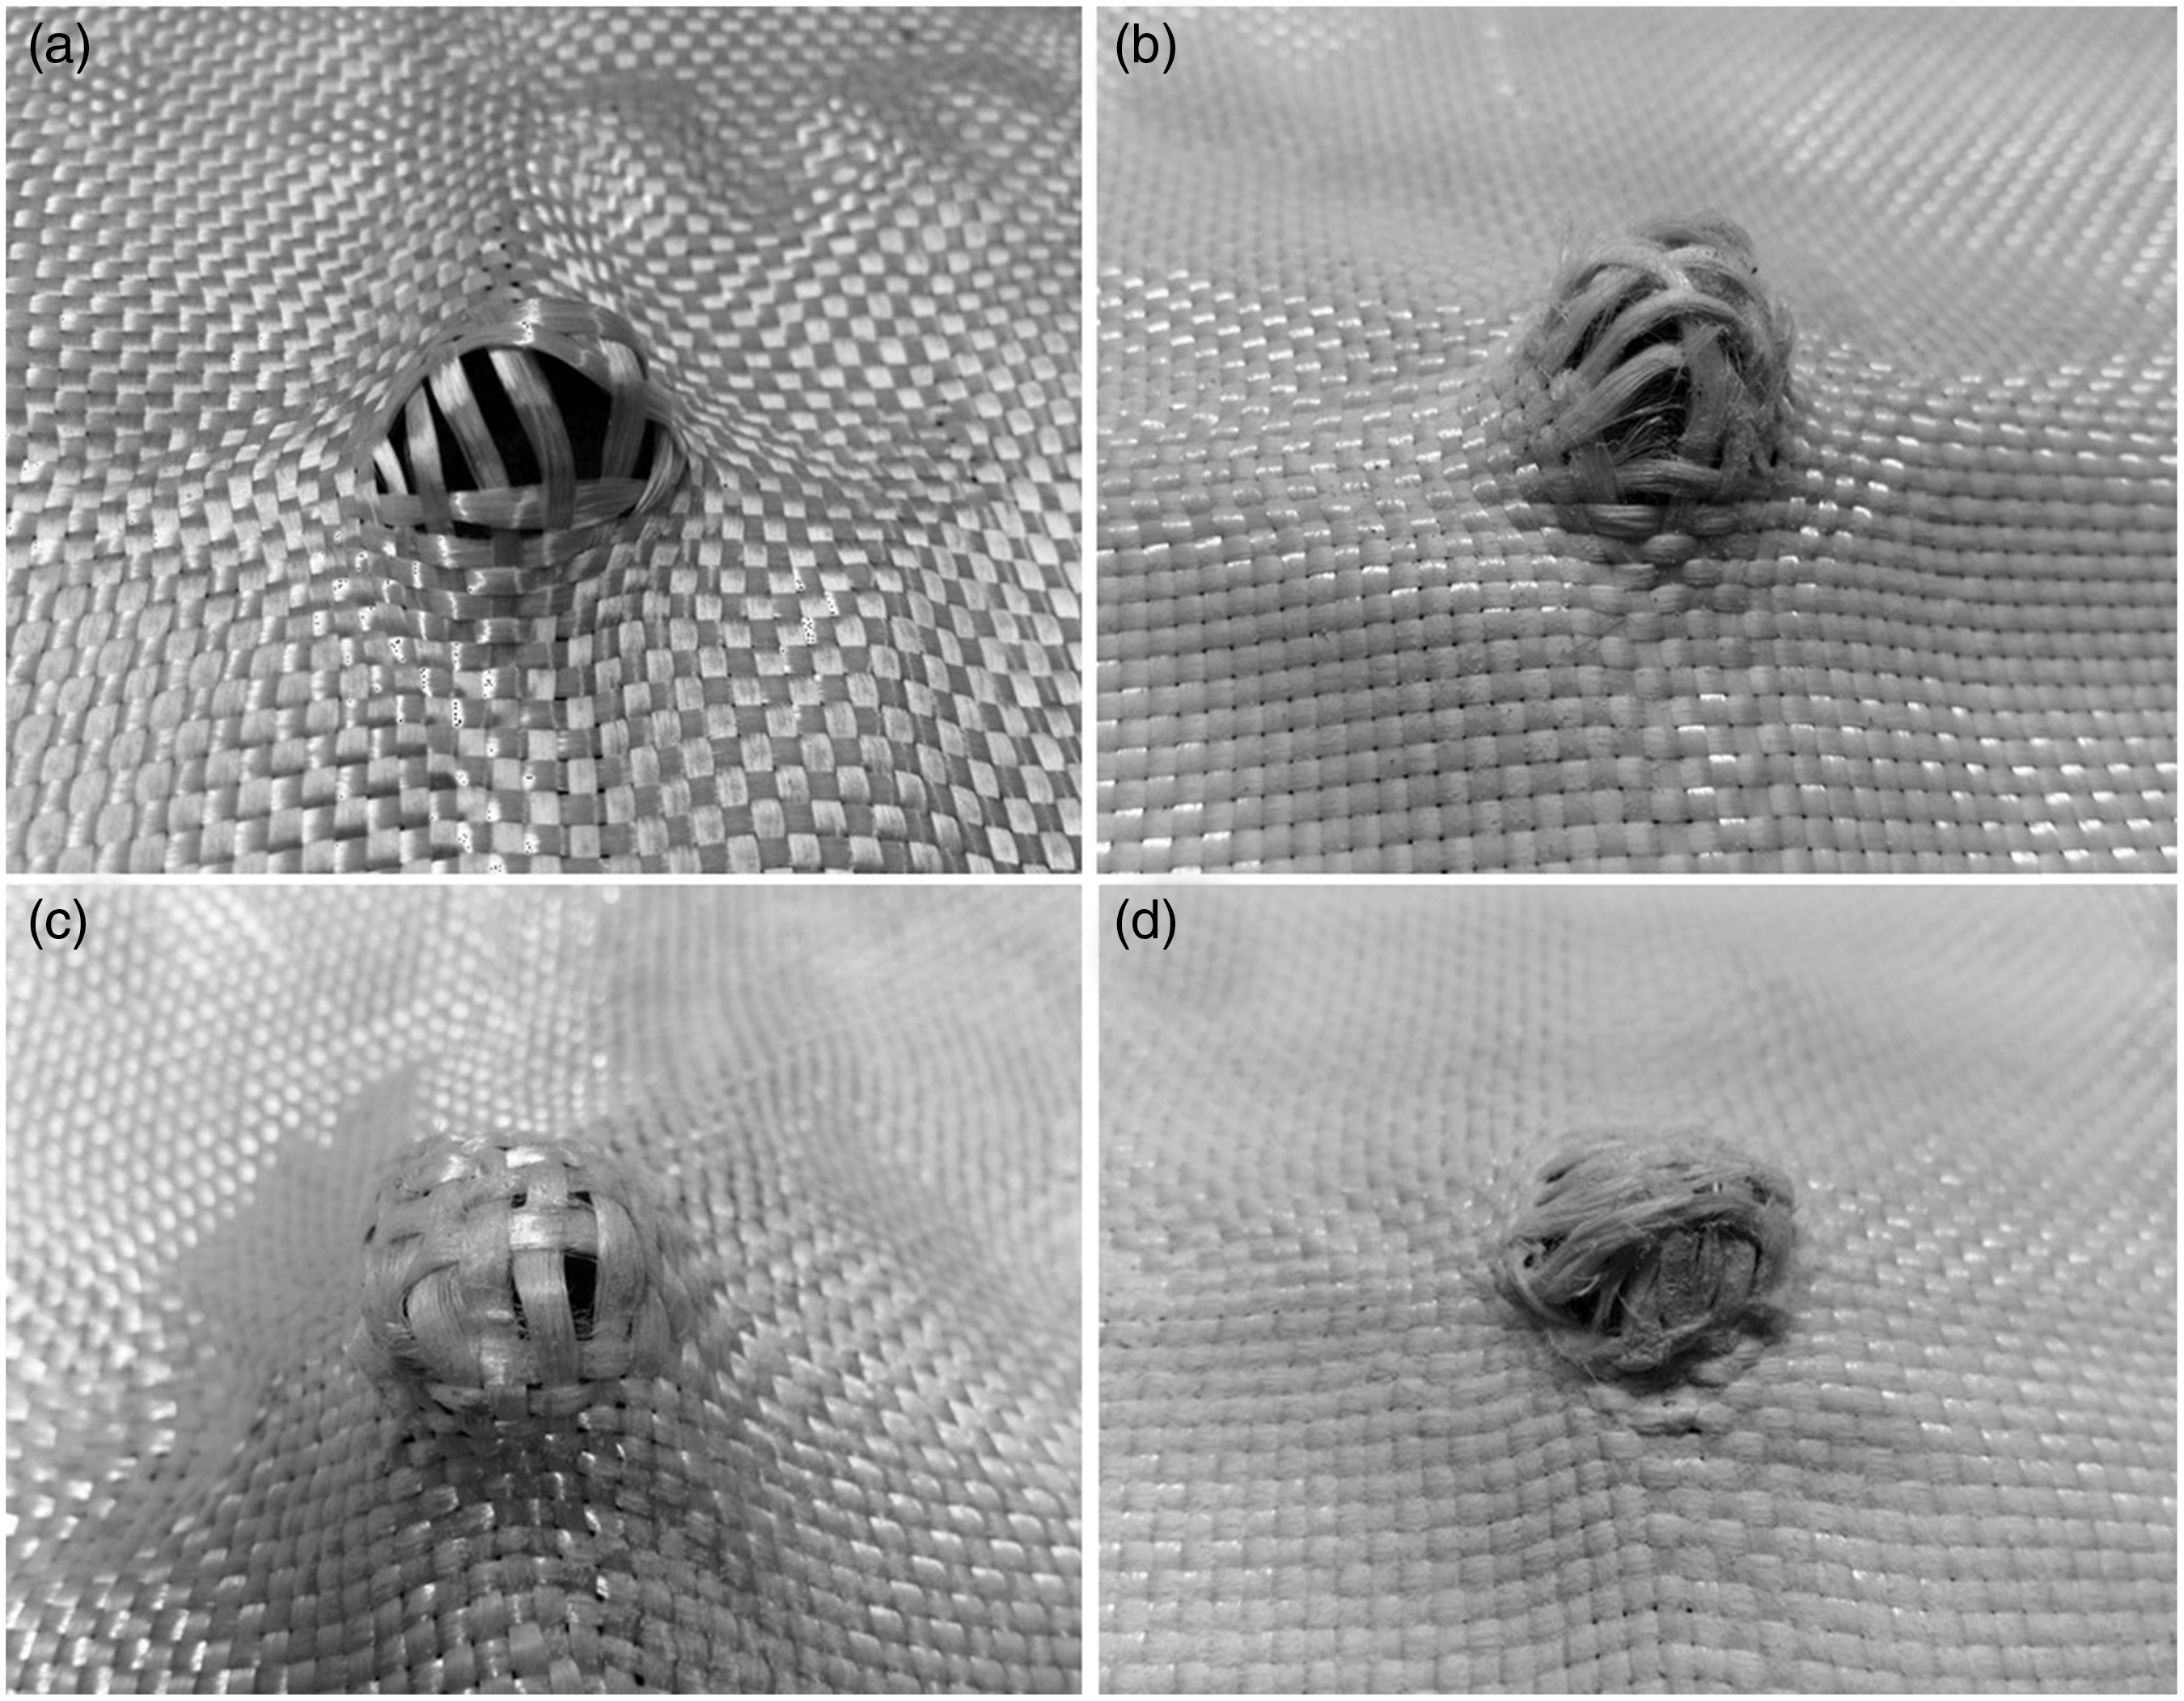
As is evident in Figures 14(a) through (d), the puncture mechanisms including windowing and yarn pull out etc. are observed in all the failed samples. Also, no yarn breakage is seen in the punctured samples. But the manner the neat Twaron has been punctured indicates that the penetrator has created a larger opening with little yarn extraction in the fabric due to pushing aside most of the engaged yarns and pulling out the rest of them; while in the Twaron-STF composites, more engaged yarns have participated in the puncture mechanisms. In addition, with the increase of STF concentration, more extracted yarns are observed, the configuration of yarns and fibers is better preserved and the extracted fiber loops pulled out at the damage zone become much smaller, which mean enhanced puncture resistance and more energy absorption.
It is known that puncture characteristic is highly determined by the sharpness of penetrator. Therefore, it is important to describe how penetrator sharpness affects the puncture characteristics.
By using rounded penetrators at low velocities, it is possible to compare its results to data achieved from utilizing high-velocity penetrators like NATO bullets so that velocity is the only parameter investigated. Also, by using rounded penetrators all puncture mechanisms could be studied. Three mechanisms of fiber/yarn breakage (fracture), slippage (windowing) and yarn pull out are the most important factors affecting fabric puncture. By using rounded penetrators at high velocities, occurrence of all three above-mentioned mechanisms is probable. While in the case of sharp-nosed penetrators, probability of yarn slippage (windowing) is much more than other mechanisms so that pull out and fiber/yarn fracture rarely happened. Previously mentioned content is also true at low velocities with the exception that fiber/yarn breakage does not happen at low velocities. Thus, using rounded penetrators, windowing and pull out mechanisms would be expected at low velocities. However, sharp-nosed penetrators most likely cause yarns to push aside that is not taken into account as a perfect criteria for investigation of puncture resistance performance or energy absorption.
Sharper penetrators more easily penetrate fabric targets, resulting in smaller specific energy absorbed (SEA) than blunt-faced penetrators. Tan et al. observed in their study of plain weave single-ply Twaron CT716 fabric that conical and ogival penetrators perforated the fabric with the least amount of pullout, flat-headed penetrators sheared through the yarn thickness and hemispherical penetrators produced the most yarn pullout. The force required for nylon or Kevlar yarn failure is lesser for a rectangular leading surface than for a chisel-shaped leading surface. The influence of penetrator geometry becomes less significant as the number of plies increases [45].
For example, chisel-shaped and spherical penetrators induce more damage compared to the cylindrical one. Of these three penetrators, the cylindrical one has the largest initial contact area with the fabric, which could help prevent stress concentration as well as help spread the imparted energy through friction. The chisel-shaped penetrator indeed induces noticeably more yarn–yarn and penetrator–yarn friction energy dissipation compared to the spherical one. Spherical and chisel-shaped penetrators exhibited relatively similar impact capability as they both could push yarns away during the penetration process [46]. Another example is fabric failure under the spike impactor which is mainly attributable to the friction between the yarns and within yarns, while the one under the knife impactor is mainly attributable to the strength of the yarns [26].
Conclusion
The results of this study show that STF concentration is one of the important parameters affecting shear thickening phenomena and puncture behavior of STF-treated fabrics under QS loading. By investigating the rheological behavior of STFs, it was determined that the increase in the STF concentration leads to the significant increase in the suspension’s initial, critical and ultimate (up to 104 Pa.s) viscosities, increase in the slopes of the shear thinning and shear thickening regions, reduction of the critical shear rate, critical strain, SRT frequency and the percolation point, increase in the viscoelastic modulus and also the tendency of the suspension to behave elastically and to become more unstable due to the formation of continuous 3-D structures and a better transfer of load. The QS puncture test results indicated that the puncture resistance or the maximum bearable load by the 15, 25 and 35 wt%-treated Twaron composites increases by 132, 315, and 362%, respectively, compared to the neat fabric. Also, the energy absorption during QS puncture test for the 15, 25 and 35 wt%-treated Twaron composites increases by 143, 159, and 209%, respectively, compared to the neat fabric. It was found that the increase of STF concentration leads to higher viscosity of STF intercalated between fibers, higher friction between fibers and between yarns, keeping better fibers arrangement, more consistent, uniform and integrated fabric coating, less gaps, less yarns and fibers sliding, extracting and windowing under QS loading and better stress distribution throughout the fabric and, ultimately, plays effective role in increasing the puncture resistance and energy absorption of Twaron-STF composites.
Footnotes
Declaration of Conflicting Interests
The author(s) declared no potential conflicts of interest with respect to the research, authorship, and/or publication of this article.
Funding
The author(s) disclosed receipt of the following financial support for the research, authorship, and/or publication of this article: This research received no specific grant from any funding agency in the public, commercial, or not-for-profit sectors.