
Abstract
Reinforcement of the thin-wall structures under internal pressure by braiding method has many applications in different industries. In this way, the effective braid angle determination will be important in achieving a stable and resistant structure. The main aim of this work was finite element modeling and experimental validation of these structures under internal pressure. Therefore, a thin silicon pipe as the core was covered with different braid angles in braiding machine and then was subjected to internal pressure. After that, a finite element model was implemented for a repeatable part of the samples as a unit cell using ANSYS software to calculate the pressure–diameter diagram of the samples. Finally, in order to verify the accuracy of the finite element models was recorded the increase in braided pipes diameter up to rupture by camera and prepared pressure–diameter diagram for all samples by image processing method. The comparison of the finite element method results and image processing showed a good agreement with high accuracy. Also was observed in finite element modeling that the relationship between diameter-pressure in 55 degrees was rather linear, generating forces in the pipe surface of thin silicon due to internal pressure along braid strands direction as confirmed by image analysis.
Keywords
Introduction
A braid is a complex structure or pattern formed by interlacing three or more strands of flexible material such as fibre, yarn and wire. Fundamentally, braid is a system of three or more yarns intertwined in such a way that no two yarns are twisted around one another. Nowadays, braiding is used in most industries such as aerospace, military, petrochemical and construction to cover pressure pipes and vessels. Braiding has many applications due to good properties such as high strength, low elongation, suitable formability, ease of recapping molds with various cross-sections, ease of modeling in the finite element software for the prediction of mechanical properties of the created product, no restriction on the angle between the used strands in braiding, etc. Many scientists have studied the mechanical properties of braiding and its application in the pressure vessels. Crane and Camponeschi [1] characterized the mechanical properties of a graphite fibre system braided into panels in which two braid parameters could be investigated. The variables investigated included the effect of edge condition and braid pattern on the tensile, compressive and flexural properties of the braided panels. They also presented an analytical method for modeling the tensile performance of the multidimensionally (X-D) braided composite. Analytical results were used to compare with those obtained experimentally. Finally, to further validate the ability of this material to cope with damage, multidimensionally braided and conventionally laminated panels were impacted and the resulting damage was nondestructively determined. Nakai et al. [2] investigated the mechanical properties of tubular braids with different braid angles in bending and torsion using numerical analysis and solid mechanics. The results indicated that bending rigidity was reduced while the braid angle was increased. Meanwhile, when the braid angle was increased, the torsion rigidity was first increased and then remained firm and constant. Harte et al. [3] investigated the effect of the braid geometry on mechanical properties of the braided tubes, comprising glass fibres in an epoxy matrix. The results of this study indicated that in braid angles more than 45°, the failure mode switches from fibre fracture to neck propagation. In this way, a failure chart was constructed to show the effect of braid geometry on elastic modulus, yield strength, strain to failure and energy absorption of the braid. They also reviewed some behaviours of the braided pipe such as change of the shape and the fracture rate of these pipes. They conducted this theoretical and experimental investigation under compressive, torsional and compressive/torsional combination, and torsional/tensional combination loads [4]. Liao and Adanur [5] successfully performed a 3-dimensional (3D) simulation on tubular fabrics as the strengthening unit in the composite through a computer program. This simulation was very close to reality since the fabric properties were considered accurately through studying the structure of yarn and the accurate dimension of the fiber. Xia et al. [6] provided a precise elastic solution for the tensions and deformation of under internal pressure vessels based on the 3D anisotropic elasticity. Tang and Postle [7] simulated and analyzed the behaviour and type of transformation in the 3D braided composite through the nonlinear finite element method. Tao Zeng et al. [8] demonstrated a new type of finite element method (FEM) in order to predict the local stress and strength within 3D braided composites. Tete et al. [9] investigated the nonlinear behaviour of stress–strain in braid fabrics and concluded that as the braid angle was increased, the nonlinear behaviour was increased too. Omeroglu [10] investigated the effect of design and speed of take-up on the mechanical properties of braids. Kang et al. [11] made a 3D investigation on the geometry of braiding fabric to estimate the mechanical properties of the produced composite. The relationship between the process properties and geometrical parameters was investigated using a computer program. Cheequn et al. [12] assessed changes in braid radius and braid angle of braided composite tubes under tensile loading using stereomicroscope digital image correlation (DIC)-based optical measurement techniques. Using this approach, displacement fields were calculated and 3D surfaces were reconstructed. Ueng et al. [13] characterized stainless steel/nitinol braid coronary stents. They used a stereomicroscope to observe the cut section, scanning electron microscope to examine the treatment for sharp points of the fibers and Image Pro Plus software to analyze braiding angles and metal cover rate.
One of the most important issues in braiding is determination of the suitable braid angle to achieve desired mechanical properties. According to the final function of the product, this angle is determined. In the production of thin-wall vessels under internal pressure by braiding, determination of a suitable braid angle due to the production of stable and resistant vessels is of particular importance. Therefore, it is attempted in this paper to develop an appropriate model to predict the properties of braided thin-wall vessels using ANSYS software. Also, by applying internal pressures, the suitable braid angle has been obtained. Then, the model has validated by producing braided wall vessels in different angles in the laboratory and testing pressure under constant condition.
Materials and methods
Materials and sample preparation method
Material specifications of the base part.

Material specifications of the yarns.

The mechanical behaviour of the reinforced yarns was tested by Zwick universal testing machine -144660 based on ASTM D2256-02 [14] test method. The gauge length was 250 mm and the crosshead speed was set to be 210 mm/min. In this case, 30 specimens were tested. The average results are shown in Figure 1 and Table 3.
Polyester yarn testing results. Material specifications of the yarns.

To produce 2D braided reinforced pipes, silicon pipe was entered from centre of machine within tubular braiding machine with 16 carriers and was covered by polyester yarns on carriers. Its properties can be seen in Table 2 with different braid angles. The used tubular braiding machine is shown in Figure 2.Schematic of braided pipes with different braid angles is shown in Figure 3.
Tubular braiding machine. Braided pipes with different braid angles.

Cylindrical thin wall structures theory under internal pressure
In the thin-wall structure under internal pressure, the wall of the pipe acts as a membrane. So, the wall of these structures is not resistant against bending. As shown in Figure 4, in a thin-wall pipe with two closed ends under internal pressure, hoop stress (a normal stress in the tangential direction) ( Hoop stress and axial stress in the thin-wall pipe with two closed ends under internal pressure [15].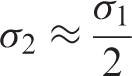

FE modeling of the braided thin-wall pipes by ANSYS
A pressure test method in the braided samples was initially investigated by FEM in order that developed results by FEM model have been confirmed by experiments. The FE model was developed in the ANSYS 15.0 environment. According to Table 1, the virgin constitutive behaviour of the material was elastic isotropic (for only silicone type pipe without yarns). For modeling the braid only some yarns with elastic orthotropic behaviour were added. The 16 polyester yarns were used to provide the braid samples. The material behaviour of the polyester yarn is provided by Figure 1 and Table 2.
Unit cell preparation
Besides a specimen in the virgin state (without yarn sample), some other samples with yarn material properties were prepared for pressure test method to validate the proposed FEM method. Regarding symmetry of the model, it simulated only one repeatable part of each braid (Unit cell). The unit cell size was based on the braid angle. Figure 5 shows the element specifications and schematic view of the Unit cell in the FE model. The dimensions of the unit cells based on braid angles are shown in Table 4. The material model implementation is currently limited to in-plane, quasi-static analysis. According to Figure 5(a) and (b), 448 shell63 and 32 link1-2D spar elements from ANSYS elements library were used to mesh the models. Boundary condition in the model was restricted in the centre of the unit cell. Force applying conditions are shown in Figure 5(c).
Element specifications and schematic view of the Unit cell. The unit cell dimensions.

FEM calculation of the braided pipes diameter under internal pressure
In addition to the global sample response during the pressure test, displacements in x direction were calculated at specific points 1 and 2 (see Figure 5c) and transformed to diameter variations at different pressures for validating the FE model prediction. Such data were compared to calculated diameters obtained by image processing of the deformed sample pictures. The results of the FE model and image processing in 55 degrees braid angle at different pressures can be seen in Figure 6. As can be seen, the typical The internal pressure vs. pipe diameter in the FEM and image processing results in 55 degrees braid angle. The typical longitudinal strain 

Experimental evaluation of the internal pressure versus braided pipe diameter diagram
In order to conduct internal pressure test a compressor and a structure for installing camera, barometer and braided pipes was used. Designed structure and its connections to compressor are shown in Figure 8.
Various views from designed structure for the internal pressure test.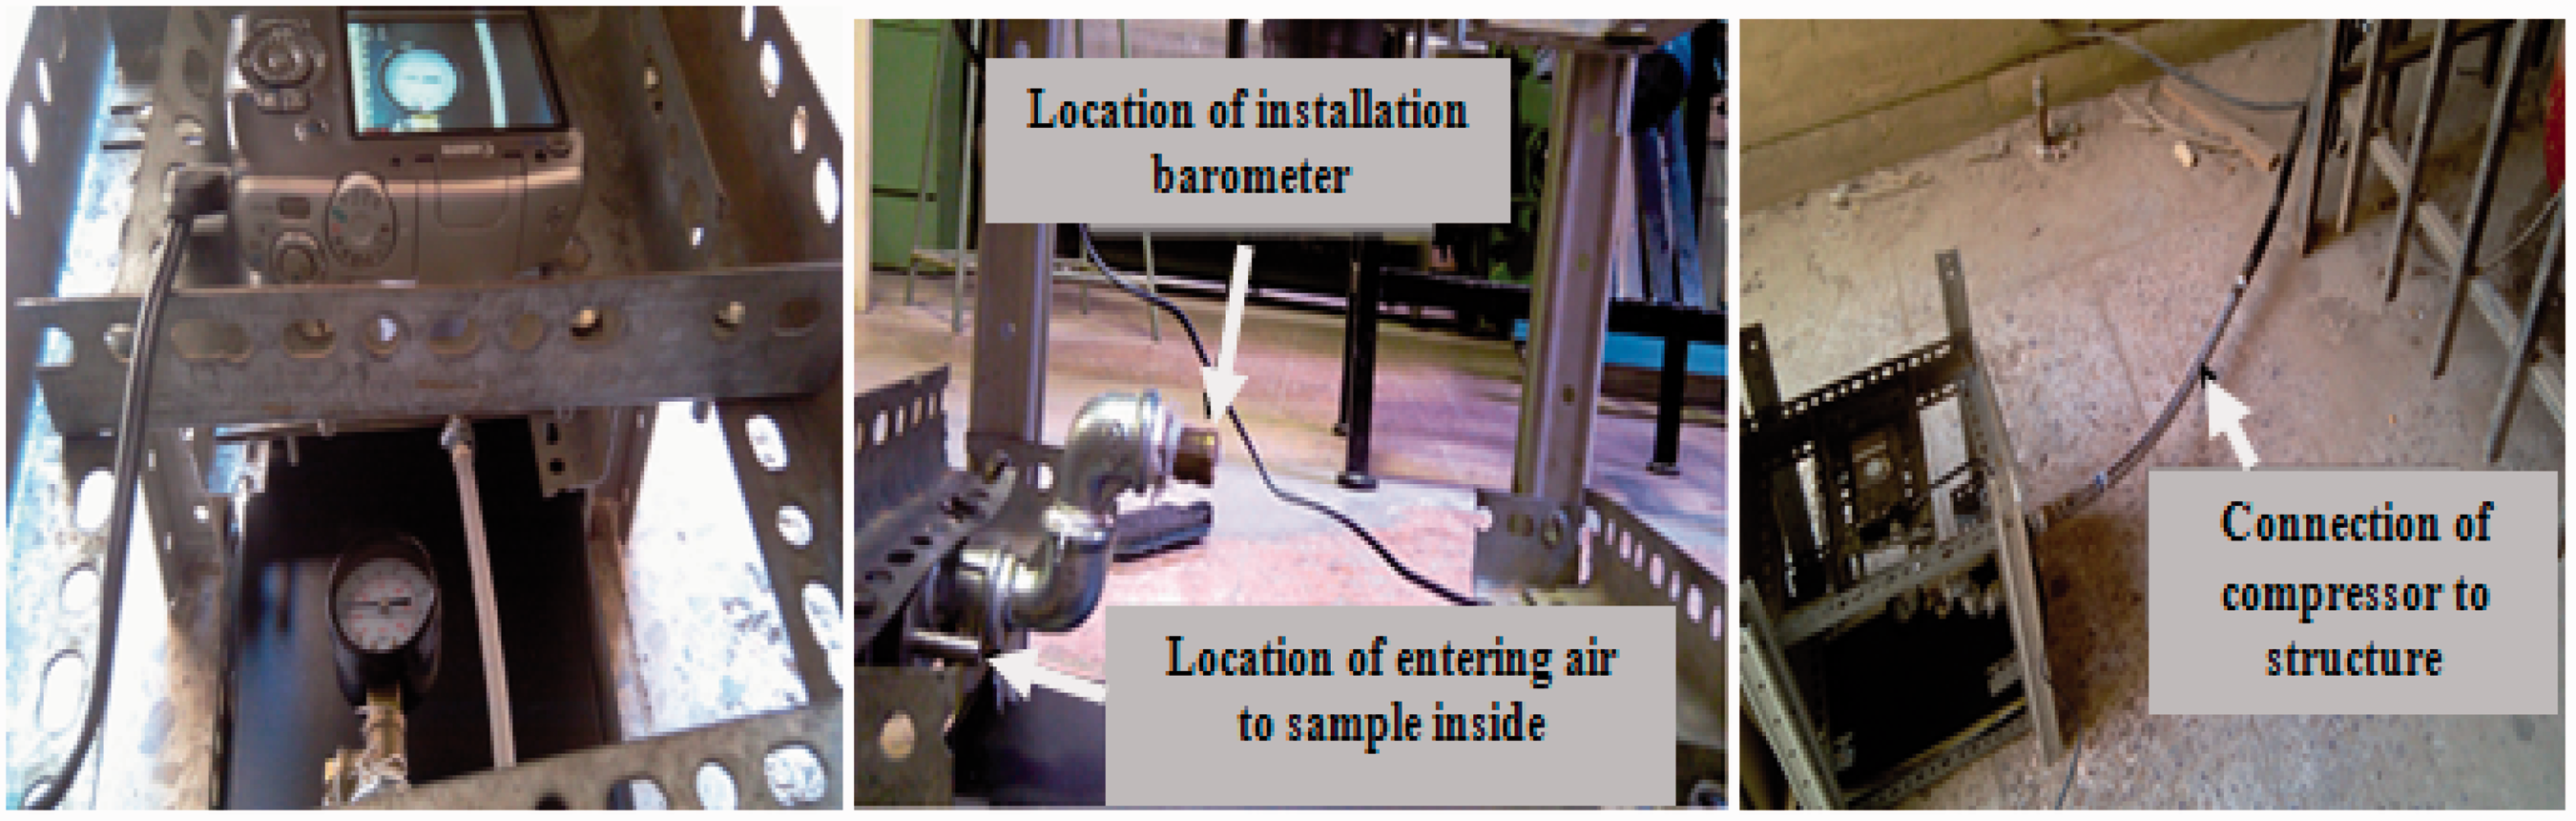
After the installation of the sample on structure and its connection to compressor, as shown in Figure 8, the sample was slowly filled with air by a constant rate until rupture. All these changes including the change in diameter and pressure were registered by the camera. Finally, every 10 seconds, a frame was derived from each film. By using image processing technique, the average diameter of the sample together with the air pressure in the sample at that time was read. Following the data extraction on diameter and air pressure in the sample for each frame, the air pressure–diameter diagram was drawn for each sample.
Results and discussion
FEM response of 2D reinforcement pipe models at various braid angles
The FE model results (
As shown in Figure 9, based on unit cell geometry and FEM results, it was found that the braided yarns could help to bear the internal pressure and therefore, there were the minimum strains around the yarns. With increasing the internal pressure, the model shape was changed and this effect was intensified. According to unit cell geometry and Figure 10, with increasing the braid angle from 23 to 55 degrees, yarn displacement (Ux) in points 1 and 2 was decreased. Furthermore, with increasing the braid angle, the yarns had a better effect on internal energy absorption in hoop direction and there were opposite effects on pipe axial direction.
Yarn displacement (Ux) contour maps of the samples (a) braid angle 23°, (b) braid angle 39° and (c) braid angle 55°.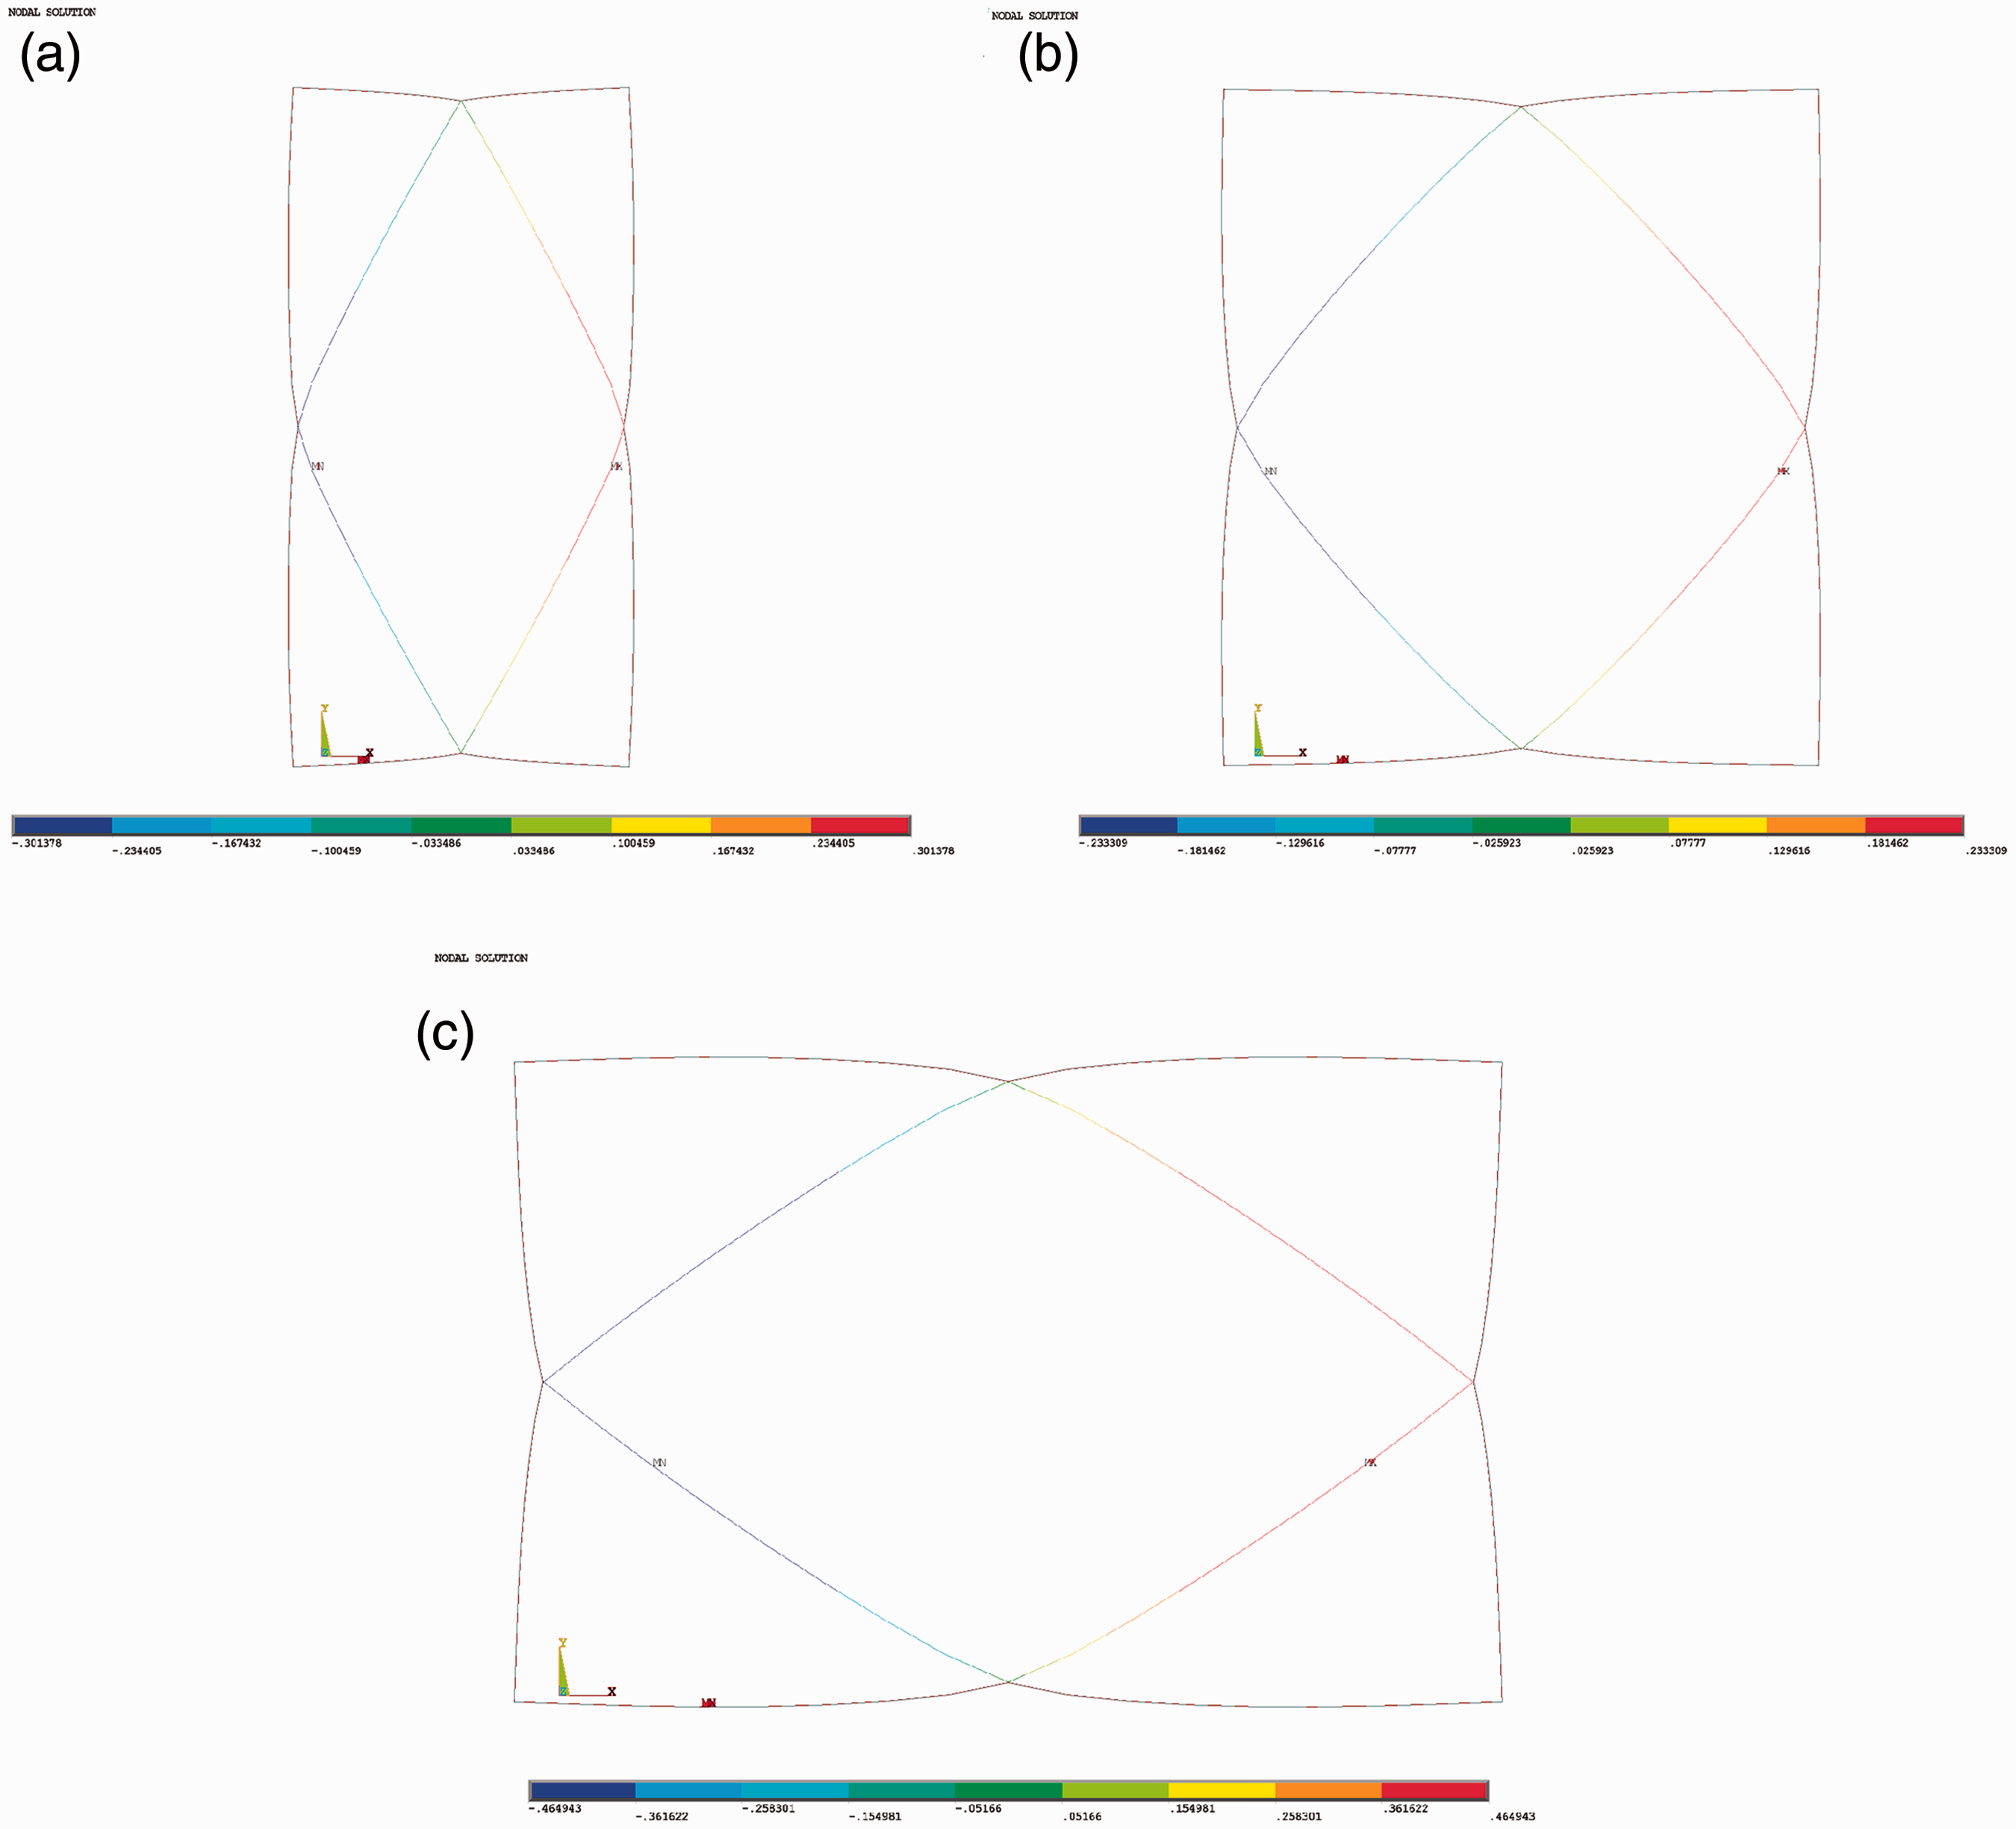
The FEM results in various braid angles with increasing the internal pressure are curved in Figure 11. The slope of the curves was decreased with increasing braid angles up to 55 degrees. The braided pipe with 55 degrees braid angle had more effect on the reinforced pipes in comparison with the other braid angles because of the maximum energy absorption of the yarns. This phenomenon is shown in displacement counter map of 55 degrees braid model in part (c) of Figure 10.
FEM response of silicone pipe and 2D reinforcement braided pipes at various braid angles.
Experimental response of the pipes at various braid angles using image processing method
In this study, a thin-walled silicon pipe was used as the core and braiding yarns for covering this thin-walled pipe. Meanwhile, braiding with five different braid angles were used to evaluate the braid angle effect. After this stage, a structure was designed to test the internal pressure and the samples were placed on it. The diameter started to increase in a fixed rate due to the increase in the internal pressure. The behaviours of the samples up to the failure point were recorded by a digital camera. The pressure–diameter diagrams are shown in Figure 12. As can be observed in Figure 12, the sample without yarn was ripped and failed in the minimum pressure and maximum diameter conditions. Internal pressure in failure point was increased with braid angle growing up, however, the pipe diameter in failure point was decreased with increasing it. Figure 12 shows that the pressure–diameter of the sample without yarn was almost parabola and with increasing braid angles, it moved slowly toward a linear relationship between pressure and diameter. In the angle of 55 degrees, it can be observed that the pressure–diameter diagram was almost linear. This means that in 55 degrees, all forces created on the surface of thin-walled pipe were along the braid yarns and thus, pipe diameter increase was completely controlled. In other words, in 55 degrees, the rate of increase in diameter and pressure was constant to the failure point.
Experimental response of silicone pipe and 2D reinforcement braided silicone pipes at various braid angles using image processing method.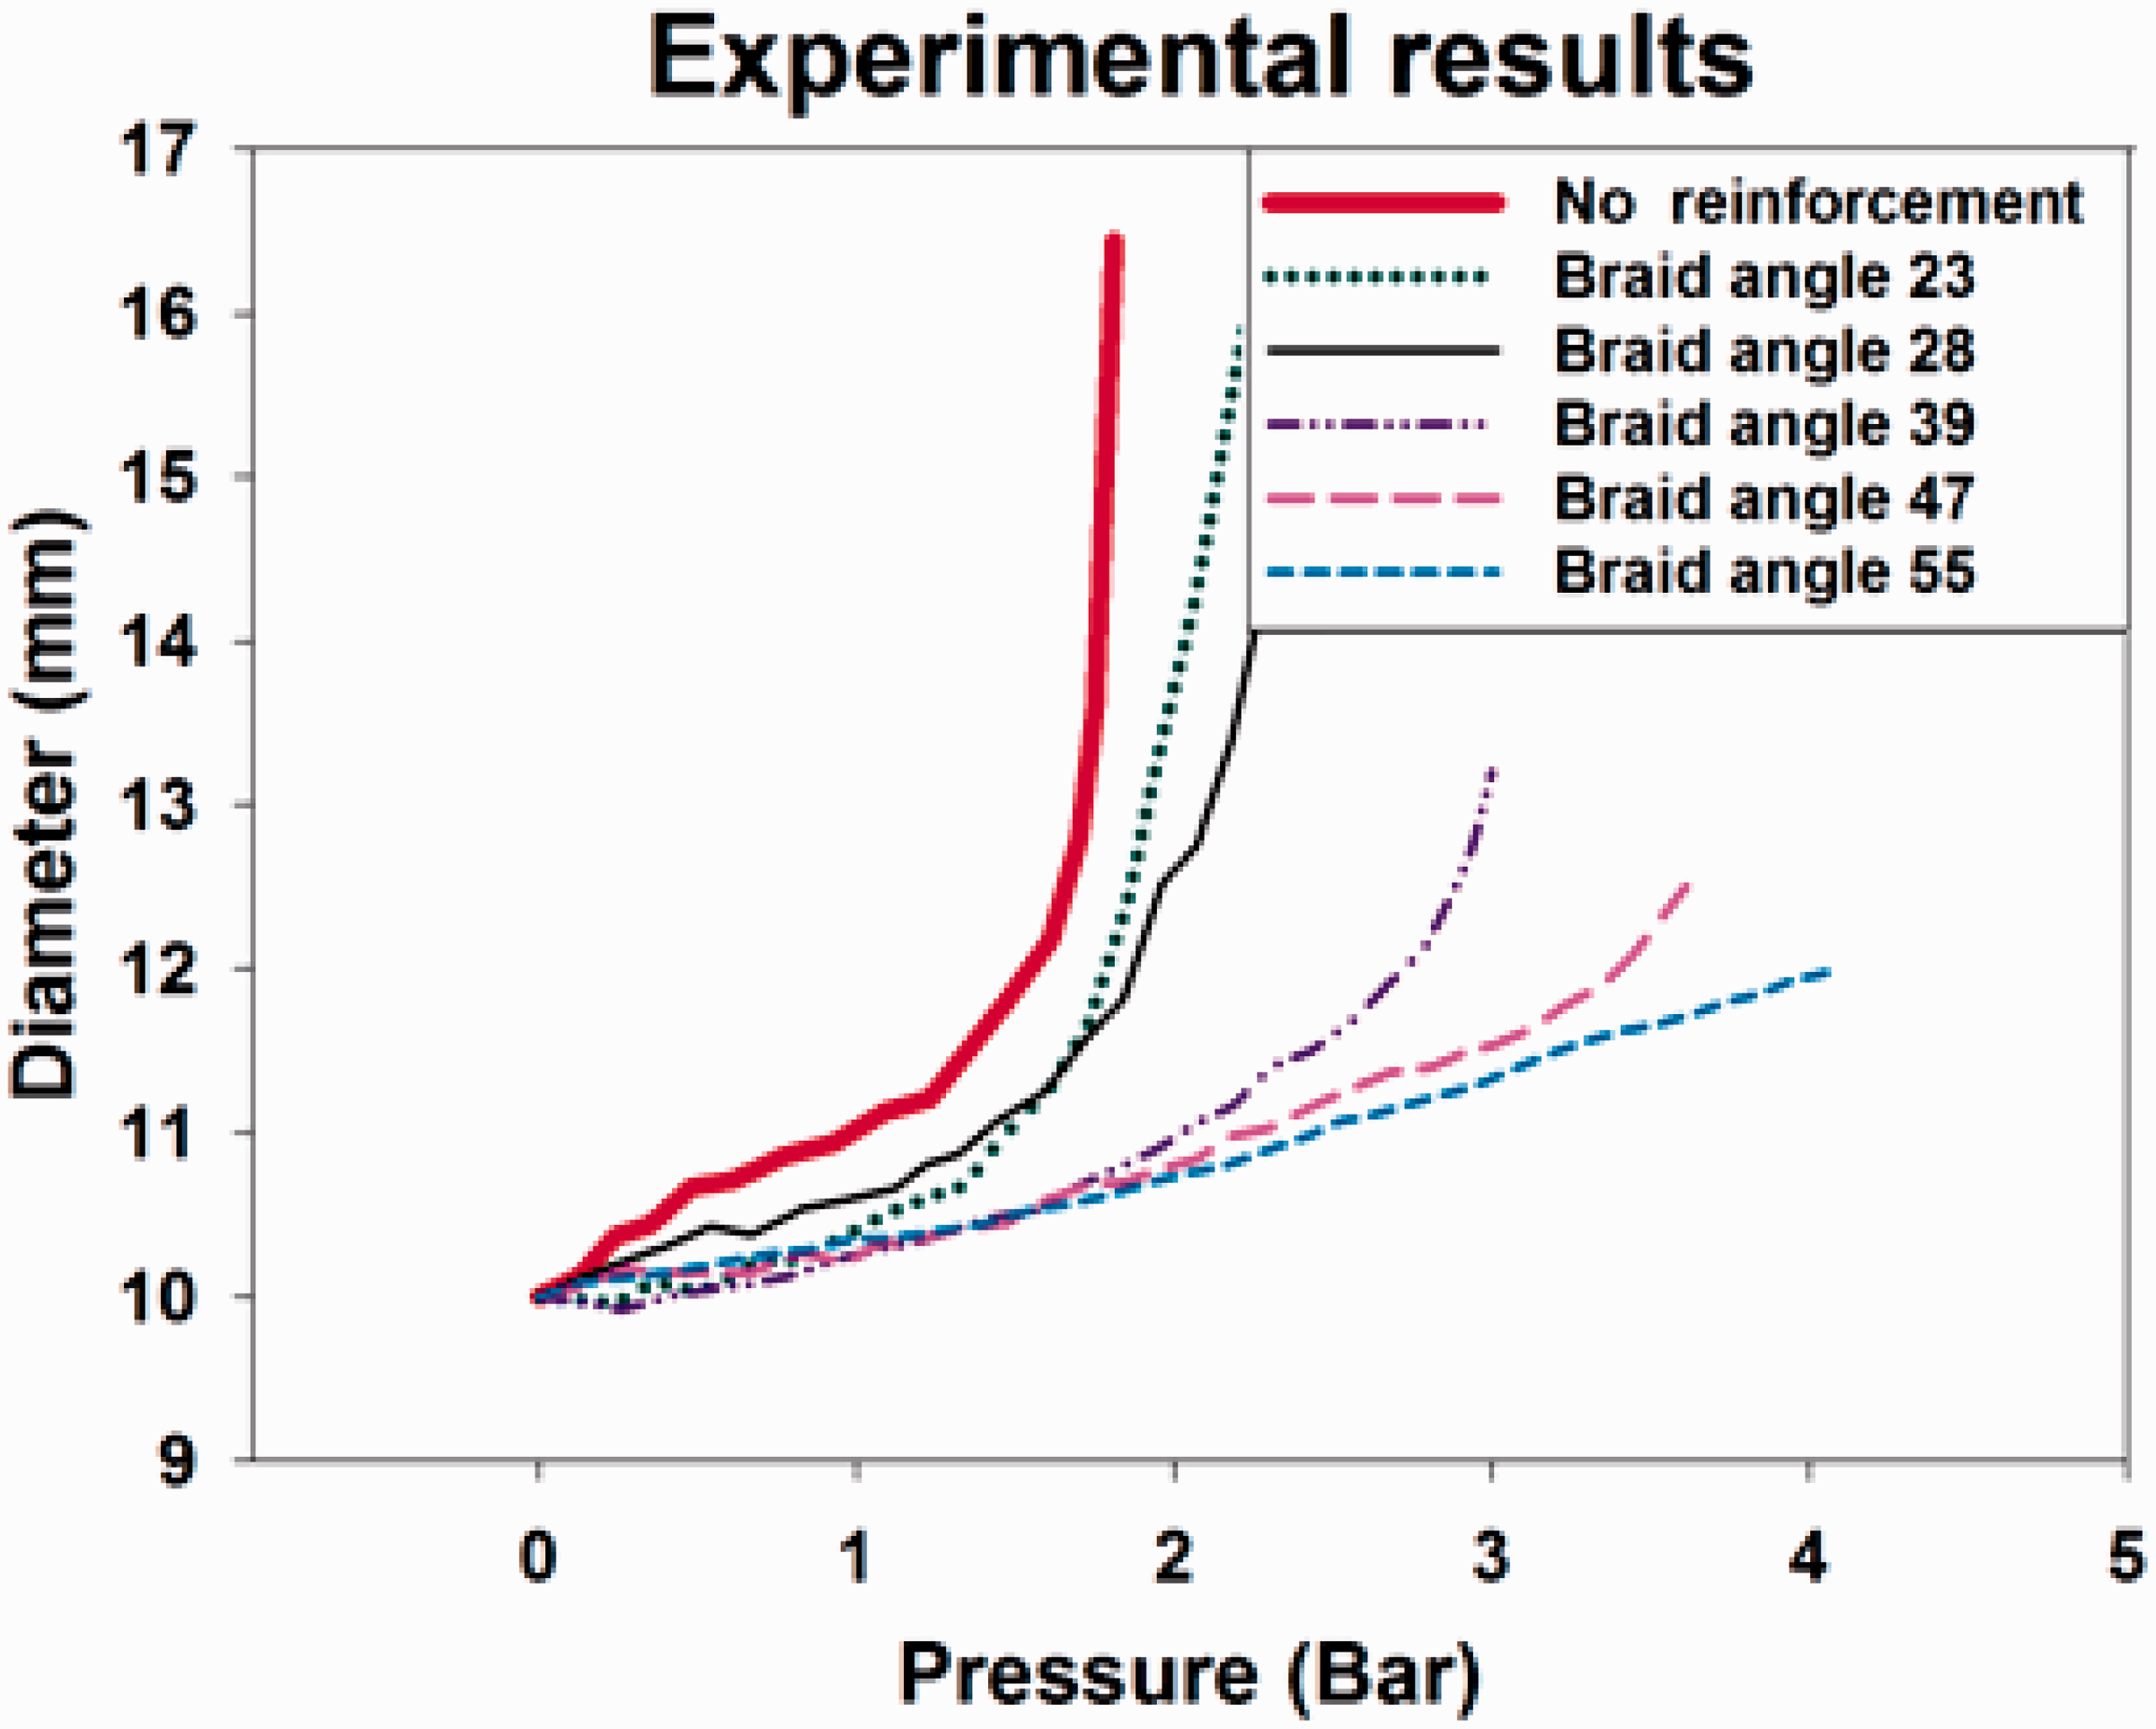
FEM vs. image processing results at various braid angles and virgin sample
Figure 13 shows the comparison of the diameter values obtained by FEM analysis and image processing with increasing the pressure values. According to these diagrams, the FE model predictions were linear, showing a good agreement with image processing values up to a specific internal pressure.
Comparison of diameter values obtained by FEM analysis and image processing.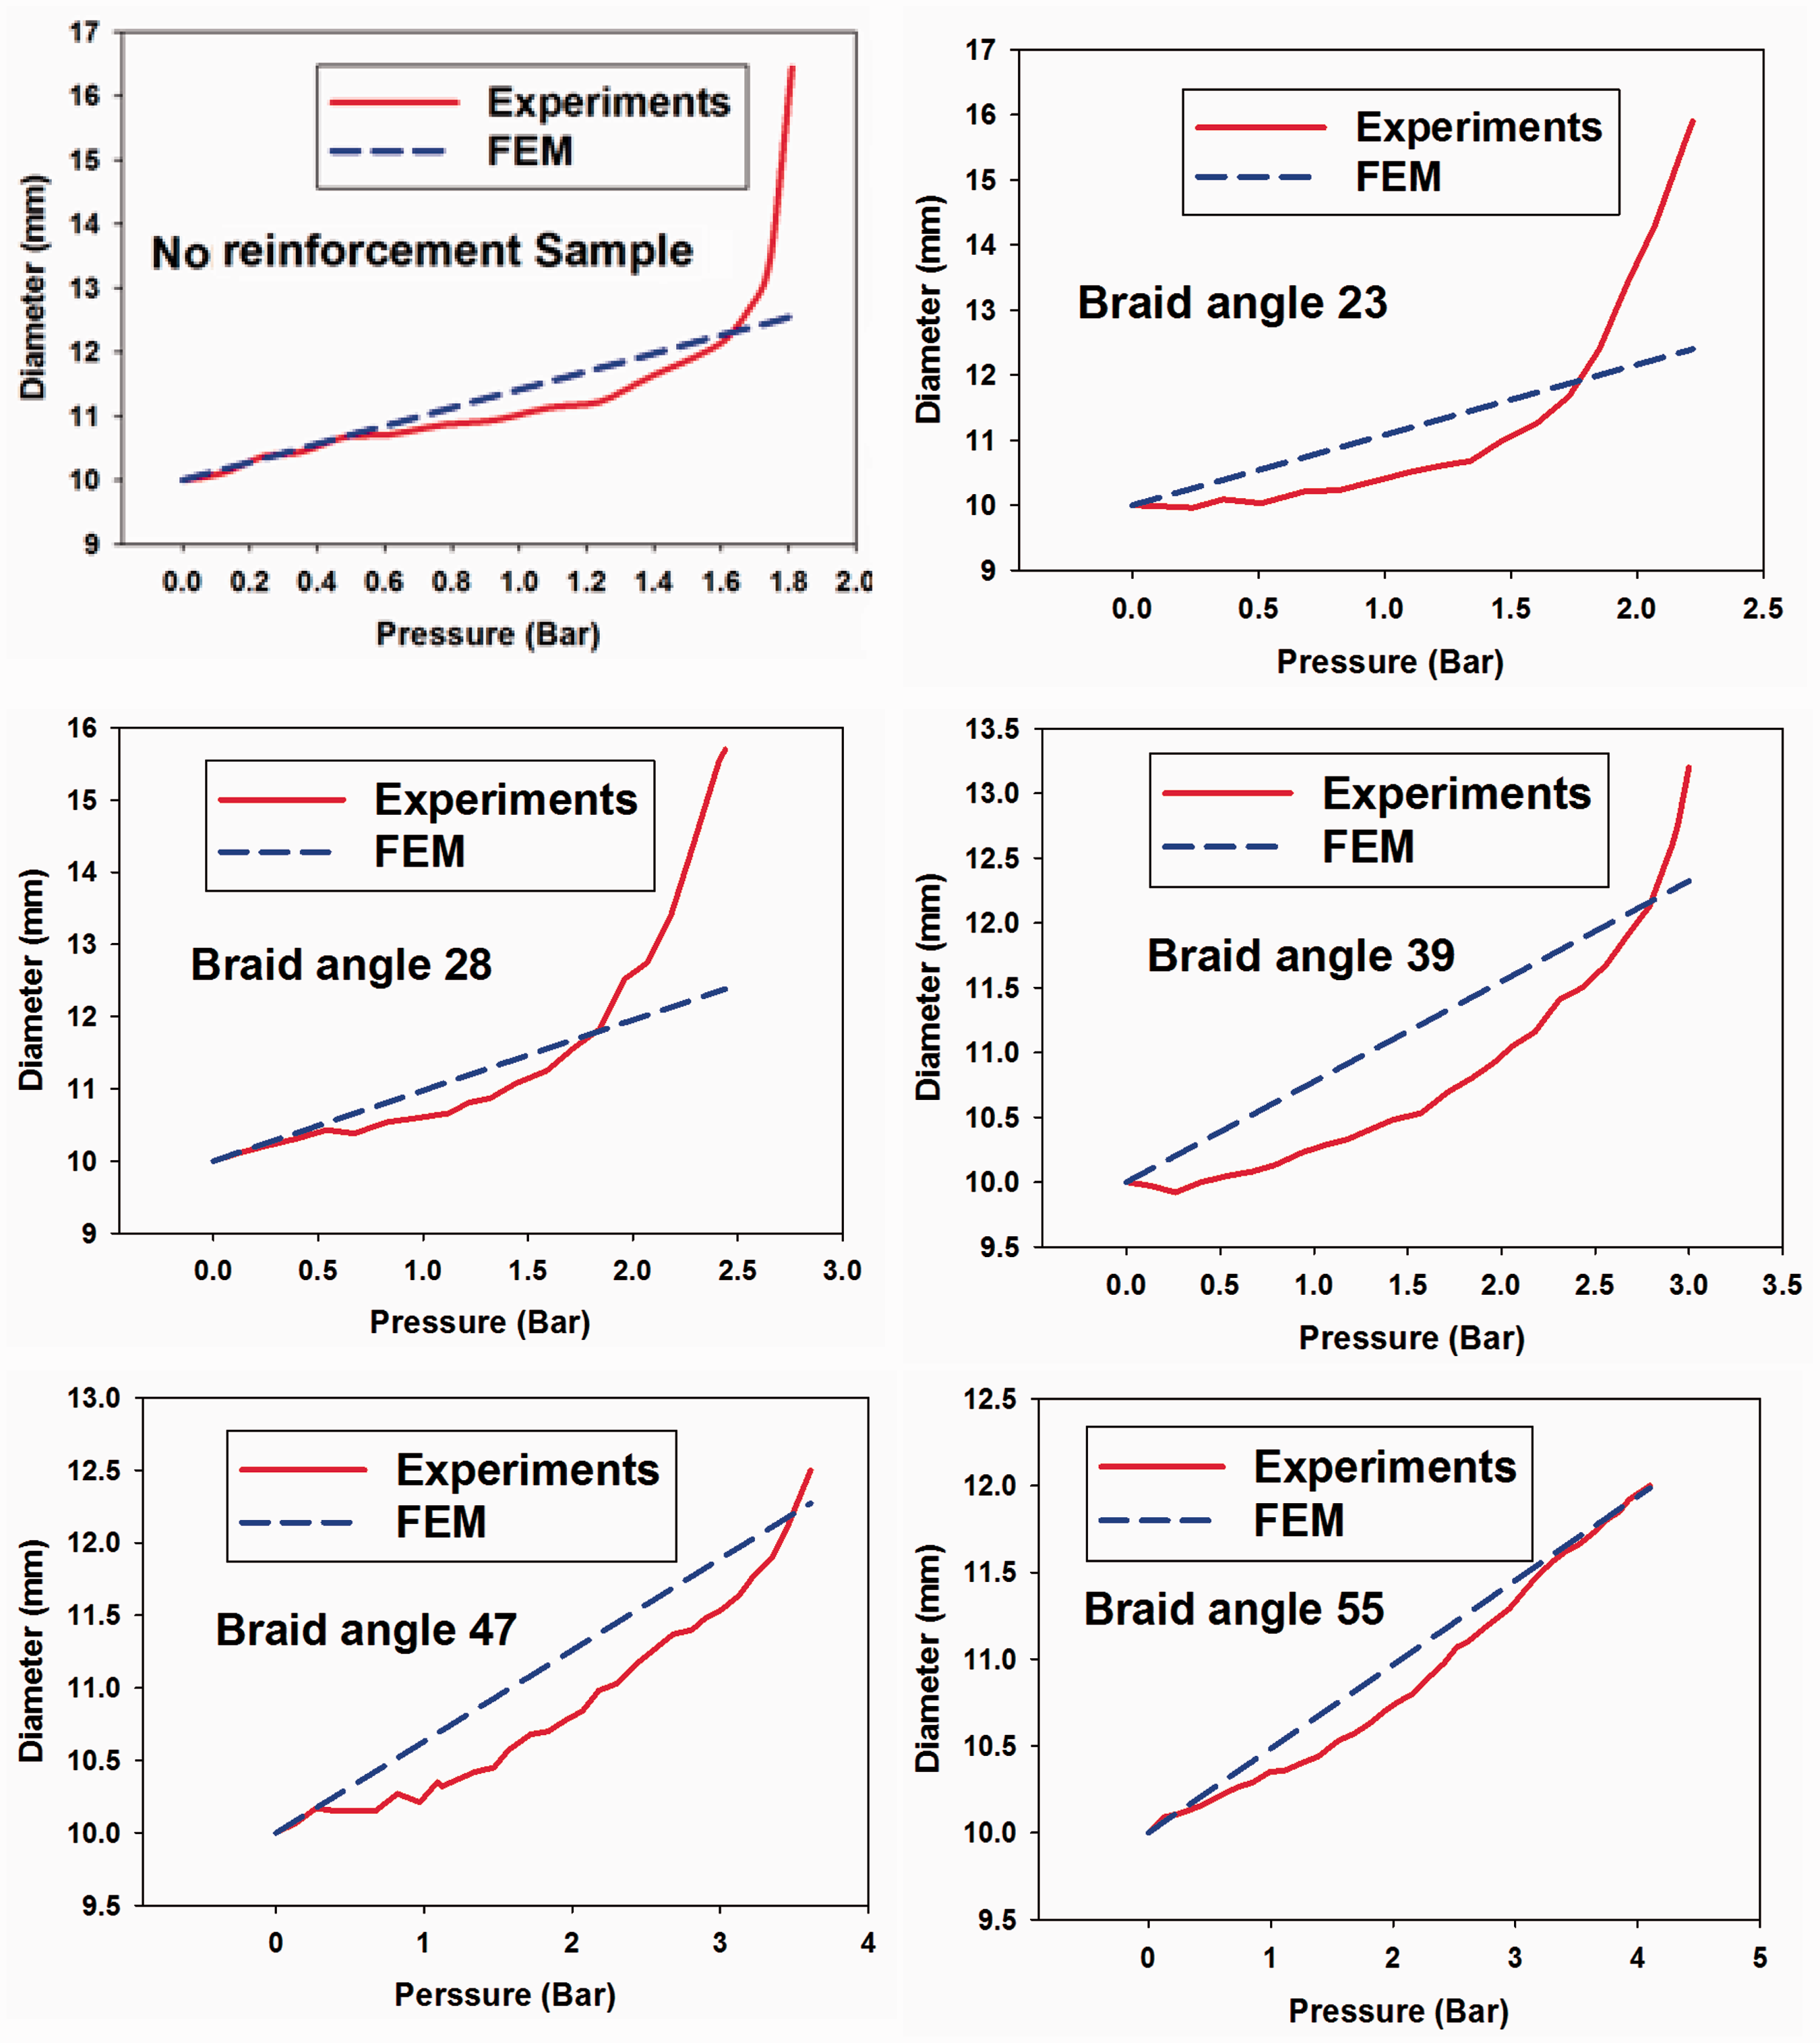
As shown in Figure 13, the pressure levels at the intersection point of the FEM and experimental curves were increased with the growth of the braid angle. It was found that with increasing the braid angle, experimental results went to linear status up to 55 degrees braid angle. After the intersection point, two curves went on to be far from each other because of some nonlinearity in materials and some source of errors in models like yarn-to-yarn and yarn-to-silicon interaction.
Conclusions
This study investigated the effects of yarn braid angle of the 2D reinforcement braided thin wall structures on the global mechanical properties under internal pressure. Based on the results obtained, the following conclusions can be drawn:
A mesoscopic FE modeling strategy was developed for the thin-wall pipes in its no reinforced and 2D reinforced braided conditions with various braid angles based on a designed unit cell approach. The mechanical properties of the raw materials (i.e. silicon pipe and polyester yarns) were obtained by mechanical tests implemented into FE models. The mechanical properties of the thin wall pipes in the no reinforced condition and 2D reinforced braided conditions with various braid angles were obtained by extensive mechanical tests based on a new suggested image-processing method. The FEM-based numerical method was assessed by the simulation of the internal pressure-pipe diameter tests on thin-wall pipes and validated by companion experiments. The comparison showed that the experimental results on all specimens were close to FE model results. It was concluded that model could predicate the 2D reinforced pipes with high accuracy. FEM predictions and experimental results revealed that the yarns had a better effect on internal energy absorption in hoop direction with increasing the braid angle up to 55 degrees. However, there was the opposite effect on pipe axial direction. After the intersection point as shown in Figure 13, two curves were far from each other because of some nonlinearity in materials and some source of errors in models, such as yarn-to-yarn and yarn-to-silicon interaction. The pressure levels in the intersection point of the FEM and experimental curves were increased with the growth of the braid angle. It was found that with increasing braid angle, experimental results went toward the linear status up to 55 degrees braid angle.
Future work will investigate the effect of material nonlinearities on FE model and reduce the model errors by improving the yarn-to-yarn and yarn-to-silicon interactions.
Footnotes
Declaration of Conflicting Interests
The author(s) declared no potential conflicts of interest with respect to the research, authorship, and/or publication of this article.
Funding
The author(s) received no financial support for the research, authorship, and/or publication of this article.