
Abstract
A weaving process simulation of fabrics, used as fibrous reinforcements in composite applications, is presented in this article. The mechanical modelling of textile structures requires an accurate geometric representation of the woven elementary cell including complex interlacements of yarns and compactions. Using an explicit finite element solver, this paper proposes to mimic the kinematics in the weaving process of an industrial dobby loom in order to produce virtual textile samples whose geometry is driven by weaving loom parts. Different assumptions on the yarn geometrical and material law behaviour are initially taken from the literature to fit to the modelling of an E-glass yarn inserted in a 2D woven fabric. After several simulations, yarn parameters have been adapted to reproduce the observed cross-sectional shapes leading to a higher level of geometrical accuracy. The primary focus of the study has been on a 2D plain weave fabric with E-glass yarns. As a result, it can be observed that the geometry of the simulated yarns is quite similar to the coated samples achieved on real dobby loom using the proposed kinematic model.
Introduction
For periodic materials, as fabrics, there are a lot of mechanical approaches to compute the behaviour by homogenization techniques achieved at a representative scale denoted REC in this paper [1–7]. Several studies (devoted to 3D warp interlock fabrics) have highlighted significant differences (up to 30%) between homogenised constitutive laws and tensile tests performed on fabric samples [8–10]. Such differences can be explained by un-precise geometrical descriptions of the RECs, including the yarn interlacing paths and the cross-sectional shapes [11–13]. It has been noted that a bad representation of reinforcements orientation can affect the material position and therefore the homogenised REC stiffness [2,14].
Moreover, inter-penetrations between yarns are recurring problems experienced in software packages devoted to the fabric RECs designing [15,16]. The software package WiseTex [17–19] contains a textile pre-processor based on the principle of minimum energy to calculate yarn trajectories and their resulting cross-sectional shapes (assumed to be constant, although their size is allowed to vary). In the software package TexGen, the yarn trajectories are defined by spline curves linking sets of master nodes. Sherburn et Al. [20] proposed a method to generate spatial textile models in TexGen together with a commercial finite element software, using an energy approach. At a microscopic scale, Durville et al. [21–23] have proposed a refined modelling of yarn behaviour for 2D and 3D warp interlock fabrics.
Another strategy, used by several authors, consists in designing fabric RECs that best fit tomographic images performed on resin-coated reinforcements [3,11,16].
At the end of the weaving process, all of these approaches tend to reveal the fibrous structure complexity. However, yarns are subjected to significant loads during the weaving process which affect their positions inside the fabric. Their transverse properties, due to contact with the mechanical parts of the loom and friction with other yarns, are also affected. Unlike studies conducted in braiding [24] or knitting [25], few numerical tools are focused on weaving [26].
In the present study, the designing of fabrics is addressed with a new approach by setting up an explicit finite element scheme that mimics the dobby loom weaving process. The virtual fabric samples, resulting from some simulated main production steps, fit quite well the geometry of the real counterparts obtained on a Dornier loom (HTVS 4/S) [27].
A brief review of the main production steps involved in the weaving process is given in the first section of the paper. The second section describes assumptions made within the yarns and the modelling of the main mechanical parts of the loom involved in the fabric manufacturing. The third section is divided into two parts. The first part describes some numerical fine tuning aiming at refining the virtual woven samples with reasonable CPU time consumption. The second part provides some geometrical comparisons between virtual fabric RECs and real counterparts through some simple geometrical criteria as width and thickness of the cross-section. The comparison is conducted on a 2D plain weave pattern.
Basic kinematic motions of the weaving process
The weaving of two orthogonal yarns (the warp and weft yarns respectively) occurs in a precise area of the loom (Figure 1(a)) allowing the shed motion, the filling insertion and the reed beat up. The kinematic of the weaving process can be described by three main steps:
(a) scheme of the fabric forming area on a simplified weaving loom, (b) shed motion, (c) insertion of the weft yarn, (d) beat up of the weft yarn.
Step 1 (Figure 1b): Selection of each heddles, involving the motion of warp yarns, into two positions (up or down). The obtained angle between these two warp yarns planes gives the shed value.
Step 2 (Figure 1c): Pick-in of the weft yarn (filling) inside the shed.
Step 3 (Figure 1d): Compaction of the weft yarn in the fabric from the weaving reed beat up.
Evidently, the main loom mechanical parts that are in contact with the yarns, and hence involved in the fabric manufacturing, include the reed, the heddles and the temples (prevent the weft from narrowing). The proposed simulation tool that reproduces the three main production steps will focus on these devices of the existing weaving loom available in our laboratory.
Numerical model assumptions
Simulations of the manufacturing and forming processes are mostly conducted with numerical schemes in explicit or implicit methods [28,29]. Although explicit schemes are less precise than implicit ones, in the sense that there is no equilibrium correction after each loading step, the contact treatment is simpler and more robust with the explicit approach. Since one of the objectives of the intended numerical tool is to mimic the interlacements of threads in the fabric forming zone, simulations will be conducted with an explicit solver in the finite element software Radioss [30].
Yarn modelling
The produced fabrics are made up of 300 Tex (E-glass density ρ = 2.6 g/cm3) E-glass yarns twisted at 25 turns/meter (Table 1). The Figure 2(a) depicts a broadly circular cross-section (of 0.6 mm mean diameter) of a resin-coated yarn coming straight from the loom, located at halfway between the reed and the heddles. Although yarns contain numerous fibres in contact, they will be modelled by a 3D continuum media with a transversally isotropic elastic constitutive law. The elastic properties, summarised in Figure 3(b), and taken from [3] will be used. As discussed in the following section, such a choice leads to a very satisfactory geometrical modelling of the fabric samples. Yarn friction is described by a Coulomb's law with a coefficient equal to 0.3 [31–33]. For the mesh, eight-node hexahedra elements were used (Figure 2a). A good compromise between CPU time, and an accurate geometrical description of the weft and warp yarns interlacing, is achieved by meshing the cross-sections with 16 elements.
The industrial dobby loom. Elastic parameters refinements. Textile parameters of E-glass fabrics.


Reed, heddles and temples modelling
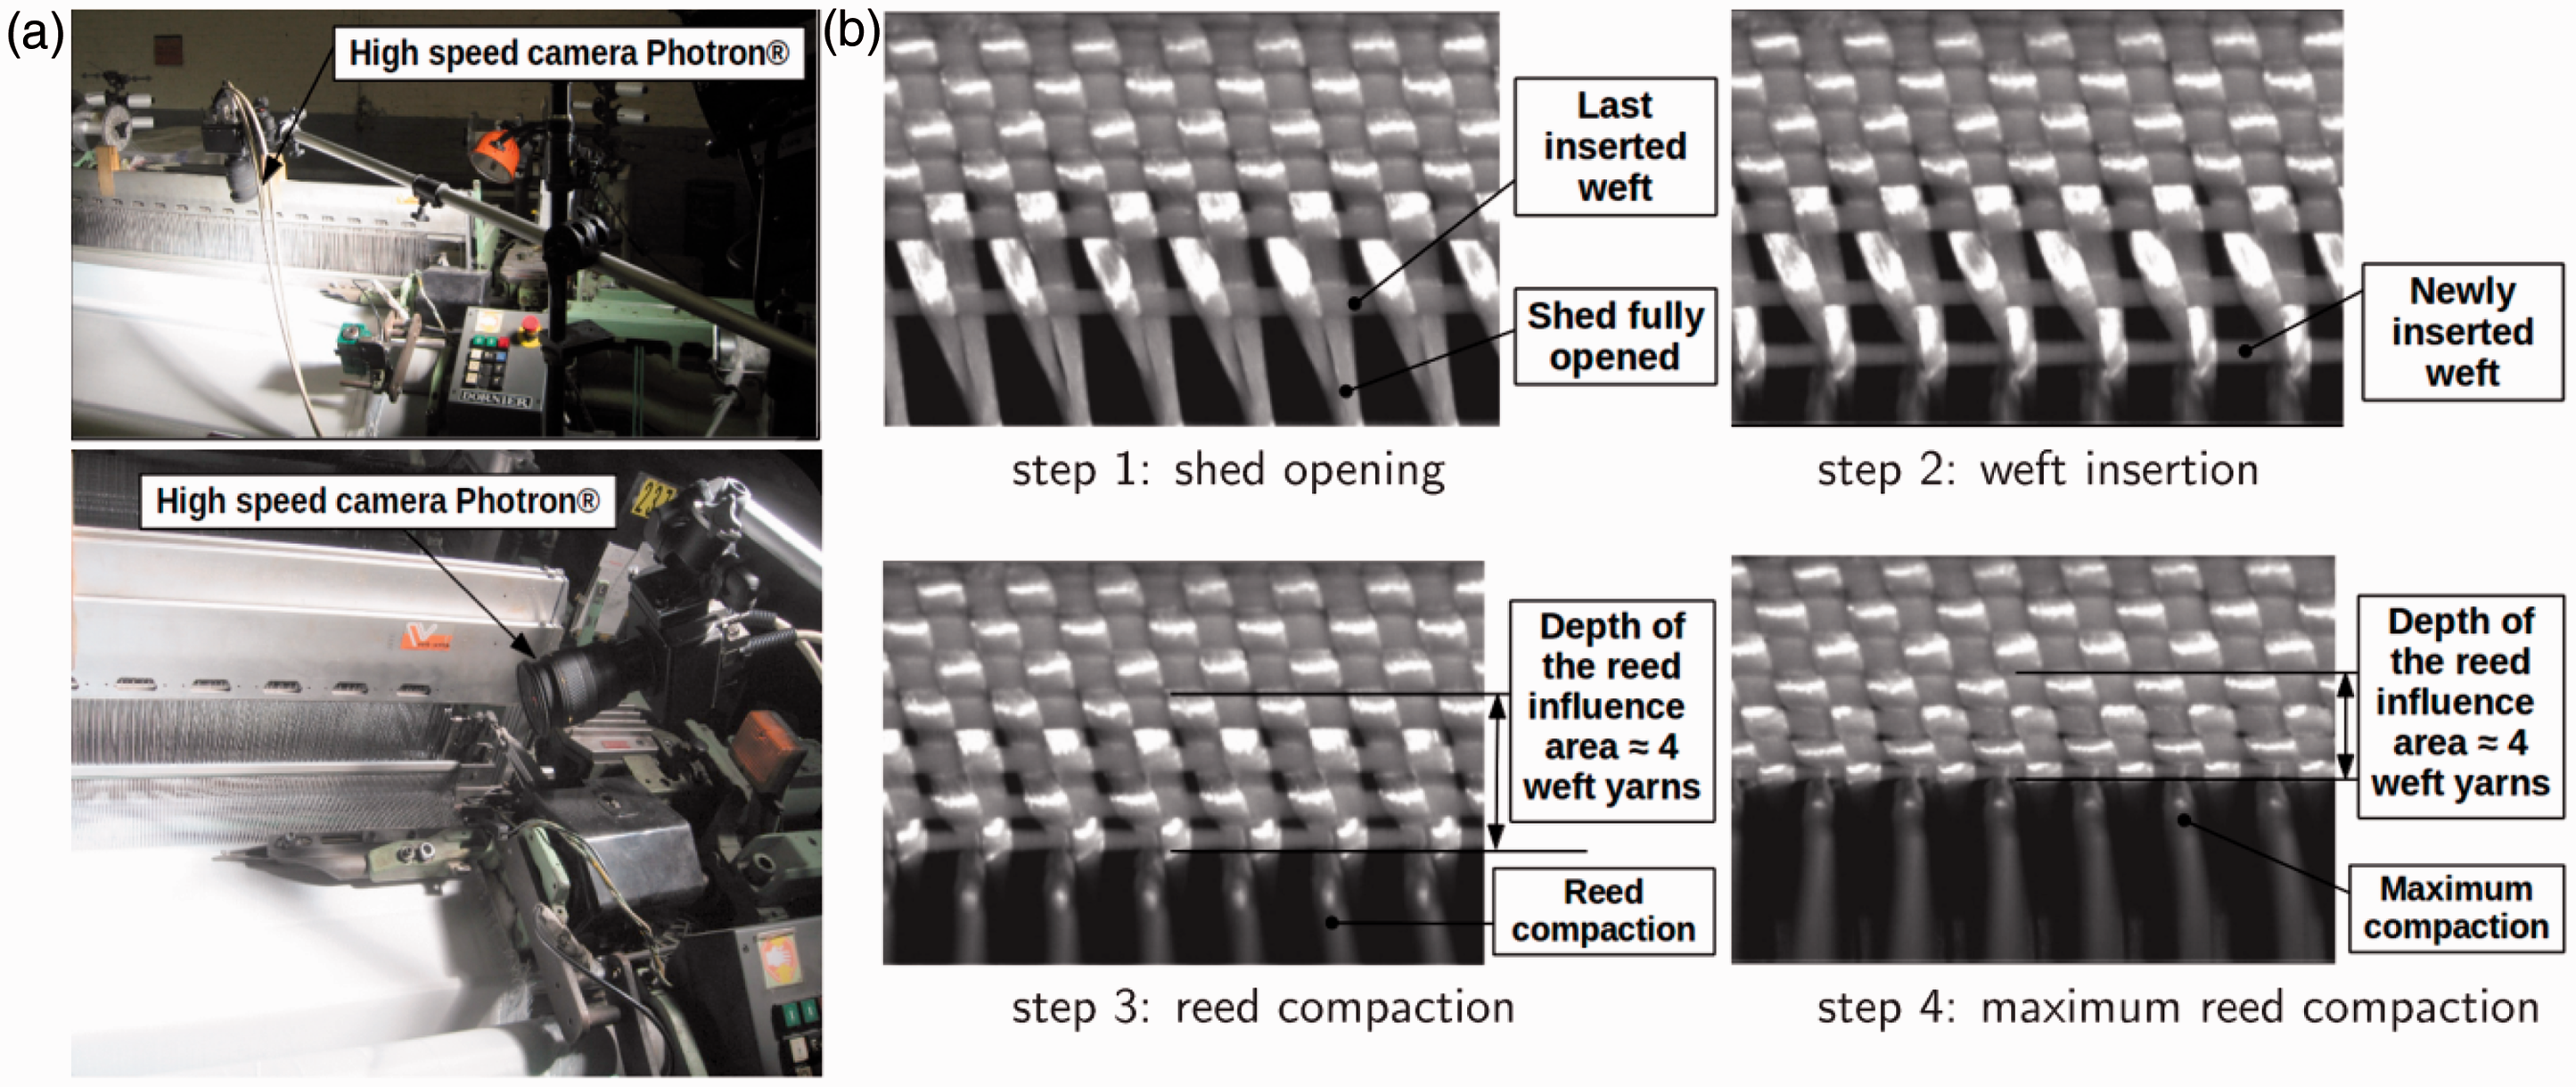
The reed is modelled by a steel plate meshed with eight quadrilateral elements on which a periodic horizontal motion has been imposed to mimic the weft yarns compaction (Figure 4a). Furthermore, monitoring the weft insertion with a high-speed camera (Figure 5) reveals that the reed influence layer, during the beat-up, spreads over four weft threads only. Beyond this area, yarns remain unaffected. A suitable choice involves to model the fabric-forming line (Figure 4a) through a clamped rigid plate that stops weft yarns as the reed is beating-up. Thus, the numeric weaving process is expected to stabilize beyond few weft insertions as discussed in the next section.
Numerical model setting up. (a) yarns, reed, heddles, temples and fabric forming line modelling and (b) weaving cycle at 100 RPM. Tracking of a weft insertion with a high-speed camera. (a) high-speed camera and (b) tracking of a weft insertion (top view).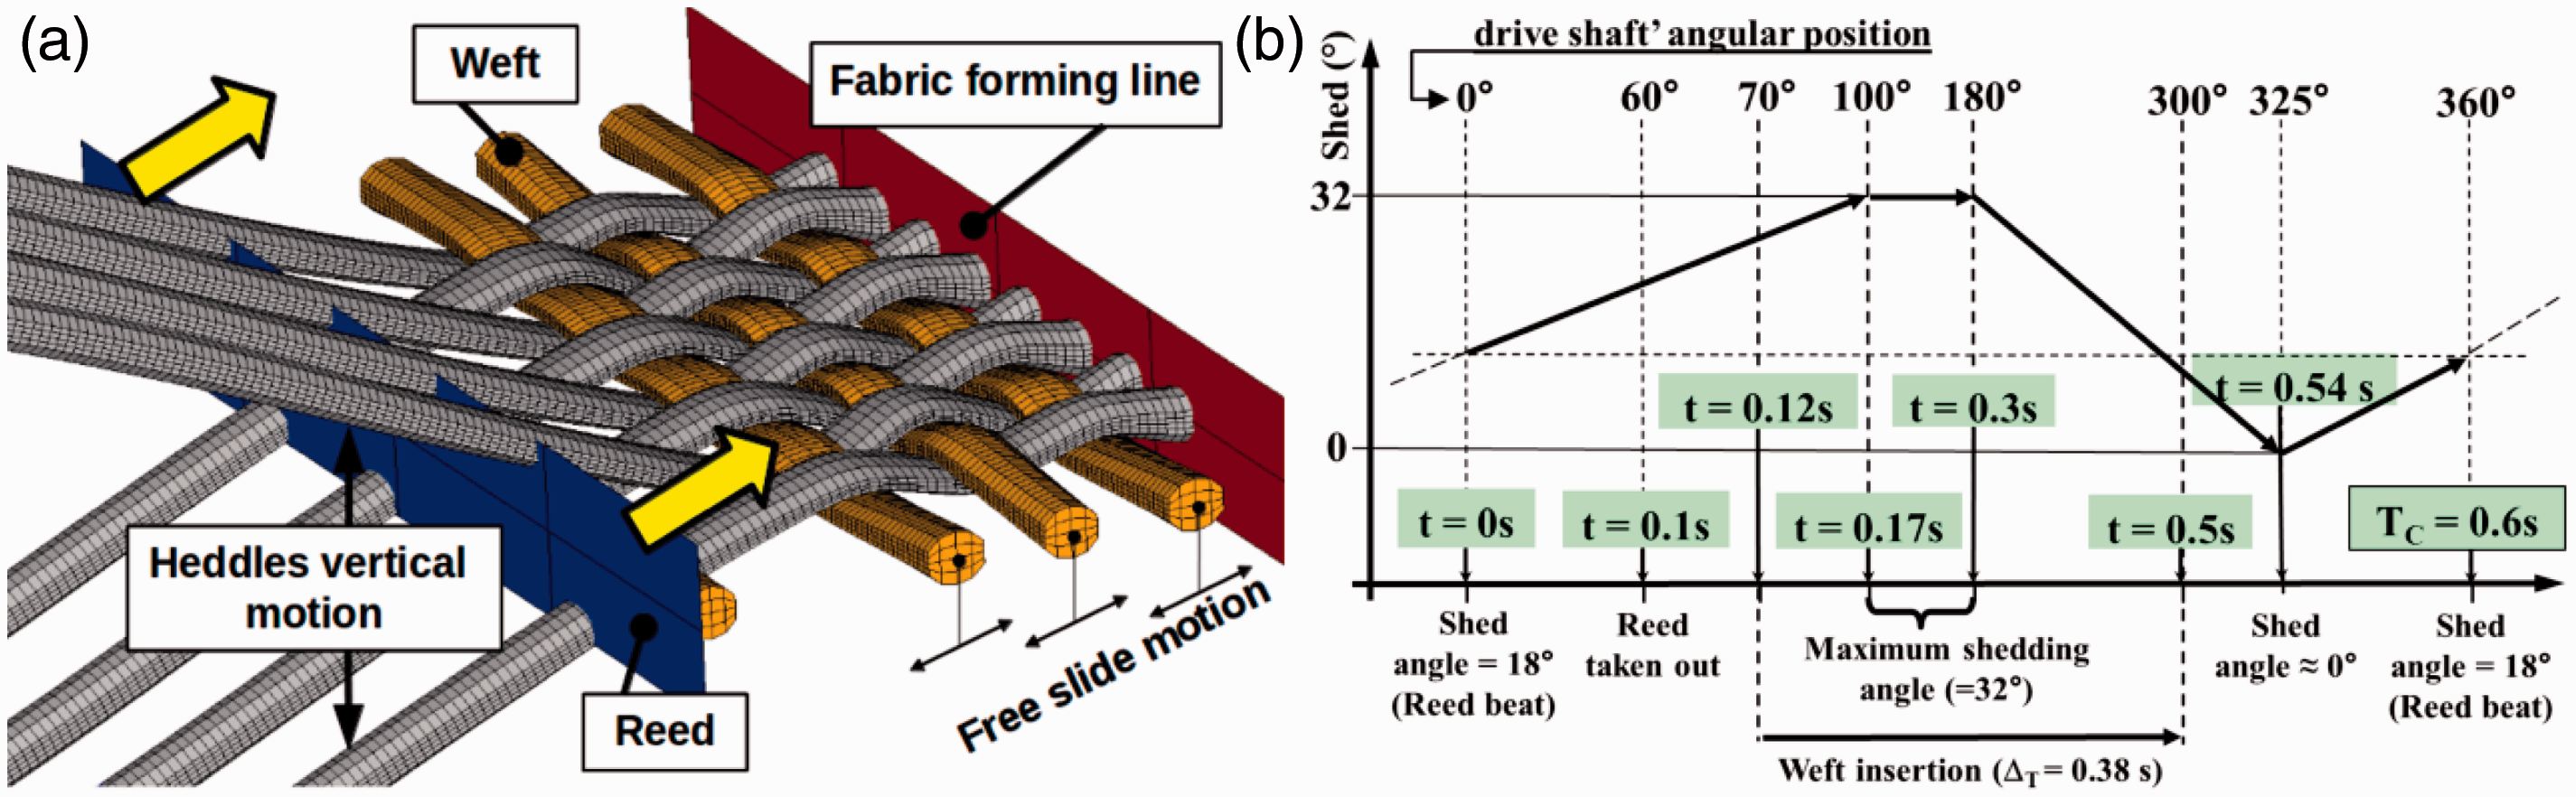
The heddles are not modelled, but the resulting fabric pattern is obtained by imposing the vertical motion sequence of heddles on node sets belonging to the warp yarns (Figure 4a). The kinematics of the weaving process are taken from an industrial dobby loom (Figure 2b). A typical weaving cycle, which lasts TC = 600 ms, for a 100 r/min drive shaft's angular velocity (100 rounds per minute) is depicted in Figure 4(b). As the yarns constitutive law is independent of strain rates, numerical tests showed no significant changes in the resulting geometry of the fabric samples for a decreasing cycle length that reaches 1.5 ms. Such a technique leads to a substantial drop in the CPU time consumption. For instance, the required computing time was approximately 24 hours, while at real speed the computing lasts almost 3 weeks (with 16 CPUs at 2.7 GHz) to model the production of a woven fabric made of eight warp and four weft yarns. This specific point will be addressed in the following discussion.
The temple (stretcher) actions, keeping the fabrics width constant, are simulated by constraining the cross-sections of the weft threads to a slide motion, collinear to the reed linear motion, denoted by free slide motion on Figure 4(a).
Considering these boundary conditions, it can be noted that the warp tension is not taken into account in the first version of our modelling.
Numerical weaving of 2D fabrics and comparison with manufactured samples
Numerical model
In this section, we summarise numerical tests (numerical tests for reducing weaving cycle length; for optimizing the REC size choice and for refining the elastic parameters) required to refine the simulation.
The weaving cycle length effects
In this first test, an elementary thread interlacement, involving three warp yarns and one weft yarn (Figure 6a), was produced at various weaving cycle time lengths, namely: TC = 600 ms (the dobby loom cycle length), TC = 60 ms and TC = 1.5 ms. Creating several cutting planes in the obtained samples, orthogonal to the weft and warp directions (see Figure 6b), reveal no change in the resulting contextures. Such results can be explained by the yarns elastic constitutive law (which do not depend on strain rates) and the low thread density leading to weak inertial forces. When TC drops below 10 ms, warp threads are subject to excessive vibratory phenomena that can be easily smoothed, provided TC ≥ 1.5 ms, by means of a low bandwidth filter. Decreasing the cycle length to 1.5 ms saves a tremendous amount of CPU time and makes possible the investigation of larger samples despite the computing time required for the explicit scheme. For instance, one week of computation time is required to obtain the elementary threads interlacement at the dobby loom weaving rate, whereas 3 hours are required using the increased speed.
Effects of the weaving cycle length. (a) elementary interlacement used for tests and (b) unchanged contexture at various weaving rates.
REC size choice and weaving process stabilization
In this section, a fabric sample with a sufficient number of warp and weft yarns, from which a REC can be deduced, is identified. The following results were retrieved from a 2D plain weave fabric simulation consisting of 8 weft and 8 warp yarns.
Due to the periodicity of the fabric along the reed (precisely along the weft direction, in Figure 2(b)), any number of warp yarns forming at least one period can be chosen. The cutting plane performed along a weft yarn in Figure 7(a) brings out, near the terminal weft cross-sections, where temples are modelled through a slide motion, a boundary layer involving two warp threads.
The selvage scraps (lengths in mm). (a) weft selvage scrap and (b) warp selvage scrap.
In the warp direction, as a rigid plate was substituted for the fabric forming line (cf. Figure 4a), it is necessary to adjust a threshold value of weft insertions beyond which the fabric pattern remains unchanged. From Figure 7(b), a boundary layer length involving 2 weft yarns appears to be a sufficient estimation. Precisely, the two first inserted weft yarns will be discarded since they can be seen as a warp selvedge scrap.
Elastic parameters refinements
Picked up from the loom (just beyond the heddles), the yarns cross-sections are almost circular (Figure 2a). Once the weaving process is completed, the cutting plane in Figure 3(d) highlights an overall elliptically-shaped yarn cross-section. The first simulations conducted on a 2D plain weave fabric, with transverse isotropic elastic material parameters, have been performed using the given values of literature [3] (Figure 3b) especially with ν23 = 0: these mechanical properties are defined in the ortho-normal basis (e1, e2, e3), with e1 directed along the fibres and (e2, e3) spanning the cross-section. After several simulations with this value of ν23 = 0 it leads to an insufficient material spreading along the main elliptic axis (the direction which is orthogonal to the yarns crushing forces, see Figure 3c). A comparison between the simulated yarns cross-section (Figure 3c) and the mean value obtained from cutting planes performed on several resin-coated samples (Figure 3d) also reveals this difference due to the lack of material deformation. Various numerical tests have highlighted that a simple adjustment of the Poisson's ratio value ν23 (–ν23 =
Note that the comparison of cross-sections between the real coated and simulated samples must be taken with hindsight since the chosen hexahedra elements and the mesh density lead inevitably to truncated ellipses.
Values for E22 and E33 have been chosen constant and selected under assumptions of transverse isotropy. However, it is relevant to note that some existing studies, which deal with the compaction of a woven cell, use non-linear constitutive laws depending on transverse deformation [34].
Numerical and manufactured samples comparison
The screenshots in Figure 8 give an overview of some obtained simulated key production steps involving a new weft insertion (to compare with the high-speed camera tracking, Figure 5). These steps include: the shed opening (Figure 8b) holding the last inserted weft firmly against the fabric, the read beat up (Figure 8c) compacting an additional weft yarn against the fabric forming line and the “inverted” heddles motion (Figure 8d) keeping the newly inserted weft in the shed.
Simulated key production steps. (a) initial setting up, (b) step 1: shed opening, (c) step 2: reed beat up and (d) step 3: reed back motion.
With the aim of saving further computing time, the weft pick-in involving large yarn rigid body motions is not modelled as it requires a tremendous amount of time steps. An efficient method consists to associate at the beginning of the simulation each weft yarns to a weaving reed, as described in Figure 8(a). Each reed can only collide with its associated weft yarn through a standard augmented Lagrangian method. Next, the reed motion sequence is activated in order to mimic the dobby loom reed compaction process.
The following section is devoted to some drawing comparisons between numerical fabric samples and manufactured ones produced in our weaving workshop (with the dobby loom depicted in Figure 2b). The production was conducted on a plain weave fabric.
The plain weave pattern fabric
Far enough from the boundary conditions (the selvedge scraps), Figure 9(a) depicts a suitable fabric REC, ready to use as a reference configuration for homogenised computation performed with a finite element method.
Plain weave fabrics comparison (1/2). (a) a plain weave fabric REC, (b) REC cutting planes (top view) and (c) cutting planes orthogonal to warp direction (lengths in mm).
Results seen in Figures 9(c) and 10 highlight the geometrical consistency between the resulting numerical REC and the impregnated manufactured sample (removed from the loom) through some simple criteria. These include the overall cross-sectional shape, yarns float, warp and weft shrinkage related to the fabric density. The fabric sample which was impregnated is removed from the loom. At a macroscopic scale, when the woven fabric is removed, it is no longer under tension. However, at a mesoscopic scale, yarns stay in contact and under tension stress and thus the yarn cross-section remain elliptic and does not return to their initial circular cross-sectional shape (before weaving). More precisely, Figure 9(c) summarises dimensions taken from 3 cutting planes orthogonal to the warp direction of the fabric RECs: the cutting planes A-A and C-C (see Figure 9b) passing through the weft thread axis and the cutting plane B-B located at halfway between these two previous cutting planes. Evidently, the main geometrical characteristics of these two samples are in quite good agreement whilst keeping in mind the inherent errors related to the numerical REC truncated cross-sections and measurements conducted on the resin-coated samples. One can note, under the mentioned restrictions, that the measured relative error for the cross-section major (resp. minor) elliptical axis do not exceed 6% (resp. 13%). Such a precise geometrical description of the warp yarn cross-sections leads to a faithful modelling of the weft yarn float, without yarns penetrations. Figure 10 highlights similar comparisons performed on three cutting planes orthogonal to weft direction. As a result of a fine tuning of the reed motion sequence, good weft density (distance between two consecutive weft yarn axes) in the numerical sample is obtained. In this direction, a decrease of the precision of the cross-section geometry is observed. Based on given assumption, in these firsts development, warp tension effects are not taken into account by specifics load condition.
Plain weave fabrics comparison (2/2).
Conclusions
Based on an explicit finite element solver, a numerical simulation aiming at mimicking the weaving process of an industrial dobby loom was proposed. The main geometric features of the fabric samples produced from the virtual loom are quite consistent with the manufactured counterparts. The simulation results in a good representation of yarn float, cross-sectional shape and contact areas between the weft and warp threads of the woven samples. It is therefore a useful numerical tool for designing 2D fabric RECs. Such a tool can compute geometries which can be used in homogenization method. A higher precision on the warp tension can be taken into account with the use of sensor yarns measurements done in-situ during the weaving process [35]. The currently presented models can then be validated with this experimental input.
Future works and simulations oriented to 3D warp interlock fabrics will be soon performed.
Footnotes
Funding
This study received support from the French National Agency of Research (ANR) bearing the NUMTISS reference, ANR-09-MAPR-0018 MAPR.