
Abstract
This paper reports the three-point bending fatigue behaviors of four-step three-dimensional braided composite T-beam. The fatigue deformation and damage of three-dimensional braided composite T-beam at different stress levels and fatigue cycles have been obtained to explain the fatigue behaviors. The influence of stress levels on fatigue life is analyzed based on experimental S–N curves performed with the stress ratio (R) value of 0.1 at room temperature. Furthermore, the energy absorptions were analyzed by comparing the integral areas among different stress levels to indicate energy absorption mechanisms. In addition, the fatigue damage location distribution is found according to the damage morphologies of three-dimensional braided composite T-beam. The history of the overall stiffness degradation is found to exhibit three stages of fatigue failure: initial stage, steady stage, and final failure crack stages. The results of this investigation provide an insight into fatigue damage behavior and fatigue life of three-dimensional braided composite T-beam, and it shows that the three-dimensional braided composite T-beam is able to be used as connector.
Keywords
Introduction
In aerospace engineering, there is a constant challenge to design the aircraft structures such as composite vanes in engines, T or I stiffeners, and beams such as stringers with high ratio of strength/weight [1]. Three-dimensional (3D) braided composites have potential applications to manufacture the T or I stiffeners and beams because of their high delamination resistance and near-net-shape features, and lower density compared with metals. The fatigue behaviors of the 3D braided composite structures are important to design such kind of aircraft structures.
The fatigue behavior of the 3D braided composites has been investigated and analyzed by several researchers so far. Shuangming and Shengru [2] tested the tension–tension fatigue performance of 3D braided carbon fiber reinforced silicon carbide ceramic matrix composites with a sinusoidal loading at the frequency of 20 and 60 Hz and stress ratio R of 0.1 and 0.5. Liao et al. [3, 4] examined the bending fatigue behavior of 3D integral braided carbon/carbon composites (3101 C/C) under force control at a sinusoidal frequency of 10 Hz. It was revealed that the interfacial sliding abrasion played an important role in the fatigue failure process. Li et al. [5] studied the dynamic mechanical fatigue properties and the effect of braiding structures on the fatigue properties of 3D braiding composites by tension–tension fatigue tests. It was found the braiding angles have a great influence on the fatigue properties of 3D braiding composites. Tate and Kelkar [6] and Tate et al. [7] discussed the stiffness degradation model for biaxial braided composites with various braid angles under fatigue loading. Sigmoidal function in conjunction with Bradley function was explored to predict the fatigue life and the residual fatigue modulus. Kelkar et al. [8] investigated the biaxial braided carbon/epoxy composites with different braiding angles under tension–tension fatigue loading. Carbon/epoxy unstitched and Z-pinned plain-woven composites were investigated under tension–compression fatigue loading. Huang et al. [9] studied the tension–tension fatigue behavior of the laminated composites made from an epoxy matrix and four layers of flat regular braided carbon fiber fabrics of different braiding angles. The paper provided a useful insight for understanding the fatigue behavior of braided fabric reinforced laminates. Karahan et al. [10] conducted the in-plane tension–tension fatigue tests with the carbon fiber/epoxy matrix composite reinforced with noncrimp 3D orthogonal woven fabric. The maximum cycle stress corresponding to the fatigue life of noncrimp 3D orthogonal woven fabric was revealed. Jin et al. [11] report the three-point bending fatigue behavior of 3D angle-interlock woven composite at different stress levels.
As for T-beam, Chen [12] and Chen et al. [13] presented an approach to predict the delamination of braided composite T-piece specimen using cohesive models and suggests the feasibility of this approach by comparing with the experimental results. Pye and Ledbetter [14] discussed the selection of suitable adhesives and report on the performance of five glass T-beams manufactured with a modified epoxy resin. The results showed that it was feasible to construct useful composite glass-adhesive beams. Hao et al. [15] examined the quasi-static indentation and transverse impact behavior of 3D orthogonal woven composite T-beam with a material tester (MTS 810.23) and a modified split Hopkinson pressure bar. The good agreement between experimental and finite element method (FEM) results revealed the damage mechanisms and energy absorption features of the composite T-beams with different flange heights.
Herein, we will report the fatigue behavior of 3D braided composite T-beam under cyclic bending loading. The S–N curve, stress versus deflection curves, and stiffness degradation were obtained to characterize the fatigue damage of the 3D braided T-beam. Furthermore, the ultimate failure modes of the 3D braided T-beam under different stress levels were also stated to reveal the damage mechanisms.
Experimental
Materials
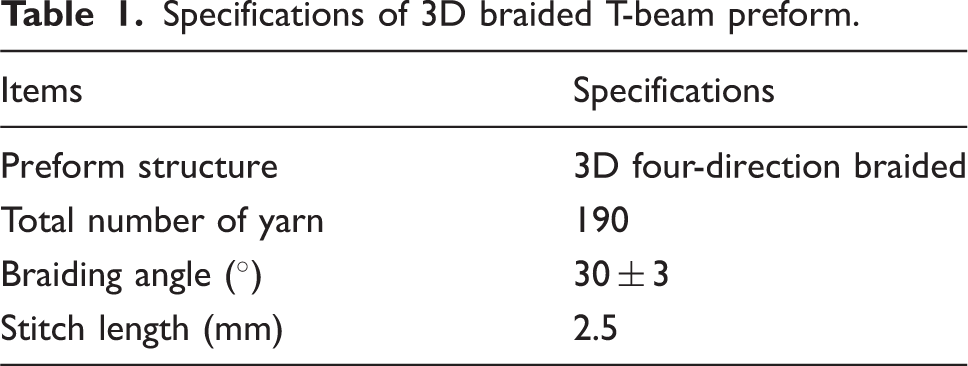
In this paper, the 3D T-beam preform was manufactured by 3D four step braiding technique with the carbon fiber tows (Toray®, T700-12K), and the specifications are listed in Table 1. The photographs of the 3D braided T-beam preform are shown in Figure 1.
Photograph of 3D braided T-beam perform. Specifications of 3D braided T-beam preform.
The vacuum-assisted resin transfer molding technique was employed to manufacture the 3D braided composite T-beam. The matrix used here was JC-02A epoxy resin provided by Changshu Jiafa Chemical Co., Ltd, China, with the curing agent of JC-02B supplied by the same company. The resin solution was prepared by mixing the epoxy resin and the curing agent in weight ratio of 100:80. The viscosity of the epoxy resin was 1000–3000 mPa s at 25℃. As shown in Figure 2, the resin solution was flowed into the 3D braided T-beam preform at a temperature of 40℃ due to the effect of vacuum pump and then cured in oven for 2 h at a temperature of 90℃ followed by a postcuring at 110℃ for 1 h and 130–140℃ for 4 h. The fiber volume fraction of the 3D braided composite T-beam was calculated by the method of muffle furnace [16] and it was approximately 56%. The void content of 3D braided composite T-beam was 3.15% which was determined by microscopic method [17]. The photos of the composite sample in surface and side view are shown in Figure 3. The size (length × width × thickness) of flange is 260 mm × 44 mm × 4 mm, and the size (length × width × height) of web is 260 mm × 4 mm × 8 mm.
Manufacturing of 3D braided composite T-beam using VARTM. Photographs of 3D braided composite T-beam: (a) surface view, (b) side view.

Quasi-static three-point bending and fatigue tests
The quasi-static three-point bending and fatigue tests of the 3D braided composite T-beams were implemented on the MTS 810.23 material system at room temperature. One loading calender roller and two supporting rollers were applied. All rollers have the same size of 20 mm in diameter and 70 mm in length. The span between the two supporting rollers is 160 mm as shown in Figure 4. The reference standard for this sort of experiment is ASTM D790. The main purpose of this article is to explore the bending fatigue limit of 3D braided T-beam. Considering of data repeatability, three samples were used under every stress level.
Three-point bending fatigue test of 3D braided composite T-beam (unit: mm).
Quasi-static three-point bending tests were carried out at a velocity of 2 mm/min. Three specimens were used to obtain the average values of the quasi-static ultimate bending strength and bending elastic modulus that are 764 MPa and 22.3 GPa, respectively. The standard deviation for the data is 4.55 MPa and 1.28 GPa, respectively.
The bending fatigue tests were also conducted on the material test system (MTS) tester with a constant stress ratio 
Four stress levels
Results and discussions
S–N curve
Figure 5 shows the S–N curve (the numeric of stress level versus the number of cycles to failure) of the 3D braided composite T-beam. It could be found that the fatigue life of the 3D braided composite T-beam increases with the decrease of the stress level. Specifically, there is no significant damage in the 3D braided composite T-beam after over 5 × 10⁵ loading cycles under the stress level of 50%.
S–N curve.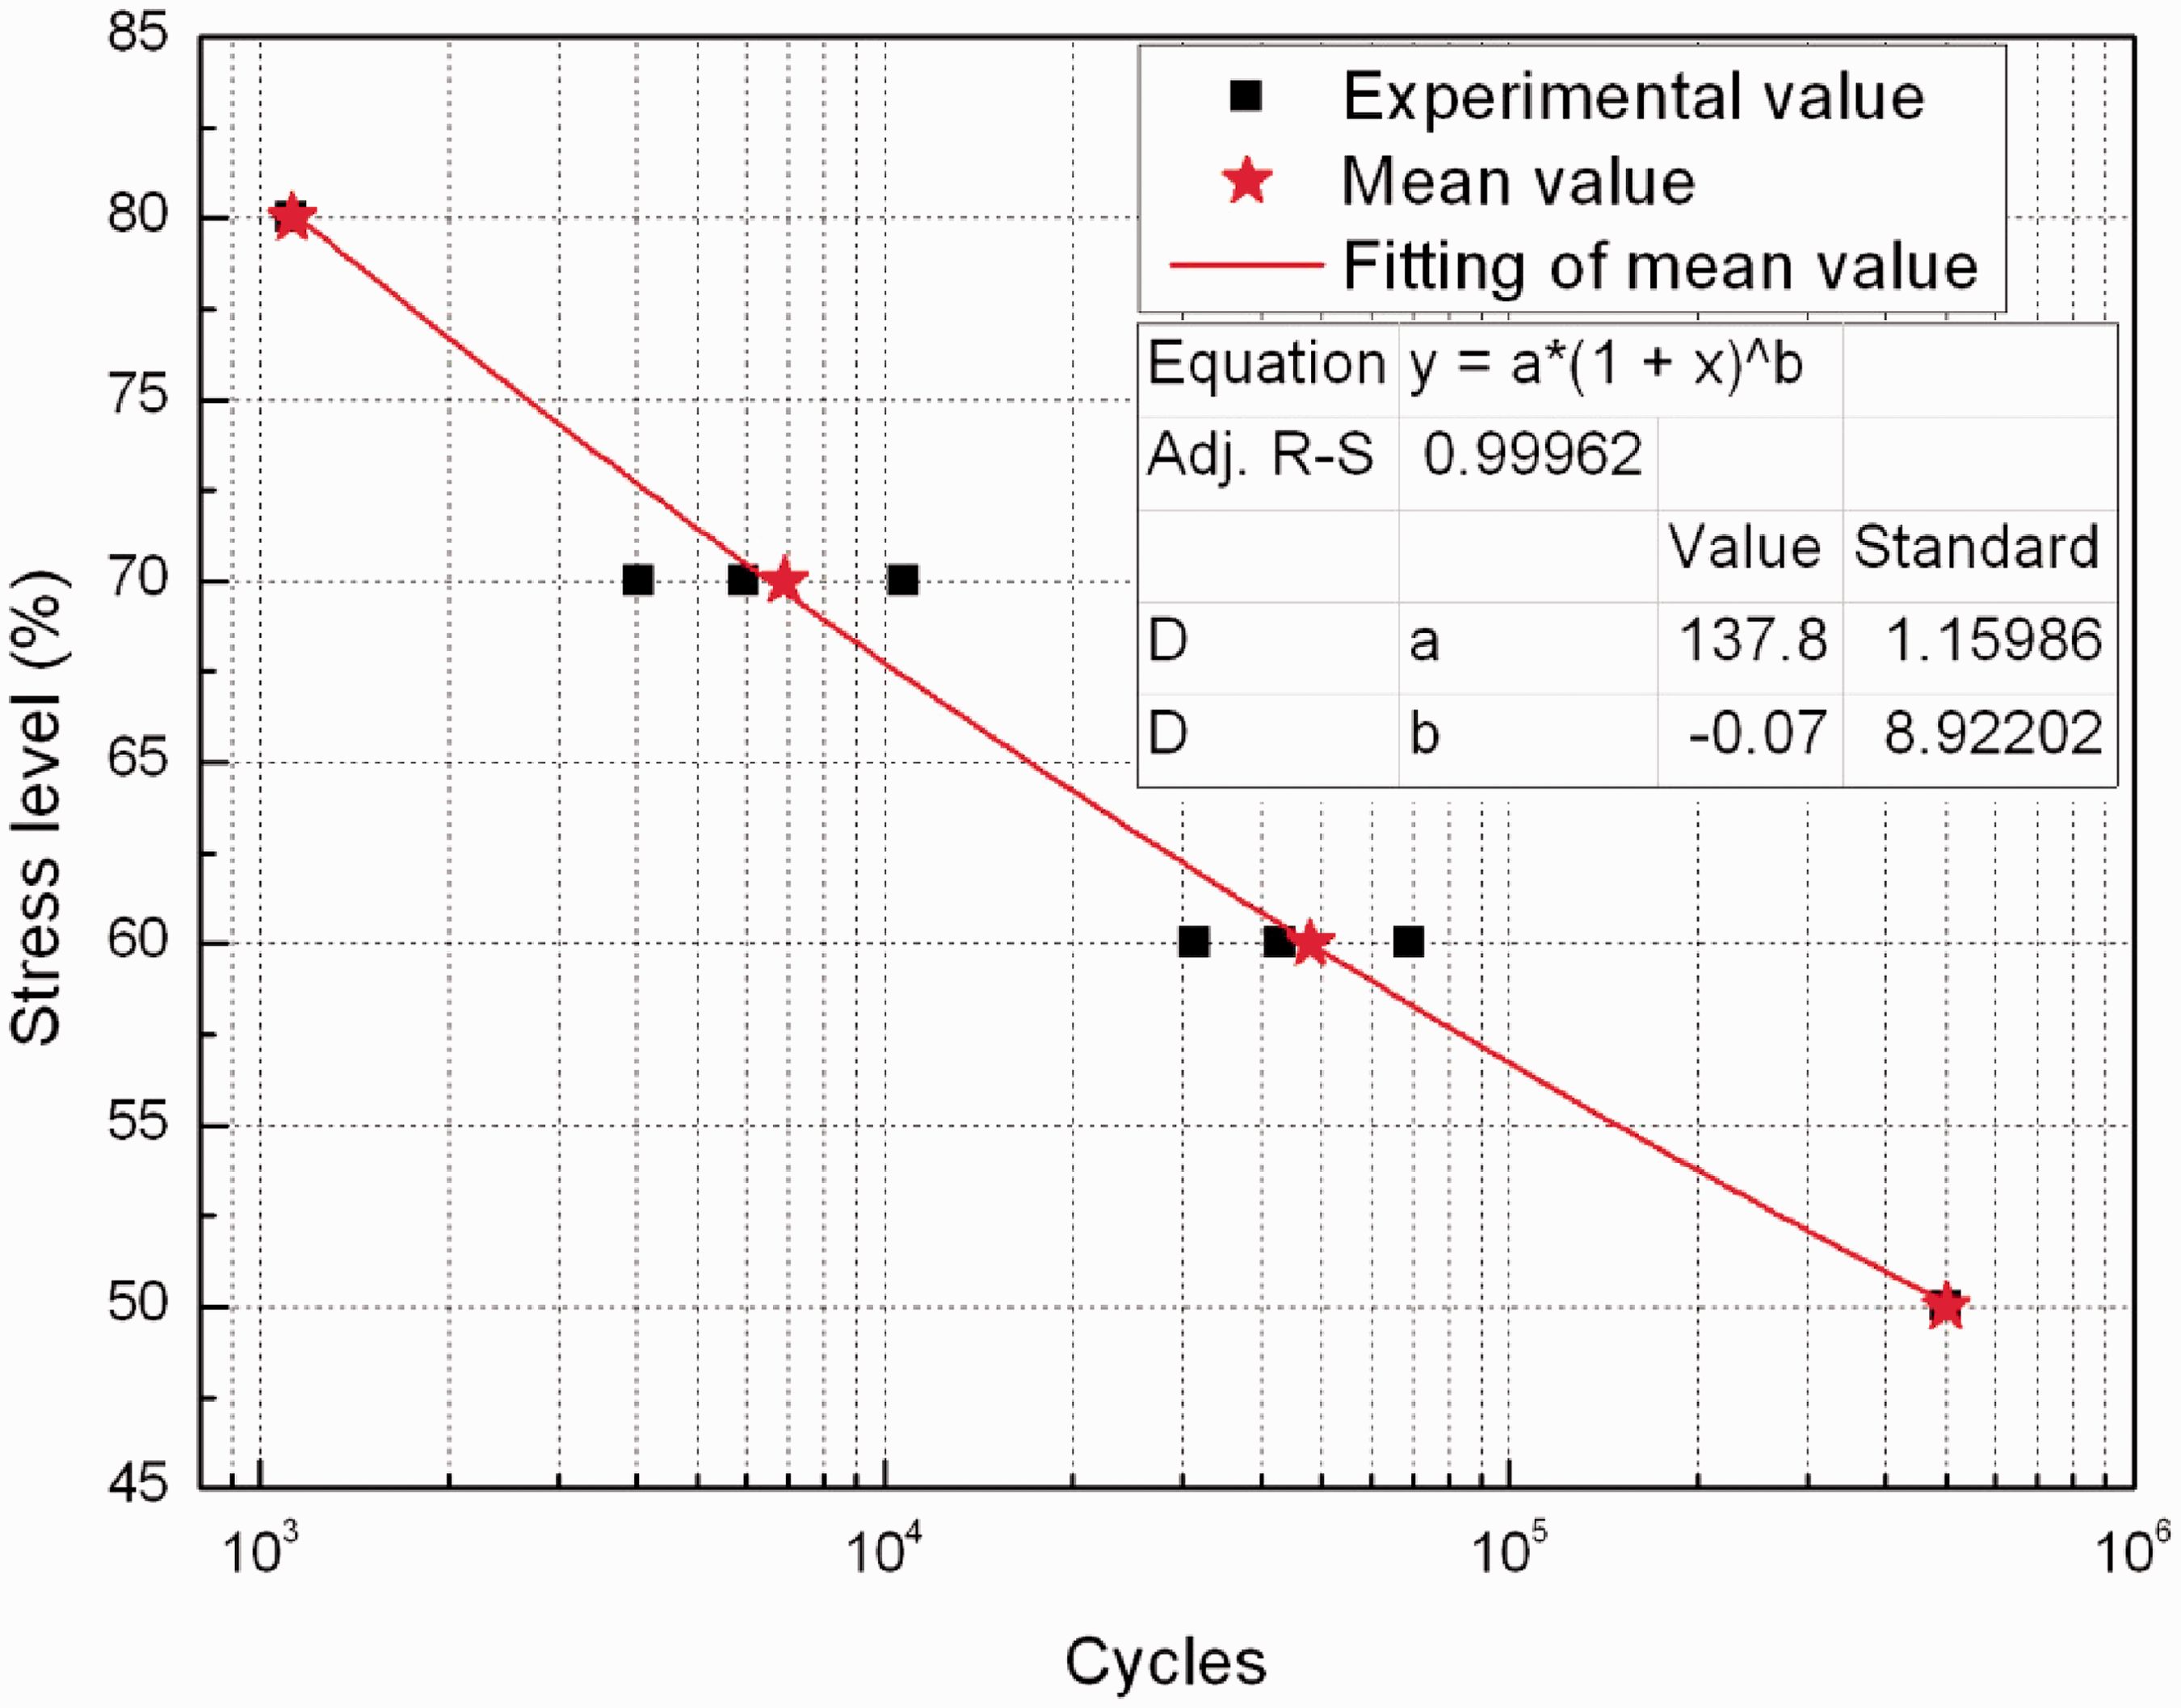
Strain energy curves
The strain energy for some specific cycles under stress levels of 60% (N = 31,365), 70% (N = 5942), and 80% (N = 1125) is shown in Figure 6. As the 3D braided composite T-beam did not fail under stress level of 50%, its strain energies are not discussed here. The strain energy is plotted to reveal the fatigue damage accumulation within the 3D braided composite T-beam as a function of the cyclic loading proceeding. It indicates the energy absorbed by the composite under bending fatigue loading. It can be clearly seen that the energy absorption of the specimen in each cycle will increase with the cyclic loading under way. The matrix crack, fiber–matrix interface debonding, and fiber breakage that affect the energy absorption of composite occur with the cyclic loading proceeding. In addition, three regions (a, b, and c) are shown in Figure 6, corresponding to sharp increase of strain energy within a short time period, which is the result of fiber breakage.
Strain energy at the different test cycles.
The accumulated strain energy during the whole experiment stage is shown in Figure 7. The energy absorbed by the 3D braided composite T beam increases with test cycles until the composite completely destroys. It can be found that the peak values of accumulative strain energy are different which implies the total dissipation of energies for ultimate fatigue failure of specimens under different stress levels. This phenomenon is due to the deformation of composite under higher stress level is much larger than that of lower stress level and also has some relationship with the instability of manufacturing process and inhomogeneous microstructure of the composite.
Accumulated areas of the hysteresis loops during fatigue test.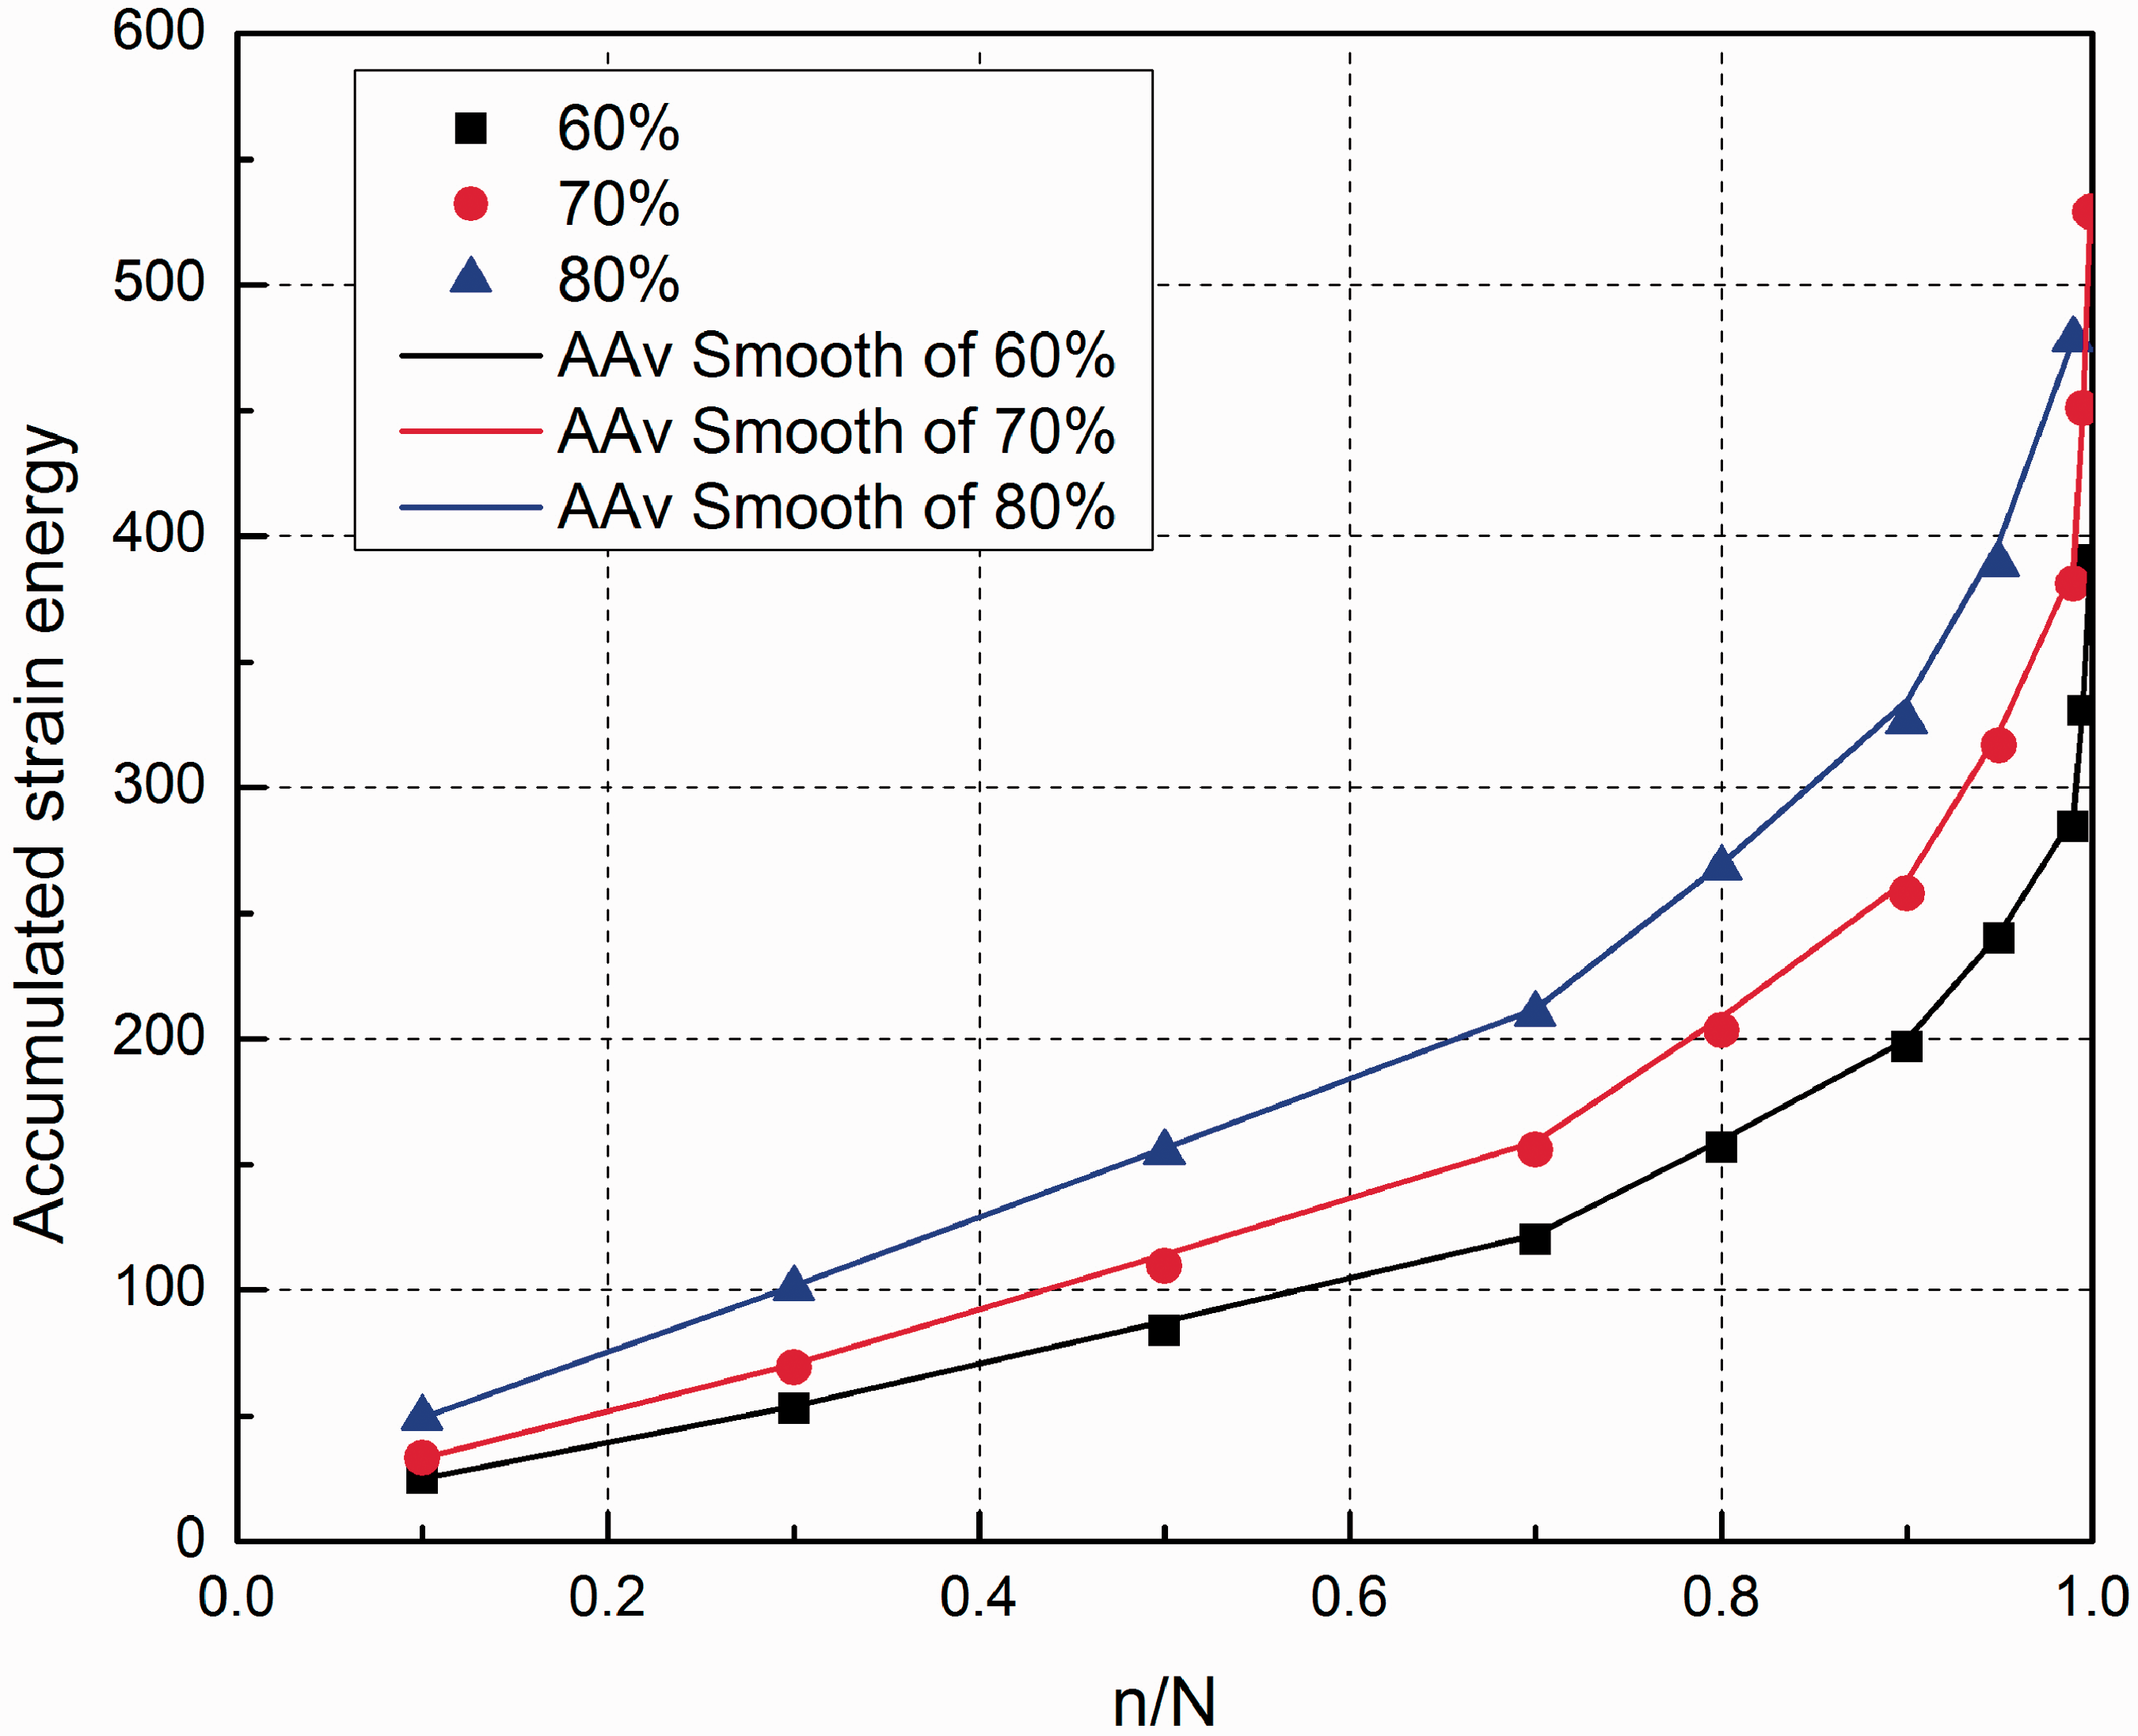
Curves of stiffness degradation index D
With the energy absorption in each loading cycle, the stiffness of the 3D braided composite T-beam will accordingly degrade. The stiffness degradation versus normalized life span ( Bending modulus degradation curves during fatigue test.
The normalized life span index D is defined as recommended in equation (2) [18]

The accumulative damage of the 3D braided composite T-beam during the cyclic fatigue loading leads to the decrease of modulus with the increase in number of testing cycles. Based on experimental results of bending modulus, the fatigue failure process could be divided into three stages (A, B, and C). It is clear that 3D braided composite T-beams have a fatigue initial damage (corresponding to region A), regardless of the stress level. In addition, the 3D braided composite T-beams have almost the same behavior of fatigue crack propagation at each stress level. As the deformation of the carbon fiber reinforcement is much smaller than that of the matrix, the cracks start to occur in the matrix after a few numbers of loading cycles which generate sharp stiffness degradation within a short time. The initial damage has no significant impact on either load-carrying capability or fatigue limit of material. With the increase of cycle number (corresponding to region B), the cracks begin to grow from the matrix-fiber interface which can result in the interface de-bounding, and initial fiber breakage come up as a result of stress concentration. This stage consumes relative a long period of time which leads to the progressive degradation of mechanical properties of the 3D braided composite T-beam, and therefore a slow persistent decrease of stiffness. In the third stage (region C), the fracture occurred in the web fiber tows as the 3D braided composite T-beam could no longer endure the cyclic loading, which sharply reduces the fatigue stiffness and results in the ultimate fatigue failure. This stage happened in a relative smaller number of cycles which we can see clearly from stiffness degradation curves.
Fatigue failure morphologies
The flange and web of the 3D braided composite T-beam fatigue failure morphologies under the stress levels of 80, 70, 60, and 50% (number of cycles to failure: 1125, 5942, 31,365, and over 5 × 10⁵, respectively) are shown in Figure 9. It was found that the damaged regions of the 3D braided composite T-beams under different stress levels were principally located at the center of both flange where the maximum compression stress occurs and web where the maximum tension stress takes place. Meanwhile, the resin crack, fiber breakage, and debonding of fiber–resin interface are also the dominating damage modes. Specifically, the resin crack played a dominant role on the flange where T-beam is compressed, and the fiber breakages were evidently perceived as the ruling role on the web where T-beam is tensioned. In particular, for the stress level 50%, just resin crack could be seen on the flange and web of the 3D braided composite T-beam.
Fatigue damage morphologies under different stress levels. Stress level 50%, no failure over 5 × 10⁵: (a1) back view and (a2) side view. Stress level 60%, number of cycles to failure 31,365: (b1) back view and (b2) side view. Stress level 70%, number of cycles to failure 5942: (c1) back view and (c2) side view. Stress level 80%, number of cycles to failure 1125: (d1) back view and (d2) side view.
Figure 10 shows the comparison of ultimate morphologies under stress level 70 and 60% and quasi-static bending test. It can be found that the ultimate morphologies have little difference. The deformation of specimen increases with the increase of stress. Furthermore, for the bending fatigue loading mode, the damage area is larger than that of quasi-static loading mode.
Comparison of the damaged 3D braided composite T-beam. (a) front surface, (b) back surface, (c) side view.
Conclusions
The three-point bending fatigue experiment of 3D braided composite T-beam was tested on an MTS 810.23 system under a 3 Hz sinusoidal waveform cyclic loading with four stress levels of 50, 60, 70, and 80%. The S–N curves, stiffness degradation process, and strain energy curves were applied to analyze the fatigue mechanism. The fatigue life of 3D braided composite T-beam is found to increase with the decrease of stress level. Specifically, the 3D braided composite T-beam did not fail over 5 × 10⁵ cycles at the stress level of 50% which shows that the 3D braided composite T-beam is able to work safely and effectively under the bending fatigue loading for a long time as a connector. The stiffness of 3D braided composite T-beam consecutively degrades with the testing process. Meanwhile, the accumulative strain energy is absorbed during the fatigue cyclic loading corresponding to the ultimate fatigue failure. Furthermore, the failure procedure can be divided into three phases: the initial resin cracking occurs at the first phase, then the debonding of fiber–resin interface takes place, the progressive fiber breakage occurs during the final stage which is the dominating bending fatigue damage mechanisms of the 3D braided composite T-beam. Finally, comparing with those of the 3D braided rectangular composites, it can be found that the fatigue resistance performance of 3D braided rectangular composite is much better than that of the 3D braided T-beams composite at the same stress levels. Although the web can significantly improve the flexural rigidity, it reduces the region area of lower surface where T-beam is subjected to the tensile loading during the fatigue test.
Footnotes
Funding
This work is supported by the National Science Foundation of China (Grant Number 11272087), National High-tech R&D Program of China (863 Program) (no. 2012AA03A206), the Foundation for the Author of National Excellent Doctoral Dissertation of PR China (FANEDD No. 201056), Shanghai Science and technology innovation action plan (grant no. 12521102400 and 12dz1100407), Funds for Innovation of the Dissertation of Master Degree Candidate from Donghua University of China (EG2013004), and the Fundamental Research Funds for the Central Universities of China.