
Abstract
The relationships of mechanical performance with the short-range and long-range structure of 500–900℃ carbonized fibers were studied by the combination of radial distribution function (RDF), Fourier transform infrared spectroscopy (FT-IR) and high-resolution transmission electron microscopy (HRTEM), etc. In the range of 500–900℃, there were different laws of change for tensile strength and elastic modulus during different temperature stages. The tensile strength was more nearly directly proportional to temperature, especially at higher than 600℃. The elastic modulus increased slowly from 500 to 700℃, and then elastic modulus increased rapidly after 700℃. The short-range structures had no effects on the mechanical performance. The uniform increasing rate of tensile strength was closely related to the crystallinity degree and crystal size. The outstanding increase of orientation degree was closely related to the change of elastic modulus.
Introduction
Polyacrylonitrile (PAN)
Recently, we make our efforts on the physical and chemical transformations that take place during the carbonization process in the range of 500–900℃. Our research showed that the X-ray diffraction pattern of the fibers always keeps amorphous “hills” with temperature increasing from 500 to 900℃, but their mechanical properties change remarkably. It seems contrary to the concept of “property is dependent on structure”. Therefore, it is important to reveal the relationships of mechanical performance with the short-range and long-range structure of 500–900℃ carbonized fiber.
The long-range structure (>5Å) can been investigated using X-ray diffraction (XRD), high resolution transmission electron microscopy (HRTEM), scanning electron microscopy (SEM) [10–15] and Fourier transform infrared spectroscopy (FT-IR). For the short-range structure (1–5 Å), we resort to Radial distribution function (RDF). RDF is one of the most commonly used structural analysis methods for liquid amorphous materials and amorphous alloys. It has been exploited to study the structures of various carbon materials and many novel research results were gained [16–18]. RDF analysis of the graphitization process of saccharose- and anthracene-based carbons was studied by Szczygielska et al. [17]. The short-range structural informations about the non-graphitizing carbon (saccharose-based carbons) and graphitizing carbon (anthracene-based carbons) were obtained by RDF. They found analysis of the experimental RDF was demonstrated to be an efficient tool for studying such transformations.
In this paper, we present a combined XRD, RDF, HRTEM, SEM and FT-IR with mechanical performance testing in order to fully disclose the nature of mechanical performance with the short-range and long-range structure of 500–900℃ carbonized fiber.
Experimental
Preparation of fibers
Processing parameters of various spinning stages.

Main properties of PAN-based precursor fiber.

A self-designed continuous carbon fiber production line as shown in Figure 1 was used for thermal stabilization and subsequent carbonization of precursor fibers [19]. The line was composed of two thermal stabilization furnaces and each had five separate temperature zones, two carbonization furnaces and eight sets of stretching equipments. The precursor fiber was pre-oxidized in a purified air under 2% stretching and the production speed is 0.3 m/min. The temperature in 10 furnace zones was designated in sequence as 190℃, 200℃, 210℃, 220℃, 230℃, 240℃, 250℃, 260℃, 270℃, and 260℃, respectively. Subsequently, the oxidized fiber (OF) was subjected to low-temperature carbonization in a pure nitrogen atmosphere from 300℃ to a highest heat temperature (HHT) under a stretching ratio 1%. The HHT is respectively designed as 500℃, 600℃, 700℃, 800℃, and 900℃ in different batch.
Scheme of carbon fiber production line with (I–VIII) stretching rollers, (1–10) thermal stabilization furnace and (1–5) tension testing sites [19].
Measurement and characterization
The tensile strength and elastic modulus of 500–900℃ carbonized fibers tows (containing 1000 filaments) were measured on a CMT4204 tensile testing machine (Shenzhen, China). According to the National Standard of the People’s Republic of China (GB3362–2005), the carbon fiber tows were impregnated within an epoxy resin/acetone for sizing (sizing time: 30 s), dried at 120℃, and cemented on both ends onto paper cards. The tensile strength was measured at a tensile rate of 5 mm/min and a gauge length of 150 mm. An average strength was ultimately achieved by the measurement of 10 samples. OF, 500℃, 700℃, and 900℃ were respectively ground to powder for XRD measurement. A Bruker D8 Advance X-ray diffraction with Mo Kα radiation (λ = 0.709 Å) was utilized. The voltage and current were 40 kV and 40 mA, respectively, and the scanning scope was 2θ: 5°–130°. The scanning rate was about 1°/min with a scanning step of 0.02°. The count intensity was more than 104. FT-IR measurements of 500–900℃ carbonized fibers were conducted through loading powder samples/KBr disks on a Bruker ALPHA-T spectrometer (America). The scan rate was about 60 cm−1 s−1 with a scanning step of 1.43 cm−1. The scan range was 375–4000 cm−1. Then 500–900℃ carbonized fibers were respectively ground to powder for HRTEM measurement. The powder was dispersed in acetone, dripped on a copper grid and dried. The HRTEM and selected-area electron diffraction images of fibers were obtained by JEM–2100 high resolution transmission electron microscope (America) at 200 kV.
Theoretical background
The X-ray diffraction data was greatly affected by air scattering, incoherent scattering, and multiple scattering, polarization and absorption. The data must be corrected, and then normalized before RDF is calculated [20]. In this paper, three types of RDF were used: atomic radial distribution function R(r), reduced radial distribution function G(r), and pair RDF g(r).
R(r) can be expressed as

G(r) can be expressed as


The relationships of three types of RDF are


In equations (1)–(3), S(Q) is the structure function, which given the intensity distribution as a continuous function of Q,

Reduced structure function is
Usually the reduced RDF G(r) is firstly calculated by Fourier transform of S(Q). The g(r) and R(r) functions are obtained from the G(r), which is the main advantage of the G(r) function. A further advantage of the G(r) function is that the amplitude of the oscillations gives a direct measure of the structural coherence of the sample. The main advantage of g(r) is that it emphasizes the low-r short-range order. The R(r) function is the most physically intuitive, which gives the number of atoms in an annulus of thickness dr at a distance r from another atom. The nearest atomic coordination numbers (N) can been obtained from the R(r) function [22].
Results and discussion
Mechanical performance
The tensile stress–strain curves for 500–900℃ carbonized fibers are presented in Figure 2. Figure 2(b) is the enlarged image of (a) and the yield points are marked by circles. According to the tendency of these curves, low temperature carbonization process can be divided into two stages: 500–700℃ and 700–900℃. When the temperature is lower than 700℃, there is a relatively larger range of elastic deformation for fibers initially and then the stress decreases rapidly under tensile load. The stress–strain curves of 500–700℃ exhibit characteristics of brittle fracture without yield point. When the temperature is higher than 700℃, elastic deformation stage shortens, and the elastic deformation decreases with the increase of temperature. The stress–strain curves of 700–900℃ show apparent “zigzag” yield point, and then the stress increases rapidly.
Stress–strain curves of 500–900℃ carbonized fibers (a) stress–strain curves of fibers; (b) enlarged image of (a).
The elastic modulus and tensile strength of fibers are shown in Figure 3. The standard deviations and CVs of the experimental tensile data are shown in Table 3. As expected, both elastic modulus and tensile strength increase from 500 to 900℃. Surprisingly, the increase rates are different for the elastic modulus and tensile strength with the increase of temperature. Compared with elastic modulus, the increasing rate of tensile strength seems more uniform. That is to say, the tensile strength is more nearly directly proportion to temperature, especially higher than 600℃. The elastic modulus firstly increases slowly from 500 to 700℃, and then increases rapidly after 700℃. The results showed that there were different inherent reasons or laws for the increasing of tensile strength and elastic modulus. In order to reveal relationships between the mechanical performance and the structure, we used XRD, FT-IR, HRTEM and RDF for structure analysis.
Tensile strength and elastic modulus of 500–900℃ carbonized fibers. Standard deviations and CVs of the experimental tensile data.

XRD analysis
XRD curves of OF, 500℃, 700℃ and 900℃ carbonized fibers are shown in Figure 4. For OF and 500℃ carbonized fiber, broad scattering “hill” appears at 2θ≈7.7°(equal to 2θ≈17° for Cu Kα radiation), which represents the (110) of PAN crystalline [23]. It indicated the structure of linear molecular chains still existed in the 500℃ carbonized fiber. When the temperature is up to 700℃, the linear structure disappears. The obvious scattering maximum for all the fibers appears at 2θ≈11.69°–11.74° (equal to 2θ≈25.53°–25.66° for Cu Kα radiation). The maximum approaches to the (002) diffraction of graphite [24]. With the temperature increasing from 500℃ to 700℃, there is no remarkable change for the peak position, intensities and full width at half maximum (FWHM). As is well known to us, amorphous structure and nano-crystalline structure could make the peak broad. Therefore, we could not judge the differences of crystallinity and orientation of carbon fibers and we could not obtain the real cause of the change of tensile properties only by XRD original data either.
XRD curves of OF, 500℃, 700℃, and 900℃ carbonized fibers.
Short-range structure analysis
Figure 5 and 6 show g (r) and R (r) of fibers, respectively. As can be seen in Figure 5, there are three peaks in the range of 1.0–5.0 Å for each curve. The nearest, the second and the third neighbor distance (named r1–r3) can be obtained from the peaks, and the results are shown in Table 4. The nearest and the second neighbor distance of OF are 1.45 Å and 2.95 Å, respectively, which are larger than carbonized fibers. The main reason was that cyclization reaction was not fully completed during the pre-oxidation and there were some linear-chain structures as suggested in XRD. The nearest atomic coordination numbers (N) are listed in Table 4. N can be obtained by the first peak area of R(r) in Figure 6. The N of OF is lower than the carbonized fibers while the Ns are similar for the different carbonized fibers. In the range of 1.0–5.0 Å, the peak position and the coordination numbers of 500–900℃ carbonized fiber are very similar. The RDF results give us a definite answer that the short-range structures are similar for 500–900℃ carbonized fibers. Why are the mechanical performances of carbonized fibers different? We speculated the main reason for the difference of their tensile properties was not to the short-range structure but to the difference of the long-range structure.
g(r) curves of OF, 500℃, 700℃, and 900℃ carbonized fibers. R(r) curves of OF, 500℃, 700℃, and 900℃ carbonized fibers (a) OF; (b) 500℃ carbonized fiber; (c) 700℃ carbonized fiber; and (d) 900℃ carbonized fiber. Atomic neighbor distances and the nearest atomic coordination numbers of fibers.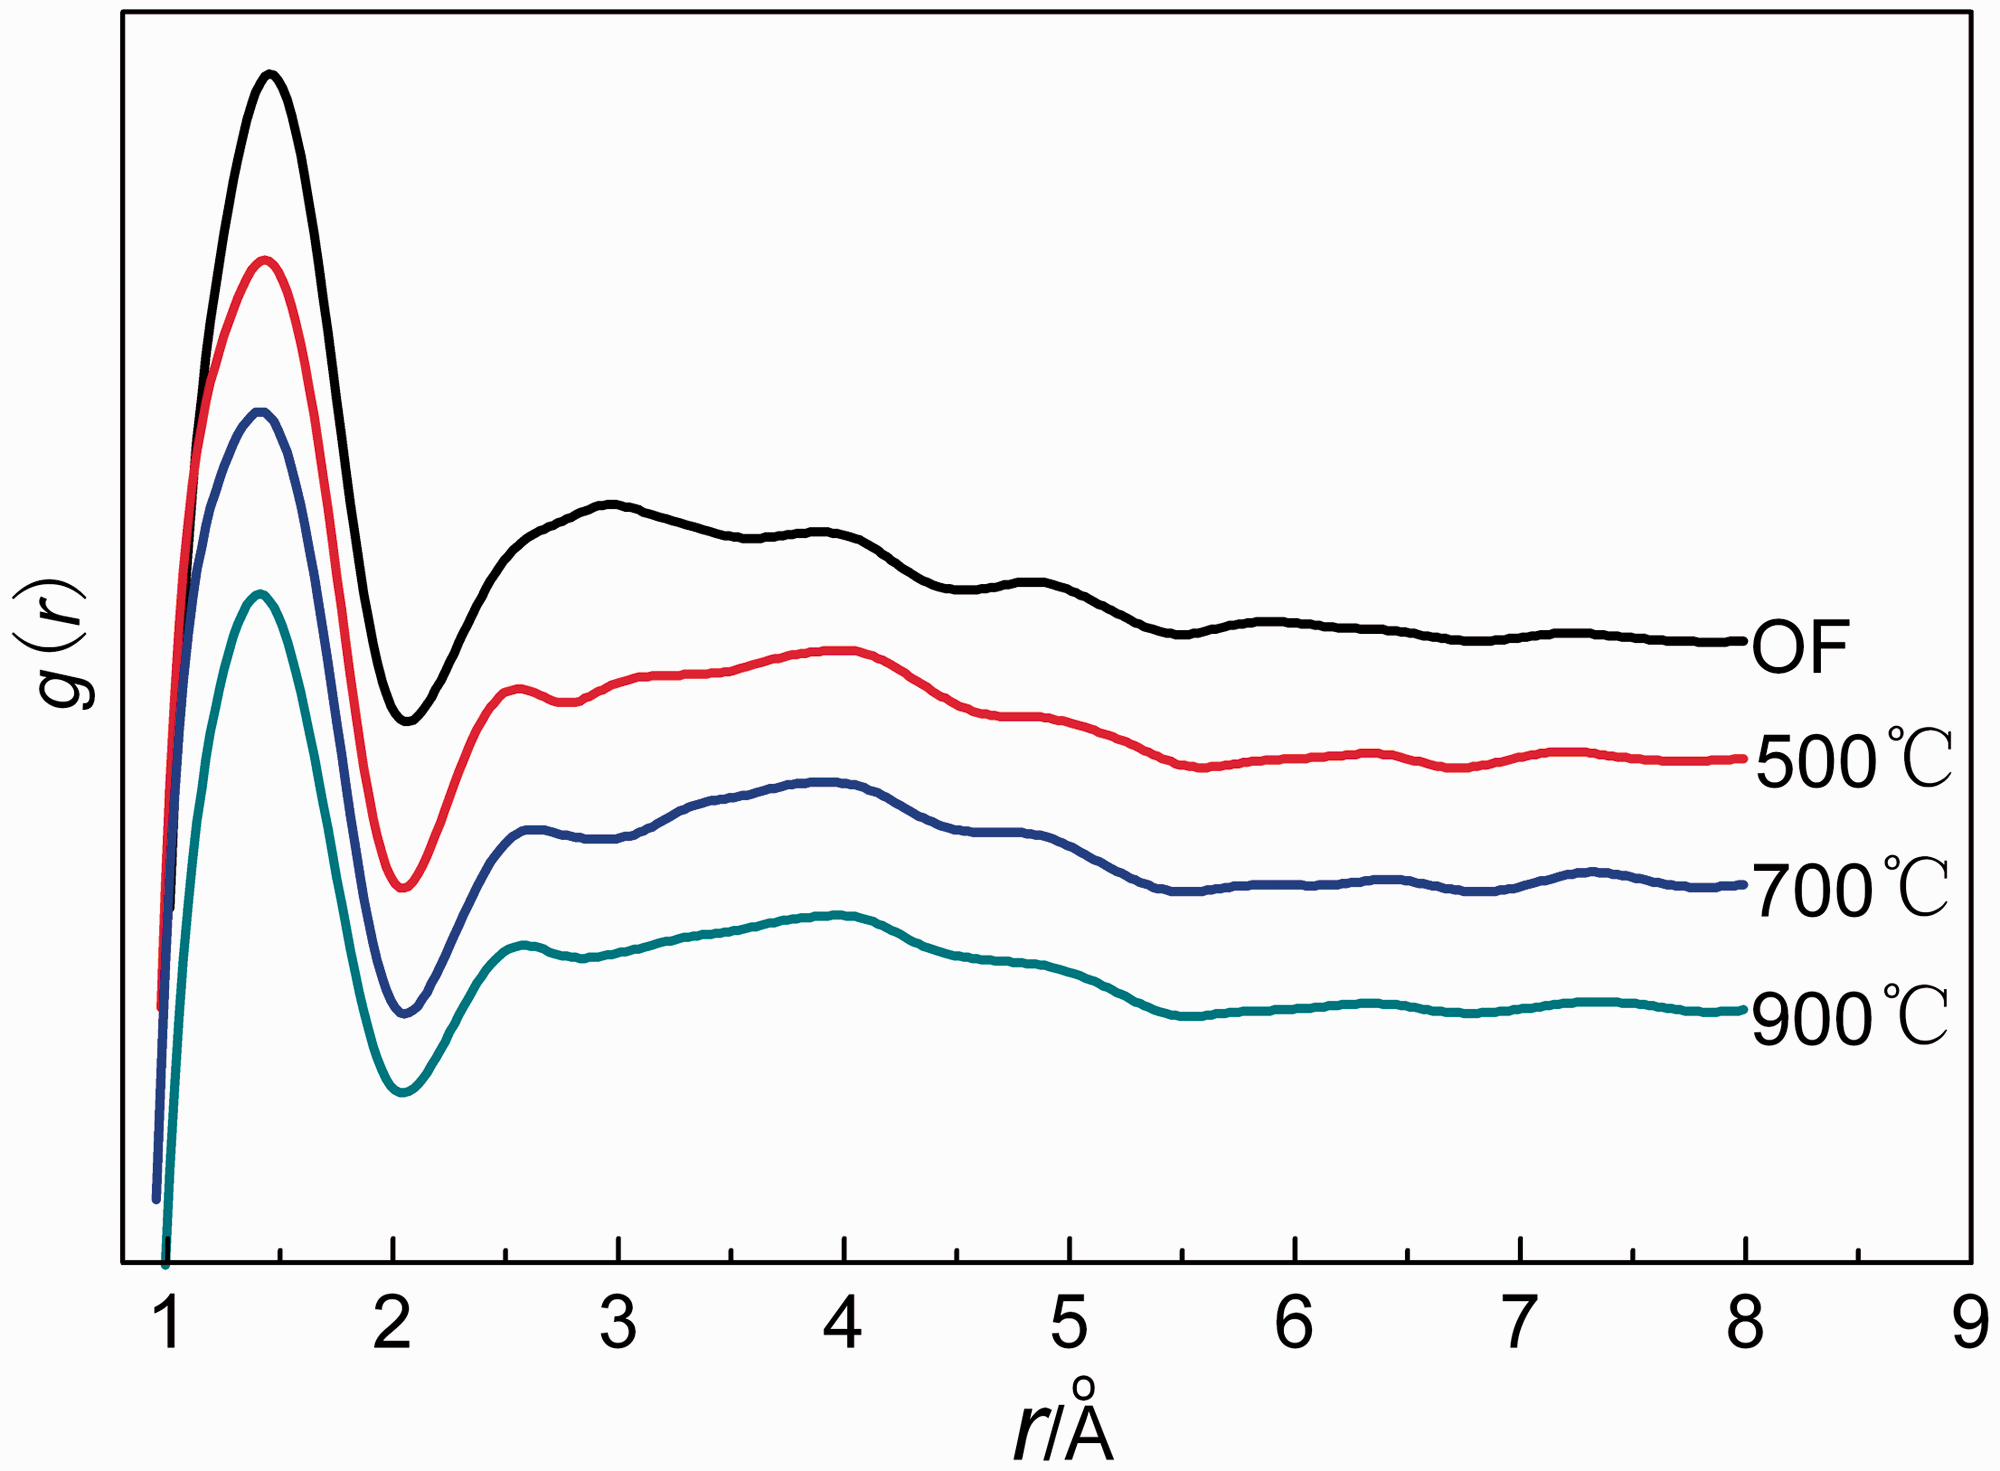


Long-range structure analysis
HRTEM analysis
HRTEM and selected-area electron diffraction images of 500–900℃ carbonized fibers are shown in Figure 7. A large area of amorphous matrix and some small ordered domains are within it. The ordered domain areas are marked by circles. For amorphous matrix, we can see there is no obvious change for the 500–900℃ carbonized fibers, which is consistent with the result obtained from RDF. For ordered domains, we can see that as the temperature increases, the number and the size of nano-crystallines gradually increase, which is consistent with previous research [25]. It showed that crystallinity and the crystal size increased with the temperature ascending. The electron diffraction images of 800℃ and 900℃ carbonized fibers can be obviously observed orientation diffraction arc, indicating a remarkable rise of the orientation degree, which is consistent with the trend of increase rate of tensile modulus.
HRTEM and selected–area electron diffraction images of fibers (a) 500℃ carbonized fiber; (b) 600℃ carbonized fiber; (c) 700℃ carbonized fiber; (d) 800℃ carbonized fiber; (e) 900℃ carbonized fiber.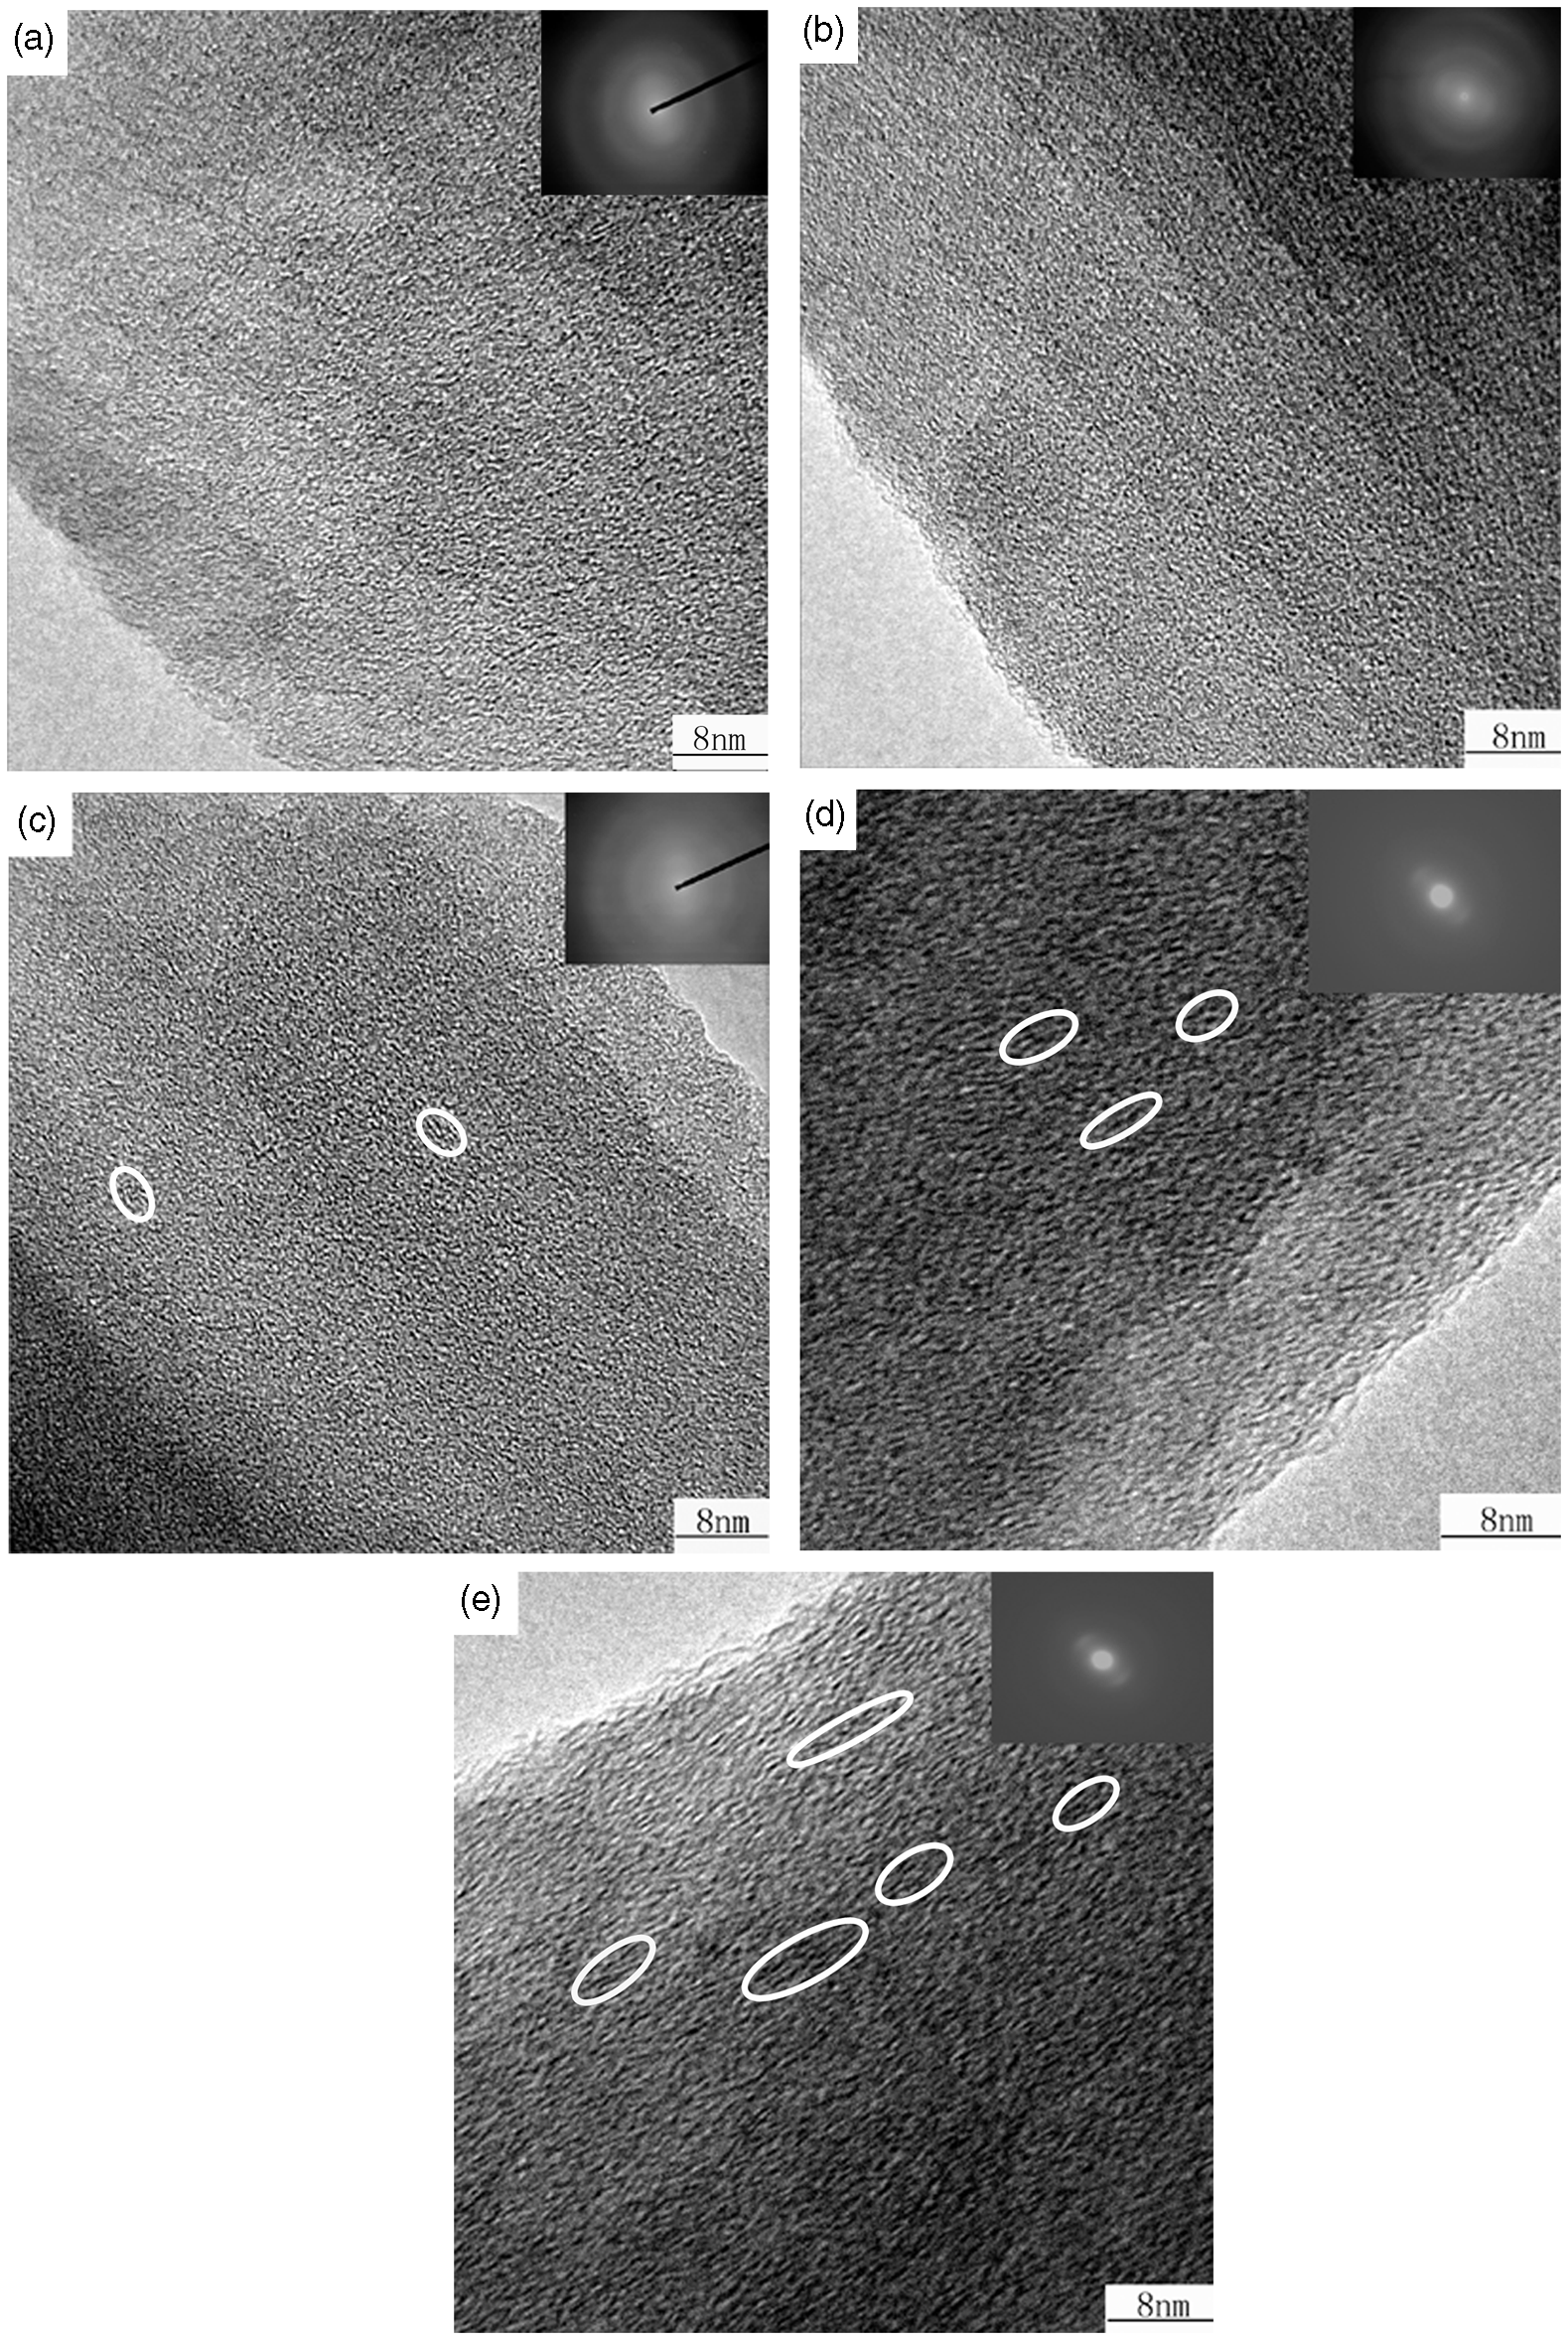
Changes of functional groups of fibers
FT-IR spectra curves of fibers are shown in Figure 8. For OF, the absorption peak at 1587 cm−1 assigned to C = N, C = C and N–H stretching vibration absorption. The peak at 2240 cm−1 assigned to the nitrile group (C ≡ N). The peak at 1260 cm−1 assigned to ether bond connected to the aromatic structure. The peak at 810 cm−1 assigned to C = C–H absorption. The peak at 1369 cm−1 assigned to CH2 absorption.
FT–IR spectra curves of 500–900℃ carbonized fibers.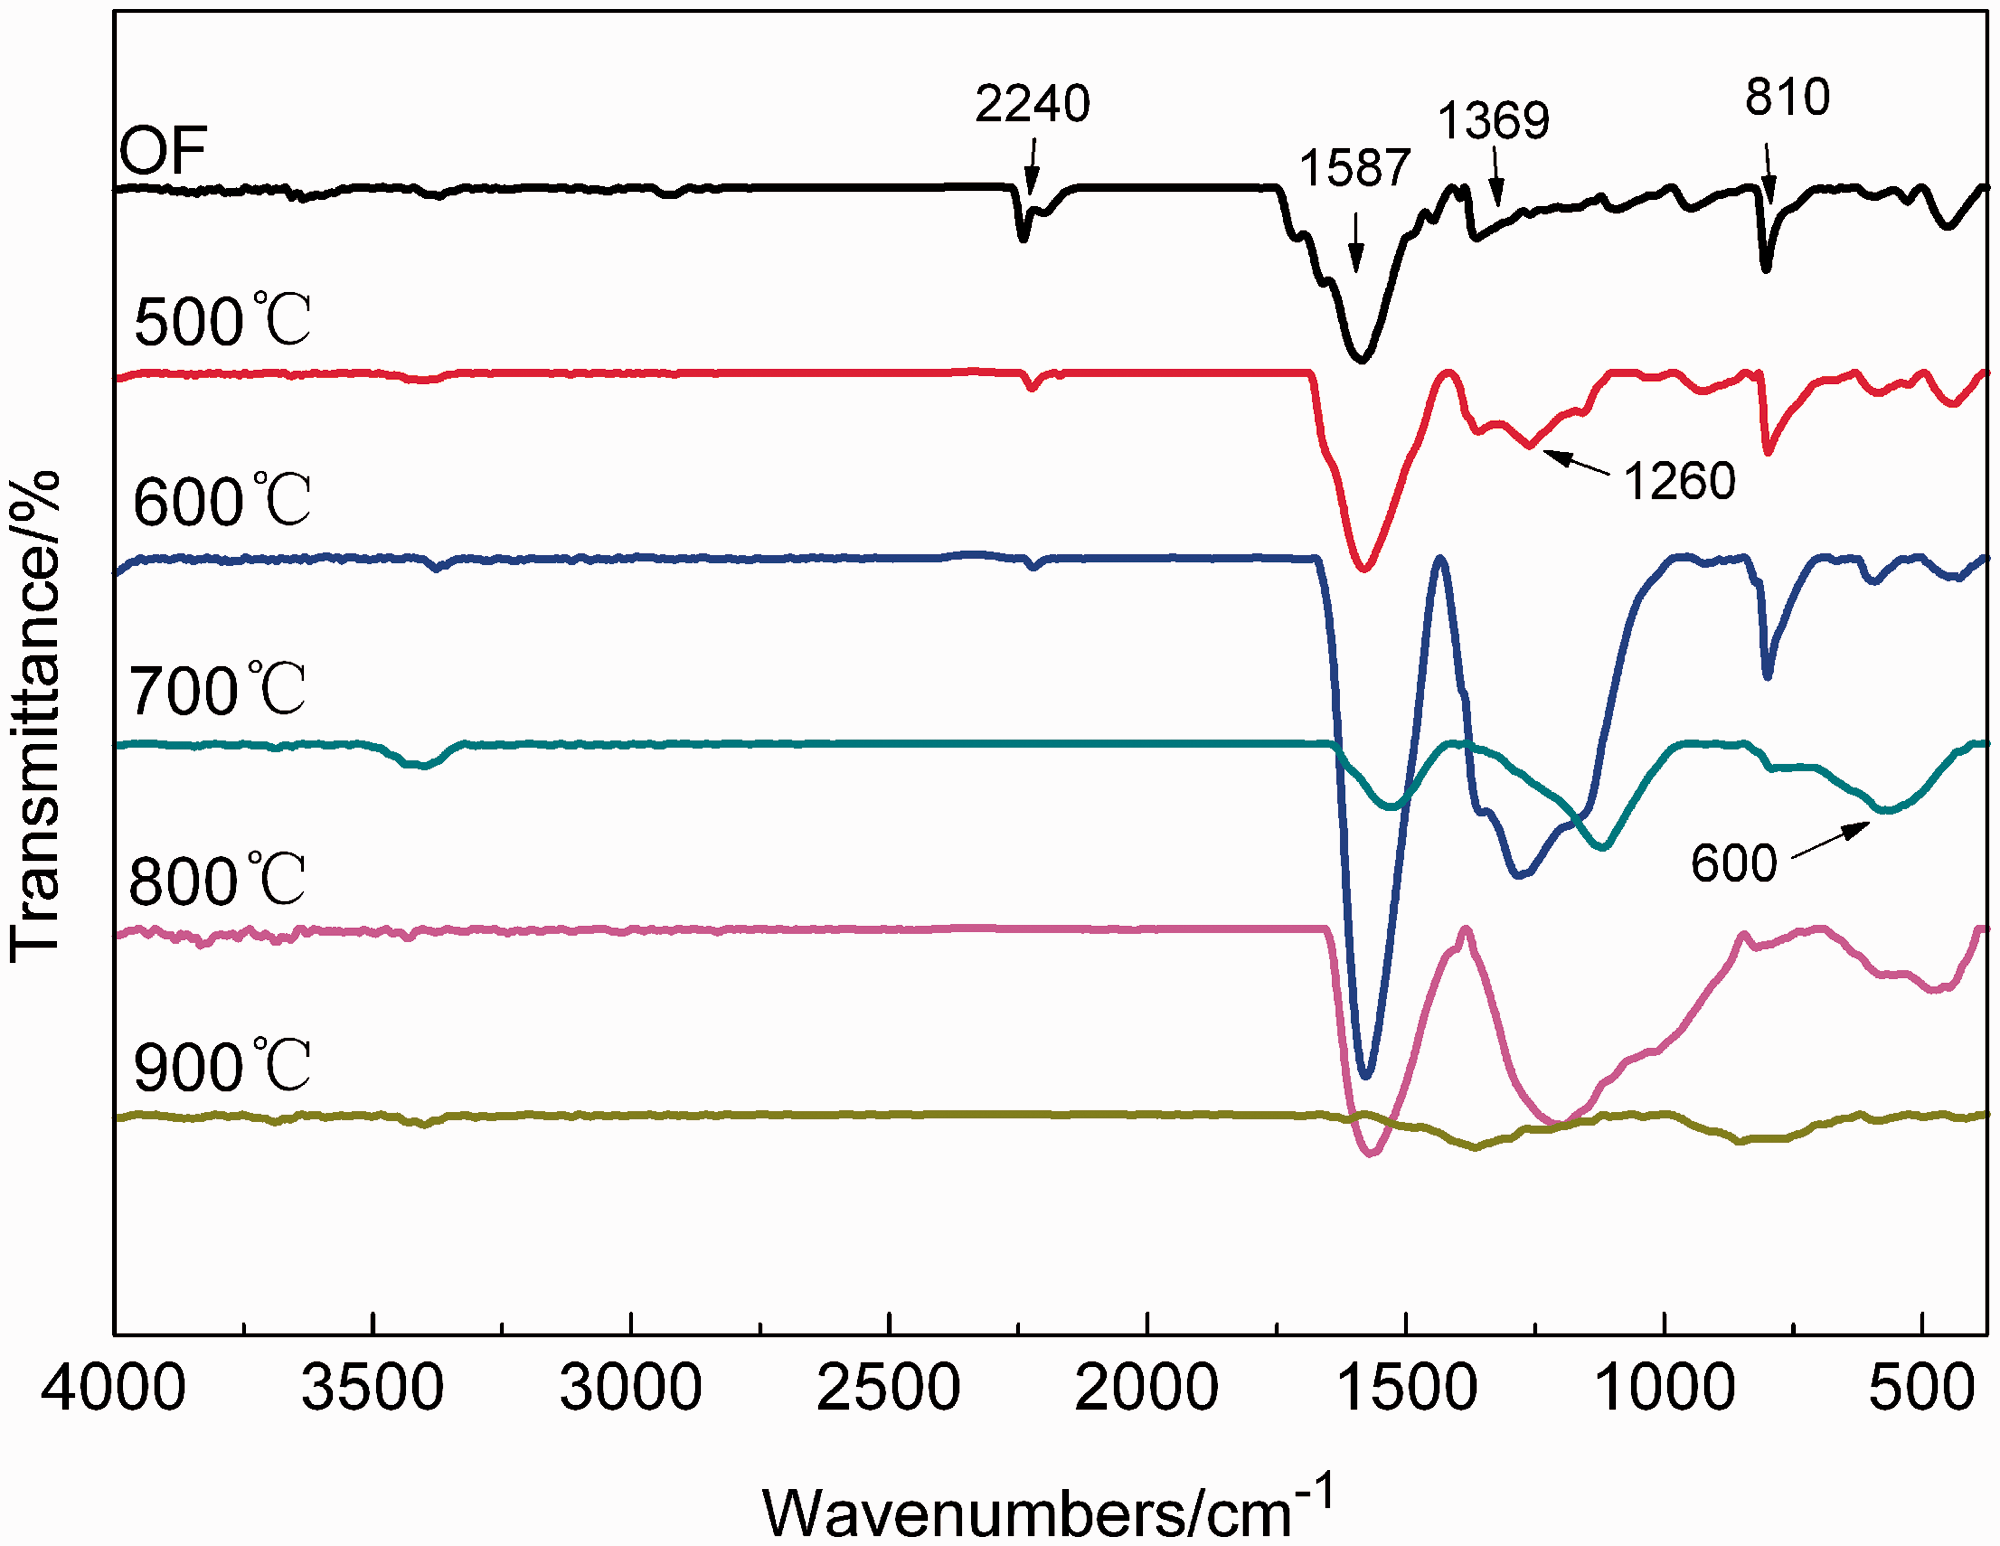
From 500℃ to 600℃, the intensities of 2240 cm−1, attributed to C ≡ N bond, decrease and the intensities of 1587 cm−1, attributed to C=N, C=C and N–H, increase. It indicated that the bond was transformed from C≡N to C=N and C=C. The intensities of 1369 cm−1 (due to CH2) decrease, while the intensities of 1587 cm−1 (due to C=N, C=C and N–H), of 810 cm−1 (due to C=C–H), and of 1260 cm−1 (ether bond connected to the aromatic structure) increase. It indicated that the long-chain structure disappeared gradually and the “trapezoidal” structure grew and the number of “trapezoidal” structure increased. These results showed that non-carbons, such as N, H and O were removed and cyclization reaction continued in this stage.
In the case of the sample treated at 700℃, the absorption peaks at 2240 cm−1, 1369 cm−1, and 810 cm−1 disappear, the intensities of the absorption peaks at 1587 cm−1 and 1260 cm−1 decrease, while the intensities of the fingerprint region at 600 cm−1 increases slightly. These results showed “trapezoidal” structure stopped to grow and the carbon basal plane began to form in this stage, and non-carbons were further removed. For the sample treated at 800℃, the intensities of the peak at 1587 cm−1 and the peak 1260 cm−1 increase compared to 700℃ carbonized fiber. It indicated the aromatization reaction promoted the formation of the six-membered ring carbon networks. In the case of the sample treated at 900℃, the spectrum becomes very irregular and the absorption peaks weaken. It indicated the content of non-carbons was low, and the multiple layers of carbon basal plane formed.
Through comprehensive analysis on the results of stress–strain curves, XRD, FT–IR, and HRTEM, we found 700℃ was a key demarcation point in low-temperature carbonization. When the temperature is lower than 700℃, the carbon basal plane has not formed. The degree of cross-linking is low and the intermolecular forces are weaker between molecular chains. Therefore, the fracture has occurred before molecular chains slip, which results in a sharp fall of the stress. Meanwhile, no obvious yield occurs. With the increasing of carbonization temperature, aromatization reaction promotes the cross-linking between molecular chains, and the carbon basal planes are gradually formed. When the tensile load is larger than the elastic limit, firstly chain slippage occurs, which leads to yield phenomenon. Then, the larger tensile load needs to overcome the force of interchains and intrachains. When the tensile load is larger than the tensile strength of the fibers, the fiber breaks at last. With the increase of temperature, the stiffness of chains becomes higher due to cross-linking and aromatization reactions. Therefore, the yield point appears earlier with the temperature increasing.
Using RDF based on XRD, we found the short-range structures were similar for different carbonized fibers, and we speculated that the main reasons for the different increasing trends must not be the short-range structure between tensile strength and elastic modulus. Combined with the results of HRTEM and FT-IR, we found that the long-range structure (characterized by the degree of crystallinity and orientation degree) might give a reasonable explanation. From the HRTEM images, it was shown that with the increasing of carbonization temperature, the degree of crystallinity and crystal size of fibers gradually increased. The changing trend was consistent with the transformation of the chemical structure revealed by FT-IR, and resulted in the gradual increase of tensile strength. In the range of 800–900℃, the increase of orientation degree was outstanding, which was consistent with the trend of increase rate of elastic modulus. It should be the main reason for the rapid rising of elastic modulus.
Conclusion
From the stress–strain curves, the low-temperature carbonization process can be divided into two stages: 500–700℃ and 700–900℃. For the tensile strength and elastic modulus, the mechanical performance of 900℃ carbonized fiber is the best in the range of 500–900℃, but the increase rates are different with the increase of temperature. The tensile strength is more nearly directly proportion to temperature, especially higher than 600℃. The elastic modulus firstly increases slowly from 500 to 700℃, and then increases rapidly after 700℃. Short-range structures have no effects on the mechanical performance. The uniform increasing rate of tensile strength is closely related to the crystallinity and crystal size. With the increase of the crystallinity and crystal size, the tensile strength increases obviously. The outstanding increase of orientation degree is closely related to the increase of elastic modulus.
Footnotes
Funding
The authors thank the financial support of the National Basic Research Program of China (973 Program) under grant no. 2011CB605601, National Natural Science Foundation of China under grant no. 50902088, Postdoctoral innovation projects in Shandong Province under grant no. 200902028, and Independent Innovation Foundation of Shandong University, IIFSDU.