
Abstract
Since composite structures with soft-material matrix do not have adequate pullout resistance with flat-type reinforcements such as fibers, there are increasing cases where reinforcements with passive resistance are used in conjunction. So, loop-formed polyethylene fibers were used to reinforce soil against shear loading. Afterward, shear behavior of both fiber and loop-formed fiber-reinforced soil composite samples was modeled by using “force-equilibrium method” and “slippage theory” of short fiber composites. The proposed model indicated that both fiber parameters and ambient conditions determine shear strength of a fiber-soil composite. In the next step, a set of laboratory direct shear tests was performed on different samples including neat soil, loop-formed fiber and fiber-reinforced treatments. Thus, it was found that the performance of polyethylene looped fibers in shear strength improvement of soil composite is more than that of the ordinary polyethylene fibers. In addition, a novel apparatus based on fiber pullout test was designed to determine the interfacial shear stress between fiber and soil. Finally, an artificial neural network technique and least square method were used to calculate “fiber reinforcing amplitude” and “slippage ratio”, as input parameters required for the model. Consequently, both the proposed models and established artificial neural network adequately predicted shear behavior of loop-formed fiber and fiber reinforced soil composite.
Introduction
As a soft material, soil is relatively strong against compressive external forces but very weak against tensile stresses [1]. Fibers can be useful in this way due to mechanical reinforcement and economical benefits [2,3]. Therefore, randomly distributed fiber-reinforced soils have recently attracted increasing attention in geotechnical engineering for the second time as mimicry of the past [4]. Mainly, fiber reinforced soil behaves as a composite material in which fibers of relatively high tensile strength are embedded in a matrix of soil. Shear stresses in the soil mobilize tensile resistance in the fibers, which in turn imparts greater strength to the soil [5–7].
Short fiber reinforced soil composites have been conventionally designed using composite approaches to characterize the contribution of fibers to stability. In these cases, the mixture is considered as a homogenous composite material [8]. A comprehensive literature review shows that composite models have been proposed by several investigators including mechanistic models [9 and 10], a statistical model [11] and an energy-based limit analysis model [12].
Models based on a volumetric homogenization technique but limited to the description of non-linear elastic behavior have been also presented by Ding and Hargrove (2006) [13] for monotonic loading and by Li and Ding (2002) [14] in cyclic loading conditions. A complete constitutive law for soils reinforced with continuous filament (Texsol) has been presented by Villard et al (1990) [15] and Prisco and Nova (1993) [16] employing the superposition of sand and fiber effects. The model proposed by Villard et al (1990) is the only one that recognizes the importance of fiber orientation as a parameter governing the effectiveness of fiber inclusion. Recently, a two-dimensional distinct element method (DEM) has been developed for the micromechanical analysis of mixtures of granular materials and flexible fibers [17,18]. Numerical analysis with finite difference code has been performed by Babu et al (2008) [19]. Abtahi et al (2008) [7] extended the shear lag theory proposed by Cox (1952) [20] to explain the role of fiber length and fiber diameter in short fiber soil composites. Thus, it was found that by increasing the fiber length and deceasing fiber diameter, the compressive strength of the soil will improve [20,21]. In another work, Diambra et al (2010) [22] presented a model based on the rule of mixtures of composite materials at conventional triaxial soil tests. The model considers that fibers behave linear elastically and the soil, when unreinforced, obeys the simple linear elastic perfectly plastic Mohr-Coulomb model [22]. As well, using artificial neural network (ANN) to predict the role of fiber parameters on shear strength of short fiber soil composites has been successfully reported by Abtahi et al (2010) [23,24].
However, in every respect, ordinary short fibers reinforcing soil can be damaged during the compaction of soil [25]. Moreover, since soft materials with insufficient friction do not have adequate pullout resistance with flat-type reinforcements, there are increasing cases where reinforcements with passive resistance are used in conjunction [26,27]. Accordingly, there is a need to develop a system that can maintain good pullout resistance properties, while minimizing the damage to reinforcements caused by soil compaction [28]. Based on these motivations, the idea of using loop-formed fibers capable of minimizing damage to reinforcement has been developed for soft-matrix composites in this study. For this purpose, polyethylene (PE) loop-formed fibers were used as reinforcing elements due to economical advantages, feasibility of using PE waste strands and excellent alkaline resistance [29,30].
On the other hand, soils mixed with randomly distributed fibers can be used as patches in the localized repair of failed slopes, soil protection and/or wall stabilization. Therefore, shear strength of fiber reinforced soil would be considered as an important concept [31]. So, this paper firstly introduces a novel method of reinforcement of composite materials, i.e. loop-formed fibers. After that, shear behavior of fiber and looped fiber reinforced soil composite will be investigated by using both theoretical models, based on force-equilibrium method and slippage theory of short fiber composites, and a set of direct shear tests. In this way, a novel apparatus based on fiber pullout test will be used to determine the interfacial shear stress between fiber and soil and to complete the required input parameters of the proposed model.
Shear modeling of fiber and loop-formed fiber reinforced soil composite
General description
The shear resistance force of loop-formed fibers has two major components including: (a) the friction force between soft-matrix and vertical elements of looped fiber (F1) and (b) shear resistance force of soft-matrix within the loop (F2). Therefore, the total improvement in shear strength of composite (ΔSt) can be written in accordance with [28]:

Modeling of “fiber effect”
Soil samples reinforced with short fibers may be analyzed as if it were a composite material in which fibers of relatively high tensile strength are embedded in a matrix of lower tensile strength. Force is mainly carried from point to point within the soil matrix by forces tangential to the fibers producing differing tensions along their length. These tangential forces may be carried by friction between fibers and surrounding matrix. So, in this work, the Waldron's method [32] is extended to model the role of fibers in shear improvement of composite soil.
For simplification, it is firstly assumed that reinforcing fibers have a general vertical orientation normal to the shearing surface of the soil matrix. Figure 1 shows the schematic of the proposed model. The following assumptions should be made in the model: (1) composite shearing occurs in a horizontal zone of thickness D which is penetrated by vertical fibers and/or vertical elements of looped fibers; (2) D does not change during shear; (3) fibers are flexible with circular cross-section, of uniform diameter df and are linearly elastic with the modulus of Ef; (4) the looped fibers have squared shape, i.e. The schematic of the proposed model.
According to the short fiber composite theory proposed by Cox (1952) [20], the soft matrix (soil) inserts tension on the fibers and/or looped fibers through tangential stresses τ which has a maximum value at non-slippage zone (τmax). When the upper mass of matrix in Figure 1 has been displaced a distance Δx, the fiber segments

Consequently, fiber displacement ΔD within the shearing zone D can be obtained through:

According to force equilibrium existing on a fiber element that has been shown in Figure 2, the following equation can be written [32]:
Force equilibrium on a fiber element during the shearing of the composite.

Figure 3 shows shear and tensile stress distributions within a fiber by considering the “slippage phenomenon”. According to the “slippage theory” in short fiber composites, it is supposed that during extension, there is slippage near both ends of fiber and a central region along the fiber length gripped by the matrix which is called non-slippage region. If λ is defined as the fiber slippage ratio, which is the ratio of fiber length of the slipping portion to the whole fiber length D, the slippage from each end of the fiber will occur over a length of λD/2 [33].
Tensile and shear stress distribution within a fiber during the shearing of the composite.
In other words, λ is the value of fiber cooperation and assistance in the bearing of induced tensile stresses during the shearing of the matrix. If M is the point on

Thus σmax will be:

Since

So, the length of the fiber under tensile stress is:
From Figure 3, it is clear that the average tensile stress σav can be calculated in accordance with:

Consequently, σav will be:

So, combination of equations (3) and (8) and substituting in equation (2) gives:

Therefore, considering equations (10) and (11) will be:

Thus, σmax can be obtained through:

So, the maximum induced tensile force within the single fiber element can be divided in tangential force (Ft):


In which φ is the soil friction angle according to the Mohr-Coulomb equation. Currently, assume that there are Nf looped fibers within the shearing zone, i.e. there are 2Nf fiber vertical elements within the shearing zone. Therefore, the total tangential force of reinforcing looped fibers resisting against shear (Fft) will be:

So, the total shear strength improvement of looped fiber reinforced soil composite ΔS1 can be calculated by:


It is clear that the interfacial shear stress between fiber and soil τ can be obtained by:

Therefore, equation (19) changes to:

In which µ is the coefficient of friction between fiber and soil, while σv represents vertical stress inserted on the soil composite. The parameter µ can be obtained by a novel pullout test technique that will be discussed in the following.
Modeling of “loop effect”
The “loop effect” is the main benefit and the key advantage of using loop-formed fibers over ordinary fibers in the reinforcement process. It means that the existence of soft-matrix, i.e. soil, within the loop leads to produce an additional resisting shear stress during shear loading of composite. The produced shear stress performs between “soft matrix surrounded by loop” and soft matrix mass tangential over the loop. Consequently, shear strength improvement of composite derived by the “loop effect” ΔS2 can be calculated by division of effective shear force “

Total shear improvement
As it was previously mentioned, the total shear improvement of loop-formed fiber reinforced soil composite ΔSt is summation of “the fiber effect” and “the loop effect”. Therefore, according to equation (1) and merging equations (21) with (22), ΔSt can be obtained by:

It is clear that in the case of fiber reinforced soil composite, equation (21) should be only used to analyze shear strength envelopment ΔSt.
Materials and methods
Sample preparation
Some physical properties of soil used in this study.

Description of different polyethylene (PE) treatments used in test program.

Fiber length.
Determination of fiber diameter
As it can be seen from equation (23), fiber diameter df is an important input parameter to predict shear improvement of fiber and/or looped fiber reinforced soil composite. Therefore, microscopic method was used to measure df accurately. In this way, a digital microscope capable of connecting to PC with the zoom of 40 was selected for all samples. Thus, the values of df for different treatments were obtained that has been shown in Figure 4(a–c) and registered in Table 2.
Fiber diameter df for different treatments: (a) No. 4 (PEG/14/10/2); (b) No. 1-3 and No. 5-9; (c) No. 10 (PEG/6/30/1).
Fiber pullout test
Coefficient of friction between PE fiber and soil µ was measured using a novel pullout test method. In this way, the Instron Tensile Tester (Zwick universal testing machine 1446 60, 1994, Germany) was modified to provide fiber pullout test through the soil matrix. The schematic of the apparatus is shown in Figure 5. The fiber embedded length Lembf was chosen as 10 mm, meanwhile the vertical stress σv on all samples was 25 kPa. The pullout test was performed with the speed of 20 mm/min. This speed was determined in accordance with the fiber embedded length and based on the fact that the total time of the test should be 30 to 60 sec.
Sketch drawing of the pullout test (not to scale).
According to the experimental design, pullout test for each treatment was repeated five times. Firstly, the maximum value of induced tensile force T1 within the metal wire was obtained through the force-time diagram derived from PC. Afterward pullout force T2 could be calculated by using [34]:


Thus, the mean value of μ was obtained 0.35.
Direct shear test
The shear tests were conducted using a standard, laboratory direct shear apparatus in accordance with ASTM D 3080. The specimens for the shear tests were shaped in a cylindrical mold with 20 mm height and 63 mm inner diameter by static compaction at the respective optimum moisture content (OMC) state of the soil. The OMC value was determined 13.82% through the standard Proctor compaction test designated by ASTM D 698.
The shear tests were strain controlled with the rate of 1 mm/min. The tests were also performed at three vertical normal stresses (σv) of 49, 98 and 196 kPa in order to determine the shear behavior of the soft-matrix composite at different compressive loads. According to the experimental design, three direct shear tests should be repeated for each treatment. Results of three different tests for the neat soil were presented in a chart with maximum measured shear stress on vertical axis and vertical normal stresses (σv) on the horizontal axis. A linear curve was fitted to the test result points. The intercept of this line with the vertical axis gives the cohesion C and its slope presents the peak friction angle φ. Consequently, the corresponding friction angle of neat soil φ and cohesion C measured in direct shear was 35° and 19 MPa, respectively.
According to the proposed model polyethylene fibers and grids were always placed in a regular pattern at approximately equal spacing from each other. As well, it was made an attempt that reinforcing elements were placed in a perpendicular orientation to the shear plane. Both shear stress and vertical deformation were recorded as a function of shear or horizontal displacement up to a total displacement of 9 mm. The experimental shear improvement of composite soil 
Establishment of an ANN
Architecture of ANN
Based on the proposed model, to analyze the performance of fiber and/or looped fiber reinforced soil composite, the first problem is calculation of D and λ as input parameters (see equation (23)). By considering Figure (1) and equations (2) to (23), each one can find that D is the length of the fiber which deforms during shear loading of the soil composite. Since the two parameters of D and λ refer to fiber performance during shearing of composite, a semi-empirical method should be used to analyze the performance of reinforcing elements and to compare experimental results with model outputs. For this purpose, an ANN was established on the experimental data obtained from direct shear test. So, it was tried to determine the best values of D and λ by using the predicted values of ΔS.
In this way, multilayer perceptron (MLP) was used as a common and powerful ANN that is capable of modeling complex functions with hidden layers. The number of hidden layers depends on the complexity of functions and input features. Frequently, using more than two hidden layers does not improve the performance of the system, and only increases calculations [35]. In this work, two hidden layers were used to train the network. Based on experiences, the number of hidden neurons should be lower than the number of input neurons. As well, experiments show if the number of hidden neurons takes nearly one-half of the number of input neurons, the ratio of performance to cost will be optimum. Therefore, the architecture of the designed ANN was an input layer that consisted of seven neurons (number of reinforcing elements Nf, fiber diameter df, Elastic Modulus of fiber Ef, coefficient of friction between fiber and matrix µ, vertical compressive stress σv, mesh length Lf and being “ordinary or looped fiber”); two hidden layers, each layer with four neurons and an output layer including one neuron (
The transferred function of output layer was chosen linear. Figure 6 illustrates the architecture of the designed ANN.
The architecture of the designed artificial neural network (ANN).
Training ANN
Training is a necessary part for classifying with ANN. MLP is a supervised ANN and needs target addition to input for the training. Standard algorithm for training MLP is fed forward back propagation. Levenberg-Marquardt is the most popular algorithm for training MLP ANN [35]. This algorithm is often the best method for MLP training, since the method is fast and numbers of training epochs are low, as well the performance of ANN after training with this method is closed to goal. Other network parameters for training phase were as follows: learning factor = 0.05, stop condition = maximum number of epochs reaches 1000 or the mean square error is less than 0.002. Initial bias and weights were randomly selected between −1 and 1.
In the first step, there was 81 input data to implement the designed ANN algorithm in Matlab 6.1 software (9 treatments, 3 vertical stresses and 3 repeats). Training set was built from 70 samples which were normalized before the training phase. After the training phase, the network was evaluated by validation of the rest of samples using MSE as an indicator index. According to the diagram of MSE vs. number of epochs that has been shown in Figure 7, the best validation performance is 0.00136 at 8'th epoch.
Performance of training of artificial neural network (ANN).
Results and discussions
Stage analysis of the proposed model
As it was mentioned previously, the first problem is calculation of D and λ as input parameters in equation (23). D is the length of the fiber and/or looped fiber which deforms during shear loading of soil composite. This deformation induces a tensile stress within the fiber that can resist against shearing of soil composite. Thus, shear improvement ΔS can be achieved by the attendance of fibers through the soil composite. In other words, D is the thickness of the sheared zone in which fibers and/or looped fibers corporate perfectly with the soil matrix throughout shearing. Therefore, let the authors to entitle D as “the reinforcing amplitude of fiber” within the soil composite. However, it is difficult to determine the reinforcing amplitude of fiber D as an input parameter in equation (23). It is clear that D is a function of total fiber length and/or loop mesh Lf. The same comment is applicable for slippage ratio λ, i.e. the more the value of λ leads to the more fiber disobedience during the insertion of tensile stresses. Fundamentally, λ determines the induced tensile stress distribution derived from shear loading of soil composite on fiber segment D. Altogether, the two parameters of D and λ refer to fiber performance during shear loading of soil composite. Consequently, a semi-empirical method should be used to obtain ΔS through the proposed model, to evaluate the fiber and/or looped-fiber performance (determination D and λ) and to compare experimental results with model outputs.
Therefore, it was decided to establish an ANN system on data obtained from direct shear tests performed on treatments No. 1 to 9. It means that the parametric characters of the treatments of No. 1 to 9 were firstly considered as input data for ANN; meanwhile ΔS was designed as output parameter. After that the training process was finished, the predicted values of ΔS were used to determine the best values of D and λ. In this way, least square error (LSE) method was generalized to find the superlative values of D and λ with the best fitness that will be discussed in the following. In the final, two PE looped fibers as two new treatments (No. 10 and 11) were prepared with certain specifications. The shear strength improvement of these treatments was mutually obtained by experimental work (direct shear test) and by the proposed model (according to obtained D and λ). Figure 8 demonstrates the schematic of the stage analysis of the research work.
The schematic of the stage analysis of the research work.
Using LSE method to find D and λ
ANN-predicted values of ΔS for the treatments of No. 1-3 can be employed to find D and λ by using LSE method. Therefore, in the case of looped fiber reinforced soil composite, equation (23) can be rewritten on the basis of independent variables of Nf and 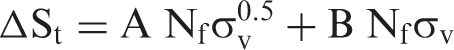


As if D is considered as a function of fiber length and/or looped mesh Lf, i.e. D = Lf/a, equation (30) changes to:

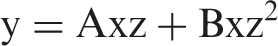
By using LSE method, the authors have proved that coefficients of A and B can be obtained through dependent and independent variables of Yi, Xi and Zi for i = 1 to n, respectively (see Appendix A):


Thus, “a” was obtained as “2.92”. By understanding “A” and putting D in equation (29), fiber slippage ratio λ can be derived:

From equation (36), λ was calculated “0.52”.
Experimental and theoretical analysis of results
The analytical calculations in the past section demonstrated that one-third of the fiber and/or looped fiber deforms approximately during shear loading of soil composite (a = 2.92). This deformation induces a tensile stress within the fiber that can resist against shearing of soil composite. As well, the derived value of λ indicates that about half of the deformed segment of fiber length D bears completely the maximum induced tensile stress σmax (λ = 0.52). It is emphasized that the derived values of λ and “a” are only applicable in the case of the used soil and PE fibers. However, the proposed model provides an analytical method to investigate the performance of fiber-soil composite and to predict the role of soil and fiber parameters on soil shear improvement ΔS.
Shear strength improvement (ΔS): comparison between experimental results and model outputs (λ = 0.52, a = 2.92).
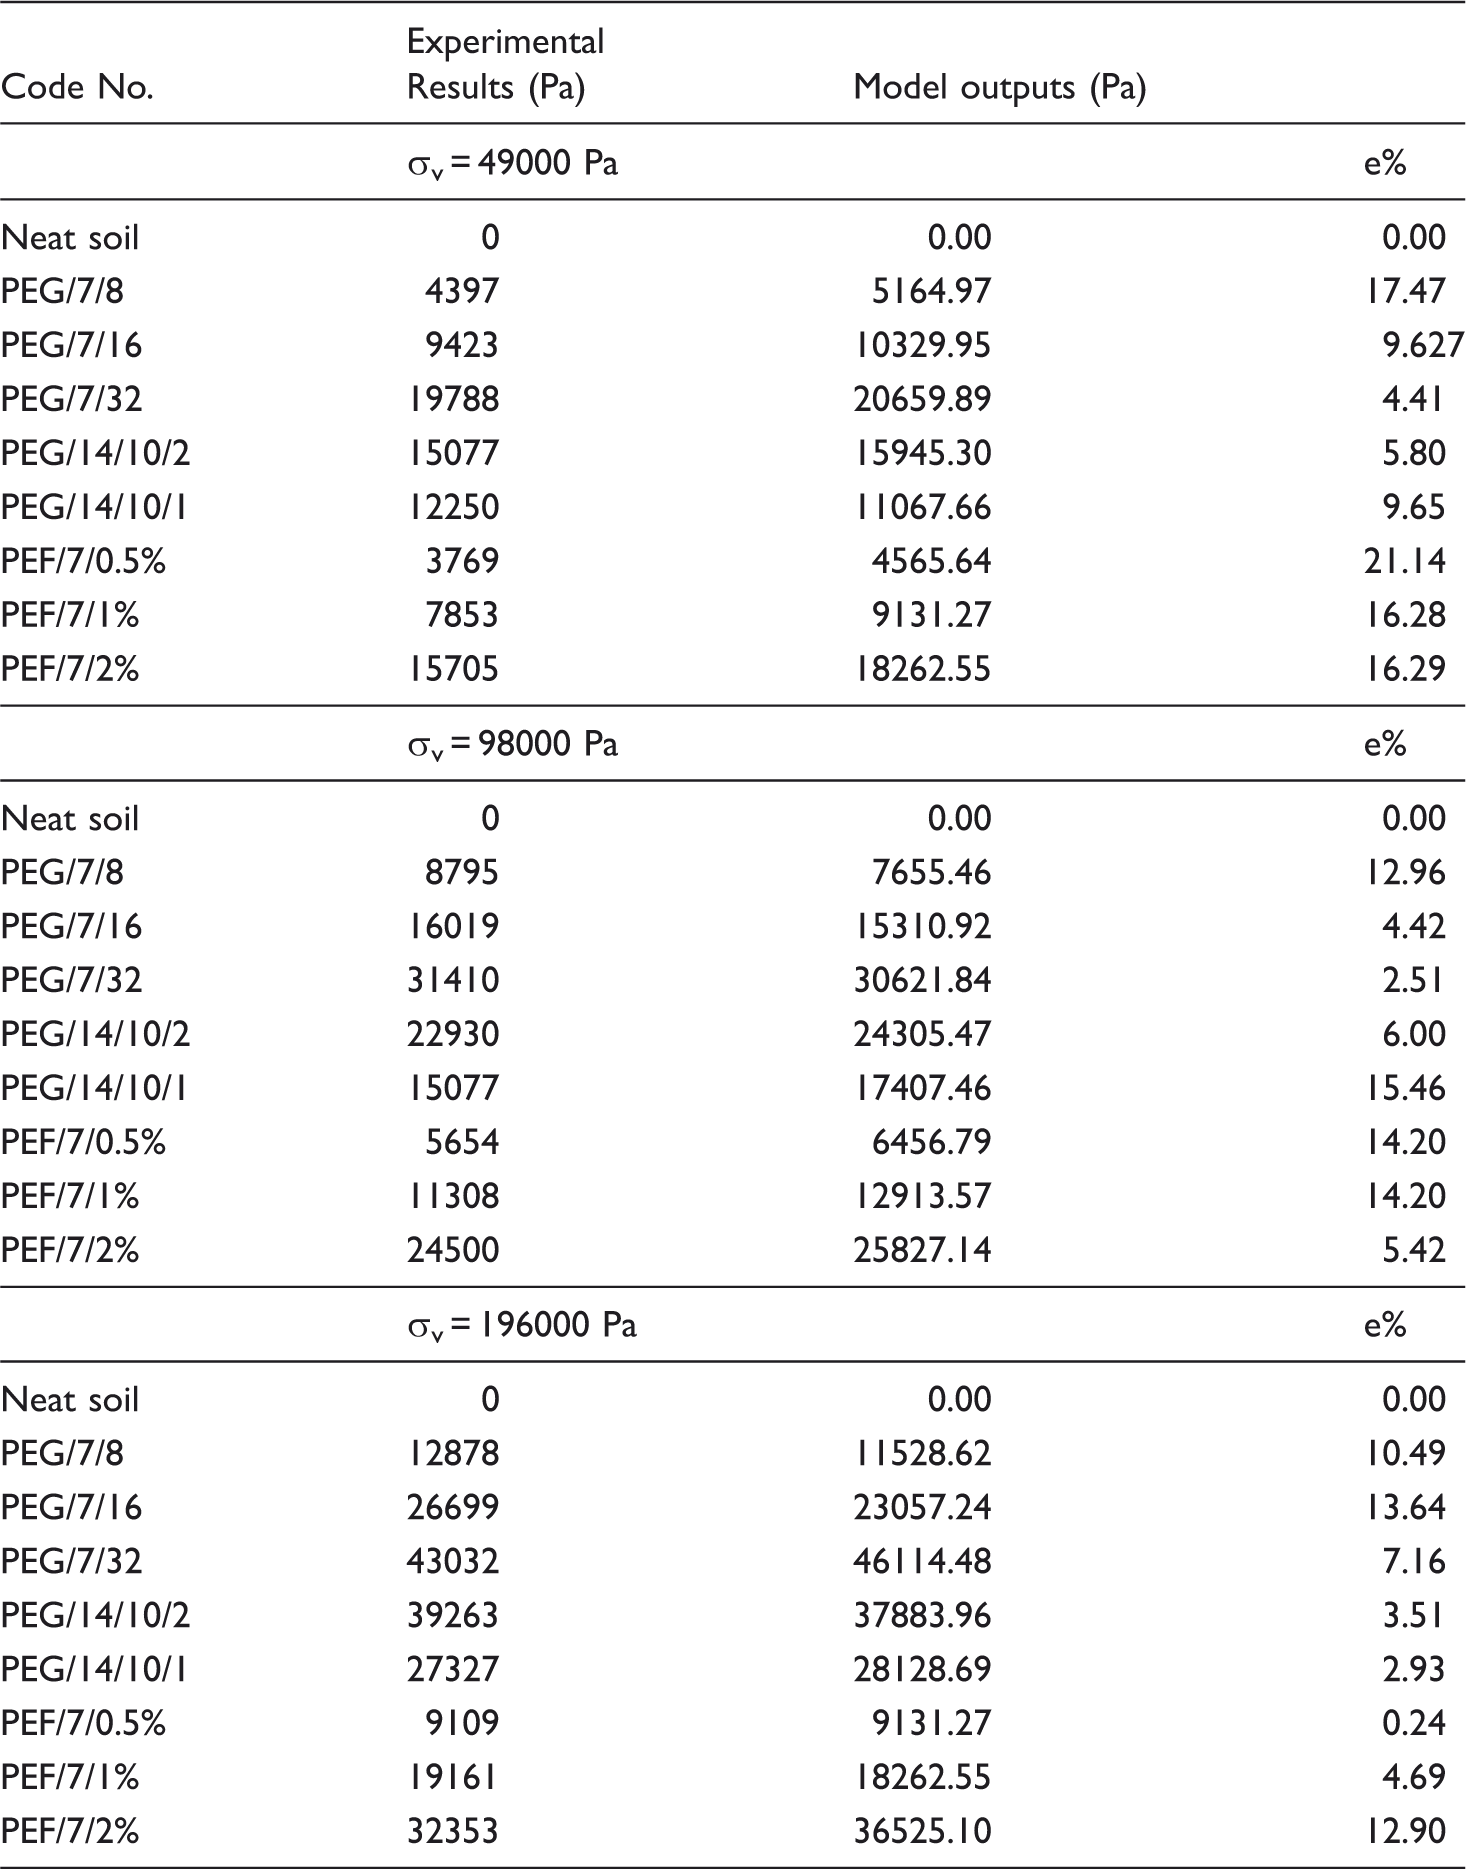
On the other hand, it is sufficient to compare pair samples of (PEF/7/0.5%, PEG/7/8), (PEF/7/1%, PEG/7/16) and (PEF/7/2%, PEG/7/32). So, it can be found that apart from applied vertical stress, the value of ΔS in the case of looped fiber reinforced samples is more than that of fiber reinforced treatments. This result is due to the “loop effect” that was discussed previously. A looped fiber as a reinforcing element includes two vertical components. These vertical elements perform like two vertical fibers in a soft-matrix composite. As well, looped fibers have looped-form configurations which create some additional shear resistance. Therefore, at the same orientation, fiber content and fiber length, loop-formed fibers reinforce the soil (as a soft-matrix material) superior than ordinary fibers.
The loop samples of PEG/14/10/2 and PEG/14/10/1 are only different in modulus of elasticity and fiber diameter (see Table 2). The modulus of elasticity of the later sample is about three times greater than that of the former, while the former treatment has approximately twice fiber diameter compared to the later. As it can be seen, loop sample PEG/14/10/2 gives more shear improvement compared to PEG/14/10/1 in all tested vertical stresses. This outcome was as well predicted by the proposed model and shows that the effect of fiber diameter in shear improvement is more important than modulus of elasticity of fiber. This is because the failure mechanism of such a soft-matrix composite is governed by the pullout of the fibers. The more the fiber diameter, the more induced tension force is obtained. Here, the authors emphasize that as the fiber diameter decreases, the stress transfer from matrix to fiber will be improved due to less slippage, but, the induced tension force resisting against inserted shear stress is small.
Altogether, the proposed model adequately predicts shear behavior of soft-matrix composites reinforced with fibers and/or loop-formed fibers. According to the obtained results, the percentage of error for the model is estimated to be 9.64% (12.58% in the case of σv = 50 kPa, 9.40% in the case of σv = 100 kPa and 6.94% in the case of σv = 200 kPa).
Evaluation of the proposed method by new treatments
The fiber parameters of treatment No. 11.
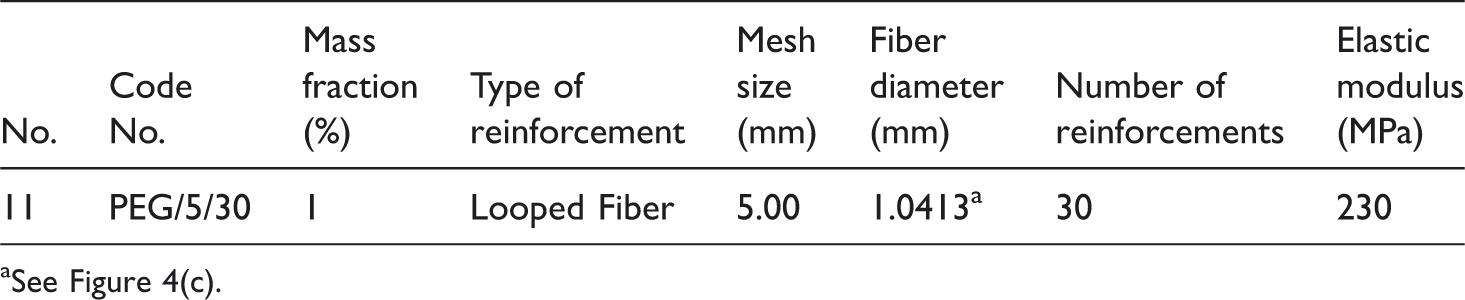
See Figure 4(c).
shear strength improvement (ΔS): comparison between experimental results and model outputs in the case of treatments of No. 10 and 11 (λ = 0.52, a = 2.92).
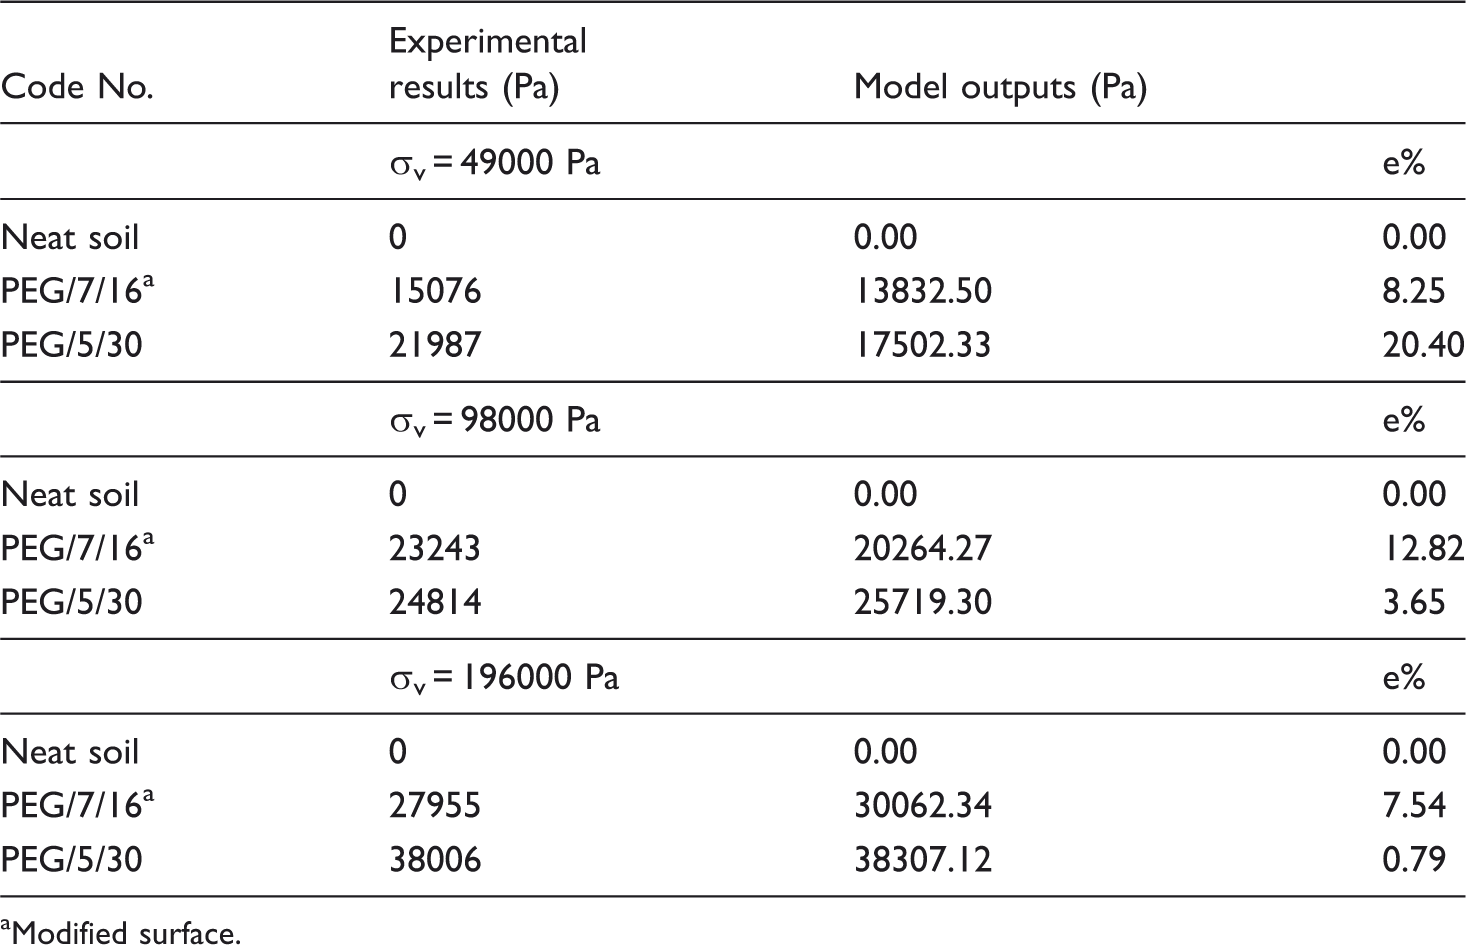
Modified surface.
In the final, an important outcome can be achieved by comparing treatments of No. 10 and 11. The two samples are different in fiber frictional property (0.67 vs. 0.35) and number of reinforcing elements (16 vs. 30). Both of experimental results and model outputs illustrate that ΔS is greater in the case of the later sample compared to the former one (see Table 5). This concept shows that the importance of number of reinforcing elements in soil shear strength improvement is more with regard to fiber frictional property.
Conclusion
The main aim of this paper was to introduce loop-formed fibers as a novel method to reinforce composite materials. Thus, an analytical model was developed to investigate the performance of both fiber and looped fiber soil composites. The presented model demonstrated that shear resistance of loop-formed fibers has two major components including “fiber effect” and “loop effect”. The fiber effect was modeled by using “force-equilibrium method” and “fiber slippage theory” derived from mechanics of short fiber composite. The model is based on the fact that shear stresses in the soil composite mobilize tensile resistance within the fibers, which in turn imparts greater strength to the soil. The “loop effect” means that the existence of soft-matrix, i.e. soil, within the loop leads to produce an additional resisting shear stress for the duration of shear of composite. The produced shear stress performs between “soft matrix surrounded by loop” and soft matrix mass tangential over the loop.
The proposed model indicated that number of reinforcing elements Nf, fiber diameter df, Elastic Modulus of fiber Ef, coefficient of friction between fiber and soil matrix µ, vertical compressive stress
In addition, coefficient of friction between fiber and soil was measured by a novel pullout test method. Consequently, the Instron Tensile Tester was modified to provide fiber pullout test through the soil matrix. Accordingly, the proposed method predicts ΔS accurately with the error estimation of about 9%.
Funding
The authors gratefully acknowledge the generous support of the New Developments in Civil Engineering R&D Group at the Isfahan University of Technology (IUT) and the funding provided by the Department of Textile Engineering, IUT.