
Abstract
We use recent methodological developments in change point analysis that estimate structural changes in multivariate time series – both in level (mean) and variance – adding to the literature on long-term North American sports league competitive balance tracking. Our method estimates changes by simultaneously examining 9 competitive balance measures that include game uncertainty, playoff uncertainty, and consecutive season uncertainty classifications. This approach provides insight into structural changes in competitive balance not found in other work while also identifying the competitive balance measure(s) most responsible for estimated change points. Additionally, we identify changes to the variance structure of balance, which was not previously considered in the structural change literature. Overall, rival leagues, labor supply increases, expansion, and changes to playoff structures are most commonly concurrent with structural changes. We suggest relevant research extensions for sports economists.
Introduction
In this paper, we add to the body of research on the long-term tracking of competitive balance (CB) for Major League Baseball (MLB), the National Basketball Association (NBA), National Hockey League (NHL), and National Football League (NFL) using a novel structural change method. Most tracking exercises have applied structural change detection methods in the context of univariate time series, requiring separate estimations for each CB measure. However, the choice of measure is central to this univariate analysis, as some measures may be affected by certain types of policies while others are not. For example, measures may be more likely to respond to talent incentive investment changes, such as evolutions to playoff structures, while others are affected by rival leagues poaching talent that flattens talent supply or reduces the propensity for dynasties (Lee, 2009). Ultimately, analysis observing changes to only a single measure is unlikely to provide a comprehensive description of the evolution of CB over time (Kringstad & Gerrard, 2007).
We extend this structural change literature by introducing a previously unused method in the context of sports data: multivariate change point analysis (Cho, 2016; Cho & Fryzlewicz, 2012, 2014). This method estimates structural changes to CB across a panel of measures simultaneously and identifies those types of CB that are most prominently contributing to the structural changes in the time series. This allows closer inspection of economic questions about effects of playoff structures, expansion, and rival leagues on league talent distributions that could affect a number of dimensions of CB that are not represented in a single measure or type of measure.
Tracking CB near policy changes is informative with positive, negative, or null results as it pertains to subsequent league outcomes. A lack of change in CB near league policy points, for example, suggests support for predictions of the invariance principle and suggest ownership is reallocating rents without impacts on talent distributions (Rottenberg, 1956). Alternatively, improvements to CB in a post-policy period may imply the policy was effective in facilitating changes to the league talent distribution. While tracking does not causally identify underlying mechanisms of change, this descriptive research provides context for subsequent empirical work to more closely understand how league policies and rules work to do so. Our empirical approach can also estimate change points in the variance of these measures within and across years, allowing a close inspection of the core changes to a broader characterization of CB at crucial time points.
CB Measurement and Tracking
A central tenant of sports economics is that fan partizanship requires multiple teams to have some chance of winning a game or championship in order to retain league interest, recognizing that teams need one another to survive in order to produce games on the field. League-level CB management is therefore of direct interest, as some level of uncertainty will result from league-level regulation – often due to exclusive market protections – even if fans do not directly demand uncertainty (Fort et al., 2016). Analysis of CB is therefore central to both classical and contemporary models of sports leagues that depend on assumptions about fan partizanship (Humphreys & Miceli, 2020).
Which measures matter, what they measure, and how they are operationalized have been placed at the center of this discussion. The variety of CB measures is multifaceted and are largely categorized into 3 groups: Game Uncertainty (GU), Playoff Uncertainty (PU), and Consecutive Season Uncertainty (CSU). Many measures have been developed within each of these categories, usually in an attempt to explain a portion of variability within the talent distribution or league CB that was not addressed by prior measures. 1 Due to the limits on any single measure, as noted by Kringstad and Gerrard (2007) and Gerrard and Kringstad (2023), it is imperative to use a portfolio of CB measures when describing professional team sports. We follow this advice and acknowledge that no measure captures all the variation in the talent distribution as measured by league outcomes, resulting in considerable shortcomings when focusing on these single measures.
Most relevant to our work here, Lee and Fort (2007) and Fort and Lee (2007) originally estimated structural changes in CB in the NFL, NBA, NHL, and MLB with two GU measures. For MLB, changes occurred mostly early on in league history, often related to external economic shocks such as The Great Depression suggesting macroeconomic impacts on sports league health. The most common structural changes in the NBA, NHL, and NFL took place near rival league mergers, expansion, and team relocation, with mergers usually associated with improvements in balance. Across the board, there was very little evidence for large structural changes near policy implementation purported by ownership to improve CB (e.g., drafts, salary caps, revenue sharing). Similarly, work in college sport showed that structural changes were largely associated with labor supply changes, such as racial integration, and conference or divisional realignment (Mills & Salaga, 2015; Salaga & Fort, 2017).
Importantly, talent distributions can go unchanged while observed or perceived league CB and uncertainty are altered through changes to season or game-level characteristics such as playoff structures (Lee, 2009). While it is likely that changes to playoff structures potentially affect PU without changes to the talent distribution, it is also possible that playoff structures alter incentives for owners to invest in talent, affecting GU. Similarly, game-level rules changes can affect the contest success function in ways that alter CB outcomes both within and across seasons without any change to the distribution or investment of talent across teams.
We therefore provide new insight in the literature by estimating structural changes to CB with a portfolio of measures in unison with the implementation of multivariate change point analysis. This method can reveal information about the type of balance associated with change points and has the potential to identify additional changes not estimated in previous univariate analyses. We further compare our analysis directly with that of Lee and Fort (2007) and Fort and Lee (2007) for each of the 4 major North American leagues.
Data & Methods
Data and CB Measurement
Our data come from game results in MLB, the NBA, the NFL, and the NHL. We separately consider MLB’s National League (NL) and American League (AL), consistent with past literature (Lee & Fort, 2007). CB measures were calculated at the yearly level, and we refer to the year in which a season began for leagues that span the change to a new year. Each CB measure used here is described in Table 1, which includes 4 GU, 2 PU, and 3 CSU measures. 2 The average series values for all CB measures in all leagues are presented in Table 1 for reference. Prior to change point estimation, we scaled all measures to make their directionality consistent such that a decrease in the measure implies CB improvement.
Average CB Measure Value by League.
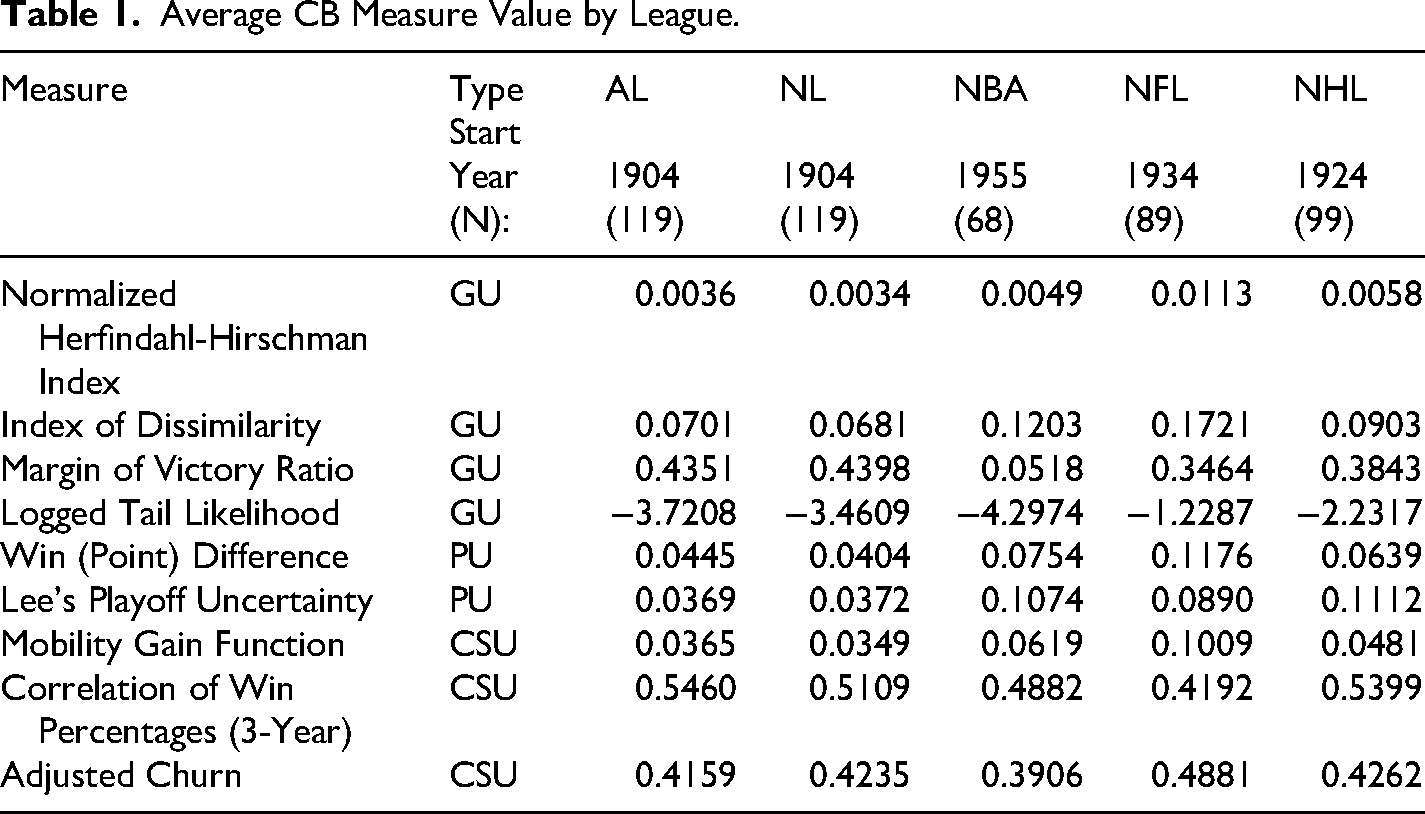
We chose cutoffs for the start of league time series primarily based on data availability and league size. For both the AL and NL, we cover 1904 through 2022, though other league data are more limited. 1904 was used as the starting year for both the NL and AL to allow equal length panels for both MLB leagues. While 1903 was the first season of cooperation between the NL and AL to create MLB and the World Series, we started the series in 1904, 3 years after the formation of the AL, because one of our CSU measures required 3 years of playing history to calculate.
The NBA panel spans from 1955 through 2022, with American Basketball Association teams included only after the merger in 1976. Although the first season of the NBA was in 1949, our data starts in 1955 due to some instability of franchises during the first 10 years of the league’s existence that affected the measurement of CSU. We included data from the NFL from 1934 through 2022, as earlier seasons were particularly tumultuous with many teams folding after only a single season in existence, which complicated measurement. Lastly, we began the NHL panel in 1924, as there were only 4 teams in the league prior to the 1924 season.
For the one season in the NHL that was entirely canceled (2004), we imputed the average CB measure value for the years just prior to and just following the year in question, as in past structural change work. We note that this inherently reduces the variability in the time series around this season, but it is the only imputed season across all leagues. In any partial season, we calculated the measure for the games played within that season, including, for example, the COVID-shortened 2020 seasons or the 1994–1995 MLB player strikes.
For the purpose of calculating CSU measures, we assumed a team is the same franchise if they move from one geographical location to another. Expansion franchises are included for most measures when they join a league, with the exception of the CSU measure, in which case they are included in the calculation starting in their second year in existence.
Multivariate (Panel) Change Point Analysis
The empirical approach we take has similar goals to much of the prior sports structural change literature, but we extend it by simultaneously analyzing multiple measures of CB in a multivariate time series. Adding to this work, we use a common approach for detecting change points which involves employing the cumulative sum (CUSUM) statistic. The CUSUM method is used when abrupt and discrete shifts occur in a piecewise stationary time series (Horvath & Rice, 2024). The CUSUM statistic assesses the cumulative deviation from an expected value over the time series, allowing for locations in time that would maximize the difference in expected value between to time intervals to be highlighted, enabling the detection of abrupt changes in the data.
The univariate CUSUM statistic, as described by Cho (2016), is computed for each interval across the length of the time series, starting from 1 and continuing to the end of the time series T, calculating the differences between the cumulative sums of observations before and after a potential change point. This statistic is then compared against a predetermined threshold to determine if there are significant deviations indicative of a change point. This process is then repeated after a change point is found, splitting the time series at that location and beginning the process of calculating the CUSUM statistic across each split. This continues until no further potential change points are found to be significant against the chosen threshold in the process of binary segmentation.
To apply this method in multivariate settings, particularly in the context of analyzing competitive balance measures in sports leagues, the double CUSUM statistic proposed by Cho (2016) offers a valuable innovation to prior work by identifying change points that occur across multiple time series. The double CUSUM statistic computes CUSUM statistics across the same time periods for all-time series and constructs a test statistic using ordered CUSUM values within each potential change point location in time.
By prioritizing time series with larger CUSUM values, which are more likely to indicate change points (structural changes), the double CUSUM statistic effectively identifies structural changes shared across multiple time series. The double CUSUM statistics at a potential location of the time series are then compared against a threshold to remove time periods that even at their largest values would not result in a change point. It is worth noting, however, that estimation of a change point does not require all series to have an identical change point, but that enough time series exhibit a change near this location to be a larger break than seen from noise.
We further applied a Sparsified Binary Segmentation algorithm, similar to binary segmentation, by comparing double CUSUM statistics across different time periods and within different time series, facilitating the determination of change points across all CB time series comprehensively (Cho & Fryzlewicz, 2014). This method assumes a piecewise constant signal with errors that are stationary, zero-mean, and α-mixing, which allows for dependance between the time series which can weaken geometrically. Th allows for other non-Gaussian distributions to be used that have cross-sectional correlations that exist between the time series, as is present within CB measures. The threshold value is used to determine if a change point is statistically significant and accurate in its location, which is calculated from a combination of the length of the time series and how many time series are included in the analysis. Second order change points can also be identified using this algorithm with CB measures. A different statistic, the Haar wavelet, is used to identify variance (auto-covariance and cross-covariance) change points based on methodology from Cho and Fryzlewicz (2012, 2014). This approach transforms each time series using wavelet techniques to capture local changes in variance across time. Because we are interested in multivariate time series of CB measures, this latter innovation – as compared to past CB change point work – is particularly suited to the goals of structural change detection here.
A challenge in this context is selecting the appropriate thresholding parameter that enable statistical significance across and within each time series especially concerning high auto- and cross-covariance structures in high dimensional time series. The authors proposed a Generalized Dynamic Factor Model (GDFM) bootstrapping algorithm which models the shared and unique variations across the time series to reduce dimensionality and limit comparisons. This tailored bootstrap distribution helps refine threshold selection by reducing false positives while still adapting to genuine structures present in the dataset. These refinements for variance and for the mean change points are vital to account for correlations in the data while minimizing unnecessary comparisons, extending traditional structural changes to capture complex patterns that occur within CB measures across leagues and over time.
Results & Discussion
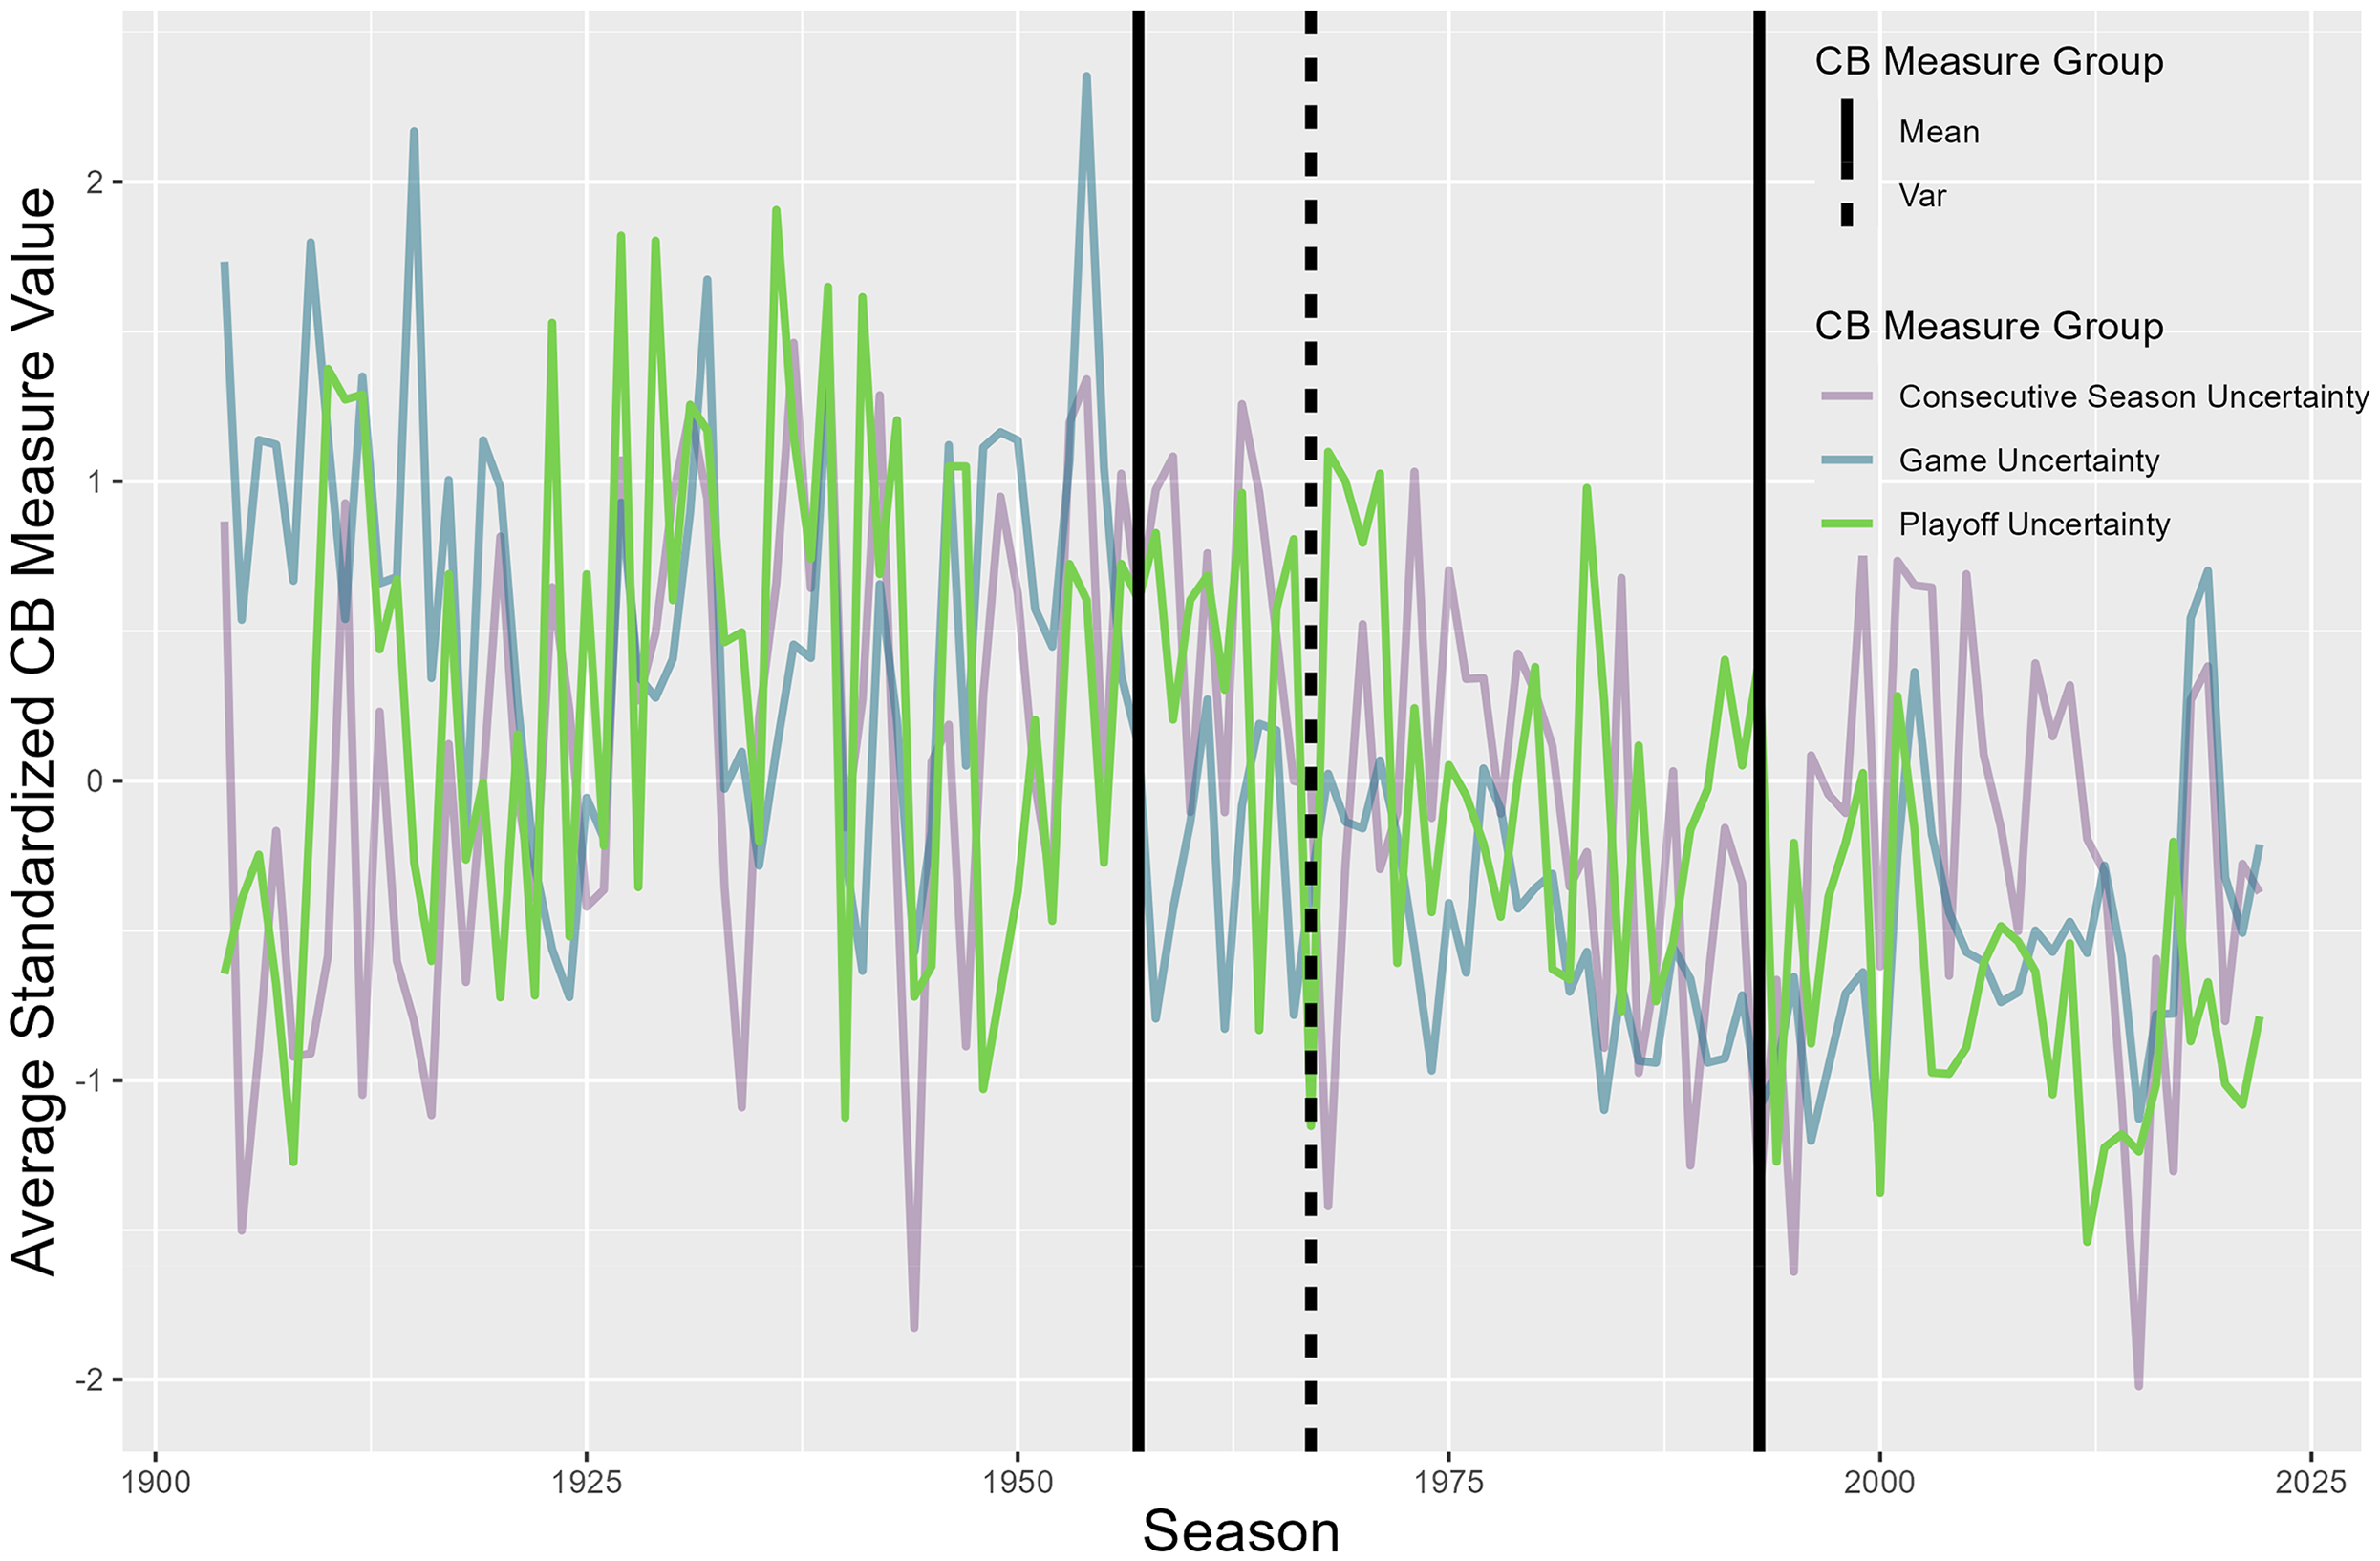
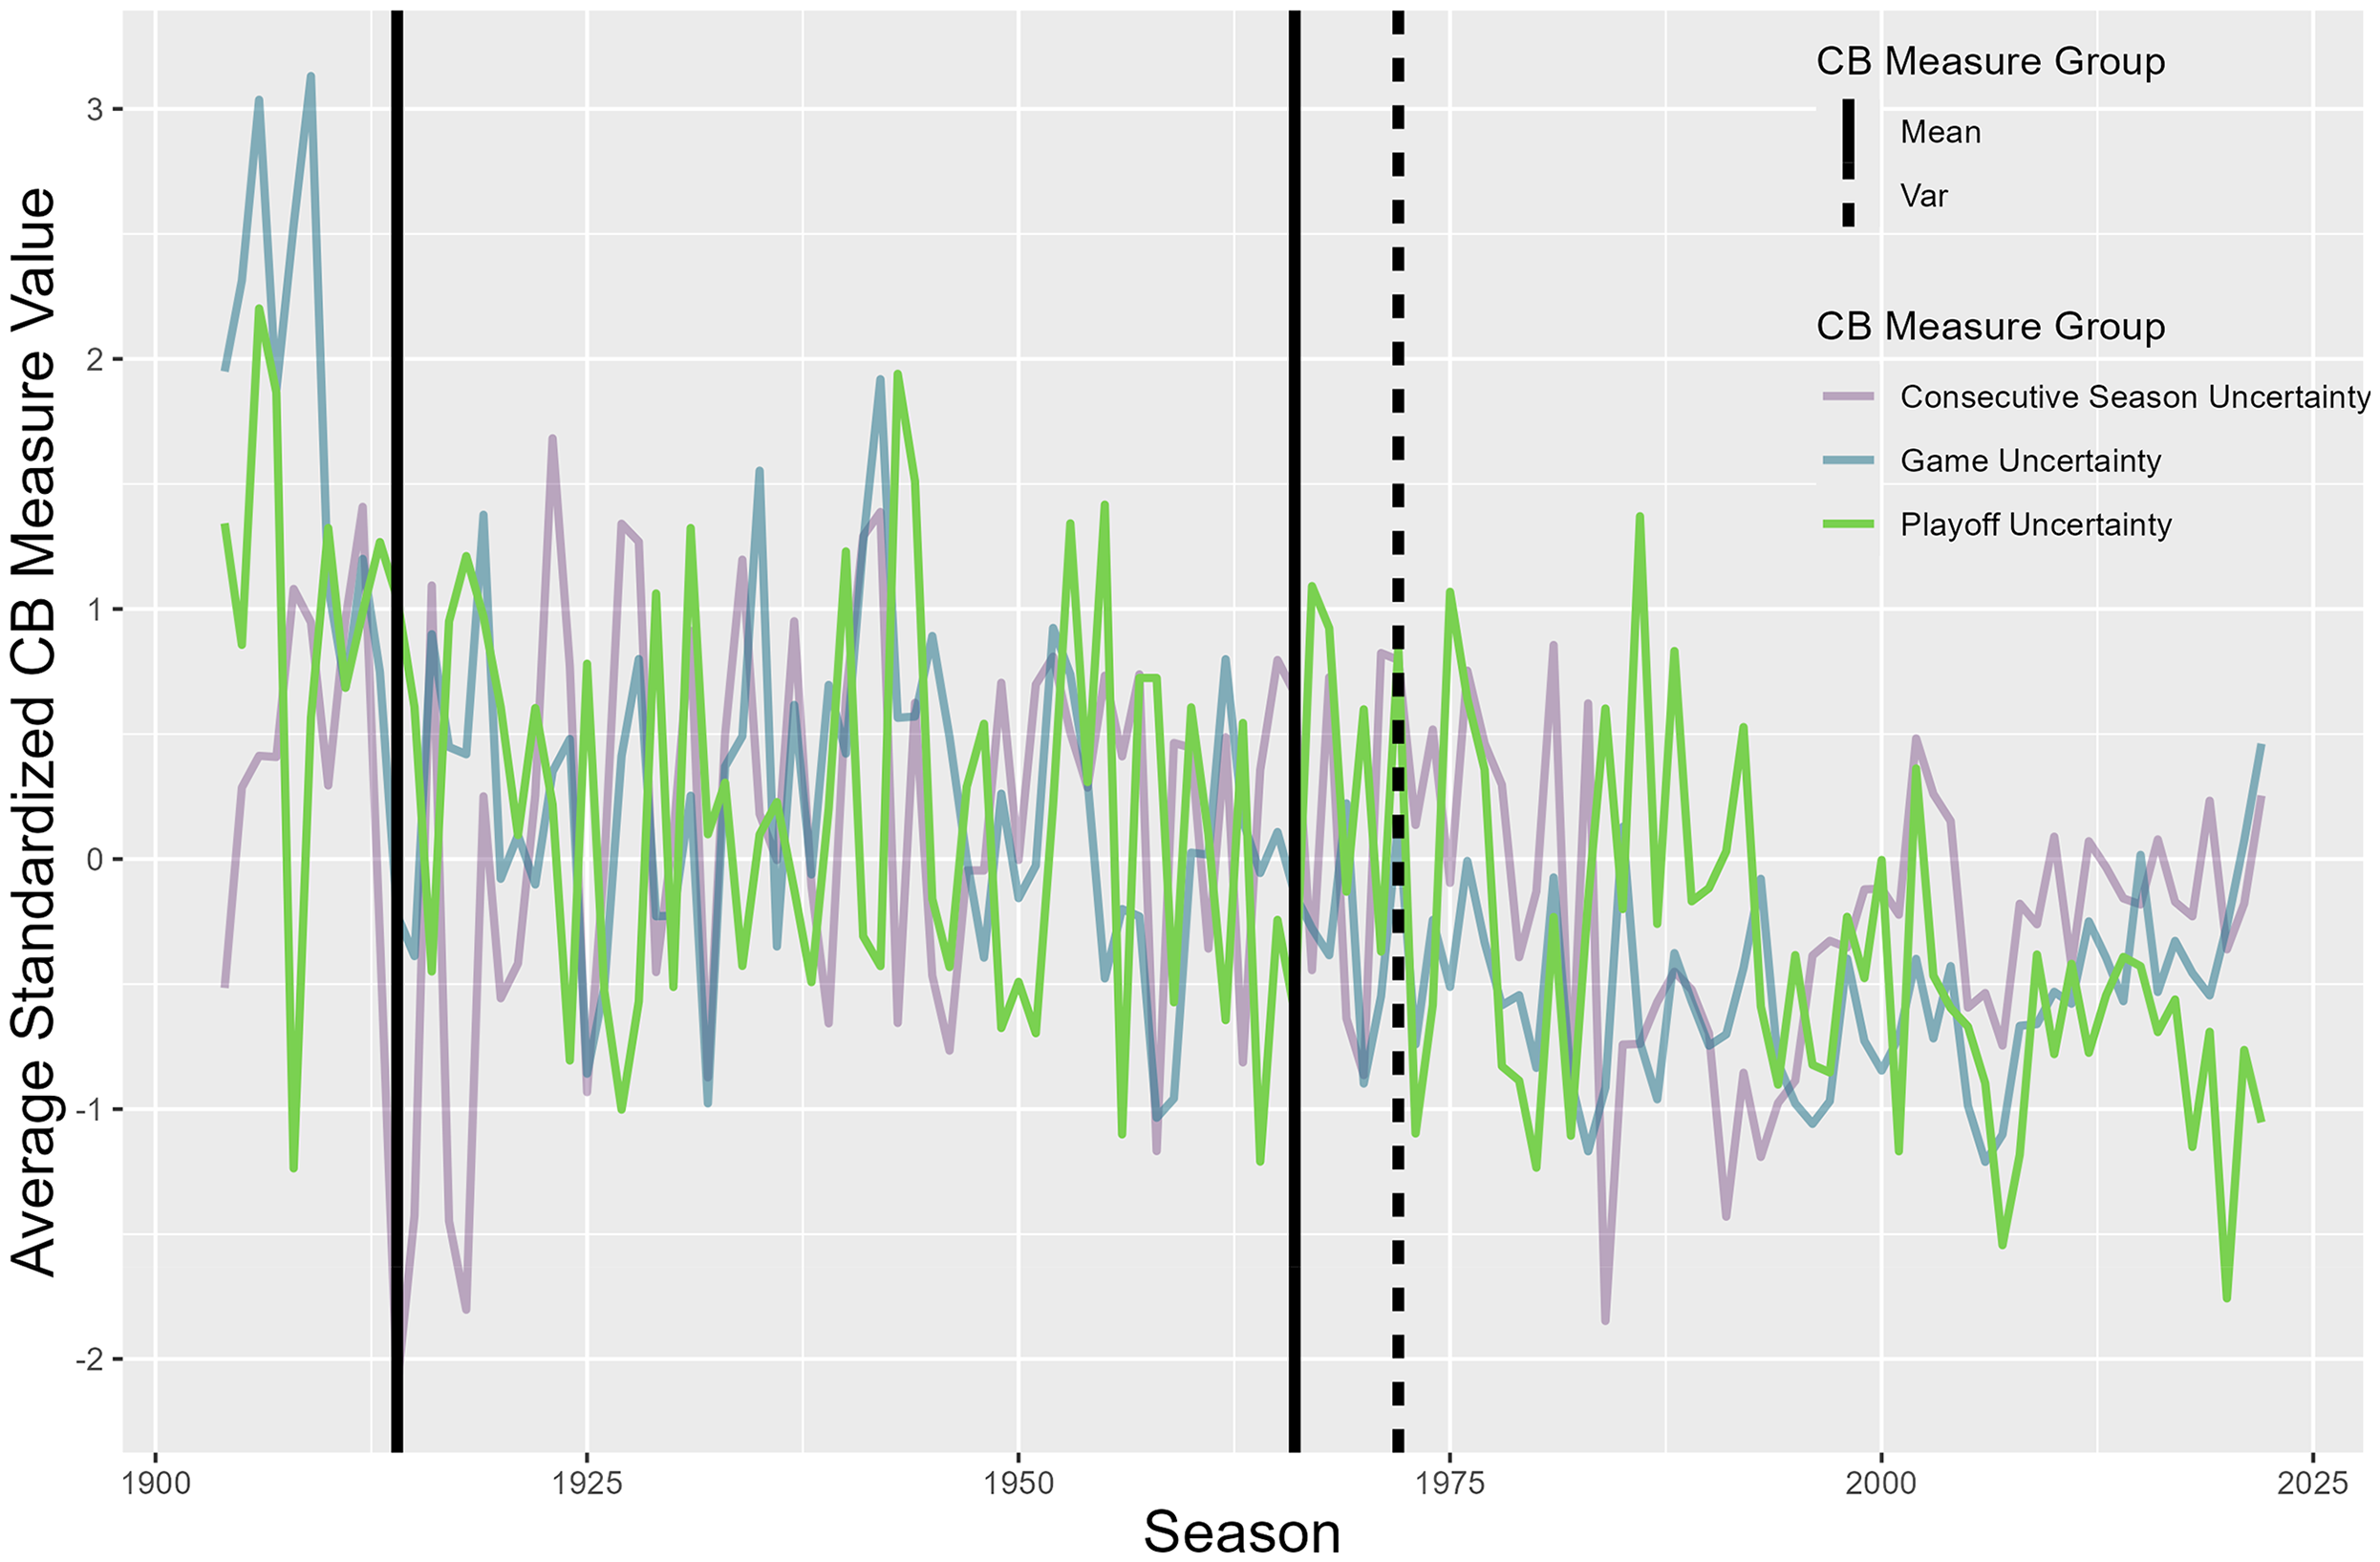
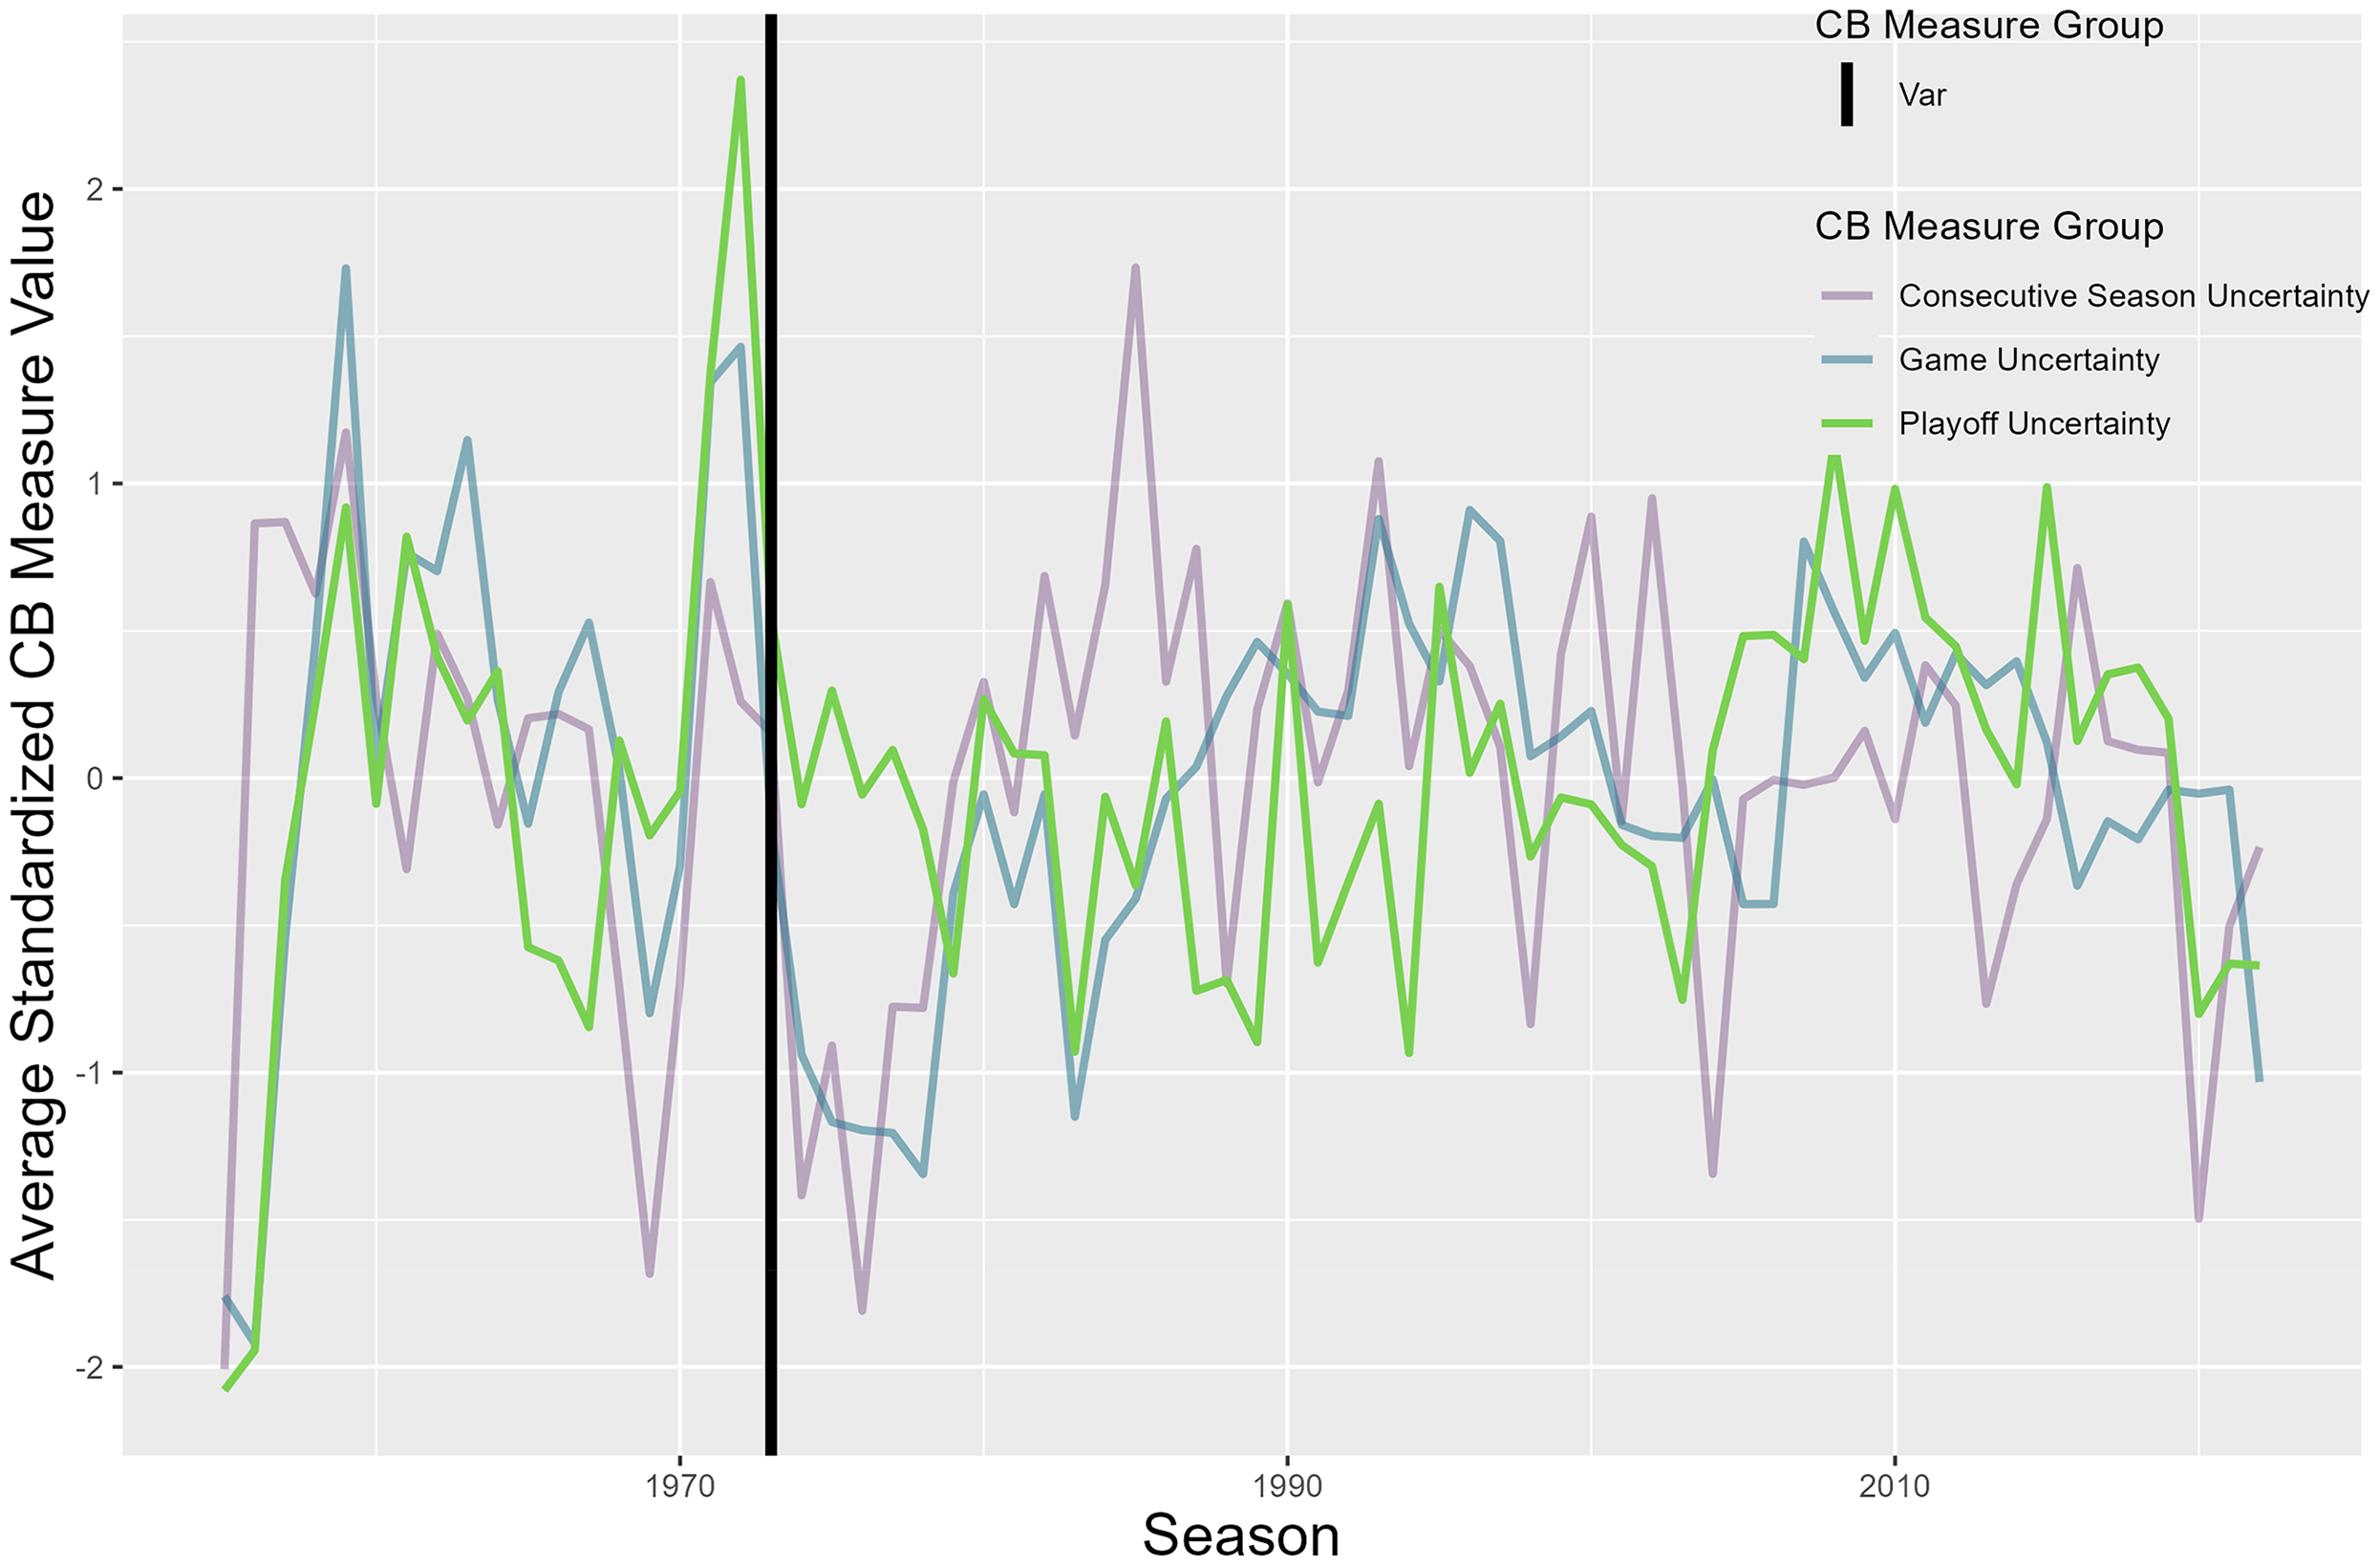
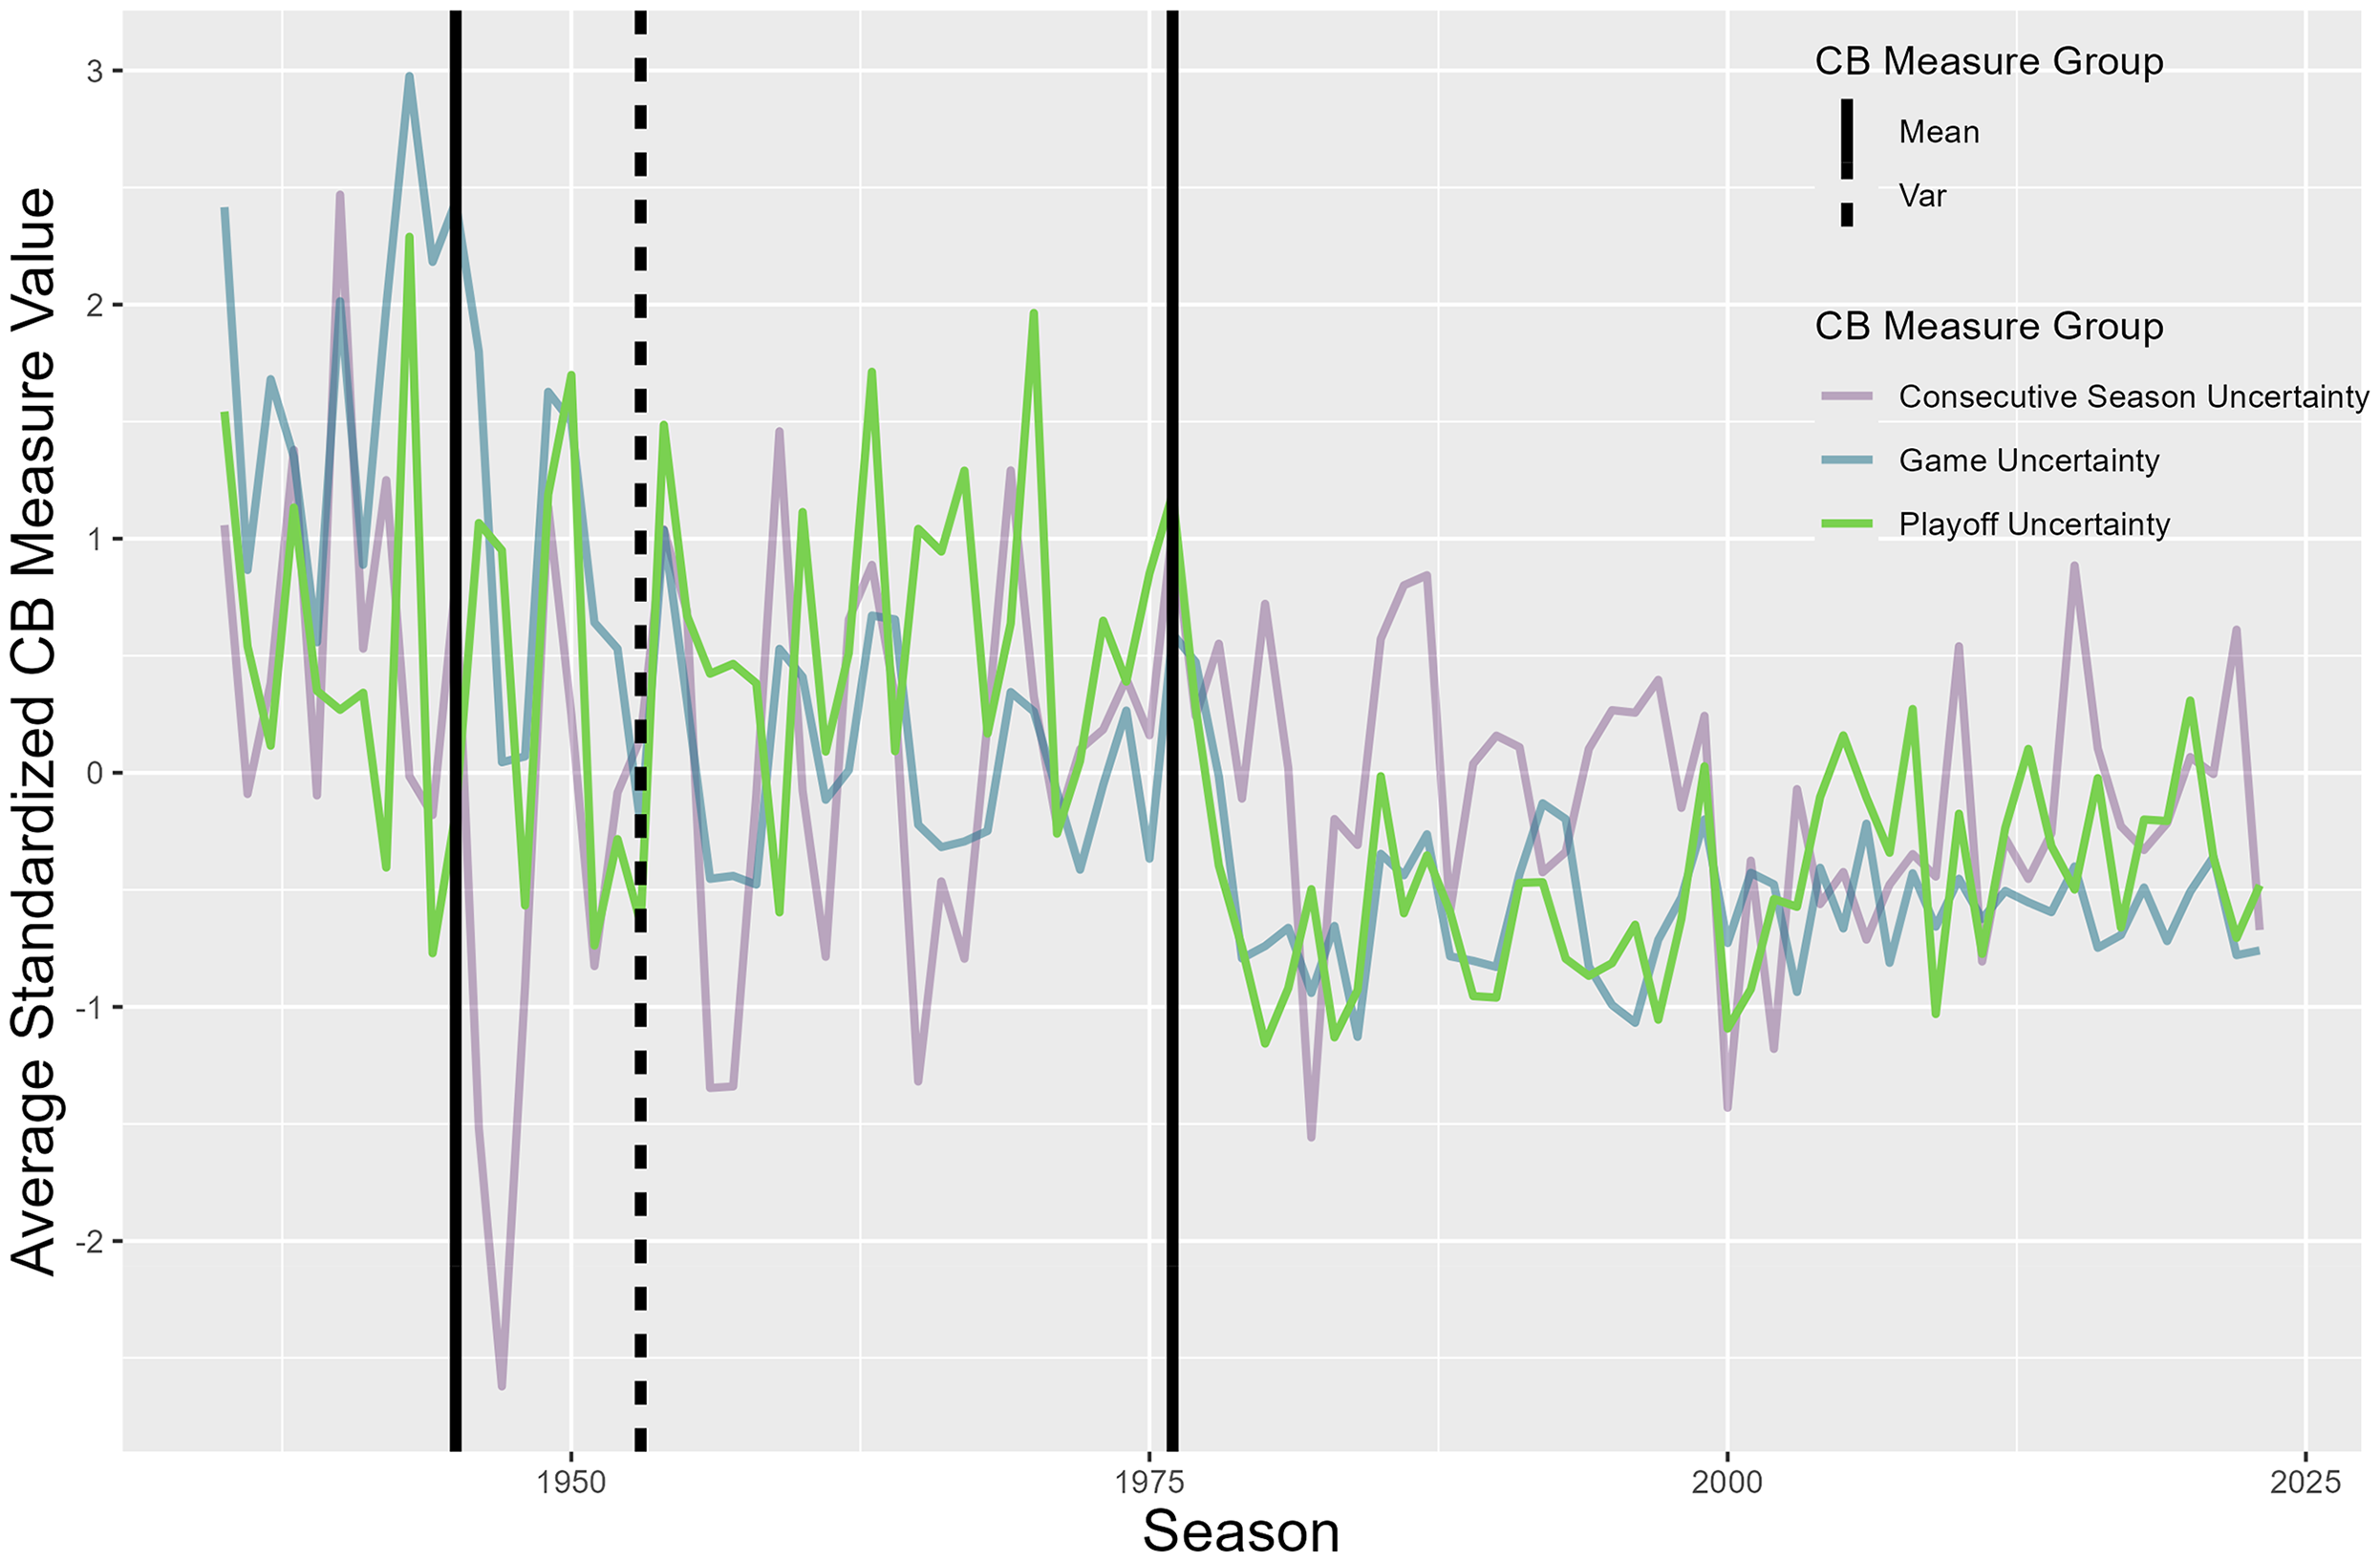
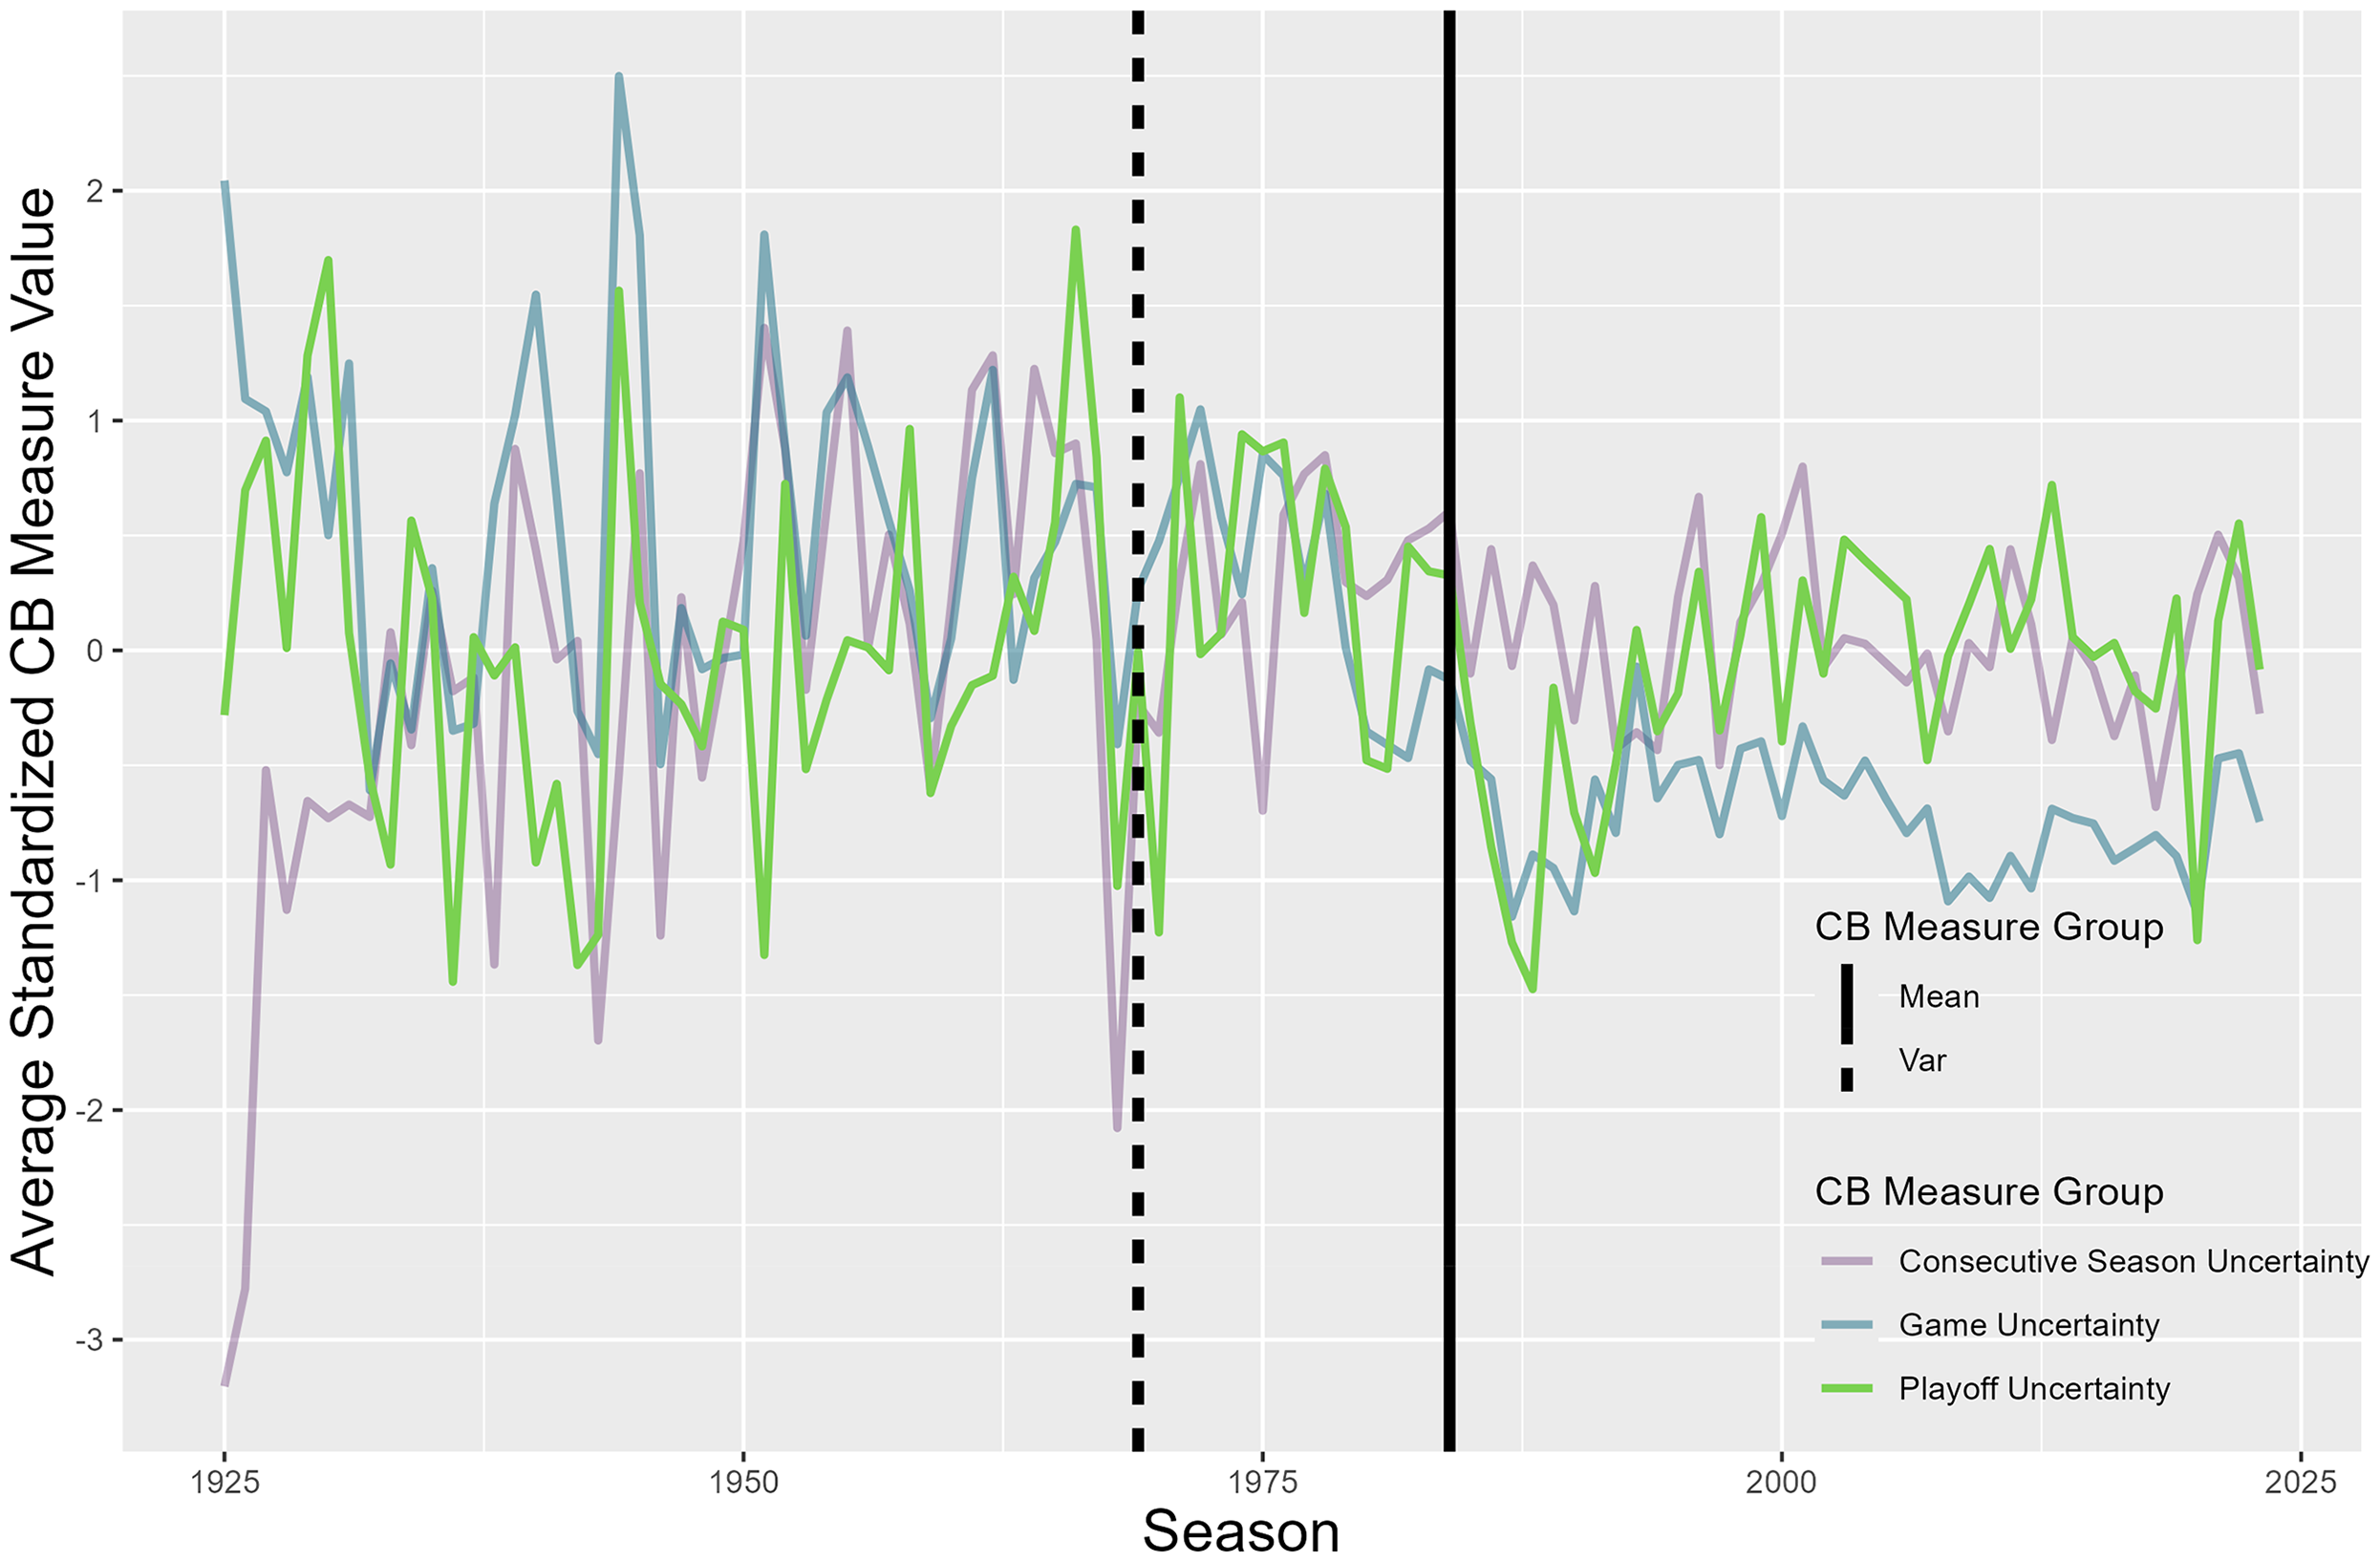
We present all estimated change point dates in Table 2 for each league in the multivariate change point analysis – for both mean and variance – alongside the primary CB measure drivers of those estimated changes. Mean and variance change points are visualized in Figures 1 through 5. To simplify visualization, each figure rescales each CB measure to a within-league z-score, and the average z-score for each league in each season is taken within measure type (GU, PU, and CSU). All measures are scaled such that decreases in the measure are indicative of improvements in CB. The result is 3 time series visualized together for each league. We note that due to challenges to visualization of multivariate time series, the averaging of measures necessarily obscures visual inspection of variance change points. However, we describe each of the results of these in Table 2 (reductions or increases to variability).
American League Time Series and Change Point Dates.
National League Time Series and Change Point Dates.
National Basketball Association Time Series and Change Point Dates.
National Football League Time Series and Change Point Dates.
National Hockey League Time Series and Change Point Dates.
Change Point Dates, Explanation, and Comparison to Prior Work.
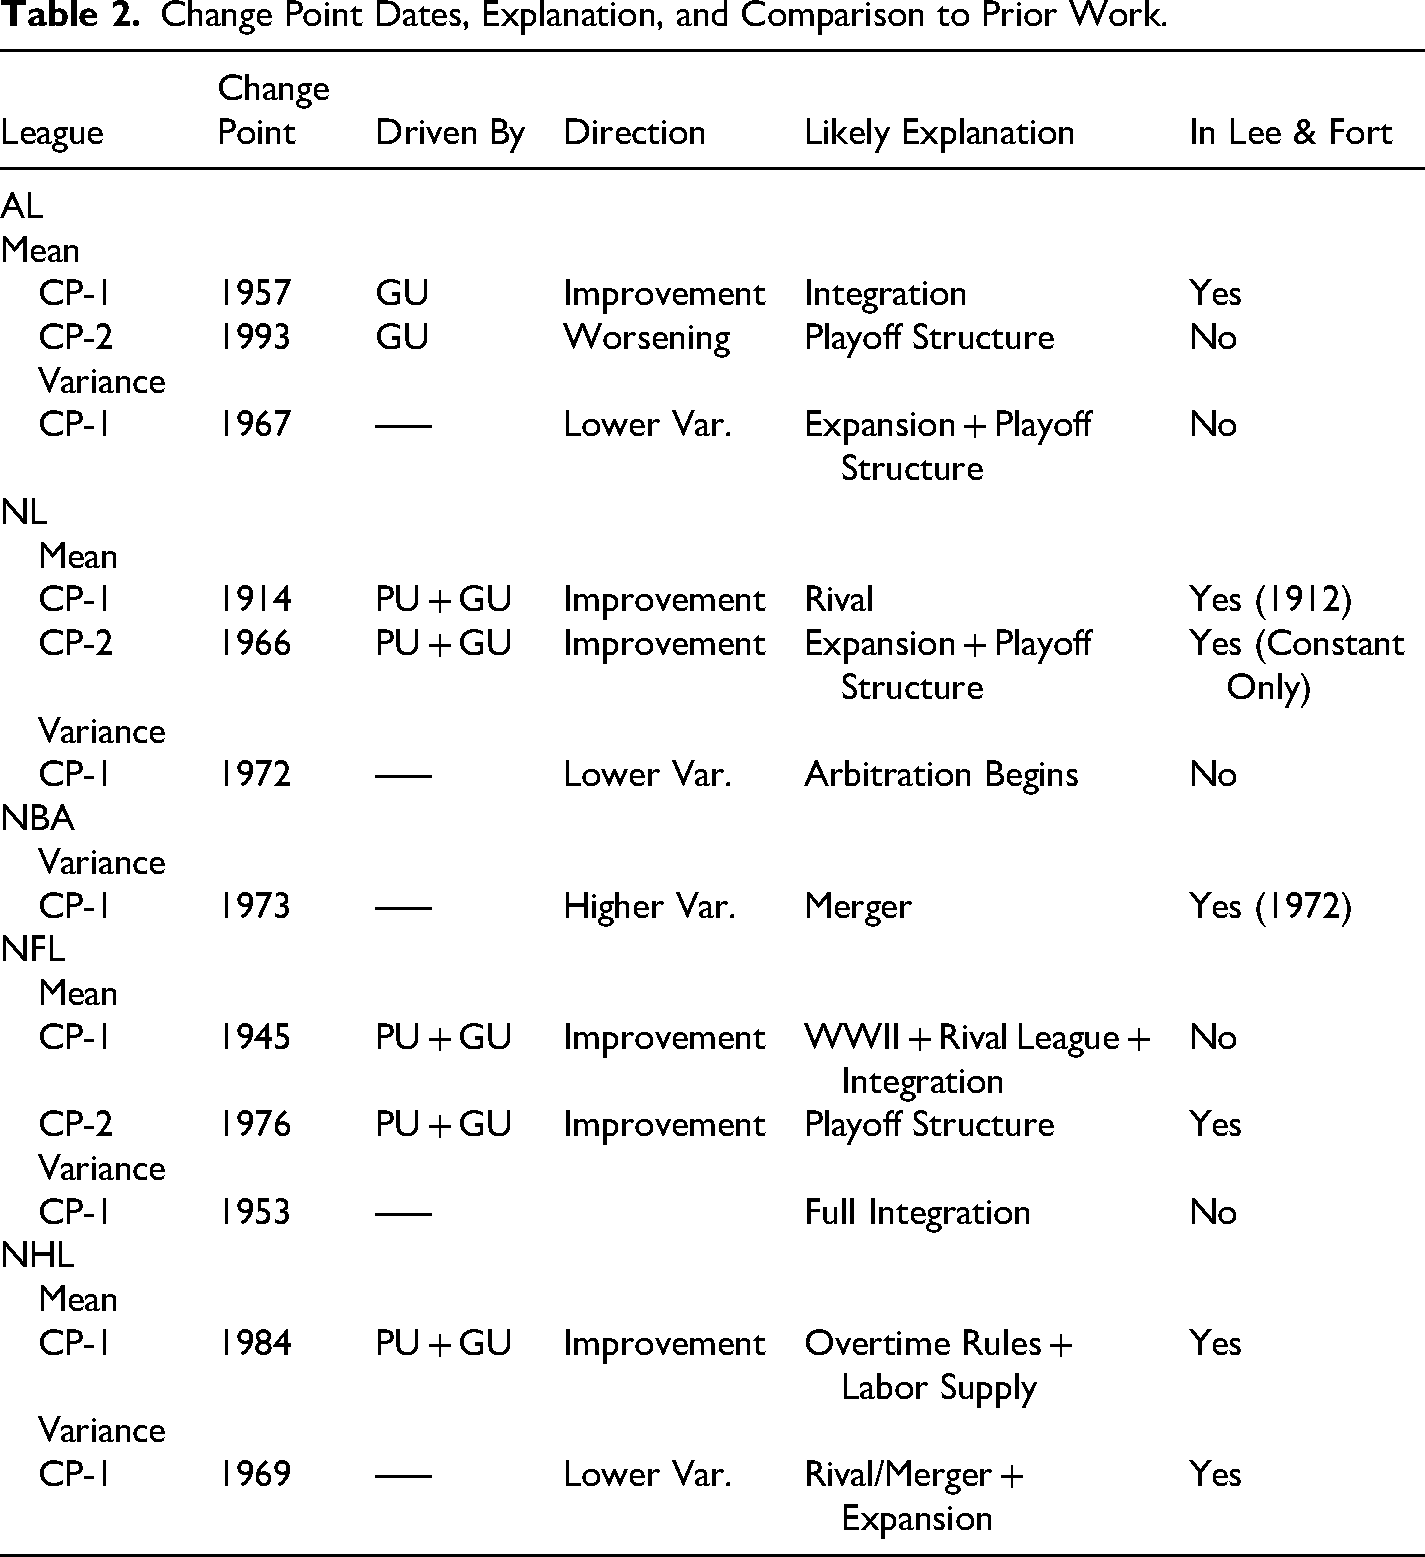
Consistent with past change point literature, we chronologically describe each of these dates in detail for each league alongside concurrent league policy or historical events. In Table 2 we also compare our results directly with univariate change point models using the ratio of standard deviations and logged tail likelihood (both GU measures) in Fort and Lee (2007) and Lee and Fort (2007). As a summary, we note that our method identifies nearly all change points found in this prior work, with few exceptions: the AL and NL breaks in 1926, a 1969 break in the NFL, and a 1997 break in the NBA. However, the multivariate method also estimates new change points and considers some shared change points as variance changes rather than level changes. Although some of our estimated change points are driven primarily by GU measures, others are more prominently driven by PU measures, suggesting that using additional measure categories – and measures in combination – provide further insight into league-level CB structural changes.
Major League Baseball
Our estimation procedure identified 3 change points in the AL (2 mean changes and 1 variance change). The first mean change point occurred in 1957 (Table 2). The change is associated with a dramatic improvement in GU over a brief period, particularly after 1954, led by GU measures. This matches a structural change from past work, who attribute such changes to integration and the asymmetric distribution of owner race preferences. In particular, CB was especially unbalanced during much of the integration period. The last AL team to integrate was the Boston Red Sox in 1959, suggesting the initial lack of balance associated with the integration period and asymmetric owner race preferences disappeared once the entire league’s ownership integrated their teams. The timing of change point and continued improvements around this time seem to support such speculation.
The second mean AL change point occurred in 1993, just before the longest work stoppage in MLB history, primarily driven by GU measures. This change point was not identified in prior work. The time point marks the end of an improvement in CB and a subsequent worsening trend into the early 2000s across the primary GU measures driving its estimation. CSU measures followed this trend as well, though PU measures were largely flat during this time, presumably due to playoff expansion alongside worsening GU. This change point occurred just prior to the MLB players’ strike and subsequent playoff restructuring that added wild card teams after expanding in 1993. As previous work did not find any structural changes around this time, the multivariate method seems to have served as a more sensitive test of the potential effects of playoff restructuring on the variety of CB measures. While incentives are generally expected to increased talent investment incentives for teams at the margin – improving balance – the worsening of balance may suggest that teams settled for the Wild Card berths rather than investing heavily in chasing a Divisional Champion crown. This outcome is contrary to most of the playoff restructuring changes observed in other leagues, as we will note later.
A single variance change point for the AL was estimated in 1967. Although the largest contributors to variance changes are not readily interpretable with our method, visual inspection of the entire panel of CB measures suggests this change was most closely associated with GU and a reduction in variability across measures. In particular, PU variability lagged GU measure declines from the 1957 change point. While PU was getting worse during the integration era – despite the sudden improvements to GU around 1957 – the two measure types converge around 1967.
As integration was asymmetric, it is not surprising to find higher variation in PU as certain teams integrated while others held off. Playoffs in MLB began in 1969, spurring closer playoff races, rather than relying only on the best team in each the AL and NL to play in the World Series. This sort of insight would not be gleaned from identifying GU structural changes alone, and again exhibits the value added of multivariate analysis of CB measures in this context. In particular, as a whole, our results imply that integration and playoff structure changes each affected both GU and PU in different ways, as playoff expansion necessarily includes more teams in the race and presumably has downstream incentive effects on talent investment for GU.
National League
In the NL, we also identified 3 change points (2 mean changes and 1 variance change). The first two mean change point dates were in 1914 and 1966, closely matching Fort and Lee (2007) in 1912 and their constant-only estimate of 1965. The 1914 change point is associated with a sustained improvement in balance and marked the first year of operation of the rival Federal League as a third major league. Although a rival to both the AL and NL, five NL teams saw the addition of a Federal League club in their city (Brooklyn Robins, New York Giants, Chicago Cubs, Pittsburgh Pirates, and St. Louis Cardinals), but this was only the case for two AL teams (New York Yankees and Chicago White Sox). 3 The geographic distribution suggests the NL would be more impacted by this rival than teams in the AL, hence the asymmetry in change points in 1914 across leagues. This also suggests that talent was more commonly signed from top teams, increasing the closeness of playoff races (PU) as a result of fewer teams in the upper and lower tails of the win percent distribution (GU).
In our estimations, the net effect on CB for the 1965 change point is unclear, but points toward continued improvements in PU over the longer term in the post-1965 period in addition to fewer teams in the tails of the win percent distribution (GU). There was considerable expansion to MLB throughout the 1960s, adding 8 total teams to a league that started with 16 in 1960, increasing the league’s size by 50 percent. However, we note that there was a similar variance change point in the AL in 1967, near the end of the World Series-only postseason for MLB. While variability across measures was not changed at this time for the NL, the mean change there could have been a combination of expansion and postseason changes that led to a more dramatic mean (level) change in CB for the NL. Fort and Lee (2007), the 1965 change point was associated with a decline in CB. Most likely, any GU decline that occurred from expansion was mitigated to some extent by higher churn levels of teams also due to expansion and playoff structure changes (more teams making the playoffs). This again suggests that the comprehensive measure method provides additional insight into the multidimensional nature of CB. In particular, the directional and temporal heterogeneity of CB changes depends on a variety of realizations of balance.
Lastly, one variance change point for the NL was estimated to have occurred in 1972, which was not identified as a change point in prior work. Year-to-year variability within and across measures changed during the tail end of this expansion and subsequently stabilized after the introduction of arbitration after the strike-shortened 1972 season, though this is not visible in the averaged Figure 2 plot. While we are unable to identify salary arbitration as having any causal influence on the variability in CB measures, this may have served as a learning period for owners with uncertainty over player salaries going forward due to arbitration.
National Basketball Association
Only a single change point was estimated in 1973 for the NBA, and only in variance. This approximately matches one found in previous work in 1972, though we note that work did not estimate variance change points. As noted by these authors, there was considerable expansion and moves in the 1970s along with a merger with the American Basketball Association for the 1976–77 season. These events also coincided with dramatic playoff expansion from 1974 (8 teams) to 1984 (16 teams). PU measures near this change show a reduction in year-to-year variability, suggesting increased stability of the league playoff race after this point, which would be consistent with a merger and reduction in competition for talent across the two main leagues alongside an expansion of playoff slots shortly thereafter. Unlike previous work, we do not find any additional change points near 1997, just before the 1998 NBA lockout.
National Football League
Moving to the NFL, we identified 2 mean change points, both primarily associated with a combination of PU and GU, and 1 variance change point. The first mean change point occurred in 1945 and is associated primarily with fewer teams in the tails of the win percent distribution (improved GU). This change point was concurrent with the end of World War II and rise of the rival All-America Football Conference, but also just predated the beginning of integration in the NFL in 1946. As with the AL in MLB, the introduction of integration seems to have been followed by higher churn in the NFL in addition to changes to GU initially noted by Lee and Fort (2007), which also stabilized playoff races. Overall, CB improved in subsequent seasons.
The second change point in 1976 matches one from past univariate estimation, which associated the change point with an improvement in PU and GU. The time period marked expansion to Seattle and Tampa Bay, which would be expected to decrease CB; however, the league expanded the playoffs twice during this same decade. This also marked the start of stabilization and improvement to CSU that reversed around 2000, though CSU was not a primary driver of the estimated change point date. Thus, the inclusion of other measure types implies that while expansion alone may decrease balance, franchise and playoff expansion can lead to long-term balance improvements across multiple measures, particularly by including PU measures affected by playoff expansion.
The single variance change point for the NFL was estimated to have occurred in 1953 and is associated with a stabilization of the variability from year to year for most measures. In 1950, the rival All-American Football Conference – which had integrated more quickly – folded and partially merged with the NFL, and by 1952, every team except Washington had integrated. The combination of the merger and near full integration by 1953 may have reduced uncertainty over labor supply and resulted in the end of effects of asymmetric integration seen at the prior change point (and similar to the AL).
National Hockey League
In the NHL, we estimated two change points, one mean change (1984), and one variance change (1969), matching past work. The 1984 change point date is most closely associated with an improvement in PU and GU, likely due to an influx of international talent into the league. This also aligns with a change to overtime rules in the league, adding a five-minute sudden-death overtime in regular season games. Lee and Fort (2007) explain their estimated improvement in GU as a result of dramatically increased labor pools arising from an influx of European players into the NHL. Again, our multivariate approach provides useful insight here: while labor pool expansion can improve CB, rules changes may affect other measures of CB in different ways. For example, CSU was not dramatically affected at this time point. This suggests that the balance changes were season-level balance-specific and may have been more heavily driven by the rules changes, particularly those that force changes to the way standings points are calculated (PU). How this heterogeneity is perceived by fans is left for future research (Nalbantis et al., 2017).
The variance change point in 1969, matching a level shift in prior work, is associated with a sudden decline in CB variability shortly before the substantial improvement across a wide range of measures. While we do not estimate a mean change at this time point, the period was particularly tumultuous in the context of GU, PU, and CSU. These changes were likely related to the start of significant competition for playing talent (and fan demand) with the World Hockey Association (WHA) – and subsequent merger, NHL expansion, and influx of talent – again highlighting a key role of rival leagues in driving changes to balance. Our variance change point implies convergence of variability in measures during the operation of the WHA that continued after it merged with the NHL. The stabilization in CB in particular suggest influxes of talent may not only improve CB but also stabilize these measures as league outcomes become less and less dependent on a few superstars.
Summary and Economic Insights
Although the multivariate method finds many similar change points in CB to past work, we highlight here that additional insight can be gleaned from a multidimensional look at changes to CB over time. Beginning with Rottenberg’s IP, and consistent with prior work, change point dates are not found near relevant policy points usually touted as balance-enhancing by leagues (reserve rule, drafts, revenue sharing, salary caps, etc.). Indeed, in the one instance of a change to salary arbitration, CB stabilized in the post-period, rather than more so, as owners would likely propose for any loosening of the player talent market. While the results are not surprising to sports economists, our method here provides additional confirmation of much of the theoretical implications of these league policies and their effects on various realizations of CB.
Much more salient in the timing of change points in CB are associated with rival league competition and expansion, changes to the talent supply, and changes to on-field rules and playoff structures (Schmidt & Berri, 2003). As the labor pool expands through integration and internationalization, asymmetric additions of talent across the league tend to make balance more volatile from year to year. However, once leagues are (nearly) fully integrated or broadly purchasing this talent, there tended to be long-term improvements to balance, particularly GU and PU. The end of rival leagues – and subsequent mergers – have also tended to reduce volatility in balance and lead to improvements to balance in the long-run.
Similarly, league expansion initially may affect balance negatively but often takes place alongside playoff expansion and restructuring. The latter not only tends to improve PU, but also GU. That GU seems to drive many of these playoff-related changes is insight not previously gleaned in the change point literature. In particular, playoff expansion has, on average, tended to increase incentives for teams at the margin to remain invested in talent throughout the season, improving the overall distribution of talent. This is unique from the implications of Lee (2009) regarding PU. While PU can be affected on its own, it is often changing in combination with GU measures that suggest not just the playoff race is becoming closer, but the distribution of talent around the league is improving.
This result in particular suggests that, if leagues truly want to improve balance with tools under their control (alongside player unions), changes to rule and playoff structures are likely a fruitful approach to doing so. This can happen through a variety of mechanisms, including changing the return to winning from playoff appearances (Lee, 2009), affecting the incentive to invest in talent, and altering the contest success function as it flows from the talent distribution across teams. The effects of significant changes to playoff structures and on-field rules on league CB have been less widely studied empirically within the sports economics literature than traditional economic policies like revenue sharing, market/league size, or payroll caps. Recently, leagues have been making changes to gameplay and seasonal structures that may affect the ways in which talent contributes to wins (for example, pitch clocks and ball construction changes in MLB), as well as introducing additional incentives for effort and talent investment (the NBA’s midseason tournament). We suggest that these changes provide valuable opportunities for new research to understand the control and mechanisms of CB in sports leagues.
Summary & Future Work
As a whole, our analysis of CB change points across leagues suggests that rival leagues, expansions, and playoff restructuring are primary drivers of shifts in both mean and variance of the collection of CB measures. The expansion and rival league result is consistent with past work in the univariate GU case, and our analysis would imply that these effects also extend to PU. As PU, in particular, is a function of not just the talent distribution, but also the game rules, contest success functions, and playoff structure, our results – particularly for the NHL – provide some additional support to Lee (2009) regarding the importance of these league decisions not just on game play, but also on types of CB and uncertainty across the league.
Although our work here is limited to CB analysis, the methods used may provide additional insight into other sports time series. For example, using panels of team-level attendance time series – rather than league averages – may provide insight into attendance variability change points not observed in past work. Additionally, the use of multivariate change point analysis can help empirically identify structural changes in the game play styles and historic eras of the game (Dead Ball, Era Steroid Era, etc.) or the emergence of “juiced balls.” Changes to the baseball’s construction have been shown to dramatically impact home run rates; however, these changes are heterogeneous depending on the type of player being observed. With new data from MLB’s Statcast, tracking variability across underlying measures of ball flight – or across players – and large structural changes taking place may help to identify the timing of these changes more clearly. Finally, past work investigating steroid use or changes to gameplay across historical eras by individual players using univariate time series (Groothuis et al., 2017; Nieswiadomy et al., 2012; Schell, 2005; Whalen et al., 2024) could also be made more robust by tracking a number of player-level statistical changes over time together in a single estimation.
Supplemental Material
sj-docx-1-jse-10.1177_15270025251373056 - Supplemental material for Competitive Balance in North American Sports Leagues: An Application of Multivariate Change Point Analysis
Supplemental material, sj-docx-1-jse-10.1177_15270025251373056 for Competitive Balance in North American Sports Leagues: An Application of Multivariate Change Point Analysis by Brian M. Mills and Mena Whalen in Journal of Sports Economics
Supplemental Material
sj-png-2-jse-10.1177_15270025251373056 - Supplemental material for Competitive Balance in North American Sports Leagues: An Application of Multivariate Change Point Analysis
Supplemental material, sj-png-2-jse-10.1177_15270025251373056 for Competitive Balance in North American Sports Leagues: An Application of Multivariate Change Point Analysis by Brian M. Mills and Mena Whalen in Journal of Sports Economics
Supplemental Material
sj-png-3-jse-10.1177_15270025251373056 - Supplemental material for Competitive Balance in North American Sports Leagues: An Application of Multivariate Change Point Analysis
Supplemental material, sj-png-3-jse-10.1177_15270025251373056 for Competitive Balance in North American Sports Leagues: An Application of Multivariate Change Point Analysis by Brian M. Mills and Mena Whalen in Journal of Sports Economics
Supplemental Material
sj-png-4-jse-10.1177_15270025251373056 - Supplemental material for Competitive Balance in North American Sports Leagues: An Application of Multivariate Change Point Analysis
Supplemental material, sj-png-4-jse-10.1177_15270025251373056 for Competitive Balance in North American Sports Leagues: An Application of Multivariate Change Point Analysis by Brian M. Mills and Mena Whalen in Journal of Sports Economics
Supplemental Material
sj-png-5-jse-10.1177_15270025251373056 - Supplemental material for Competitive Balance in North American Sports Leagues: An Application of Multivariate Change Point Analysis
Supplemental material, sj-png-5-jse-10.1177_15270025251373056 for Competitive Balance in North American Sports Leagues: An Application of Multivariate Change Point Analysis by Brian M. Mills and Mena Whalen in Journal of Sports Economics
Supplemental Material
sj-png-6-jse-10.1177_15270025251373056 - Supplemental material for Competitive Balance in North American Sports Leagues: An Application of Multivariate Change Point Analysis
Supplemental material, sj-png-6-jse-10.1177_15270025251373056 for Competitive Balance in North American Sports Leagues: An Application of Multivariate Change Point Analysis by Brian M. Mills and Mena Whalen in Journal of Sports Economics
Footnotes
Acknowledgements
This collaboration would not have happened without the encouragement of Greg Matthews.
Funding
The authors received no financial support for the research, authorship, and/or publication of this article.
Supplemental Material
Supplemental material for this article is available online.
Notes
Author Biographies
References
Supplementary Material
Please find the following supplemental material available below.
For Open Access articles published under a Creative Commons License, all supplemental material carries the same license as the article it is associated with.
For non-Open Access articles published, all supplemental material carries a non-exclusive license, and permission requests for re-use of supplemental material or any part of supplemental material shall be sent directly to the copyright owner as specified in the copyright notice associated with the article.