
Abstract
This study examines the impact of locally born players on team attendance and revenue in the National Hockey League (NHL). Using data from 31 NHL teams from 2005 to 2018, the study employs a refined definition of locally born players and explores alternative definitions to ensure robustness. Each additional locally born player completing a full season is associated with an increase in home game attendance by approximately 12,000 spectators and $4.8 million in additional revenue. These effects are consistent across geographic regions, including traditional and non-traditional hockey markets. The findings underscore the value of investing and promoting local talent, particularly for teams with lower attendance levels. By fostering stronger community connections and regional loyalty, locally born players enhance team identity, boost fan engagement, and increase game demand. This study provides actionable insights for team management and marketing while advancing the understanding of fan demand dynamics in professional hockey.
Introduction
Created in 1917 and initially comprised of only four teams, the National Hockey League (NHL) is among the “Big 4” sports leagues in North America, alongside the Major League Baseball (MLB), National Basketball Association (NBA), and National Football League (NFL). Through multiple waves of expansions over the last century, the league now includes 32 franchises divided into four different divisions that spread across Canada and the United States. 1 While the NHL may not be as well-known internationally as the other major North American leagues, it is unanimously considered to be the strongest hockey league worldwide (Deutscher & Schneemann, 2017). Unsurprisingly, the popularity associated with the league is linked to substantial revenues and team valuations, together with the average franchise now worth upwards of $1 billion. 2
The popularity of professional hockey stems partly from its entertainment value and also from the sense of community it fosters to its fans (Andrijiw & Hyatt, 2009). In the NHL, fans eagerly anticipate that their favourite or local team will qualify for the league playoffs, in which teams compete for the prestigious Stanley Cup. 3 While hockey enthusiasts primarily focus on their team's success on the ice, teams’ owners view their teams as businesses that are expected to generate profit. While Rascher et al. (2021) argue that winning is also a priority of professional sports teams, it is partly because of its role in increasing game attendance and franchises’ popularity, which translates into tangible financial benefits for owners. In recent years, there has also been a “sportswashing” movement in professional sports, where individuals or groups invest in sports for political reasons rather than financial ones (Roslender, 2024). While this movement is profoundly affecting sports like soccer, boxing, and golf, the NHL appears to be unaffected by the phenomenon for the moment. Given NHL owners’ interest in profit maximization, it is not surprising to see that most research on hockey demand focuses on indicators like attendance (Treber et al., 2018; Villar & Guerrero, 2009) or revenue (Treber et al., 2018). While ticket sales represent only one aspect of a team's revenue, they are commonly used in the literature as they provide a clear indication of a team's popularity and financial stability. Ticket sales are also the main source of revenue in the NHL, distinguishing it from other leagues that rely more heavily on national revenue streams, such as TV or media deals. Consequently, when a team experiences a decline in attendance, discussions about potential relocation often emerge. 4
Studies have investigated factors that can potentially affect hockey game, including the presence of violence and fights in games (Paul et al., 2013, 2015, 2019), and the uncertainty of the outcome which have been linked to increased attendance at hockey games (Coates & Humphreys, 2012). While most of the studied impact is collective, individual players and their performance also impact the demand for hockey. Deutscher and Schneemann (2017) found evidence that “stars” have a positive impact on attendance in the Deutsche Eishockey Liga, Germany's top hockey league. O’Reilly and Nadeau (2006) explored the relationship between local players and revenue generation while looking at 35 non-sport-specific potential variables affecting revenue generation, using single games data from four major professional sports teams during the 2002–2003 season.
This paper examines the impact of locally born hockey players on attendance and revenue in the NHL, addressing a critical gap in the literature on fan demand for professional sports. While prior research has examined factors such as team performance, promotions, and superstar players, the role of locally born athletes—individuals closely tied to regional identity—remains underexplored. By analyzing both attendance and revenue data, this paper is the first to quantify the relationship between local players and fan demand in professional hockey.
Focusing on the NHL from 2005 to 2018, this study employs refined definitions and multiple measures of locally born players to assess their relative importance in driving demand. The findings reveal a significant positive effect: each additional locally born player who plays a full season increases home game attendance by approximately 12,000 spectators and boosts team revenue by US$4.8 million annually. These effects are robust across diverse geographic contexts, including comparisons between the “Original Six” traditional teams, primarily located in the northern region, and non-traditional teams in the southern region, as well as between the eastern and western regions.
The results underscore the strategic value of investing in and promoting local talent, particularly for teams struggling with comparatively low attendance. Locally born players strengthen fan engagement by fostering stronger regional connections, acting as both cultural ambassadors and economic drivers. This study also highlights the considerable value of locally born players in enhancing fan engagement and driving financial success. By demonstrating that local players have a significant positive impact on attendance and revenue, this paper offers valuable business insights for teams aiming to enhance their financial performance.
The remainder of this paper is organized as follows: Literature Review section reviews the literature, Data section introduces the datasets and Methodology section describes the methodology and model. Results section presents the empirical results, and Discussion and Conclusion section concludes a discussion of the findings and their implications.
Literature Review
Understanding the factors that drive attendance and revenue in professional sports has been a central focus of sports economics. Studies reveal that both collective and individual dynamics influence fan demand in hockey. For instance, fans often demonstrate a preference for physicality and fights in hockey games, which positively impact attendance (Paul et al., 2013, 2015, 2019). Competitive balance and outcome uncertainty have also been linked to increased attendance (Coates & Humphreys, 2012). Additionally, team-level factors such as promotions, team performance, and external conditions like weather play important roles (Paul et al., 2015, 2019).
Beyond team-level considerations, individual players have emerged as critical drivers of fan engagement. Deutscher and Schneemann (2017) found that “star” players significantly increase attendance in Germany's top hockey league, a pattern consistent with German soccer, where local “heroes” enhance fan loyalty (Brandes et al., 2008; Feddersen & Rott, 2011). These findings highlight the underexplored role of locally born players as potential contributors to attendance and revenue. As embodiments of regional pride and cultural identity, locally born players foster unique emotional connections with fans, distinct from those generated by star players alone.
Fan Engagement and Player Identity Across Sports
The role of locally born players in fostering fan loyalty is evident across various sports leagues. Kanazawa and Funk (2001) found that in the NBA, cultural and regional ties between players and fans enhance identification, driving deeper engagement and higher attendance. Similarly, Wood (2016) stated that MLB teams featuring “hometown heroes” experience stronger fan support, as locally born players act as relatable figures who reinforce community pride. In the NFL, Watanabe and Cunningham (2020) found that the racial composition of players significantly influences market behaviors, indicating the broader impact of player identity.
Economic analyses further quantify the value of origin of players. Tainsky and Winfree (2010) noted that international MLB players boost revenue but have a more muted effect on attendance compared to local players due to cultural misalignment. Hausman and Leonard (1997) demonstrated that NBA superstars with strong regional ties drive substantial increases in attendance and revenue. In European sports, birthplace effects extend to talent development and community identity. Hernández-Simal et al. (2024) reported that players from smaller cities with access to high-performance facilities often emerge as symbolic figures of regional pride. Similar findings were corroborated in Portuguese volleyball, where mid-sized cities players fostered deeper regional connections (Hancock et al., 2018).
While these trends span multiple leagues, the NHL uniquely emphasizes birthplace, prominently featuring it in player profiles and marketing materials. O’Reilly and Nadeau (2006) provide seminal evidence in an early study that locally born players in the NHL significantly boost attendance, underscoring the role of shared geographic identity in enhancing fan engagement.
Local and Social Identity in Sports
The role of local players aligns with social identity theory (Islam, 2014; Tajfel, 1979), which posits that individuals derive part of their self-concept from group membership (Malhotra, 1988). Teams leveraging regional identity through local players strengthen group cohesion, fan identification, and long-term loyalty. Richelieu (2018) argued that regional branding strategies rooted in geographic ties enhance emotional bonds between teams and fans. Guschwan (2018) extended this analysis, showing that regional identity fosters community solidarity and strengthens fan attachment to teams.
The emphasis on local players mirrors findings related to racial congruency in sports. Nadeau et al. (2011) observed that MLB teams with racial compositions reflecting their market demographics experienced increased attendance. Similarly, basketball teams saw attendance rise when their racial makeup aligned with that of their city (Burdekin & Idson, 1991). These studies illustrate the broader principle that alignment between team composition and market identity, such as birthplace, drives fan demand.
In the NHL, birthplace plays a more central role in fan identity and marketing due to the league's geographically diverse player development pathways, which differ significantly from those of the NBA or NFL. The league's roster website highlights player birthplaces, and locally born players are prominently featured in promotional materials, serving as relatable figures who enhance fan loyalty and foster community pride. Schmid et al. (2024) noted that the influence of player identity extends beyond an athlete's active career, with birthplace effects continuing to shape fan connections over time. Côté et al. (2006) further emphasized the enduring impact of birthplace on talent development and regional pride.
While existing research demonstrates that locally born players enhance fan engagement, which further boost attendance and revenue across various sports leagues, their role within the NHL is particularly significant. Unlike other leagues, NHL teams rely more heavily on local revenue sources, such as tickets, parking, and concessions, distinguishing them from other leagues that depend primarily on national revenue streams, such as TV or media deals. 5 This underscores the need for further investigation into the impact of locally born players on attendance and revenue in the NHL, providing actionable insights for team management and marketing strategies.
Data
The study covers 14 NHL seasons from 2005 to 2018. This period was selected because it follows the 2004 NHL lockout, which resulted in a new Collective Bargaining Agreement featuring significant changes, such as the implementation of a salary cap. 6 The study ends with the 2018 season due to the impact of the Covid-19 pandemic on subsequent seasons. Although additional seasons were considered, the variation in response policies across states and countries posed a challenge. During the reference period, 82 regular-season games were played each year, except in 2012 when the season was shortened to 48 due to another lockout that delayed the season's start. 7 Previous research indicates that neither the 2004 nor the 2012 lockouts had a significant short-term or long-term impact on attendance (Treber et al., 2018). Out of the 82 regular season games in each season, every team plays 41 home games. The number of teams increased from 30 to 31 in 2017 with the expansion of the Vegas Golden Knights. Additionally, the Atlanta Thrashers relocated to Winnipeg in 2011 and was renamed the Winnipeg Jets. 8 The total sample size, representing the number of individual team seasons played in the study period is 422.
To capture our main focus—the impact of local players, we defined a key variable as the sum of games played by local players for a given team in a given year. O’Reilly and Nadeau (2006) had defined a local player as one born in the same state or province as the team they play for or born within 100 km of the arena where the team plays. For example, a player born in Gatineau, Québec and playing for the Ottawa Senators can be considered local despite not being born in Ontario due to the geographic proximity of the two locations. In this paper, we use a similar definition of local players but enhance it by considering the number of games played by each local player, rather than simply counting the number of local players. This approach accounts for the fact that some players participate in more games than others and that being on a team's roster does not guarantee play on-ice. This refinement is crucial because the impact of key players is more significant, as fans are more likely to connect with players who play frequently (Burdekin & Idson, 1991).
Table 1 illustrates the calculation of the 271 games played by local players in 2018 for the Boston Bruins. Of the 37 players on the team's roster that year, four were from the home state of Massachusetts, while one was born in a different state but within 100 km of Massachusetts. The total games played by these local players add up to 271, representing an equivalent weighted average of the number of local players contributing to the team's performance.
Distribution of the 271 Games Played by Local Players for the 2018 Boston Bruins.

Note. Authors’ calculations using data from Hockey DB and Simplemaps.
To obtain data on the number of games played by local players in a given year, we sourced birthplace data from individual teams’ rosters on HockeyDB. This data was then combined with the latitude and longitude data from Simplemaps to identify players born within 100 km of each team's arena. 9 Figures 1 and 2 present the geographic distribution of players from the sample based on their birth locations. While one might have expected most players to be from Canada, reflecting the NHL's origins in the 1900s, it is evident that a significant number of players are also born in the major U.S. cities. That being said, players remain predominantly concentrated around the Great Lakes, where the “Original Six” NHL teams were established. While the distribution of locally born players may influence team selection, we examined the distribution of players and their birthplaces and found that, although it is not perfectly random in smaller cities, it is well-distributed in most larger cities (Côté et al., 2006).
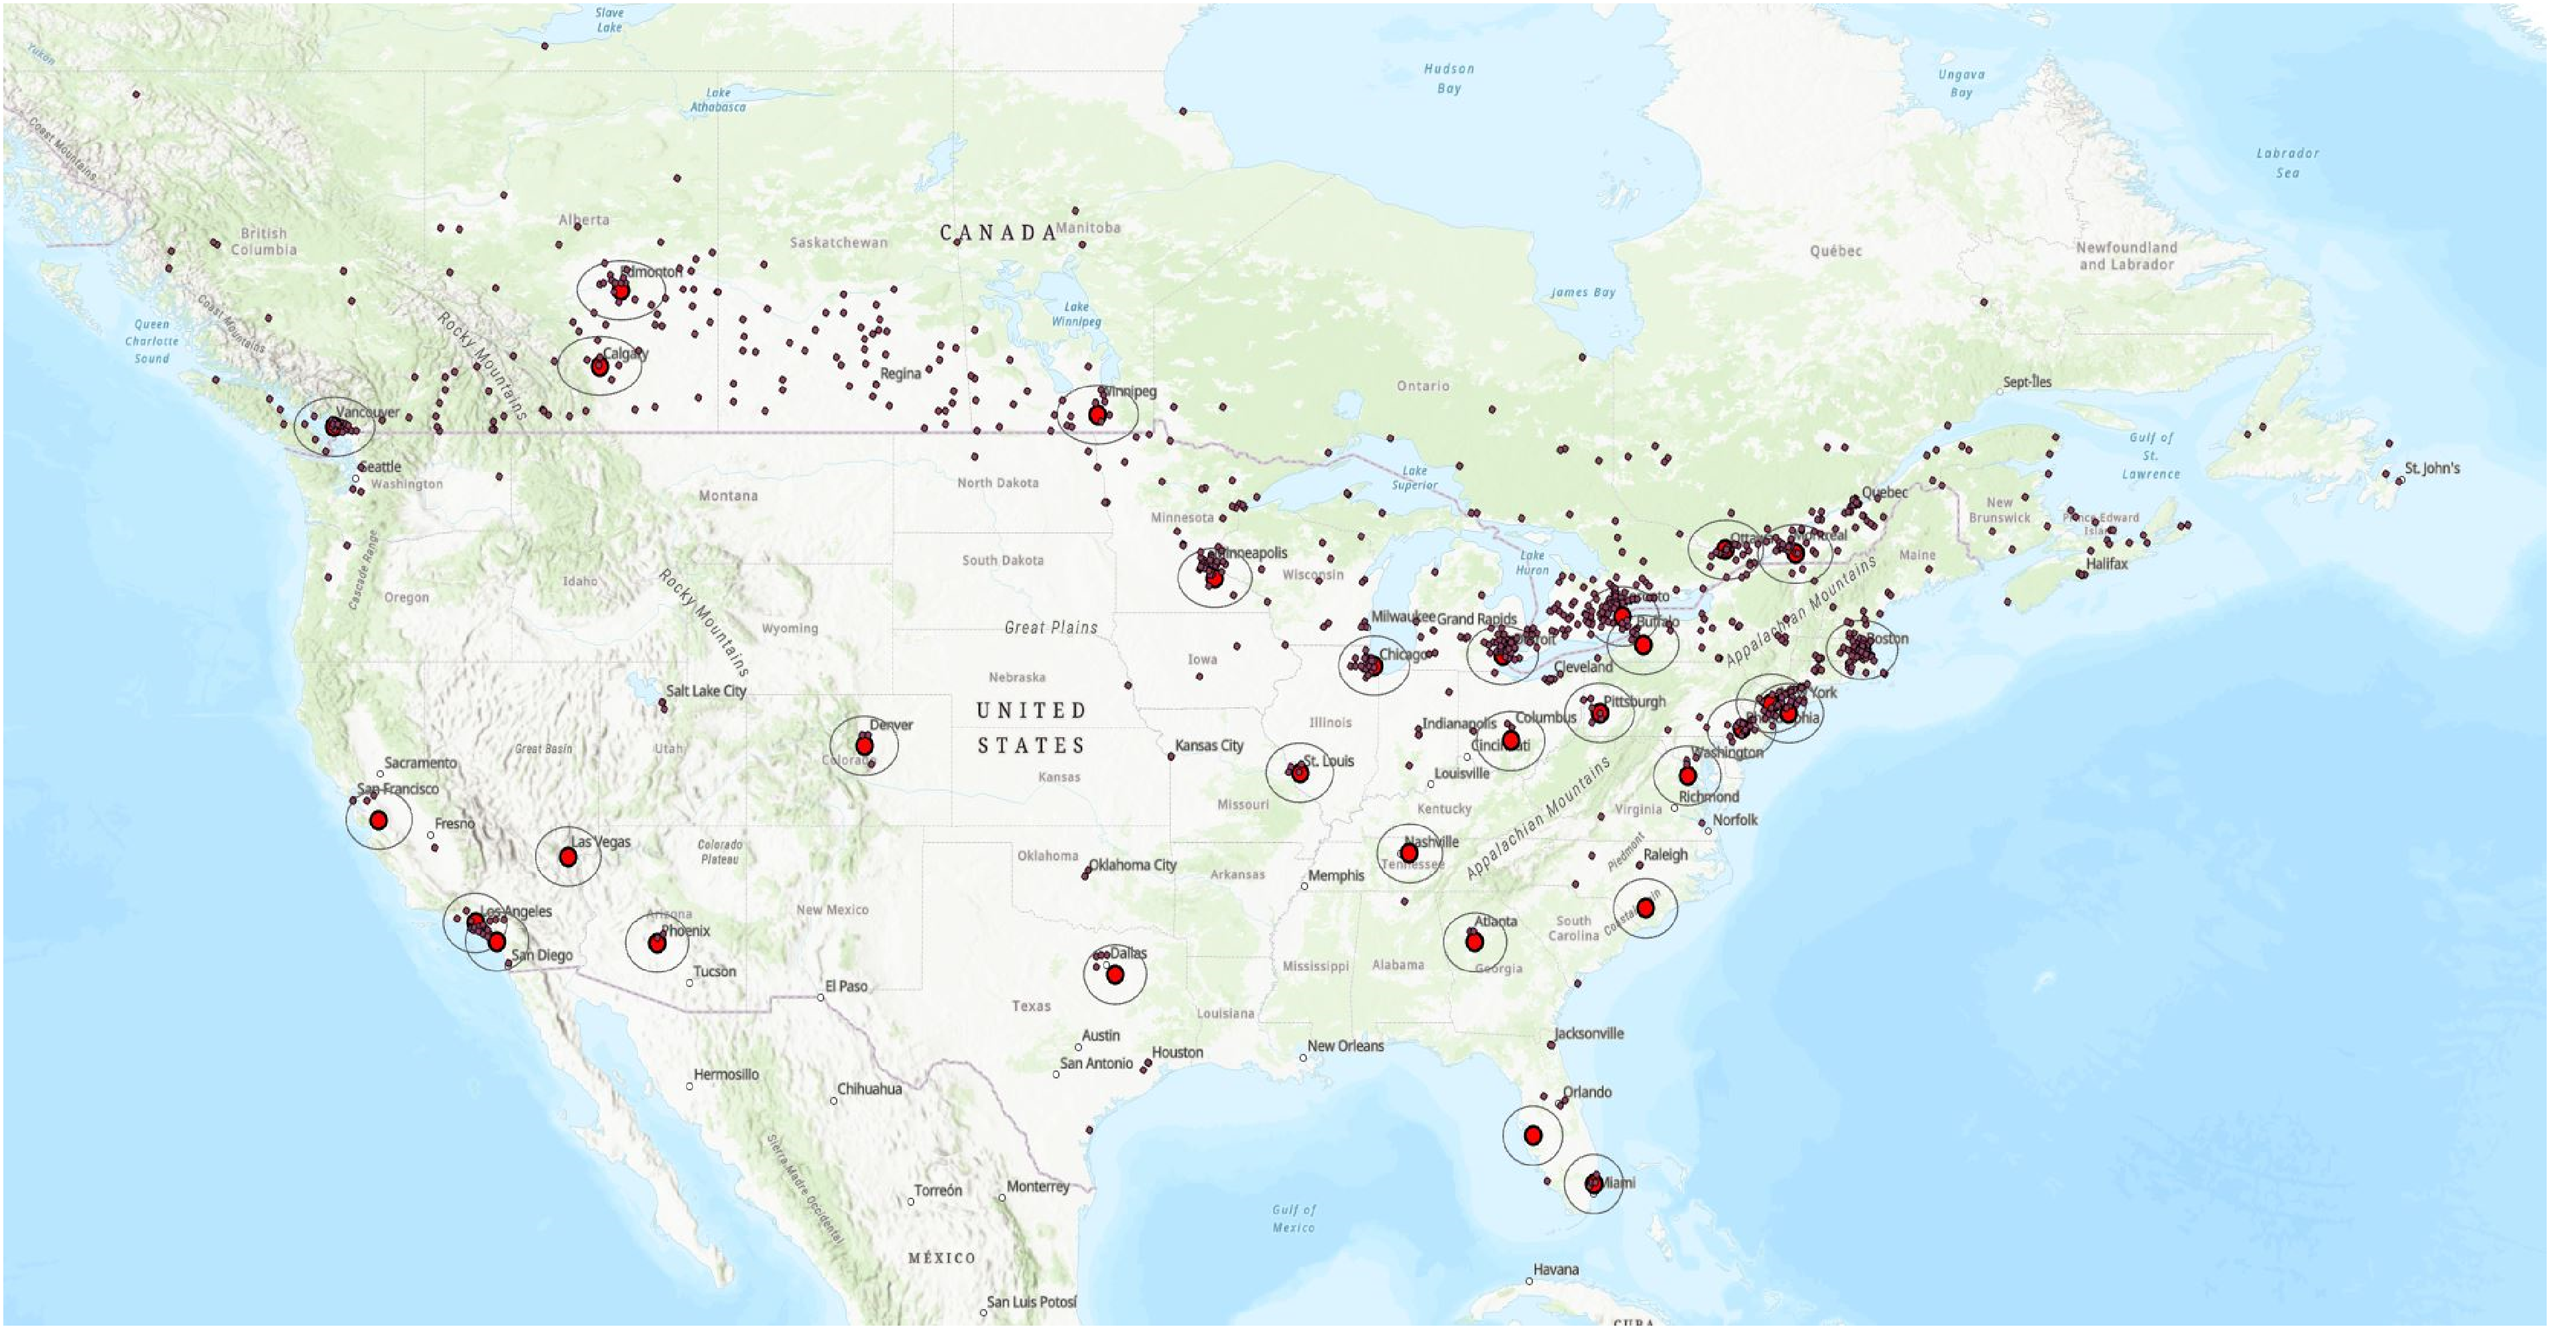
Geographic distribution of NHL players birth and teams location.
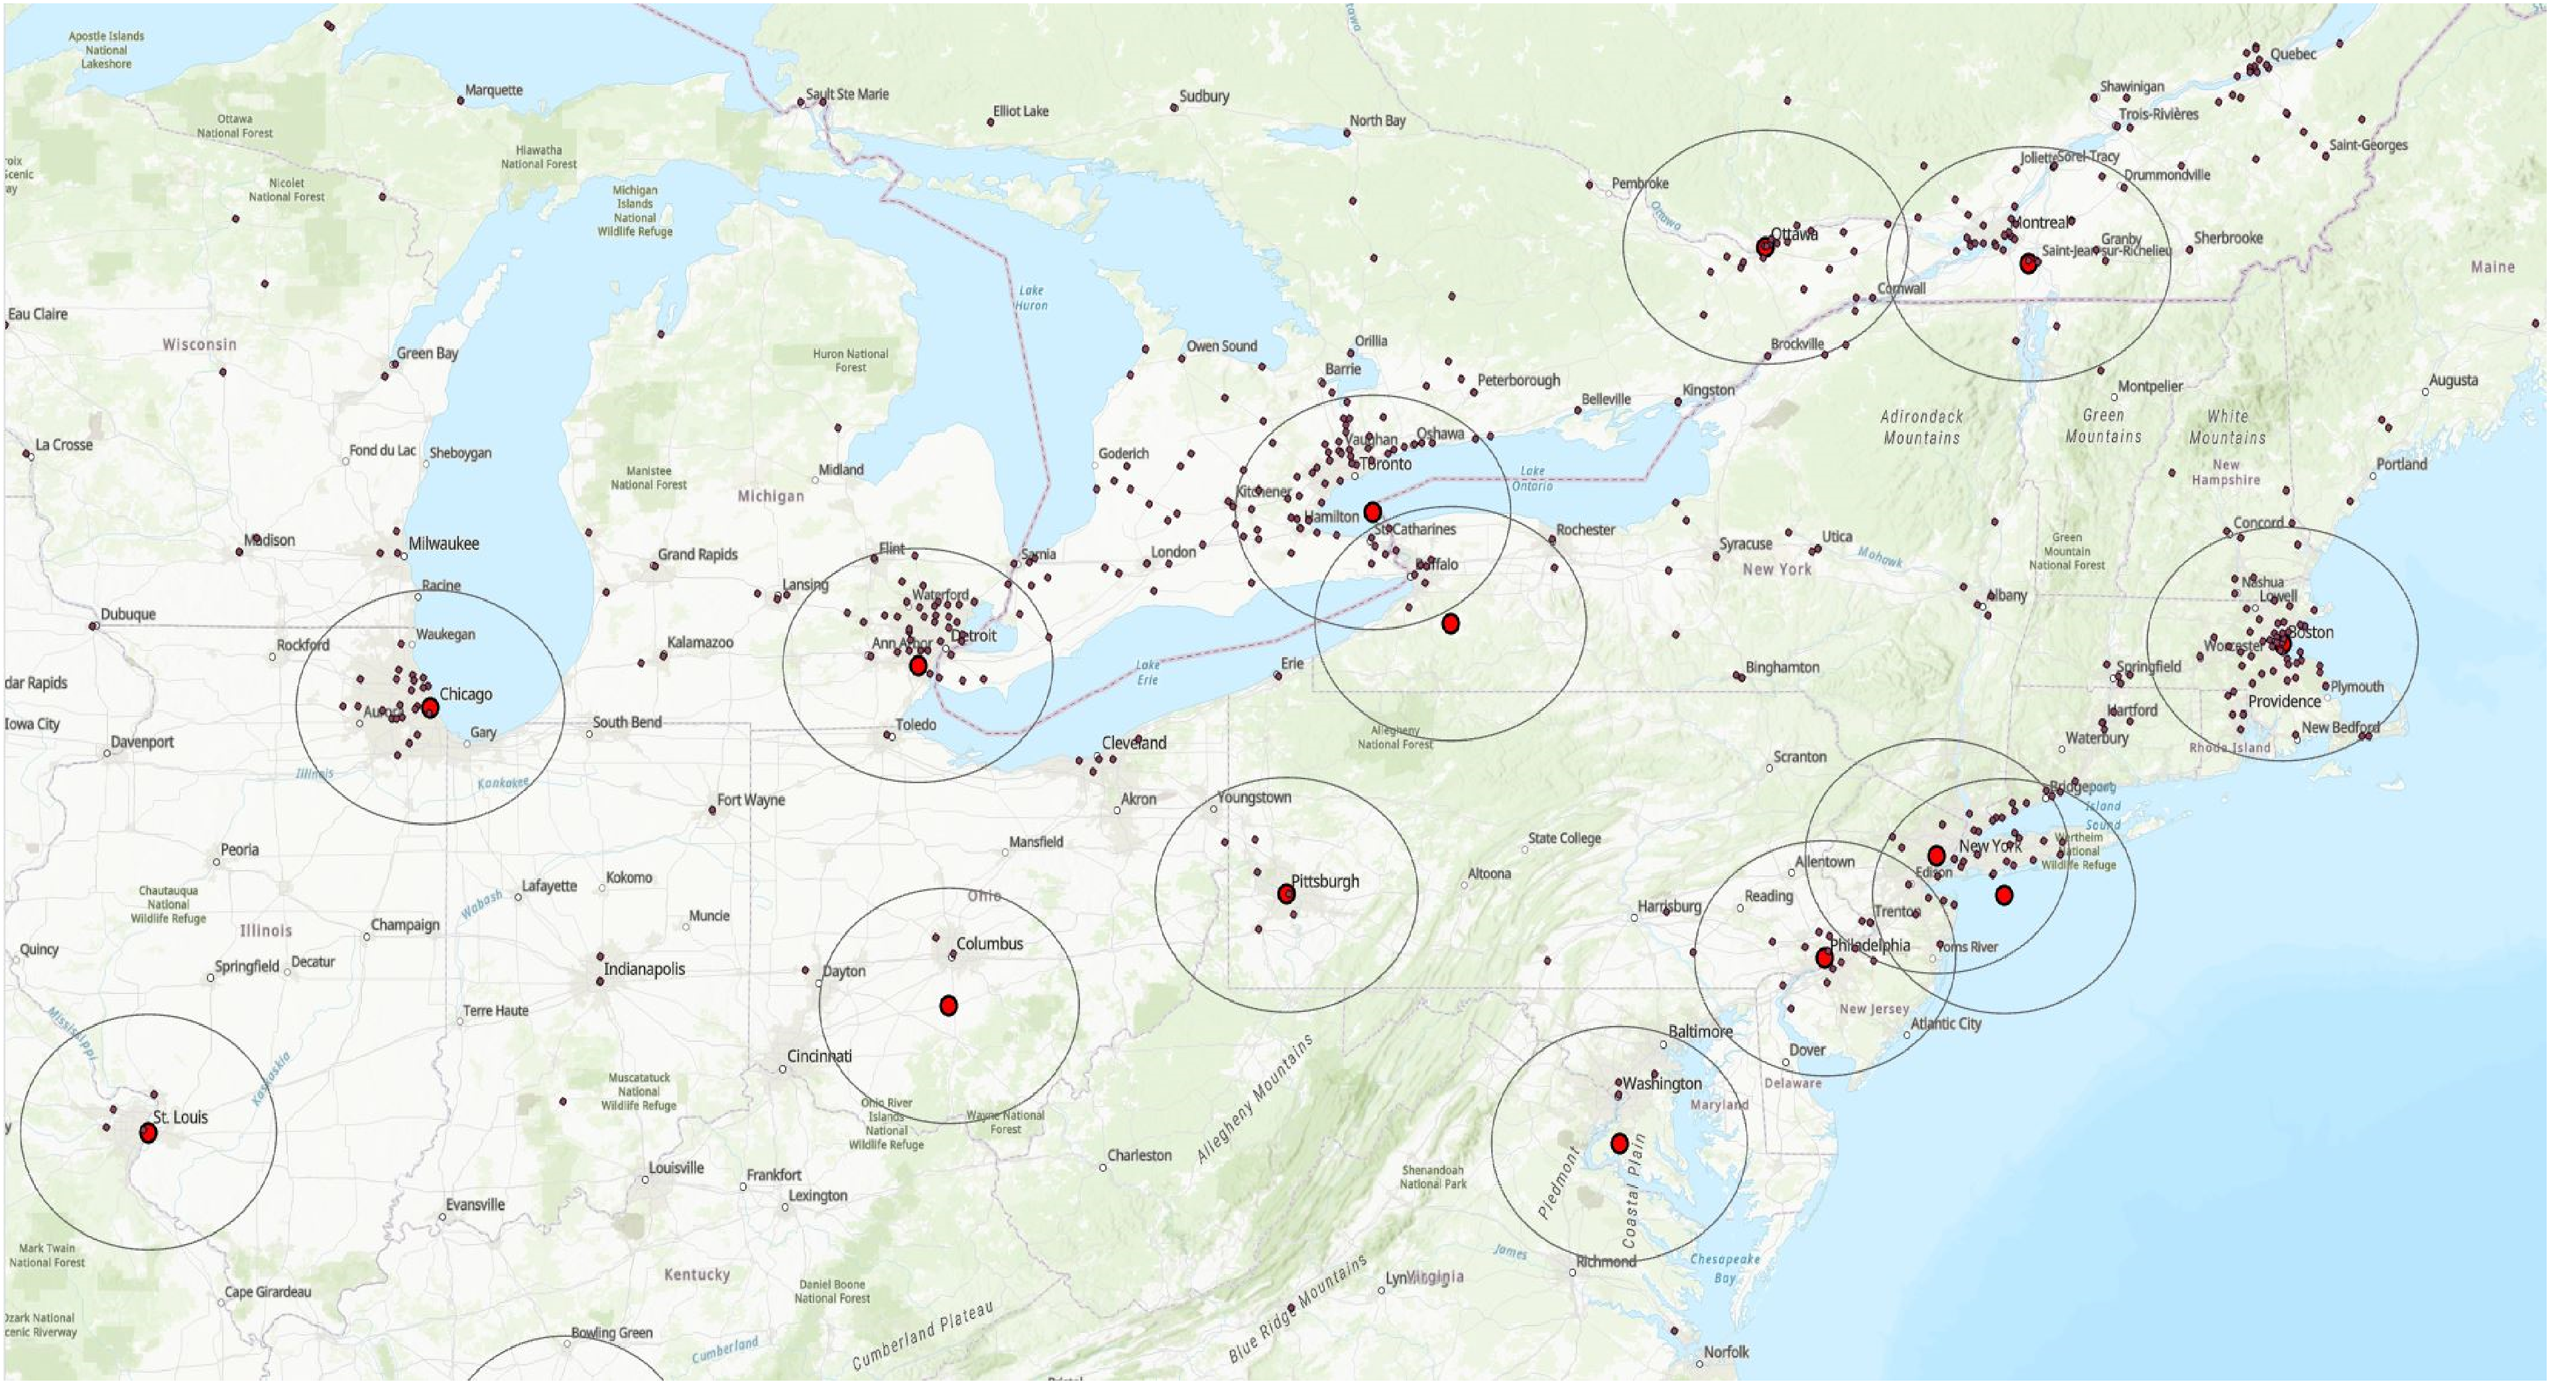
North-east distribution of NHL players birth and teams’ location.
Evaluating the impact of local players on the demand for hockey games necessitates the use of appropriate dependent variables. Attendance is a natural choice, as it is commonly used in studies analyzing hockey demand (Treber et al., 2018; Villar & Guerrero, 2009). Therefore, the primary dependent variable used to measure the impact of local players on hockey demand is the average attendance for each team per season, a statistic that has been publicly reported for years and compiled by ESPN. 10 While each NHL team plays 41 regular-season games each season, only games played in the home arena should be considered to avoid skewing results with large crowds drawn to outdoor games, which can be held in neutral locations and offer unique attractions. For example, on January 1, 2014, the Detroit Red Wings hosted the Toronto Maple Leafs at Michigan Stadium, drawing 105,491 spectators. 11 Including such attendance figures in the season average attendance of the Detroit Red Wings would significantly affect their reported attendance of 908,131 for that season. Consequently, we exclude attendance from outdoor games when calculating the season average attendance. 12 Although including a dummy variable for outdoor games was considered, the wide range of attendance values depending on the stadium used makes this approach impractical.
While attendance data is commonly used as an indicator of hockey demand in the literature, it presents several challenges. First, teams often report the number of tickets sold rather than actual game attendance (Paul et al., 2019). Additionally, ticket pricing influences attendance but is impossible to control for, as data on ticket prices is scarce and varies widely among teams and there is no available reliable data (Paul et al., 2013). To address these potential issues, we also examine the relationship between local players and team revenue, which is another measure of hockey demand that has been used in previous research (Treber et al., 2018). Although using revenue as a dependent variable would have been difficult in the past, Forbes now provides this data publicly (Treber et al., 2018). Team revenue, reported in millions of U.S. dollars, is obtained from Forbes and available annually. 13
Table 2 presents the main descriptive statistics for this study, which includes 422 observations representing team-level measures across NHL seasons from 2005 to 2018. The average number of local players is 2.11, with a max of 15. The primary measure of local player impact is the total number of games played by these players, with a mean of 90.26 and a range from 0 to 703. To provide context, during the study period, some teams had no locally born or players born within 100 km, resulting in zero local player games. In contrast, teams like the Ottawa Senators in the 2016 season featured 15 local players participating in 703 total games. 14 Considering the contribution and quality of local players, the mean total number of games played by local star 15 player is 4.32. 16 For local players who participated in at least half of the games during the hockey season, the number of games played ranges from 0 to 671, with a mean of 76.32.
Summary Statistics of the Variables Used in the Study.
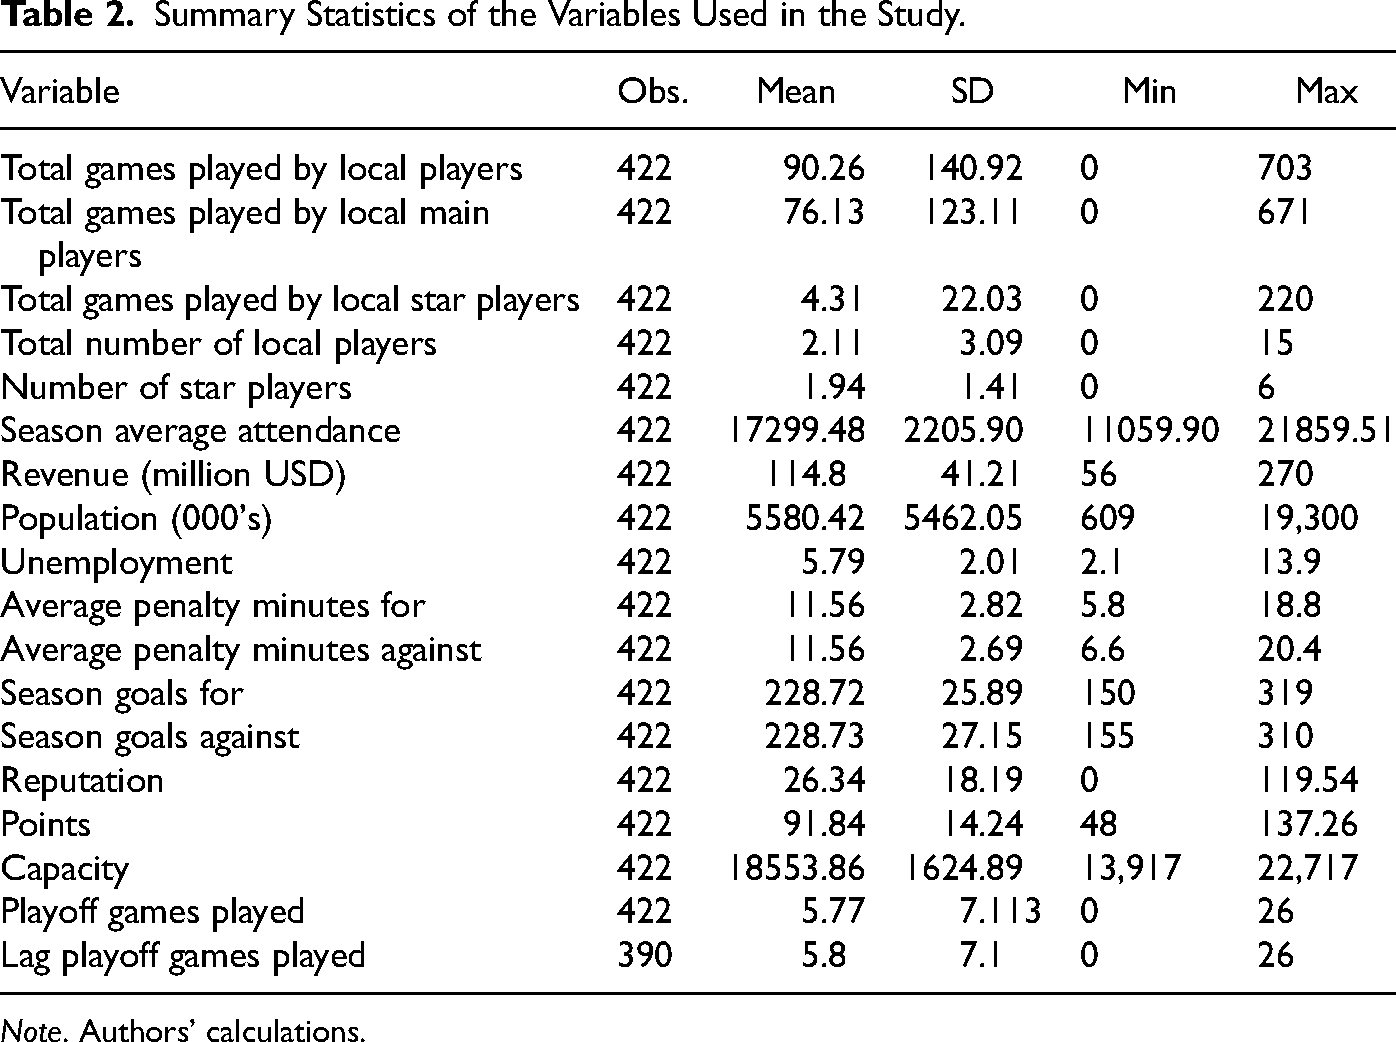
Note. Authors’ calculations.
Seasonal average attendance per home game ranges from 11059.9 to 21859.1 and the annual revenue fluctuates between $56 million and $270 million U.S. dollar. Additional control variables include population, local unemployment rate, total number of star players; average penalty minutes, season goals, team reputations, calculated as a discounted weighted average of the last 20 seasons’ finishes; points, arena capacity, and playoff games played. These statistics offer a comprehensive view of the factors influencing team performance and financial outcomes, and we discussed more details of variable inclusions with the model in the next section.
Methodology
Simply examining teams with total games played by local players and regressing this against their average season attendance or revenue suggests a positive influence from local players, as illustrated in Figures 3 and 4. However, the observed positive correlation between local players and attendance, or between local players and revenue, does not provide robust evidence due to the multitude of other factors that can influence both attendance and revenue. To obtain a more accurate understanding of the impact of local players, it is crucial to account for these additional variables.
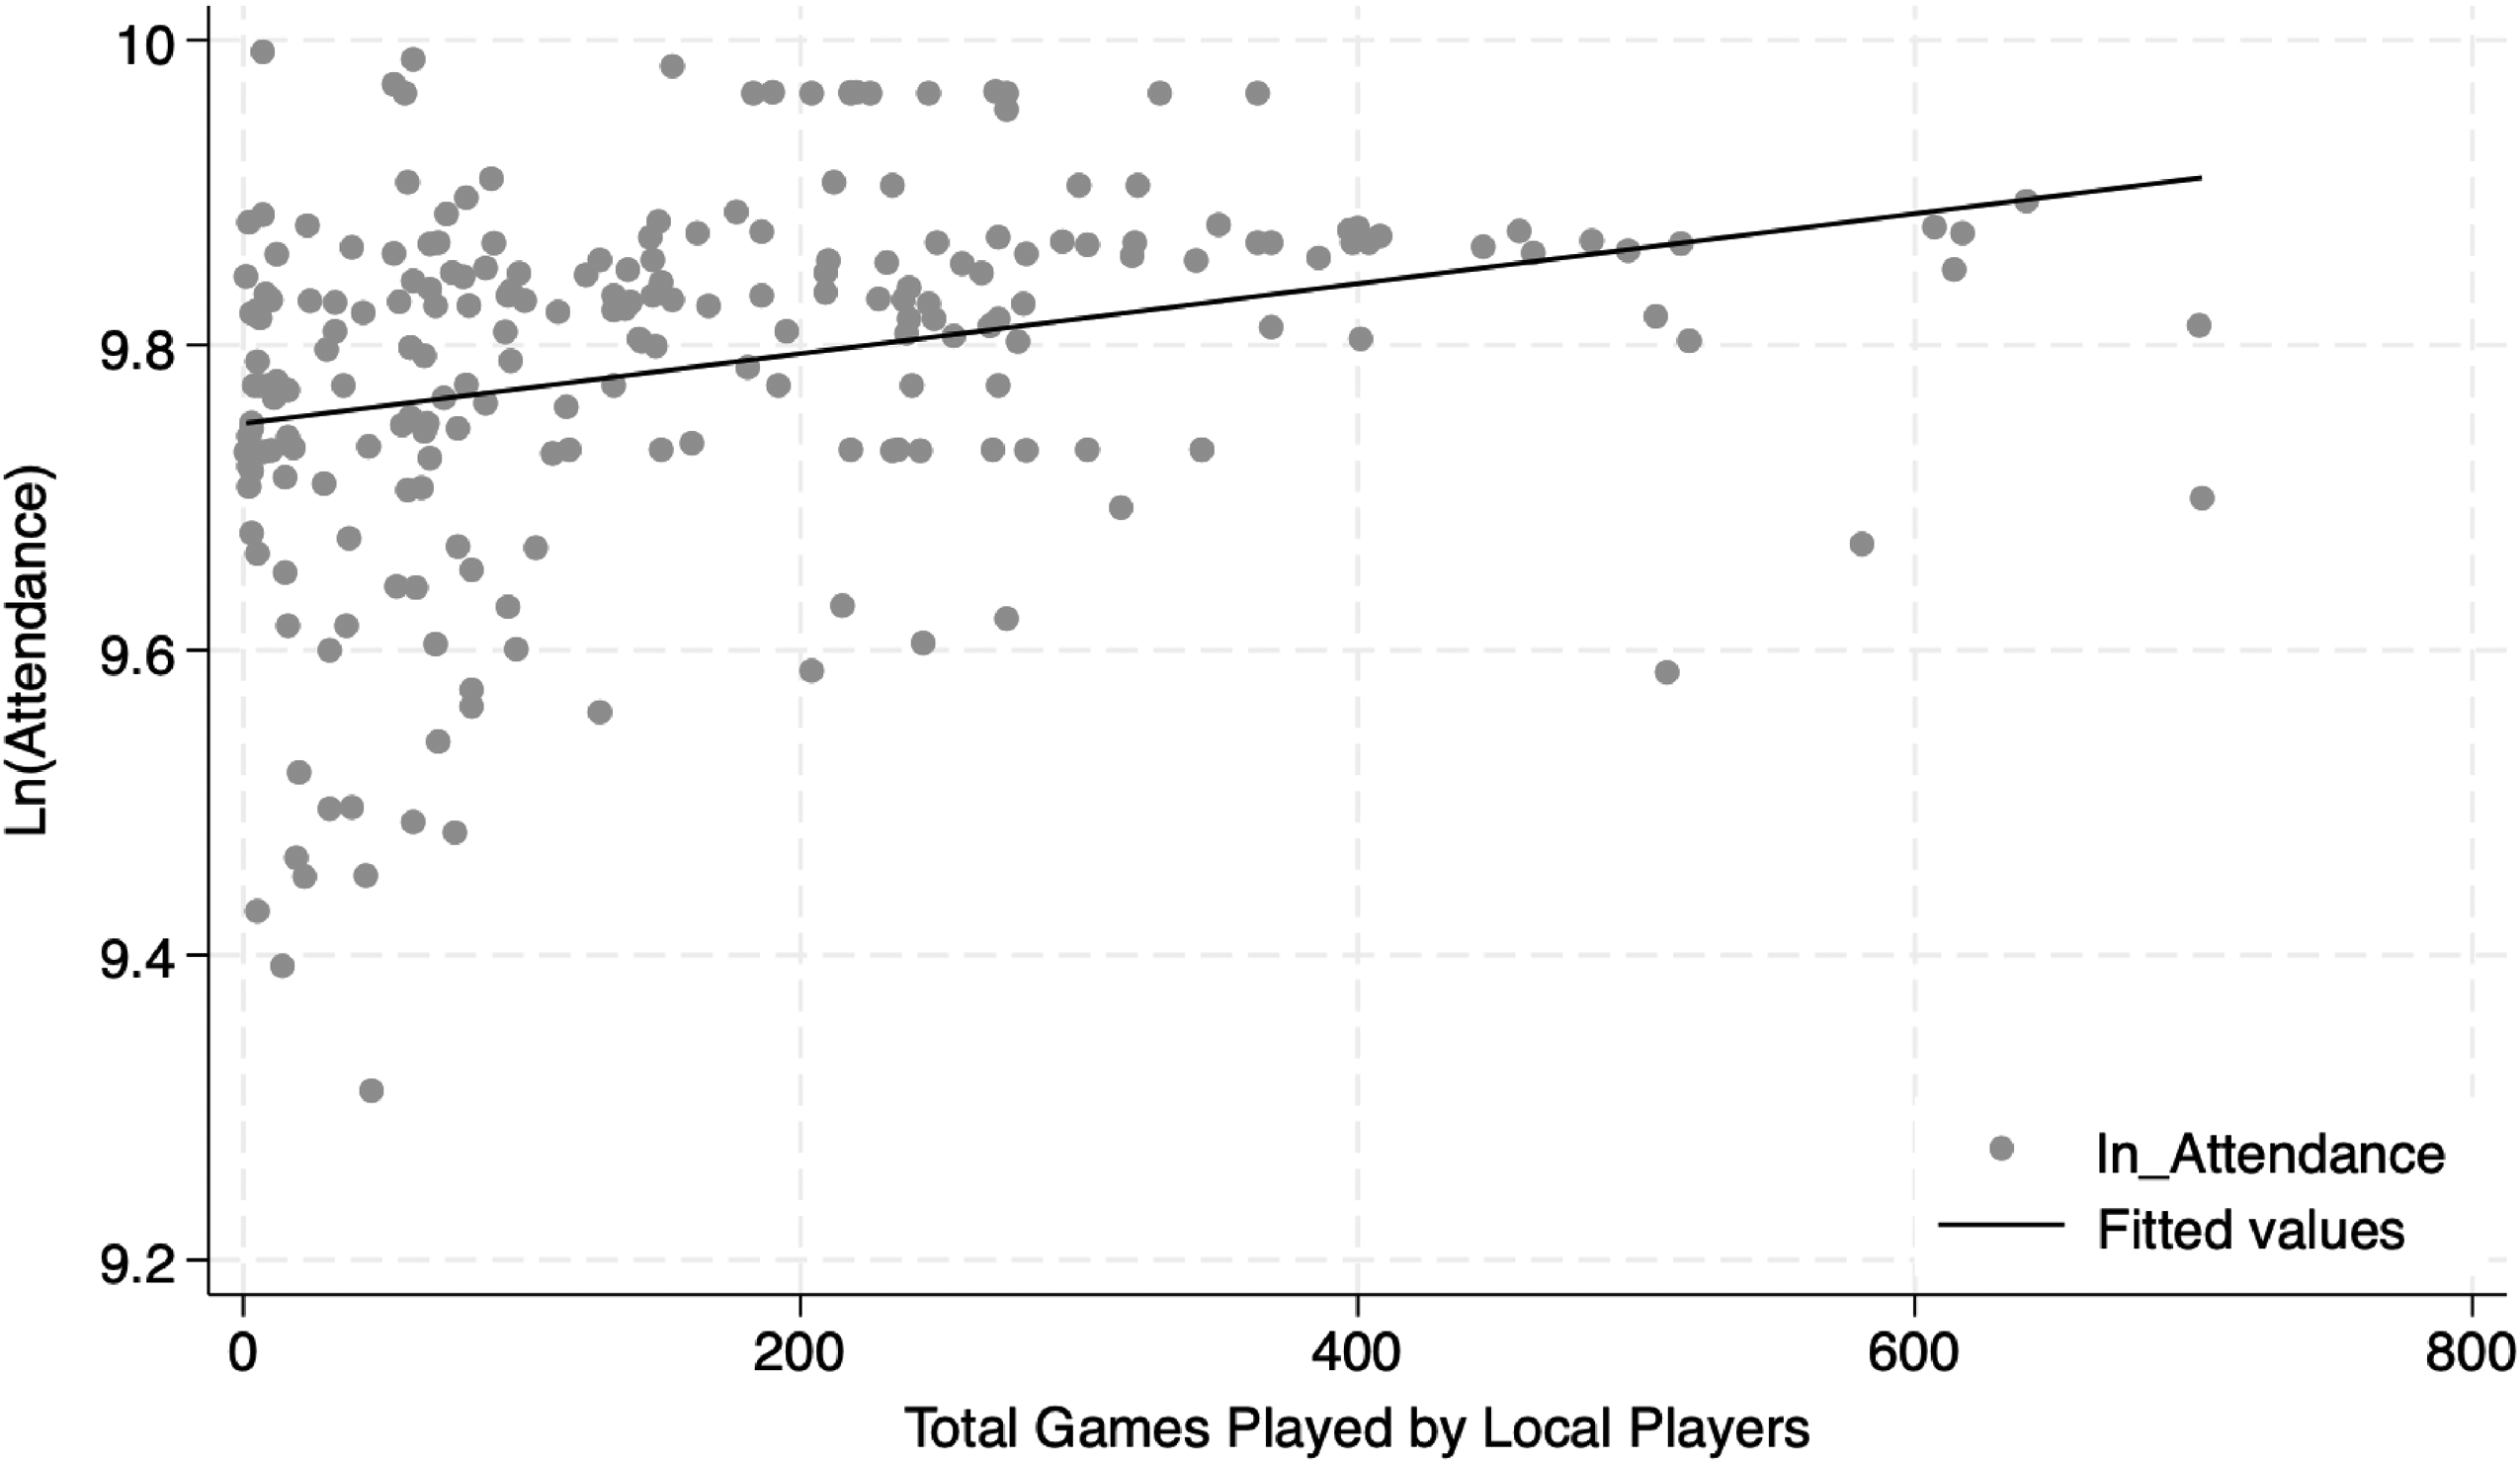
Simple correlation of attendance and total games played by local players.
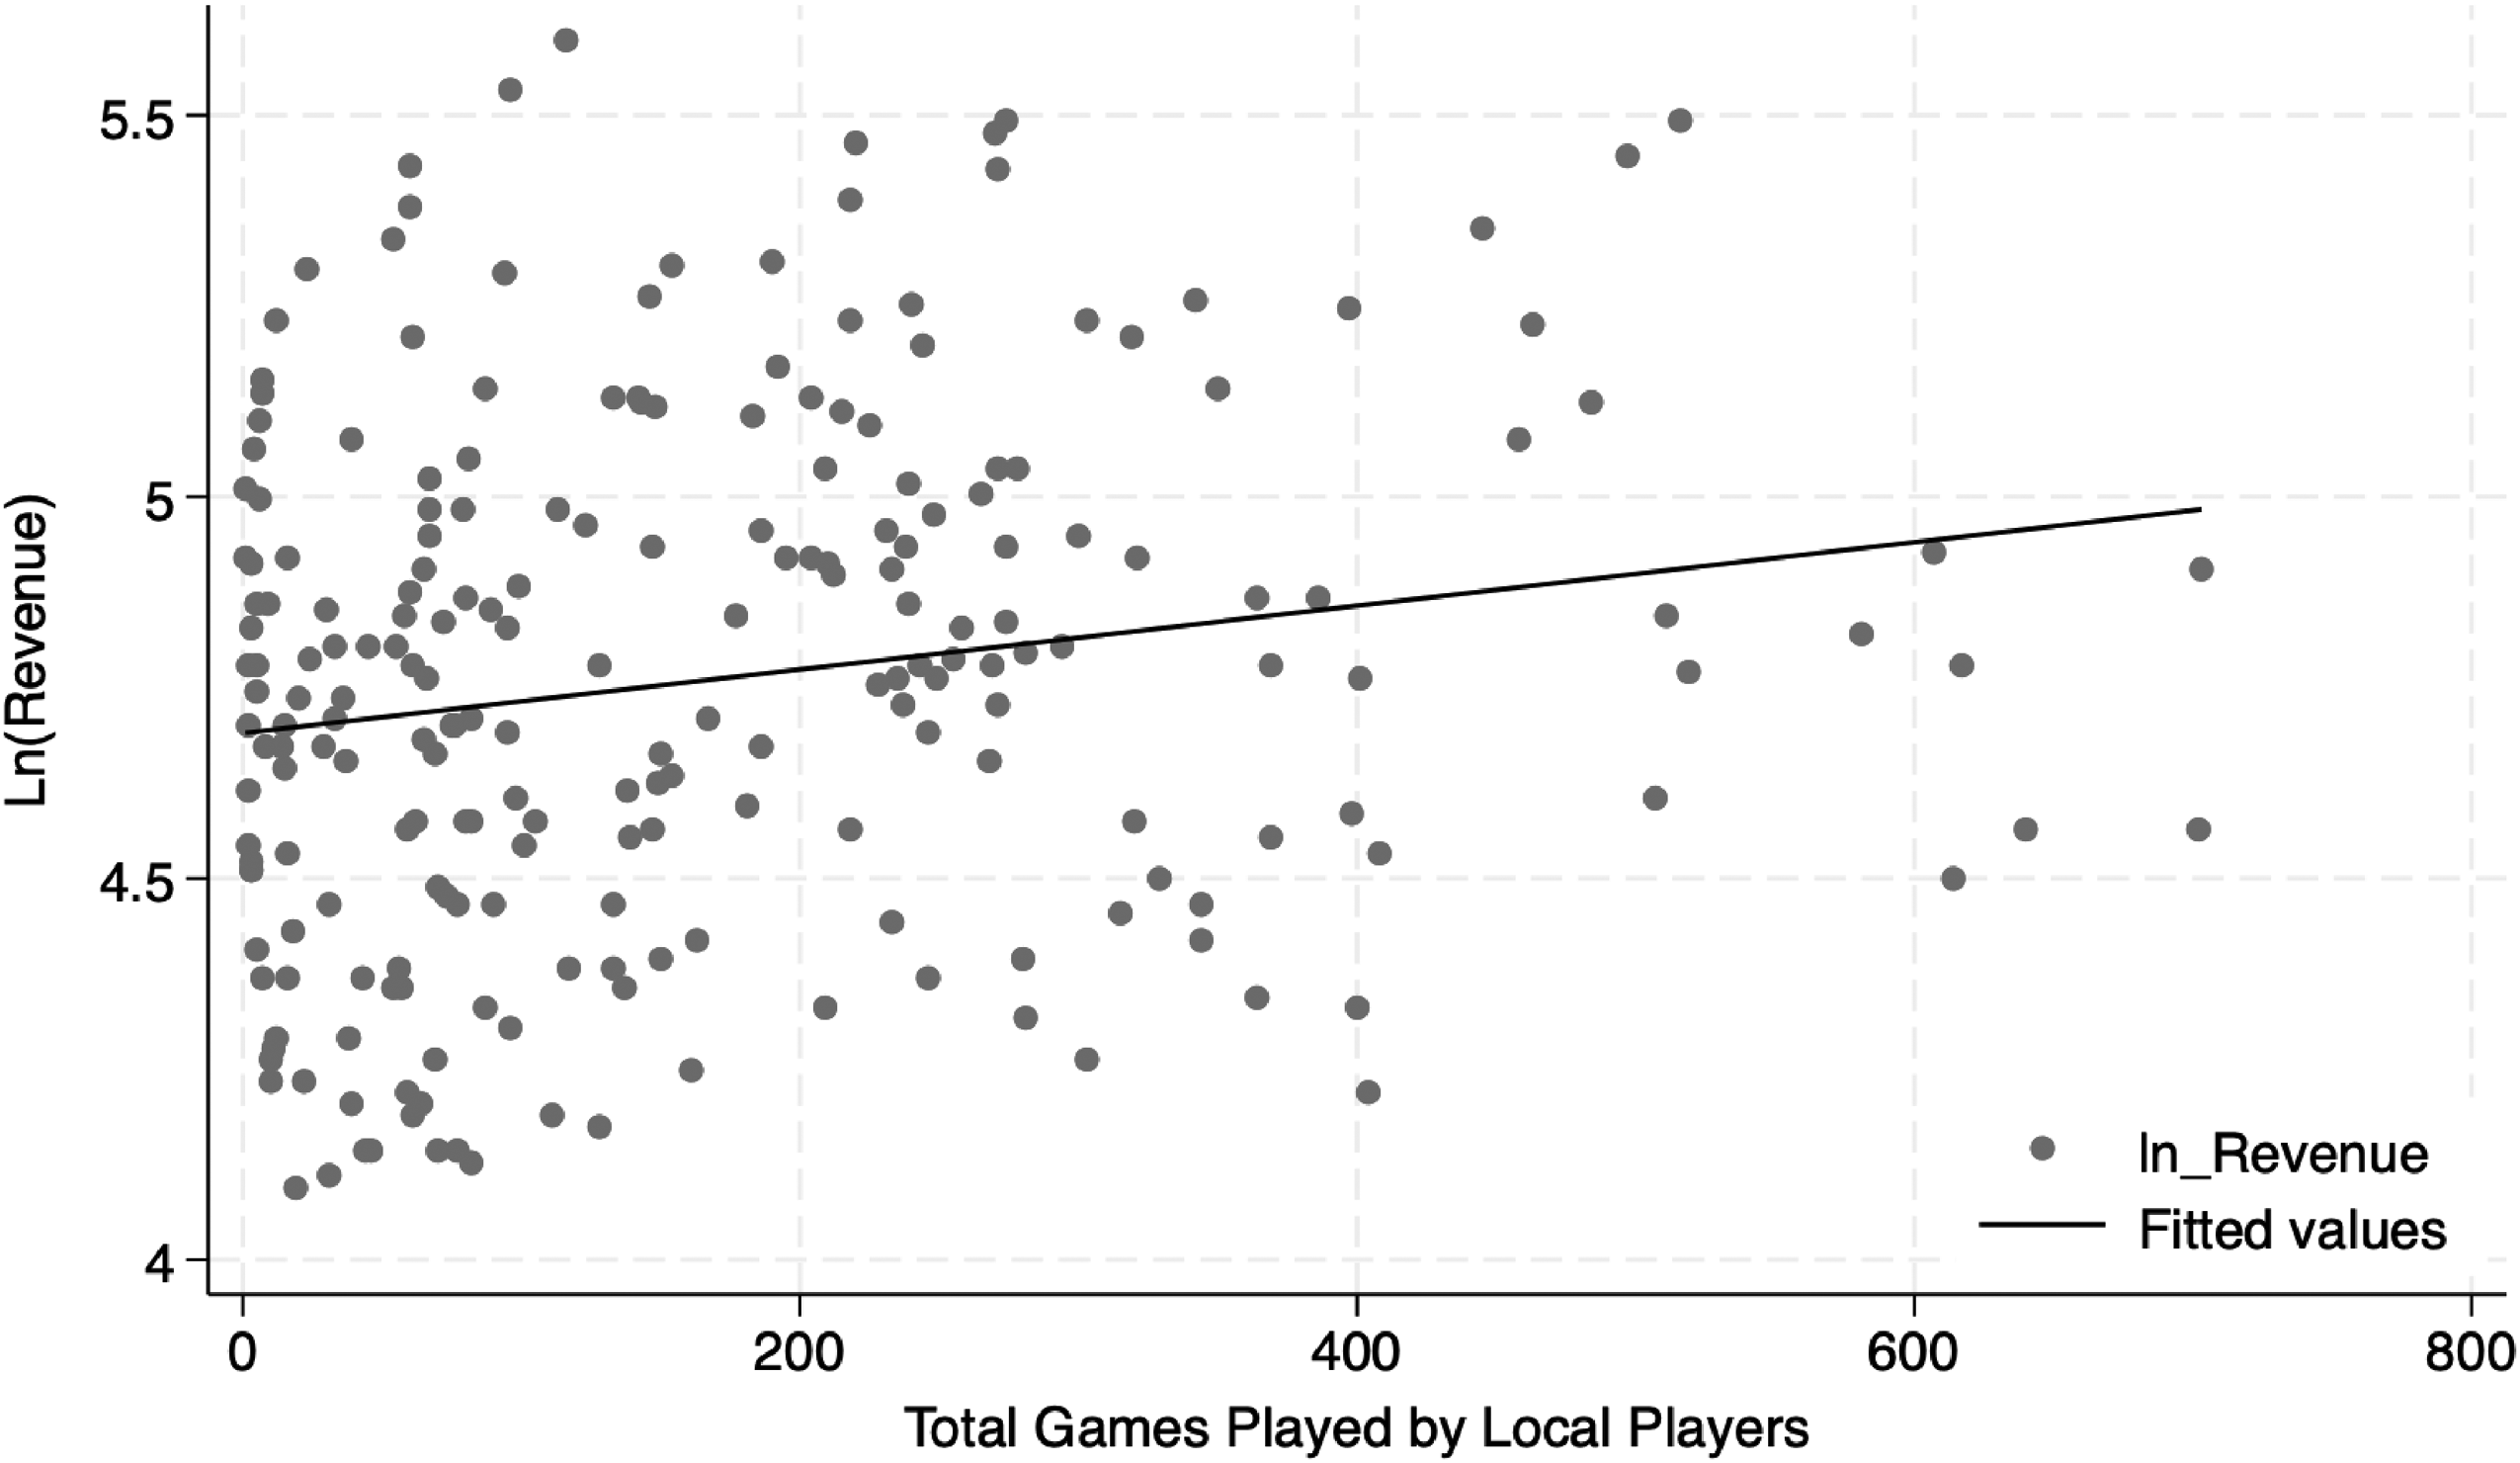
Simple correlation of revenue and total games played by local players.
To control for additional factors influencing attendance and revenue, we build upon the reduced-form model developed by Coates and Humphreys (2005), which assumes that the team sets price at the beginning of the season to maximize profit. This model enables us to regress the variable of interest along with various other factors affecting hockey demand. While revenue does not present any significant issues, attention must be given to attendance due to the capacity constraint of the arenas. In the context of individual game data, a Tobit model used by Villar and Guerrero (2009) is appropriate. However, since our analysis focus on season average, we opt to include a control variable for arena capacity in the regression model and apply the logarithm transformation to attendance to address the skewness of the data.
As previously mentioned, numerous factors other than local players affect the hockey demand. To control for the quality of the home team, we use the number of ranking points as a measure of a team's performance (Czarnitzki & Stadtmann, 2002; Paul et al., 2013, 2019; Treber et al., 2018). According to the NHL point system introduced in 2005, teams receive 2 points for a win, 1 point for losing in overtime, and 0 for a loss in regular time. 17 Previous research demonstrates that fans are more attracted to teams that score a high number of goals, thus justifying the inclusion of average goals scored in the model. Additionally, fans’ preference for fighting during hockey games justifies using penalty minutes as a proxy for fighting (Paul et al., 2013, 2019). More precisely, average penalty minutes for and against are included in the model. Furthermore, there is evidence suggesting that superstars, like local players, may also possess significant drawing power (Brandes et al., 2008; Deutscher & Schneemann, 2017). A control variable is therefore included for star players, defined as discussed before.
One potential issue that needs to be controlled for is the habit effect, where teams may retain fans from one season to the next based on past performance. In fact, a team that aligns consecutive seasons with high performance is likely to attract more fans in the upcoming seasons, regardless of its subsequent performance. To account for this, a measure of team reputation is defined based on a reputation index initially developed for soccer (Brandes et al., 2008; Czarnitzki & Stadtmann, 2002).
While the previously discussed variables are used for both regression models, the number of playoff games played should be considered in the case of revenue while it does not need to be controlled for in the case of attendance (Treber et al., 2018). In fact, season average attendance is calculated only for the regular season and does not include playoff games. Additionally, the model already controls for the previous year's and current year's performance. However, for revenue, playoff games represent additional opportunity for teams to sell tickets and likely have a significant impact. Furthermore, a long playoff run in the previous year is likely associated with increased merchandise sales in between seasons. Therefore, the number of playoff games and the first lag of the number of playoff games are therefore added as control variables. The regression model is shown in Equation 2, where X represents various control variables and LnY is either the natural logarithm of the season revenue or season average attendance:
To ensure the robustness of our local player measurements, we conducted additional analyses by modifying the variable of interest in Equation 2. Specifically, we examined the impact of previously discussed “Total Games of Local Star Players” and “Total Games of Local Main Players,” respectively. Furthermore, we replaced the number of games with a simpler definition of the total number of local players. This adjustment corresponds to Equation 3 with the same outcome and control variables above, and enables us to test whether the findings are sensitive across different definitions of local players.
Results
Main Results
Tables 3 and 4 present the main results of the regressions examining the impact of various factors on attendance and revenue in hockey from Equation 2. The coefficient of our main variable of interest, games played by local players, is positive and statistically significant at the 1% level. Adding additional control variables reduces the estimate, indicating that Figures 3 and 4 over-represent the relationship between the variables. Our results suggest that each additional game played by local players increase average season attendance by 0.02% and revenue by 0.05%. In the context of a local player who plays all 82 games in a season, with the assumption of equal effect per game, the model predicts an increase in average home game attendance by 1.64% and an increase in team revenue of 4.2%. Given that the mean of season average attendance is 17299.5 spectators per home game and average revenue is US$114.8 million, on average, an additional local player playing all 82 games of a season is associated with extra attendance by 284 spectators per home game (11,644 per season) and more revenue by US$4.82 million.
Regression Results of Total Number of Games by Local Players’ Impact on Attendance.
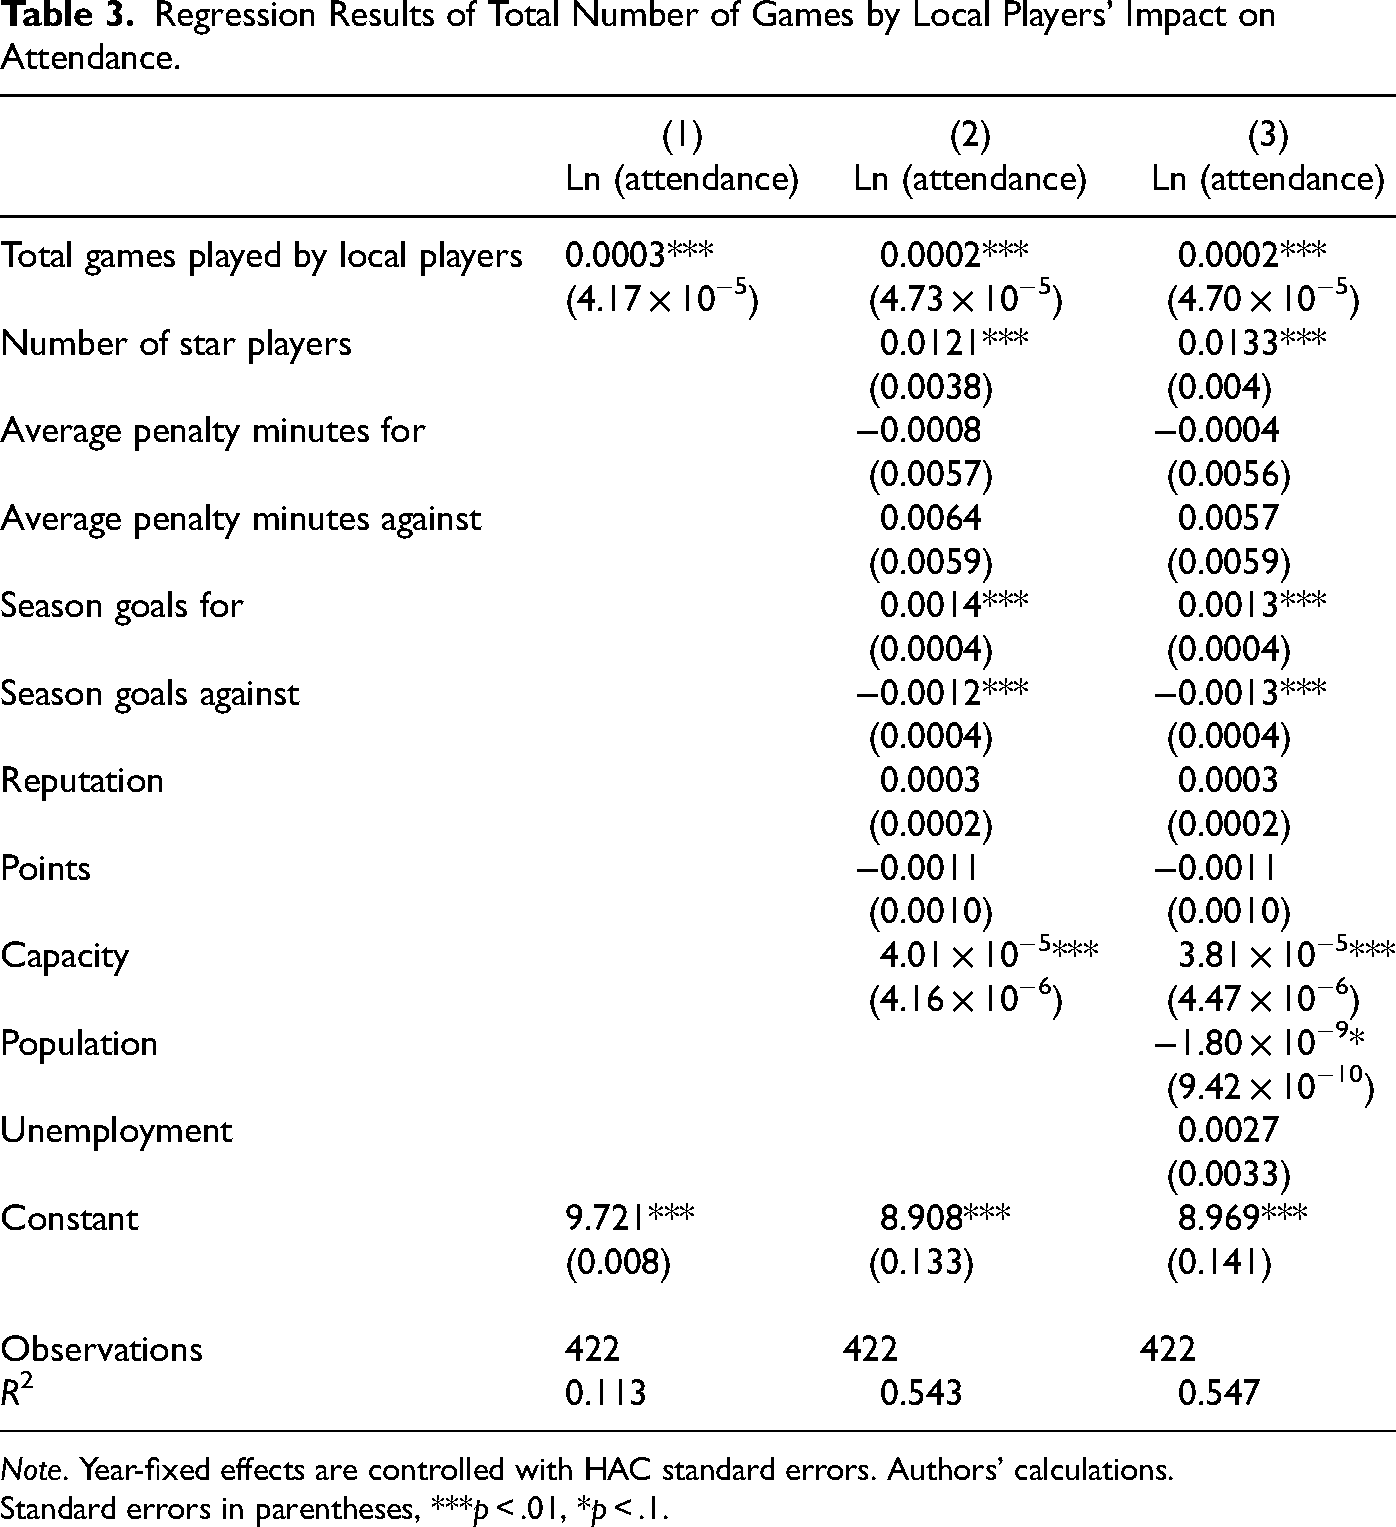
Note. Year-fixed effects are controlled with HAC standard errors. Authors’ calculations.
Standard errors in parentheses, ***p < .01, *p < .1.
Regression Results of Total Number of Games by Local Players’ Impact on Revenue.
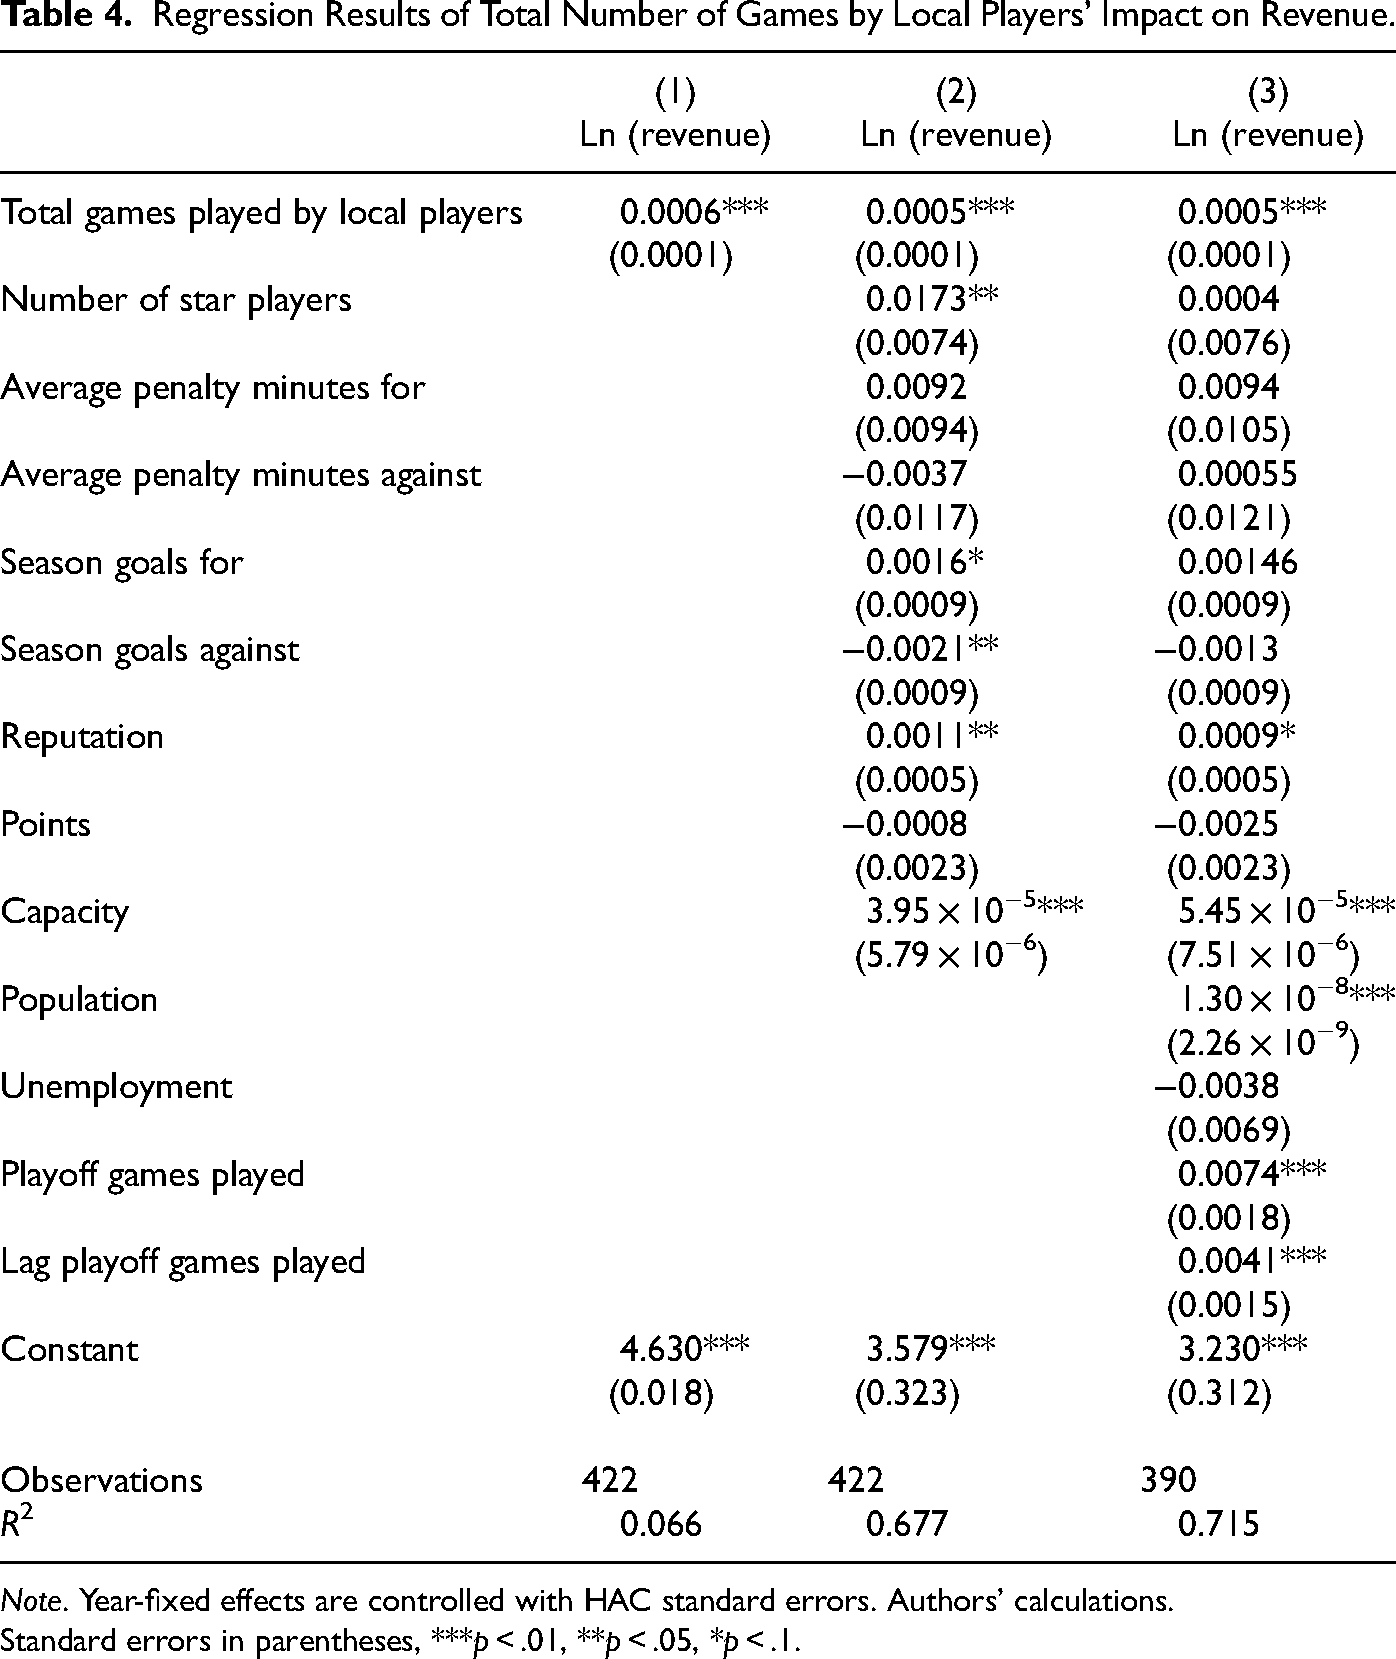
Note. Year-fixed effects are controlled with HAC standard errors. Authors’ calculations.
Standard errors in parentheses, ***p < .01, **p < .05, *p < .1.
While unemployment is not statistically significant for either attendance or revenue, the coefficient for population is statistically significant at least at the 10% level, though minimal for both outcomes. Additionally, although not shown in the table, most years exhibit positive and statistically significant results, indicating that both attendance and revenue have grown over time. Arena capacity also plays significant role in determining attendance and revenue. Both coefficients are statistically significant, indicating that larger arena capacity positively affects both attendance and revenue.
Among the variables considered are star players and team reputation. The results indicate that the number of star players is statistically significant at the 1% level for attendance, with a coefficient of 0.013, indicating that having star players positively affects attendance. However, it's not significant for revenue, despite the coefficient being positive. The reputation of the team, calculated as a discounted weighted average of the last 20 seasons’ finishes, also shows a positive effect, similar to the effect it has on attendance in soccer (Brandes et al., 2008; Czarnitzki & Stadtmann, 2002). The coefficient for reputation is positive and statistically significant at the 10% level for revenue, suggesting that a better team reputation may lead to higher revenue, though it is not significant for attendance despite also being positive, possibly because its effect is partially captured by performance-related variables, such as star player presence and recent achievements.
Considering the indicators of team performance, the results are less informative due to the strong correlation between the different variables. In fact, a successful team will typically finish the season with a high number of points, score many goals, concede few goals, and take fewer penalties while causing their opponents to incur more. Consequently, points and penalty minutes are not statistically significant for either attendance or revenue. However, the effect is captured by goals scored and goals against, which are both statistically significant for attendance and revenue at the 1% level. Goals scored have a positive effect, while goals against have a negative effect on both attendance and revenue. Additionally, the number of playoff games played in the current and the previous year are both positive and statistically significant at the 1% level on attendance.
Results from Other Definitions of Local Players
We examine the consistency of our findings using various definitions of local hockey players. Employing the model from Equation 3, we analyze the impact of the number of local players on game attendance and revenue, as presented in Tables 5 and 6, respectively.
Regression Results of Number of Local Players’ Impact on Attendance.
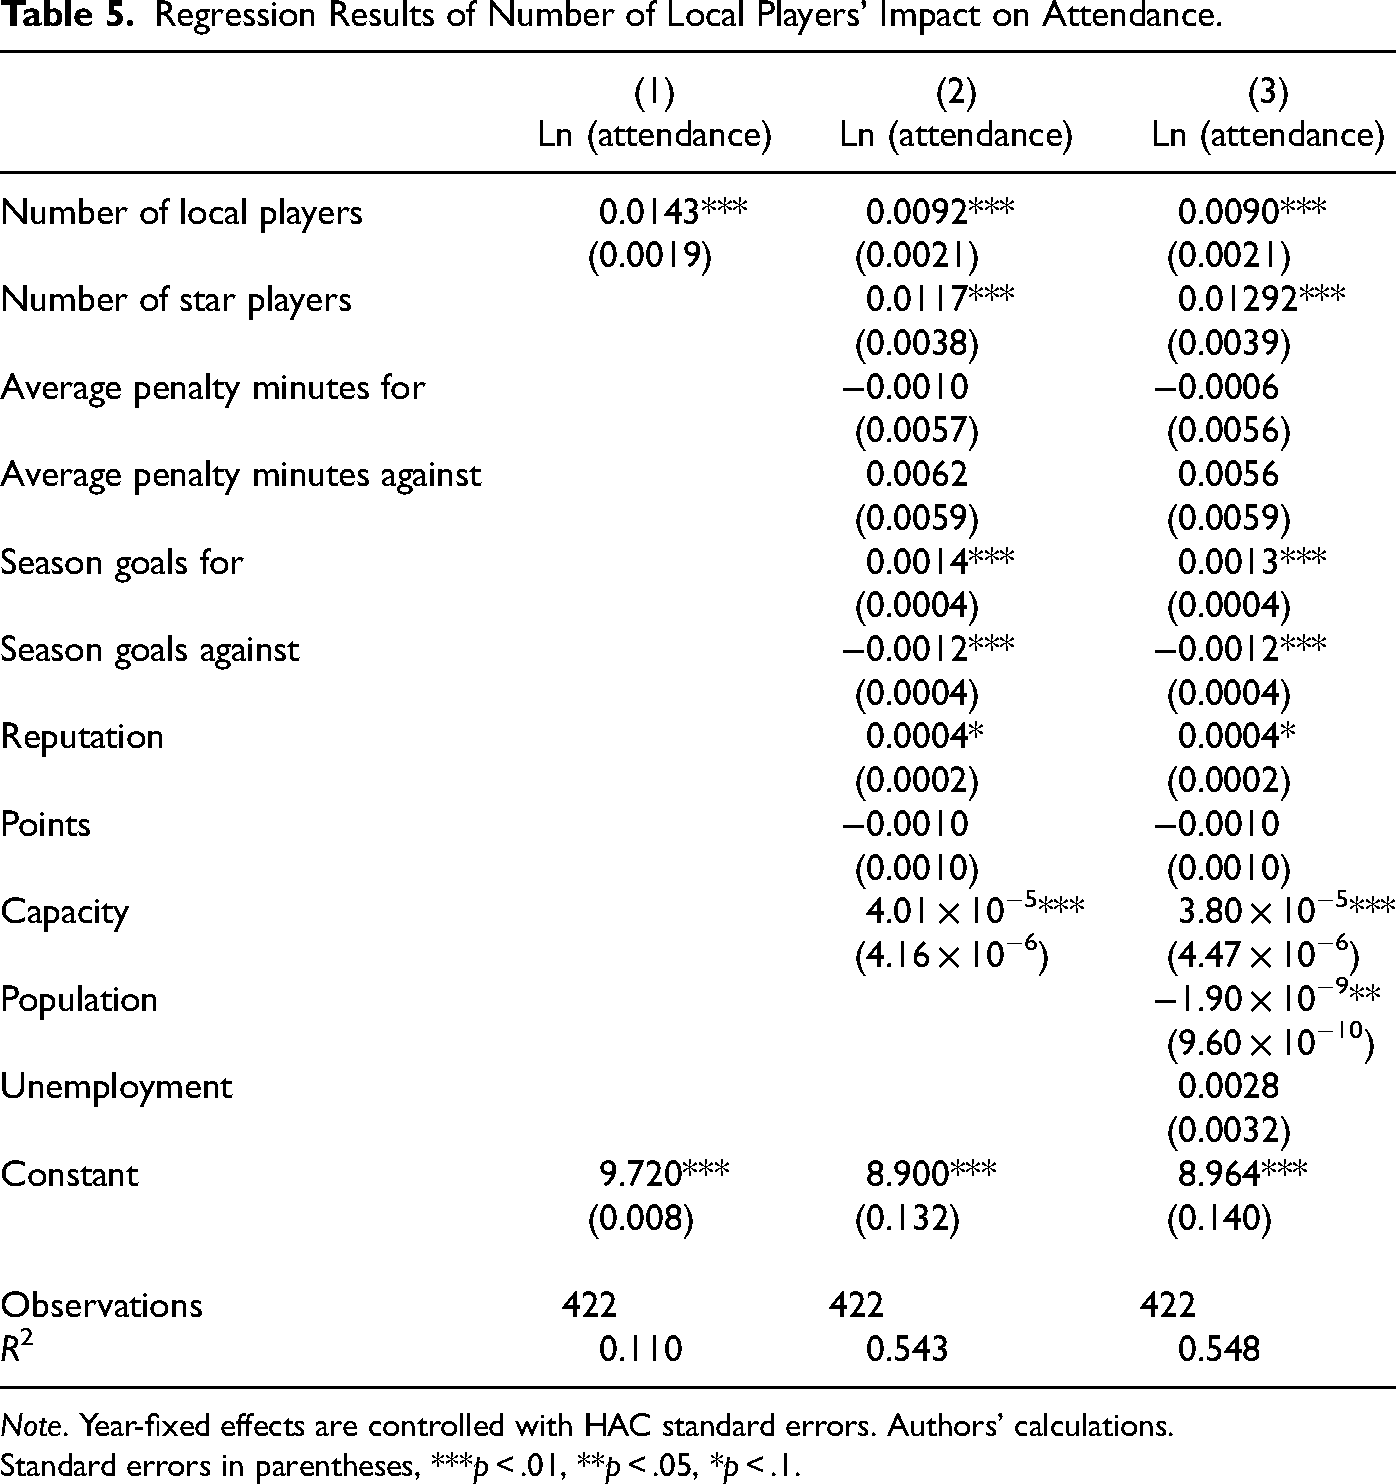
Note. Year-fixed effects are controlled with HAC standard errors. Authors’ calculations.
Standard errors in parentheses, ***p < .01, **p < .05, *p < .1.
Regression Results of Number of Local Players’ Impact on Revenue.
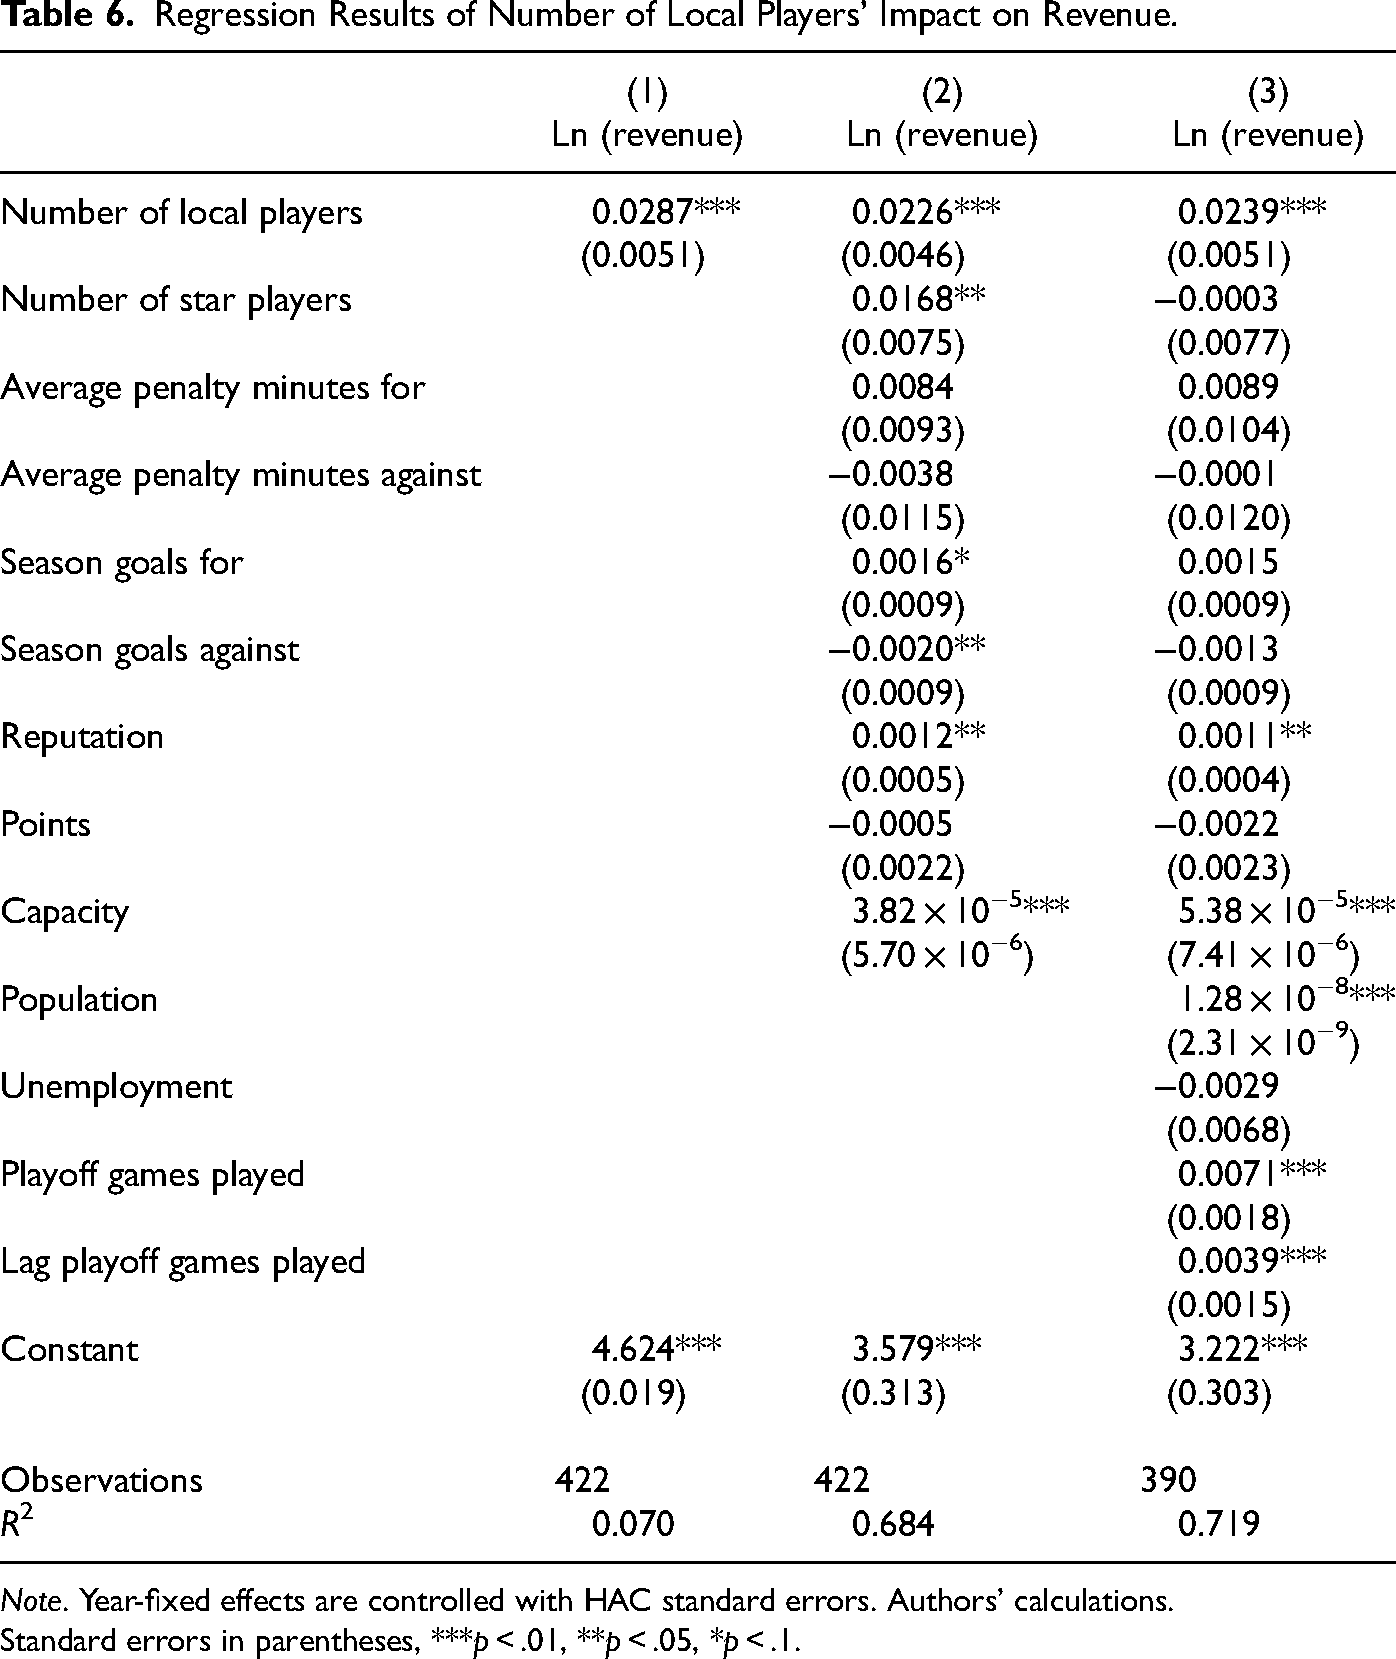
Note. Year-fixed effects are controlled with HAC standard errors. Authors’ calculations.
Standard errors in parentheses, ***p < .01, **p < .05, *p < .1.
In Table 5, the coefficient of “Number of Local Players” indicates a significant positive impact on game attendance. This finding aligns with the positive relationship observed between the total number of games played by local players and attendance. Specifically, each additional local player is associated with approximately a 0.9% increase in attendance. These results are consistent even after controlling for other factors such as star player presence, seasonal goals, and team reputation, which underscores the value of local players in strengthening community ties and enhancing demand for games. The “Number of Local Players” also demonstrates a strong and significant positive relationship with revenue. As shown in Table 6, each additional local player contributes to a 2.3% increase in revenue, highlighting the critical role in driving financial performance. With the average 2.1 local players in NHL, as presented in Table 1, the overall impact from local players increased the attendance by 1.89% and revenue by 4.83%, which are consistent but slightly larger than the impact from the total number of games played by local players presented in Tables 3 and 4.
Moreover, to capture the differential impacts of local player quality and varying lengths of “contribution” on the ice, we examined the impact of two additional measures of local players, “Total Games of Local Star Players” and “Total Games of Local Main Players” on arena attendance and revenues. As shown in Table A1, each additional new local player measures demonstrate both consistent positive impacts on attendance (0.01%‒0.02%) and revenue (0.05%‒0.08%). Notably, even if the magnitudes of these effects are slightly smaller, they closely align with our main results, further reinforcing the robustness of our findings.
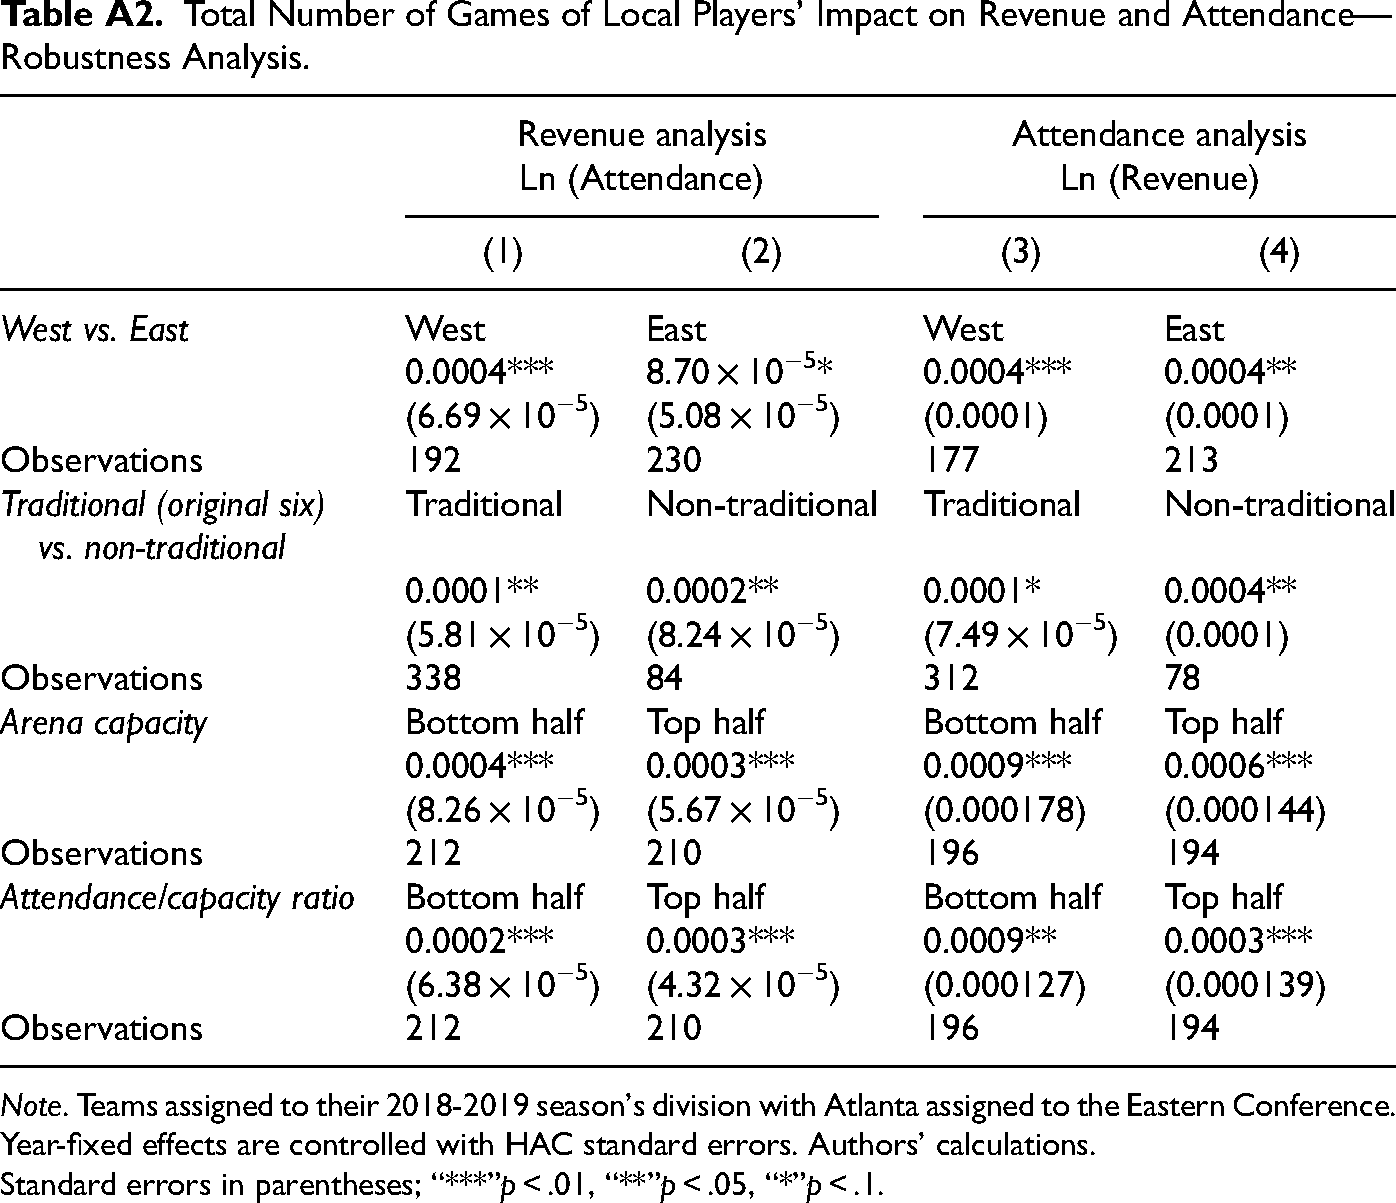
Regional Analysis Results
Last, we conducted a few sets of analysis across regions or by attendance level of teams to check the potential variations of the impact of our findings. As shown in the top two panels of Table A2, the impact of local players on attendance and revenue remains consistent across west and east teams, as well as the “Original Six” traditional teams and comparative newer non-traditional teams. 19 We also compared the potential different impact of locally born hockey players for teams with low and high attendances. As shown in Table A2, both sets of analyses provided positive relationship between locally born players and attendance (0.01%–0.04%). These findings demonstrate that the impact of locally born players remains robust regardless of a team's arena capacity ranking or attendance-to-capacity ratio. For revenue, we observed a slightly larger (0.09% vs. 0.03%–0.06%) impact of locally born players for teams in the bottom half of arena capacity and attendance-to-capacity ratio compared to those in the top half. This suggests that financially, the benefits of local players are particularly pronounced for teams with lower attendance metrics.
Discussion and Conclusion
This paper provides compelling evidence of the significant positive impact of local players on both attendance and revenue in the NHL. By refining the definition of local players and analyzing comprehensive data spanning multiple seasons, we demonstrate that locally born players significantly enhance fan engagement and team financial performance. Locally born players act as community representatives and “heroes,” fostering deeper connections and pride among fans (Decrop & Derbaix, 2010). This emotional attachment translates into increased attendance and revenue, underscoring the relationship between local identity and sports success.
Our findings carry substantial practical implications for NHL franchises seeking to boost revenue, particularly in a league, where improving on-ice performance can be challenging. Incorporating local players into team rosters and leveraging their community ties can attract and retain fans. For instance, the Seattle Kraken's potential selection of TJ Oshie during the expansion draft highlighted the clear appeal of local talent and its potential to drive attendance and revenue. 20 Similarly, grassroots initiatives like the Montreal Canadiens Children's Foundation, which promotes physical activity through community programs such as building outdoor rinks, can enhance fan engagement while fostering long-term financial success. 21 The results also indicate a slightly larger impact of locally born players for teams with comparative lower attendance. This suggests that, financially, the benefits of local players are particularly pronounced for teams with lower attendance metrics.
A potential limitation is that a player's birthplace does not necessarily indicate where they were born or raised, as many players make their names in towns other than where they were born. Nonetheless, birthplace continues to serve as a meaningful marker of regional identity, prominently displayed in NHL player profiles. The NHL uniquely emphasizes birthplace in its rosters compared to other leagues such as the NBA or NFL, where players typically follow an National Collegiate Athletics Association (NCAA) pathway. This distinction suggests that birthplace resonates with fans, connecting them to players through shared regional ties. A prominent example is John Tavares, whose hometown connection to Toronto remains a significant draw for Maple Leafs fans despite starting his career with another team in 2018. 22 Another example is Minnesota Wild's experience in 2012. After signing Zach Parise, a Minnesota native, and Ryan Suter, the team sold over 1,500 season tickets within days, signaling a shift in fan enthusiasm for local talent. 23 These examples underscore the enduring relevance birthplace-based identity in driving fan engagement. Incorporating time-on-ice data could provide a more nuanced analysis and may be considered in future research on individual player contributions on team performance if comprehensive data becomes available.
While existing studies support the enduring influence of athletic identity, where an athlete's role becomes integrated into their self-concept and remains stable over time, even after retirement (Haslam et al., 2024). This identity, shaped by personal experiences and cultural environments, influences athletes’ development and their connection with communities. Our findings align with broader literature in sports marketing and sociology, emphasizing shared geographic tired as a driver of fan loyalty (Da Silva & Las Casas, 2017; Guschwan, 2018). Despite the limitations of birthplace as a sole marker of identity, its consistent use in marketing and fan engagement strategies highlights its practical value.
This study contributes to the broader understanding of sports economics and consumer behavior. The emphasis on local identity extends beyond hockey, offering potential applications in other professional leagues and sporting contexts. It also adds to the growing body of evidence on the intersection of race, identity, and sport. Future research could extend these findings by examining individual game data or exploring players’ identities beyond birthplace, such as their collegiate careers in the NCAA. These extensions could offer additional insights into the dynamics of local identity and fan engagement across different sports.
Footnotes
Acknowledgments
The authors would like to thank Wei Dai, Julien Picault, Andrea Craig, John Janmaat, Kit Pasula, and Rallye Shen for helpful comments and suggestions. They also thank seminar audiences at UBC Okanagan Economics seminar. Min Hu acknowledges funding for this research provided by the University of British Columbia Startup Funding. All errors are our own.
Declaration of Conflicting Interests
The authors declared no potential conflicts of interest with respect to the research, authorship, and/or publication of this article.
Funding
The authors disclosed receipt of the following financial support for the research, authorship, and/or publication of this article: This work was supported by the University of British Columbia (grant number Startup Grant).
Notes
Author Biographies
Appendix
Total Number of Games of Local Players’ Impact on Revenue and Attendance—Robustness Analysis.
| Revenue analysis |
Attendance analysis |
|||
|---|---|---|---|---|
| (1) | (2) | (3) | (4) | |
| West vs. East | West | East | West | East |
| 0.0004*** | 8.70 × 10⁻⁵* | 0.0004*** | 0.0004** | |
| (6.69 × 10⁻⁵) | (5.08 × 10⁻⁵) | (0.0001) | (0.0001) | |
| Observations | 192 | 230 | 177 | 213 |
| Traditional (original six) vs. non-traditional | Traditional | Non-traditional | Traditional | Non-traditional |
| 0.0001** | 0.0002** | 0.0001* | 0.0004** | |
| (5.81 × 10⁻⁵) | (8.24 × 10⁻⁵) | (7.49 × 10⁻⁵) | (0.0001) | |
| Observations | 338 | 84 | 312 | 78 |
| Arena capacity | Bottom half | Top half | Bottom half | Top half |
| 0.0004*** | 0.0003*** | 0.0009*** | 0.0006*** | |
| (8.26 × 10⁻⁵) | (5.67 × 10⁻⁵) | (0.000178) | (0.000144) | |
| Observations | 212 | 210 | 196 | 194 |
| Attendance/capacity ratio | Bottom half | Top half | Bottom half | Top half |
| 0.0002*** | 0.0003*** | 0.0009** | 0.0003*** | |
| (6.38 × 10⁻⁵) | (4.32 × 10⁻⁵) | (0.000127) | (0.000139) | |
| Observations | 212 | 210 | 196 | 194 |
Note. Teams assigned to their 2018-2019 season's division with Atlanta assigned to the Eastern Conference. Year-fixed effects are controlled with HAC standard errors. Authors’ calculations.
Standard errors in parentheses; “***”p < .01, “**”p < .05, “*”p < .1.