
Abstract
Previous literature leaves the impression that betting market inefficiencies are widespread. However, most studies rely upon limited data and ignore biases’ persistence. Our simulation-based analyses show (1) the impact of low sample sizes on the chance to detect markets that only appear to be efficient and (2) the frequency of observing inefficient periods within fully efficient markets. Afterwards, we (3) empirically analyze real-world football betting markets for 14 consecutive seasons. While inefficiencies occur in singular seasons, they are not persistent or systematic across leagues. Moreover, our simulation-based analyses suggest that statistically significant effects in single seasons are likely to be observed even under full market efficiency.
Introduction
The introduction of online betting enabled bettors to put their money with bookmakers outside their local market, as they can easily compare odds online at low search costs. In 2021, the European Gaming and Betting Association reported more than 40 billion euros in turnover from legal sports betting in Europe alone, underlying the economic relevance of sports betting markets. Because of increased competition in online markets, bookmakers had to improve their forecast precision (Anguita et al., 2017; Che et al., 2017; Forrest et al., 2005; Gomez-Gonzalez & del Corral, 2018; Štrumbelj & Šikonja, 2010), while bookmakers’ margins decreased.
Bookmakers can secure profitability by balancing their books. Such balancing requires stakes on both sides to be leveled in a way that the bookmakers’ profit is independent of the actual game outcome, which again requires very precise odds setting. Bookmakers have to be excellent predictors of game outcomes and contain all information available into the odds to be efficient (Fama, 1970). Accordingly, no systematic strategies should allow bettors to generate profits (Thaler & Ziemba, 1988). Sauer (1998) analyses the efficiency of sports betting markets and their relationship to other financial markets, coming to a mixed conclusion. In addition, the growth of betting markets during recent years opens the question of whether today’s markets are as efficient as expected by theory.
Research on betting market (in)efficiency follows the concept of testing relatively simple strategies towards profits, such as systematically betting on (for example) home teams, underdogs, or teams with a higher sentiment. Here, the favorite-longshot bias (FLB) reflects the tendency of bettors to overvalue underdogs and undervalue favorites, potentially due to risk preference (Snowberg & Wolfers, 2010). Bookmakers could take advantage and deviate the actual betting odds away from the fair odds by offering lower returns on underdogs and higher returns on favorites. If such deviation is large enough, bettors could generate positive returns on investment (ROI) by simply betting on favorites. Several studies provided evidence of the FLB in European football (see e.g., Angelini & De Angelis, 2019; Direr, 2011; Rossi, 2011; Vlastakis et al., 2009). The reverse FLB inversely suggests undervalued underdogs and positive returns when betting on them. Such reverse FLB was found by, for example, Deschamps & Gergaud (2007). Others do not find evidence for this bias, for example, Elaad et al. (2020).
While the game’s location can be advantageous to the team playing at home, it can also decide which team is declared the favorite. The home bias refers to increased (lowered) payouts for the home (away) team compared to the fair odds. If the bias is large enough, a profitable strategy would suggest to bet on the home team systematically. Evidence on biased betting odds towards home teams has been provided by, for example, Angelini & De Angelis (2017), Vlastakis et al. (2009), and Forrest & Simmons (2008). The study by Meier et al. (2021) finds no such effect. When biased odds result from bettors’ sentiment, it is referred to as sentiment bias in the literature. Here, betting odds are biased towards the more popular teams, resulting in positive returns when betting on them. Studies that provide evidence for the sentiment bias include Forrest & Simmons (2008), Braun & Kvasnicka (2013). On the contrary, Deutscher et al. (2018) and Flepp et al. (2016) do not find support for a sentiment bias. More recent evidence on the subject is missing and given in the following analysis.
Table 1 provides an overview of studies in the field, with focus on the pre-COVID-19 period. It identifies the researched biases and individual results. Since we argue that the length of the observation period is crucial in determining biases, it is documented for each study. While covering extended periods, it is essential to note that many studies select sub-samples of games (e.g., only heavy favorites) and report biases for such restricted data sets. Recent literature captures ghost games during COVID-19 and the impact of empty stadiums on performance by players and referees. With the initially vanishing home advantage during COVID-19, the research covers betting markets’ (non)response to such changes. Papers by (Fischer & Haucap, 2022; Meier et al., 2021; Winkelmann et al., 2021) record temporal inefficiencies in betting markets as bookmakers did not adjust the winning chances by home teams accordingly.
Overview of Studies covering Pregame Betting Market Inefficiencies.
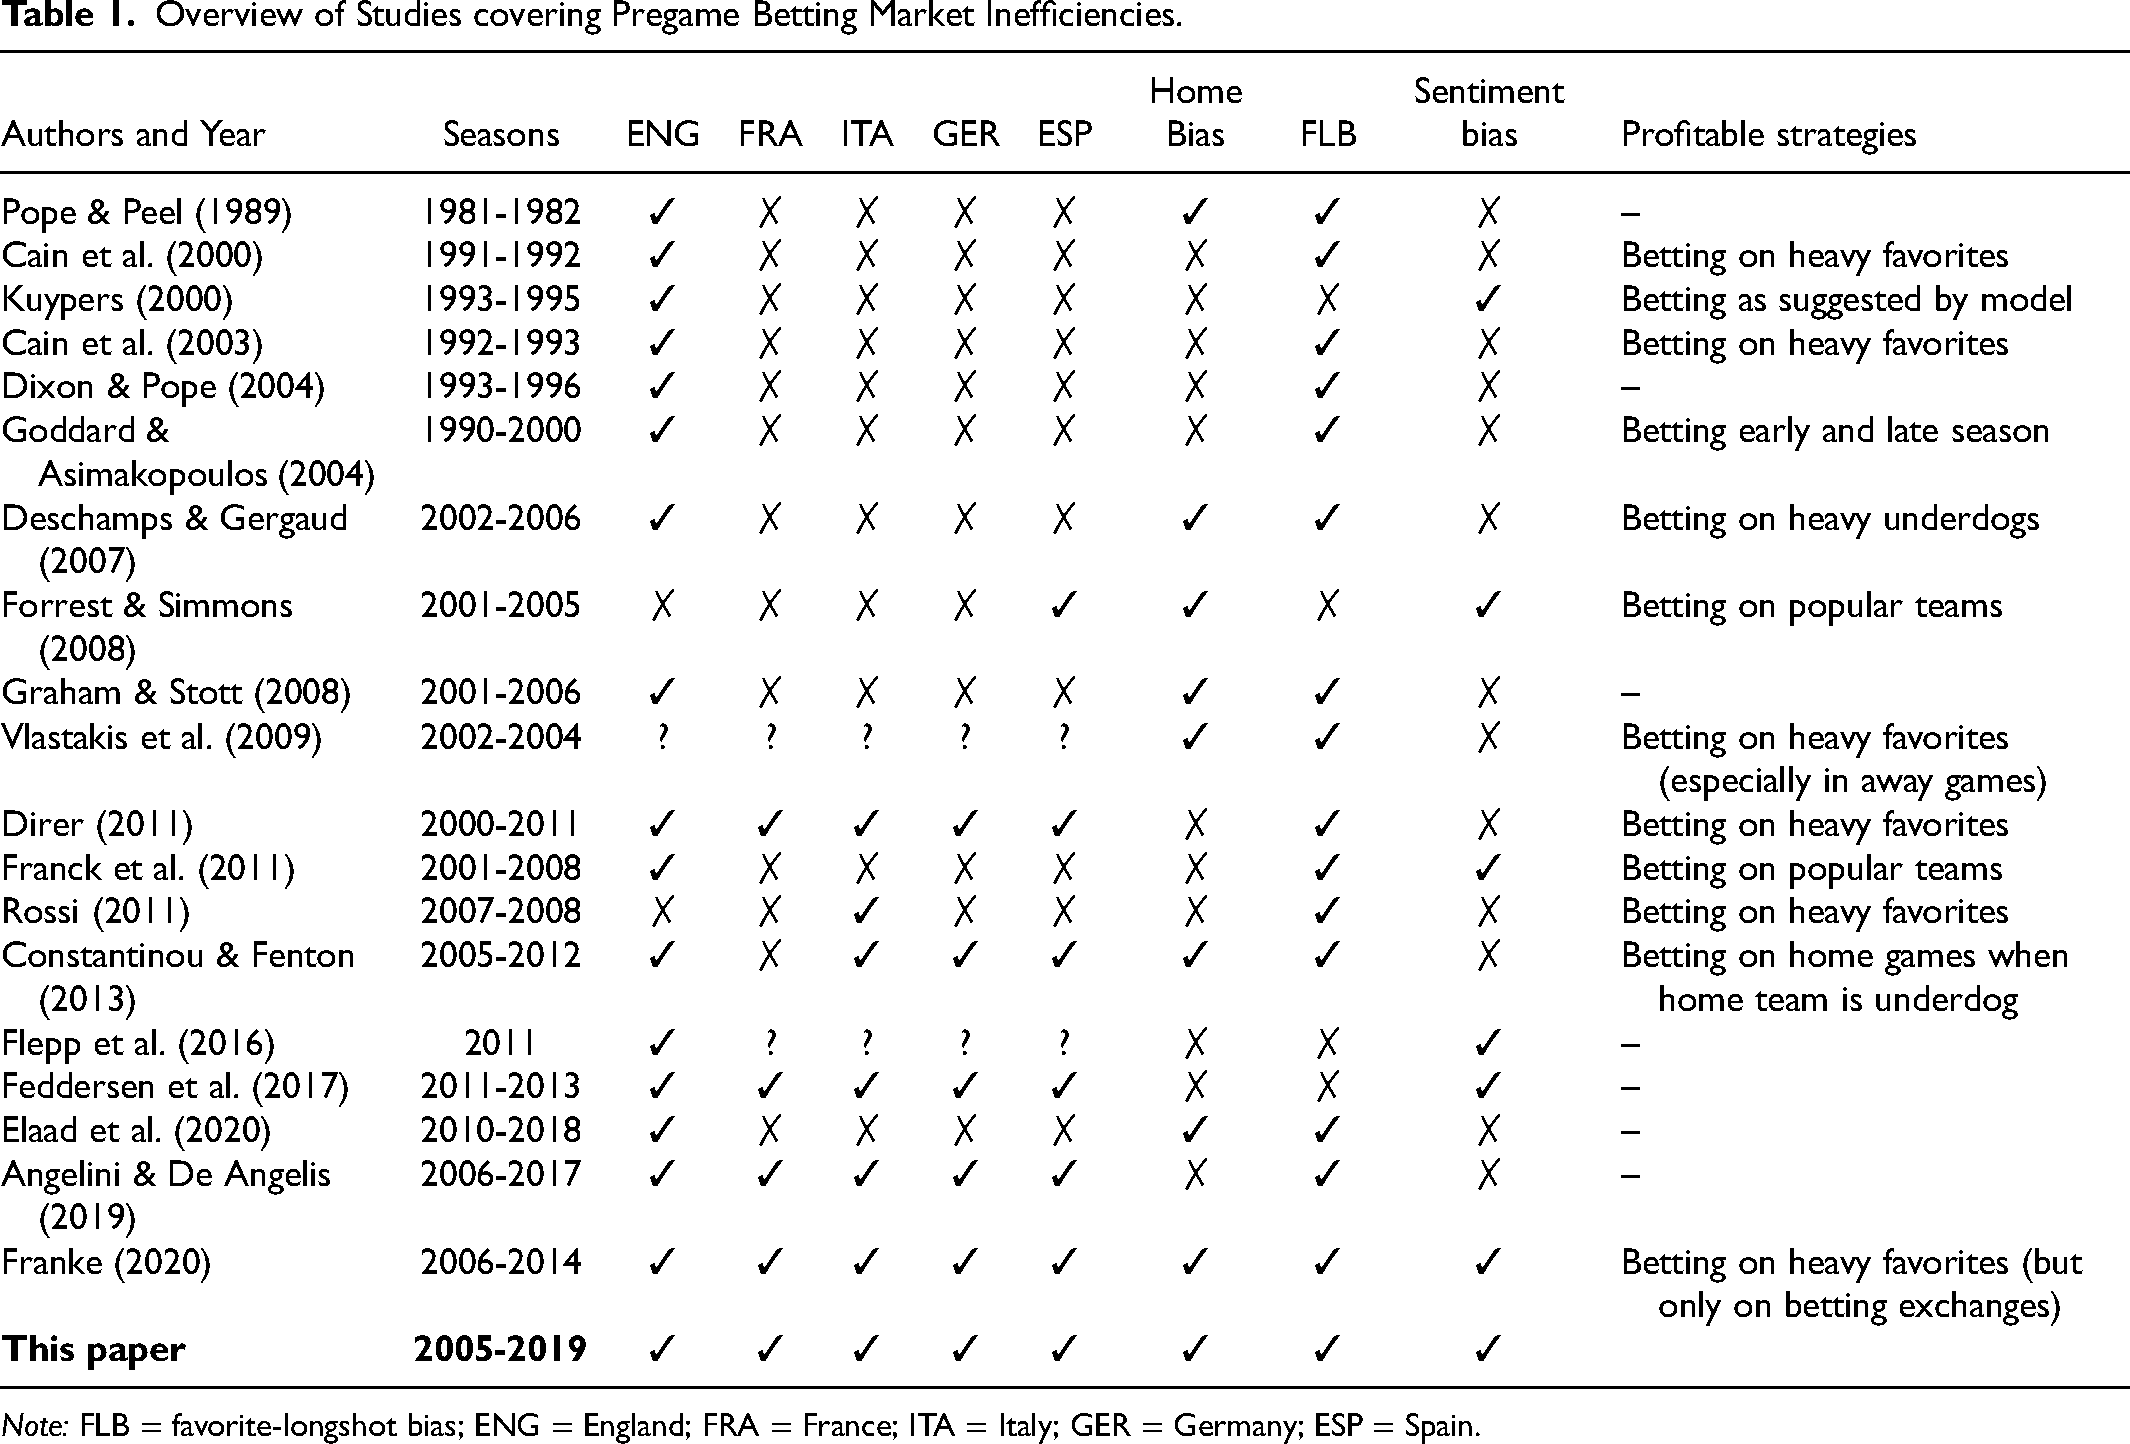
Note: FLB = favorite-longshot bias; ENG = England; FRA = France; ITA = Italy; GER = Germany; ESP = Spain.
Previous studies on betting market inefficiencies in pre-game betting relied on one or multiple season(s) of data, while many uncovered inefficient odds for different leagues and periods. Since most studies cover only snapshots of relatively short periods, thus relying on fairly small number of observations, the power of hypothesis tests is potentially limited. Therefore, findings uncovering short periods of inefficiencies may simply be driven by statistical noise. Hence, it remains to be investigated whether market inefficiencies are systematic and persistent over longer time periods or whether their appearance is of temporary and random nature. One could further make a case that inefficiencies get reported and published more often than analyses that find markets to be efficient (as expected by theory). Such mechanism, that is, a higher barrier to publication for studies that produce null results, is observed in different fields and labeled as publication bias (Franco et al., 2014). In our case, this would translate into the less interesting case of efficient betting markets being under-reported by the literature.
This article addresses whether inefficient periods in betting markets, as uncovered by previous literature, occur persistently over time and systematically across leagues. Therefore, we first introduce our data, covering 14 seasons from 2005-2006 to 2018-2019 for the five major European football leagues, namely the English Premier League, the French Ligue 1, the German Bundesliga, the Italian Serie A, and the Spanish La Liga, as well as our methodological approach for the analysis of betting market inefficiencies in the “Method and Data” section. The “Simulation-Based Analysis of Betting Markets” section covers a simulation-based analysis of betting markets, deriving the probability of detecting periods of inefficiencies in several theoretical settings. Afterwards, in the “Real-World Betting Markets” section, we empirically analyze the data set detailed in the “Method and Data” section towards the various biases introduced before to indicate if biases persist long-term or appear and vanish randomly. This allows us to contribute to the literature by explicitly discussing the occurrence of betting market inefficiencies in the light of simulation-based analyses, that is, we investigate whether the number of inefficient periods uncovered by the literature exceeds what would be expected by chance only.
Method and Data
To provide a comprehensive long-term analysis, we draw on data from www.football-data.co.uk, which cover all matches of the men’s first football divisions in England (Premier League), France (Ligue 1), Germany (Bundesliga), Italy (Serie A), and Spain (La Liga) from season 2005-2006 to 2018-2019, totaling 25,564 matches. Although information for more recent seasons is available, studies have shown that betting markets had to deal with the impact of COVID-19 on, for example, home advantage (Reade et al., 2022) from the season 2019-2020 onward.
Our data detail the actual result and the pregame betting odds for all potential outcomes (home win, draw, and away win) of each match. As betting odds from various bookmakers are reported in our data, we consider the average betting odds across all bookmakers that provide information. Such (average) betting odds are calculated using, on average, 42 individual bookmaker odds - this value varies only slightly across leagues and seasons. The pairwise correlation in our sample (across all leagues) between betting odds offered by different bookmakers on the same game outcome is fairly high, with at least 0.96 for home wins and 0.95 for away wins.
Descriptive Statistics
For each match, we restrict our analysis to bets on the home and the away team, as odds for draws do not vary much in football (Pope & Peel, 1989). As we analyze matches from the perspective of both teams, each match generates two rows in our data. This accumulates to 51,128 observations across all leagues and seasons considered. Based on bookmakers’ odds, Implied Probabilities 
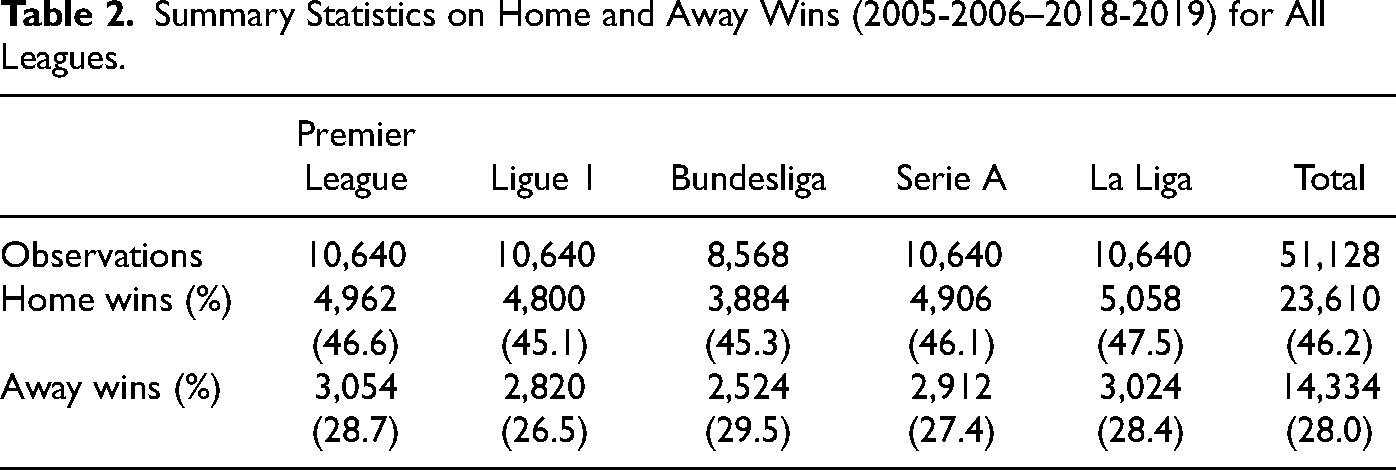
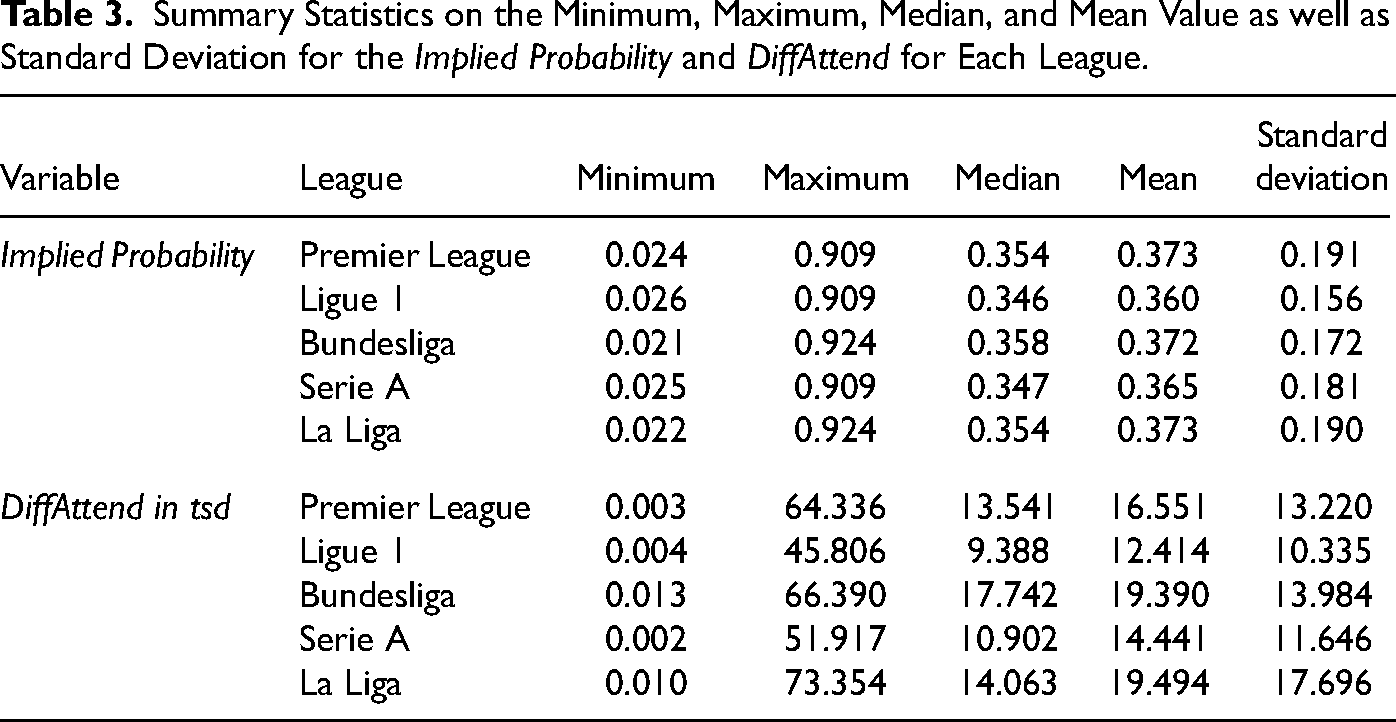
Figure 1 (left panel) shows the boxplots of the Implied Probabilities for home and away wins, which indicate higher implied probabilities for home than for away teams. This is in-line with the home field advantage as we find home teams to win about half of the matches (46.2%), whereas away teams win only one in every four matches (28.0%, see Table 2). The distribution of implied probabilities fluctuates only slightly across leagues (see Table 3). As bookmakers have to adequately incorporate the home advantage into their odds, misjudgements could open the opportunity for bettors to generate positive returns when betting on (or against) home teams. To account for a possible home bias by bookmakers, we introduce the covariate Home, taking value one for bets on the home team.
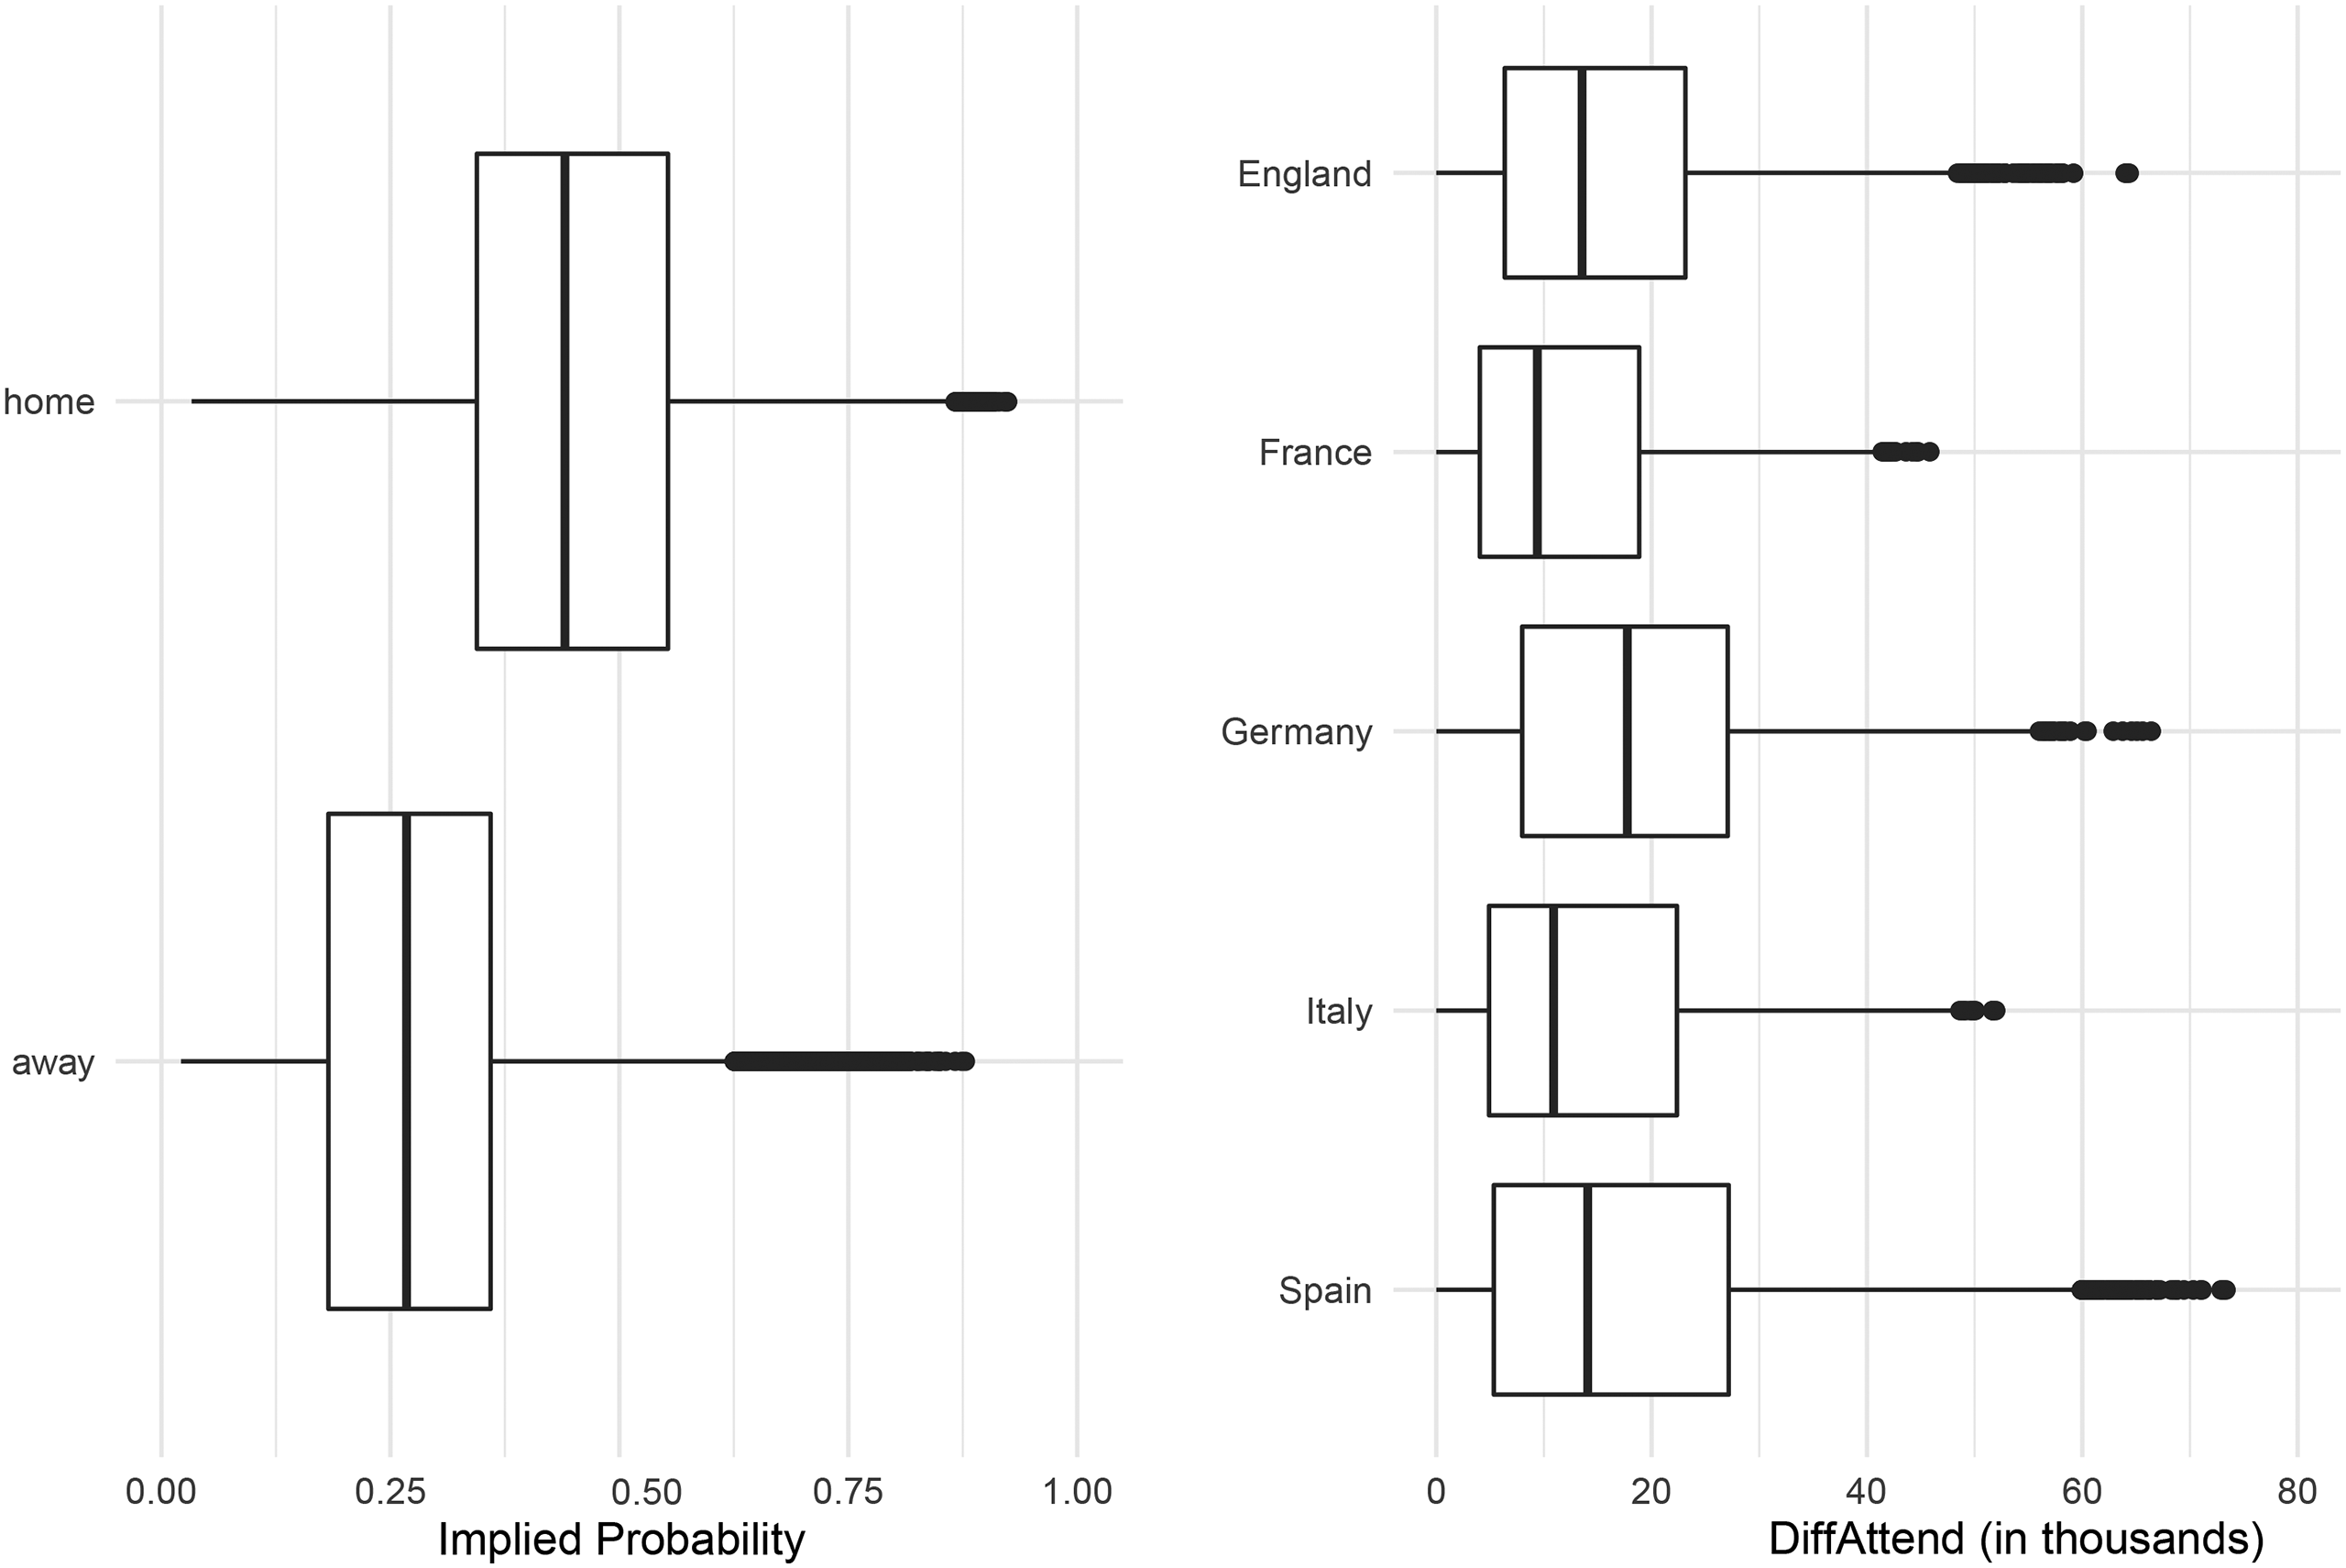
The boxplots on the implied probabilities (left panel) and boxplots on the differences in the attendance across leagues (right panel).
Summary Statistics on Home and Away Wins (2005-2006–2018-2019) for All Leagues.
Summary Statistics on the Minimum, Maximum, Median, and Mean Value as well as Standard Deviation for the Implied Probability and DiffAttend for Each League.
As some studies mentioned above provide evidence for a sentiment bias, we consider the difference in mean attendance between the two opponents in the corresponding season as a proxy for the sentiment. While previous literature often refers to the attendance within the previous seasons, we consider data of the current season. Even if this value becomes known only at the end of the season, we assume that the difference in the mean attendance of the corresponding season is reasonable. Using previous season data would pose the question of how to deal with promoted teams. Promoted teams actually enjoy a strong increase in attendance, while attendance across years in the same division is quite stable. We find a correlation in the mean attendance of nonpromoted teams between two consecutive seasons of 0.979 over all leagues and seasons. While nowadays more adequate proxies of a team’s sentiment exist, such as the number of followers on Twitter, we consider the difference in mean attendance as earlier data on Twitter followers is unavailable - in fact, in our first year of observation in 2005, most social networks did not even exist. 1
Given two observations per match (one for the home and one for the away team), the distribution of DiffAttend is symmetric around zero. Figure 1 (right panel) shows the boxplots for sentiment covariate from the perspective of the team with higher attendance for all leagues. The leagues considered can be broadly categorized into two groups. Whereas for La Liga, the Premier League, and the Bundesliga, the median absolute difference in attendance is around 15,000 and the maximum difference is above 60,000, for Ligue 1 and Serie A the median absolute difference is around 10,000 and the maximum is around 50,000. In addition, the distribution of DiffAttend is right skewed for all leagues (see Table 3).
There is a strong correlation between the Implied Probability and the Home variable of 0.452 as well as between the Implied Probability and DiffAttend of 0.639. Such correlations indicate that home teams and teams with large fan bases are often declared to be the favorite by the bookmaker. Hence, there potentially is an overlap between the home bias, the sentiment bias and the FLB.
Market Development During the Observation Period
As argued in the ‘‘Introduction” section (and as shown by Anguita et al., 2017; Che et al., 2017; Gomez-Gonzalez & del Corral, 2018), bookmakers’ margins decreased over time. Figure 2 (left panel) shows the average margins calculated as
Increased competition between bookmakers should have improved their predicting performance over time. We investigate this assumption by considering the Brier score (Brier, 1950), which is given as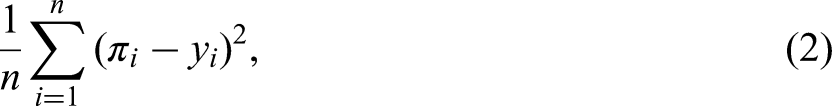
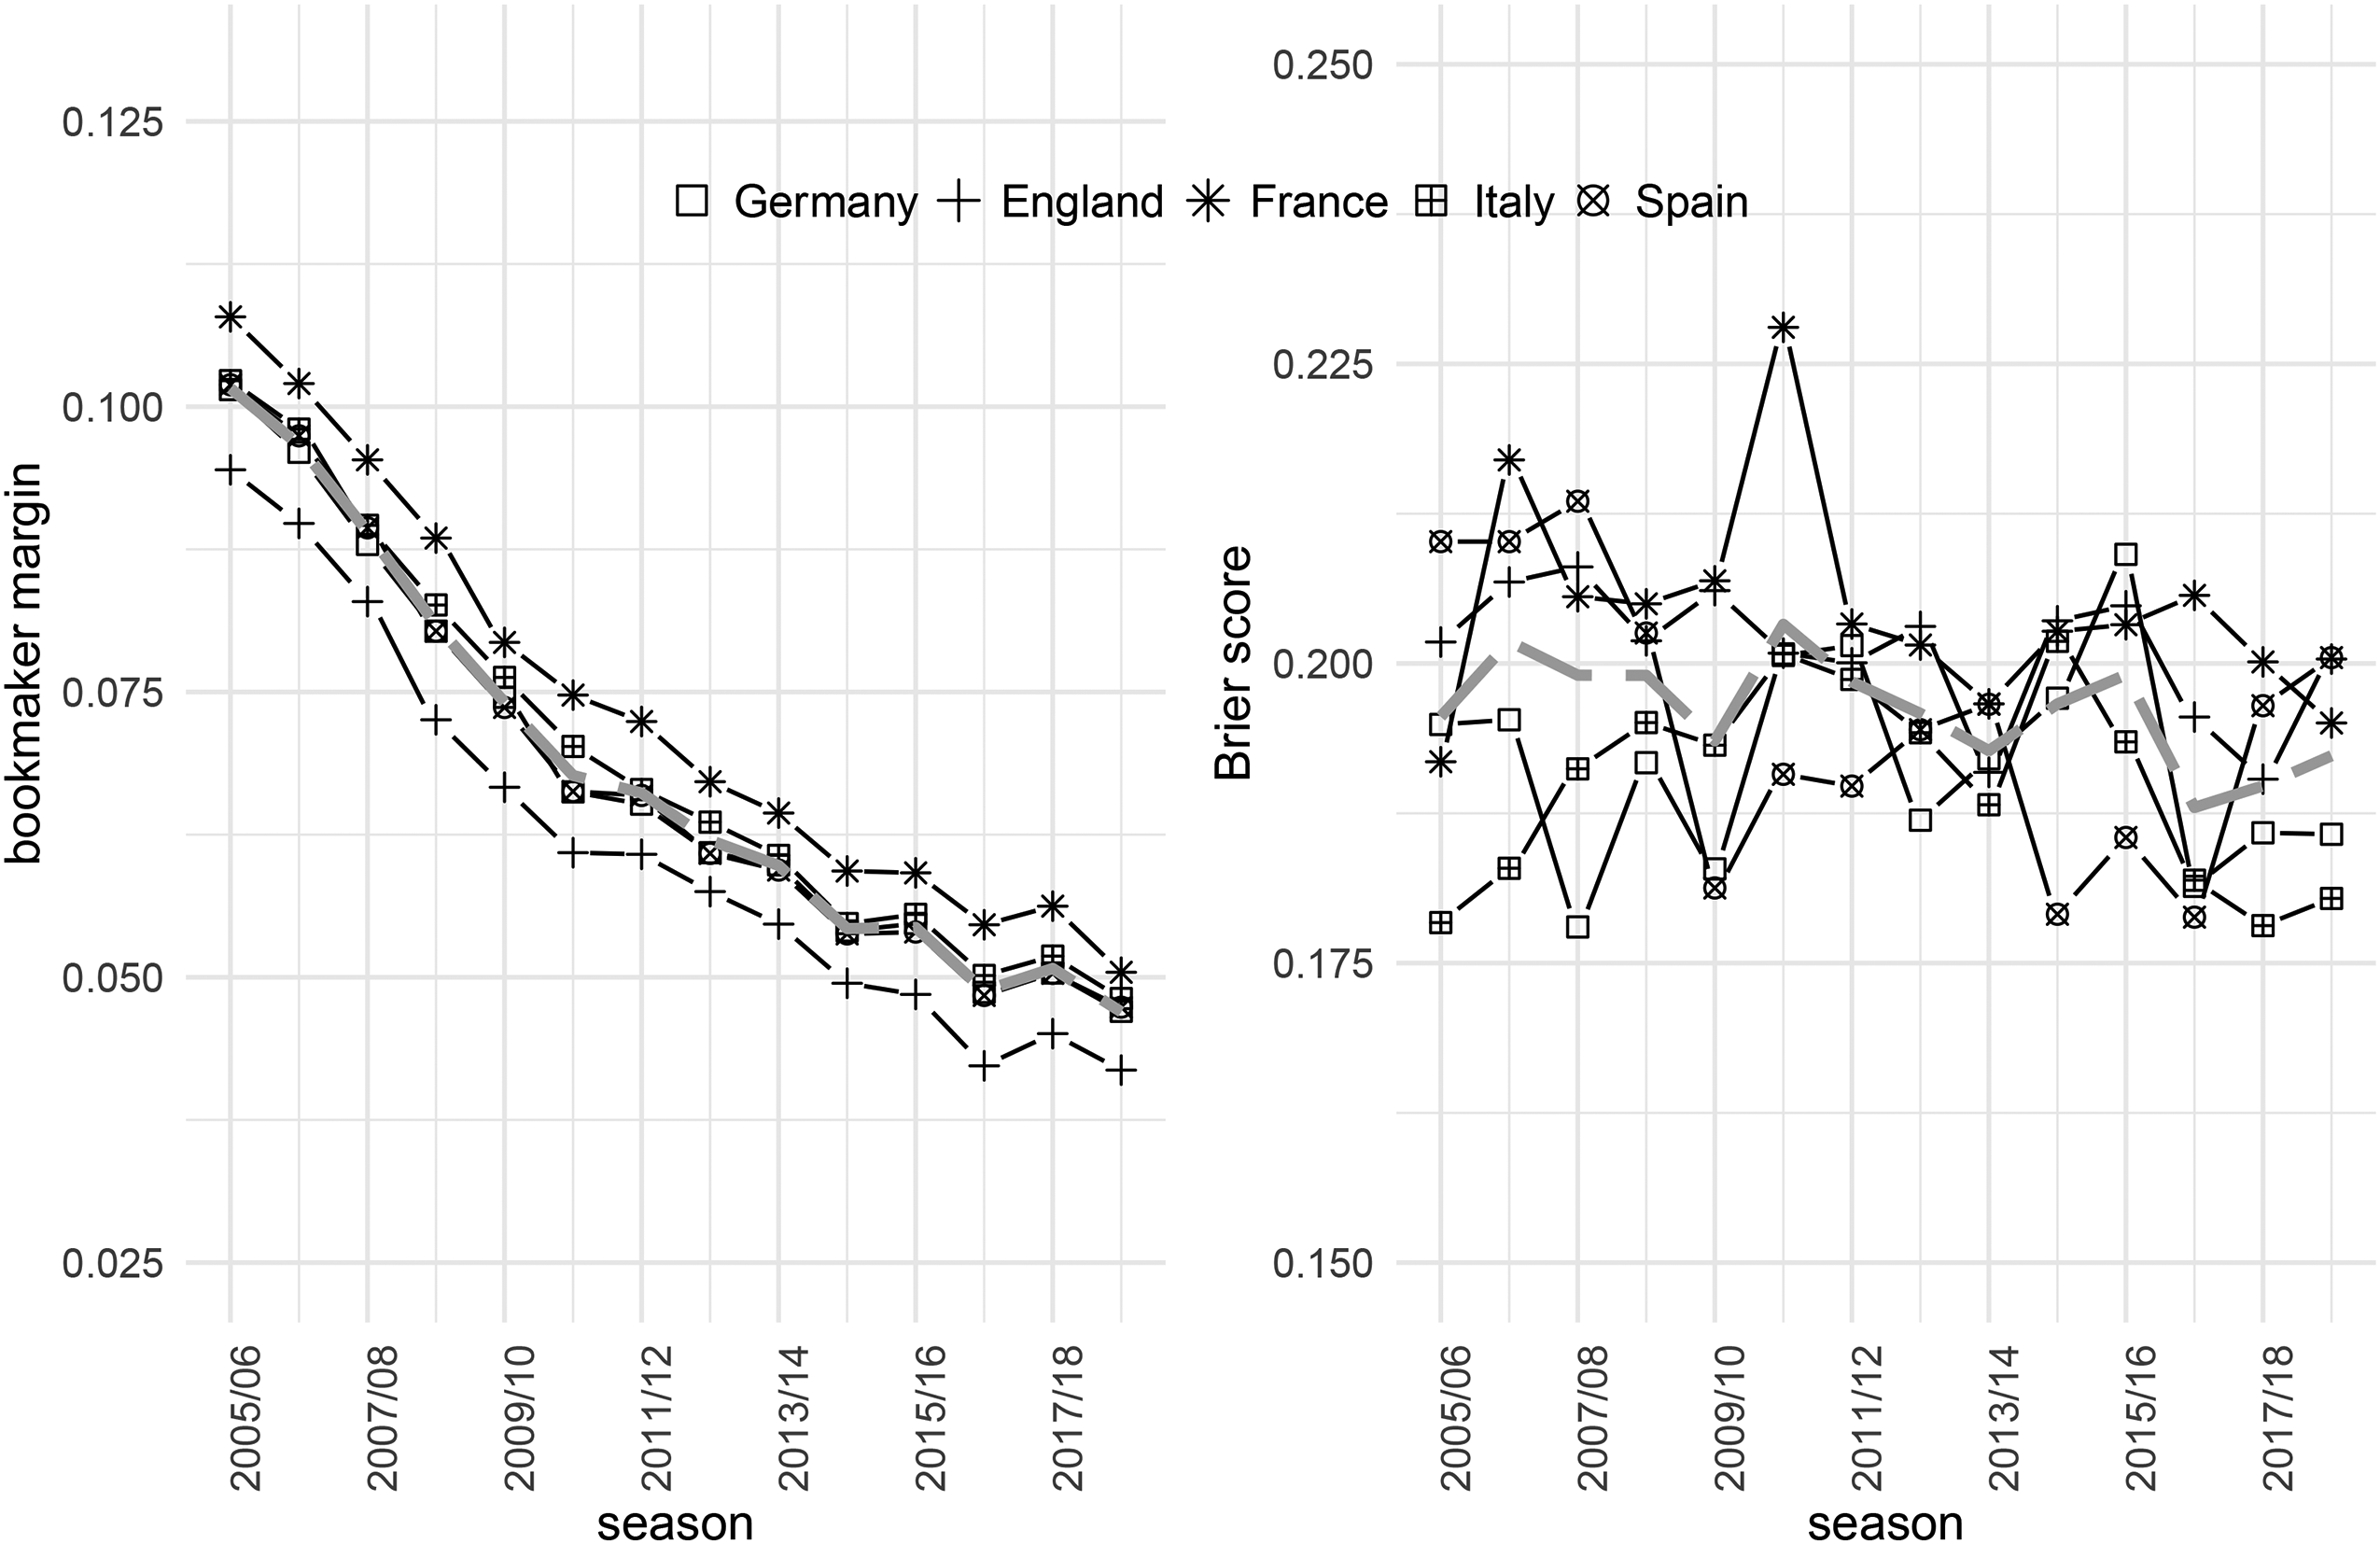
Bookmakers’ margins and Brier scores during the seasons observed (2005/2006-2018/2019). Symbols indicate different leagues, and the gray dashed lines show the average over all leagues.
Indicated by the gray dashed line, Brier scores across all leagues improved only slightly over time. Comparing both panels in Figure 2, relatively high (low) Brier scores co-occur with high (low) margins, for example, for Ligue 1 in 2010-2011. Jumps in the Brier score are observable in all leagues considered, indicating that the predictive power of bookmakers’ odds varies considerably between seasons. This, in turn, opens opportunities for profitable strategies at times when the predictive power of betting odds is rather low. It becomes even more relevant for recent seasons, as the margins decrease faster over time than the Brier scores (see both panels of Figure 2). 2
Modeling Betting Market Inefficiencies
To detect betting market inefficiencies, we use a logit regression model where the response variable
The Implied Probability allows deriving insights into the FLB. Specifically, it enables a comparison between the implied probability given by the bookmaker and the expected winning probability under our fitted model to reveal a potential FLB. To distinguish between potential biases described in the ‘‘Introduction” section, we further include a dummy variable indicating bets on home teams (Home) to account for a potential home bias. Bettors’ sentiment is proxied by the covariate DiffAttend.
The linear predictor including the covariates introduced above is thus given by
Simulation-Based Analysis of Betting Markets
This section deals with analyses on detecting betting market inefficiencies using Monte Carlo simulation. It investigates how well the logit regression model specified above can detect betting market inefficiencies as we generate artificial data which exhibit biases and fit our model to such simulated data sets. We aim to investigate Type I and Type II errors when analyzing betting market inefficiencies. In particular, we analyze the frequency of mistakenly detecting biases in fully efficient markets and the power of tests as betting market analyses in the past often neglected problems of small samples or reporting of significant biases for rather efficient markets.
First, we consider a data-generating process with a home bias, that is, we modify the underlying probabilities for each outcome (home win, draw, and away win). We randomly generate match outcomes according to these underlying true probabilities for the simulation runs. Next, we fit logit regression models (as introduced above) to each of the artificial samples, which allows us to estimate the probability of reporting a statistically significant home bias depending on the magnitude of the underlying induced bias.
We consider different magnitudes of that bias while also varying the number of seasons (observations). This provides insights into how the sample size affects our results. We additionally discuss the risk of mistakenly reporting inefficiencies due to statistical noise by analyzing the case of fully efficient betting markets, that is, situations where the true probabilities are equal to those implied by the bookmakers. Furthermore, we run a season-by-season analysis of fully efficient markets to estimate the probability of detecting biases due to multiple testing.
Finally, we extend our analysis to the other two most prominent biases investigated in the literature and introduced above, namely the sentiment bias (“Sentiment Bias” section) and the FLB (“Favorite-Longshot Bias” section). Our results from the simulation-based analyses form the basis for discussing the findings on real-world betting markets in the following section in the perspective of what would be expected by chance only.
Simulation Set Up
To ensure a reasonable distribution of winning probabilities in the betting market, our analysis is based on the actual Premier League betting data of all 5,320 matches between seasons 2005-2006 and 2018-2019. We calculate underlying true probabilities
Home Bias
For the first set of experiments, we consider the home bias. As it is assumed that a positive home bias increases the probabilities for home wins and decreases the probabilities for away wins, we set adjusted probabilities 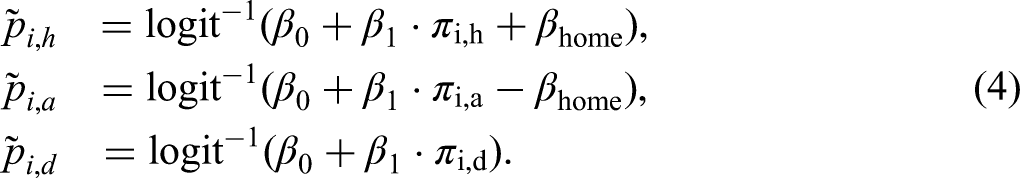
According to previous literature (Forrest & Simmons, 2008; Winkelmann et al., 2021; and as also verified later in the “Real-World Betting Markets” section), we select 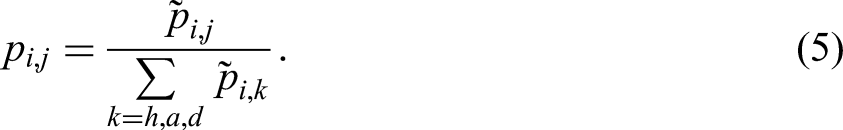
We finally fit the following logit regression model to the simulated data:
Repeating this simulation 10,000 times, Table 4 displays the results on the estimation of the parameter
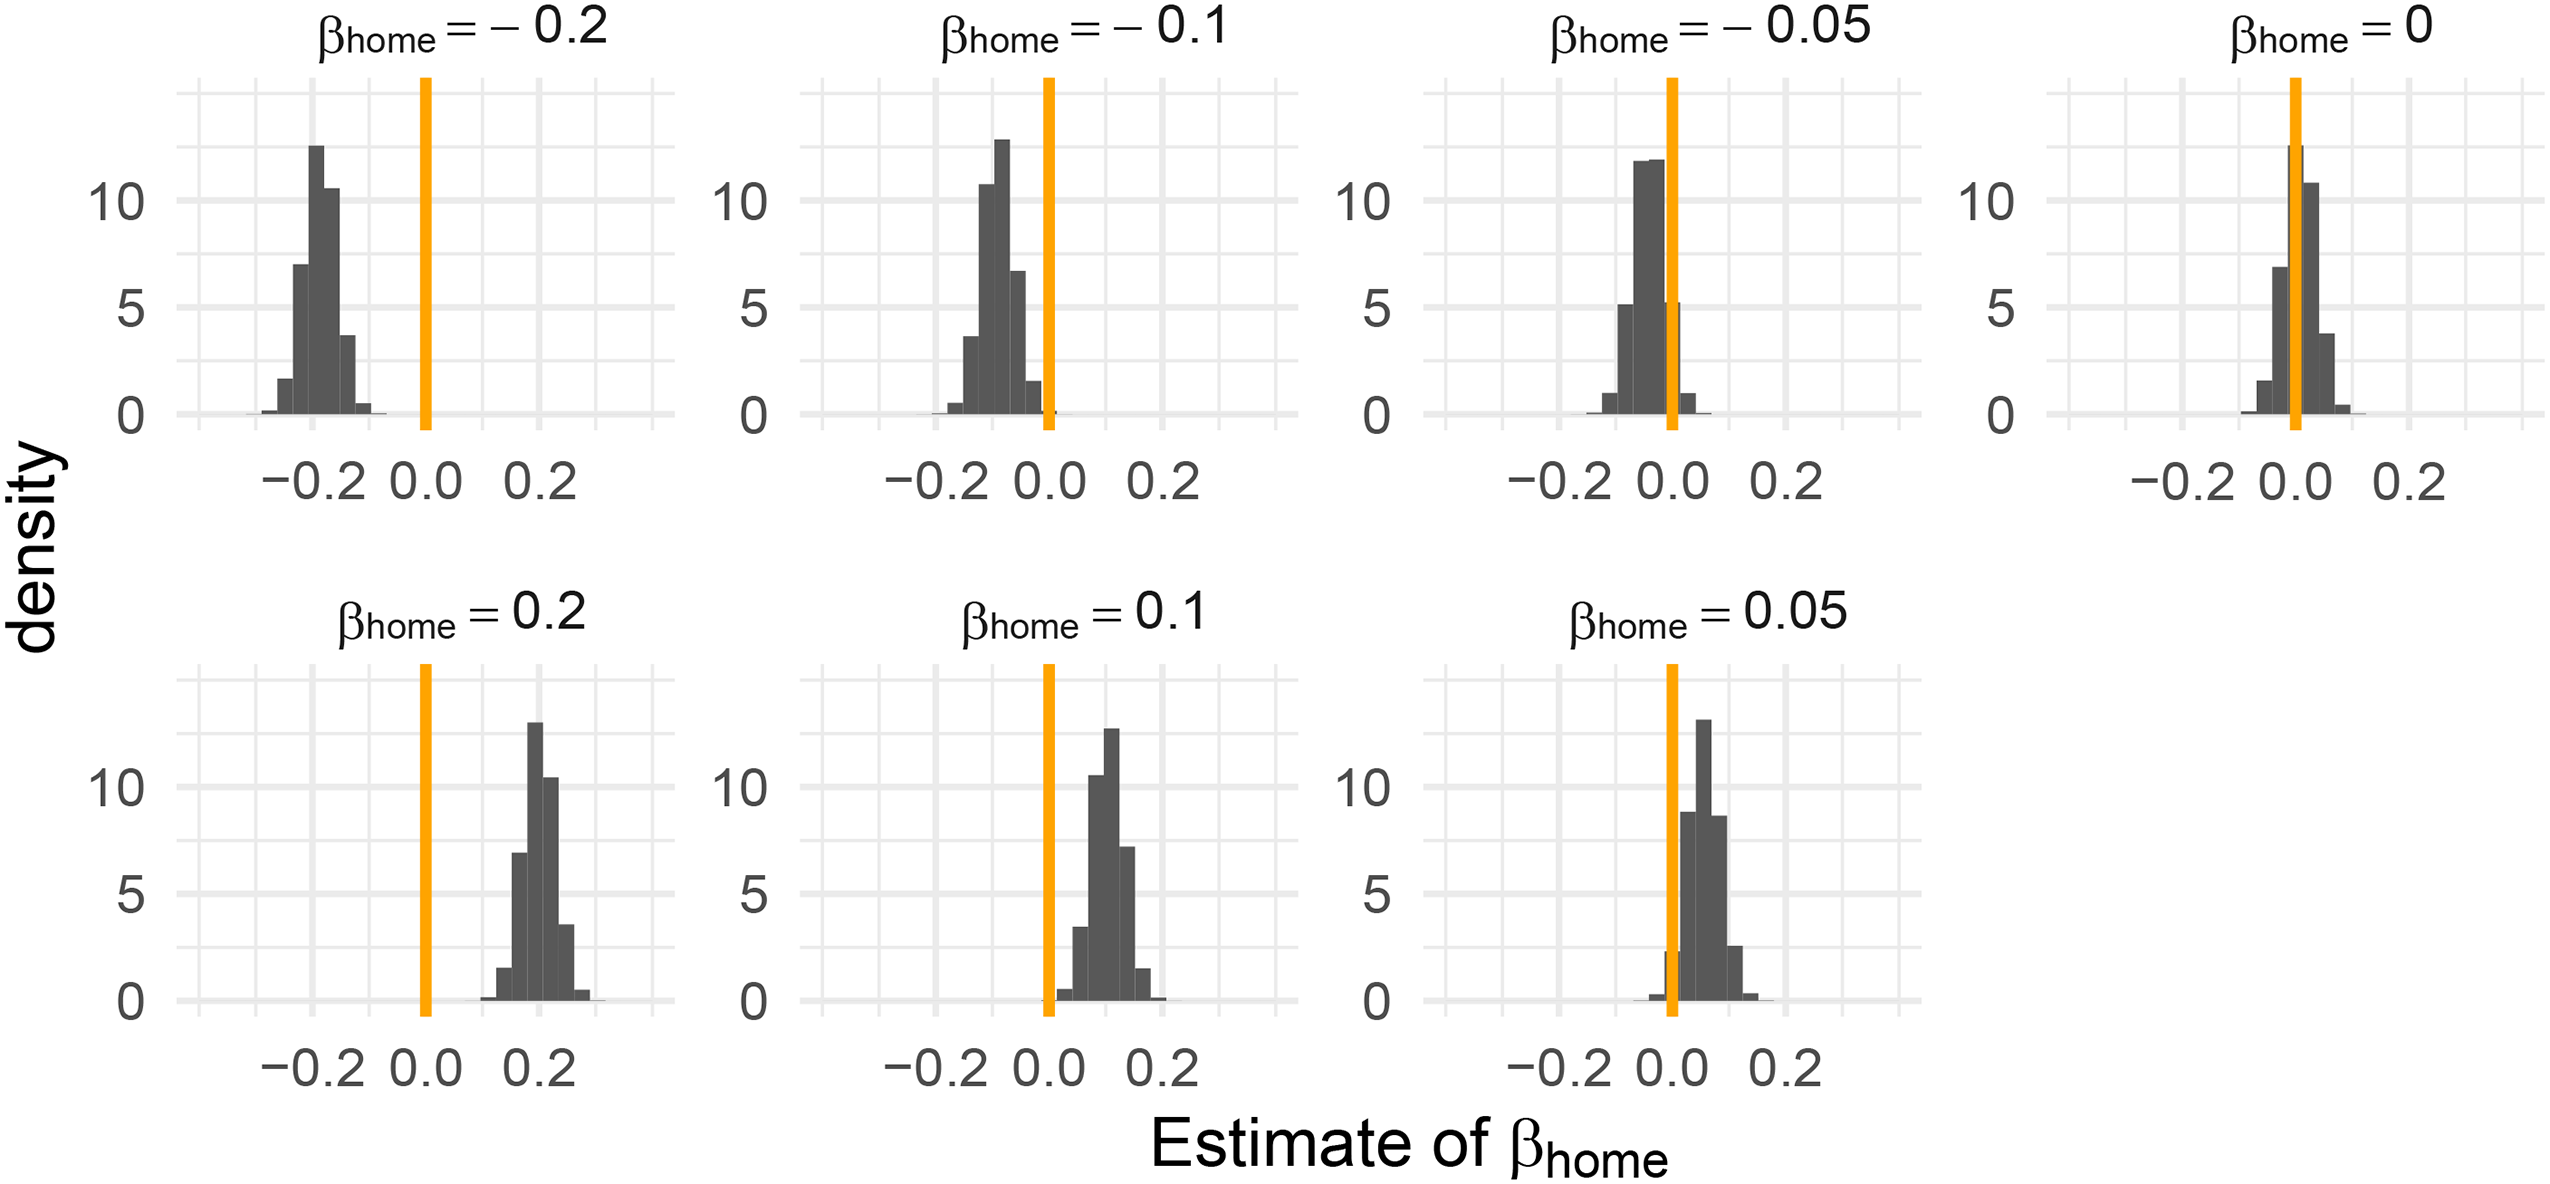
Histogram of the estimates for
Average Estimation Values for the Parameter
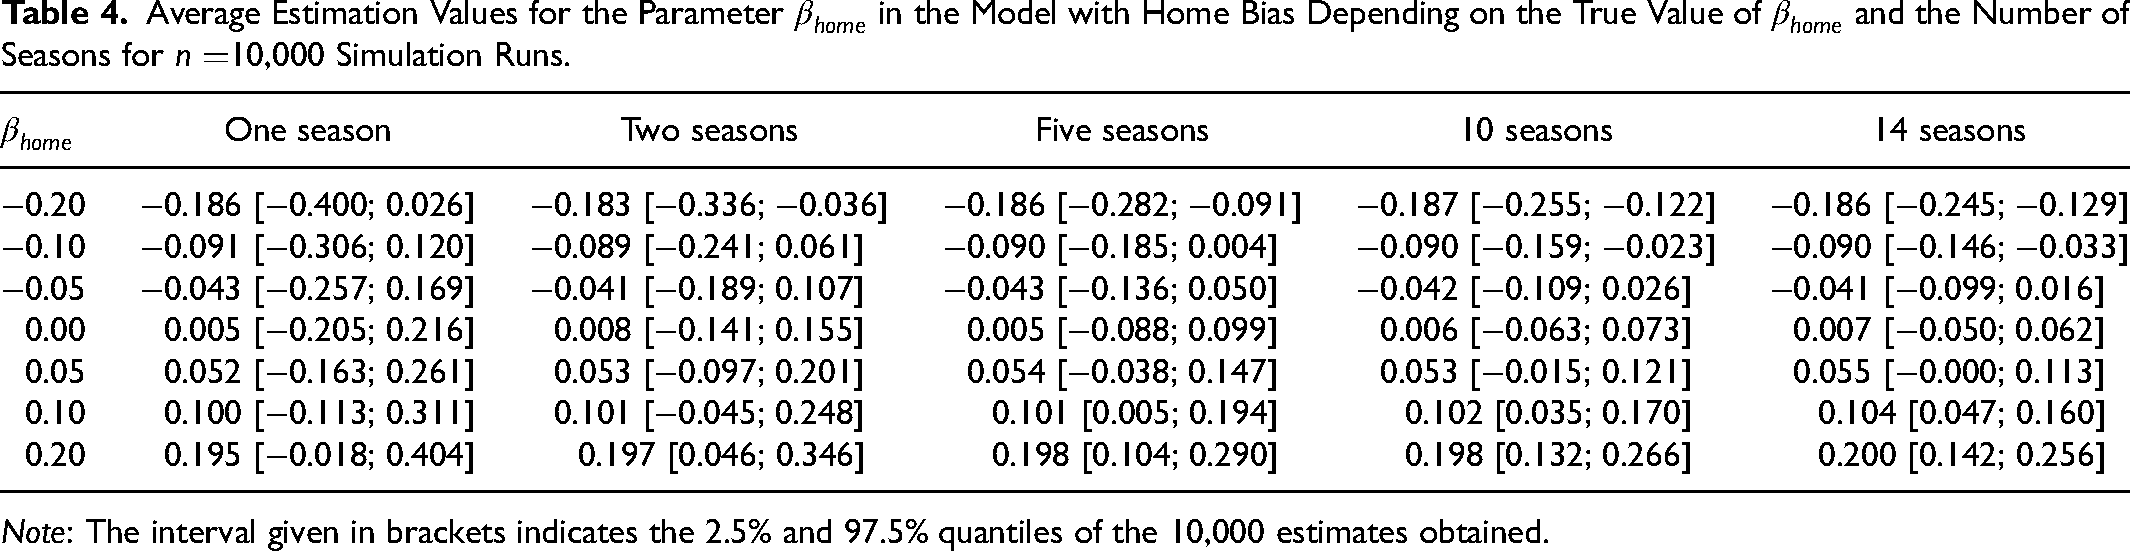
Note: The interval given in brackets indicates the 2.5% and 97.5% quantiles of the 10,000 estimates obtained.
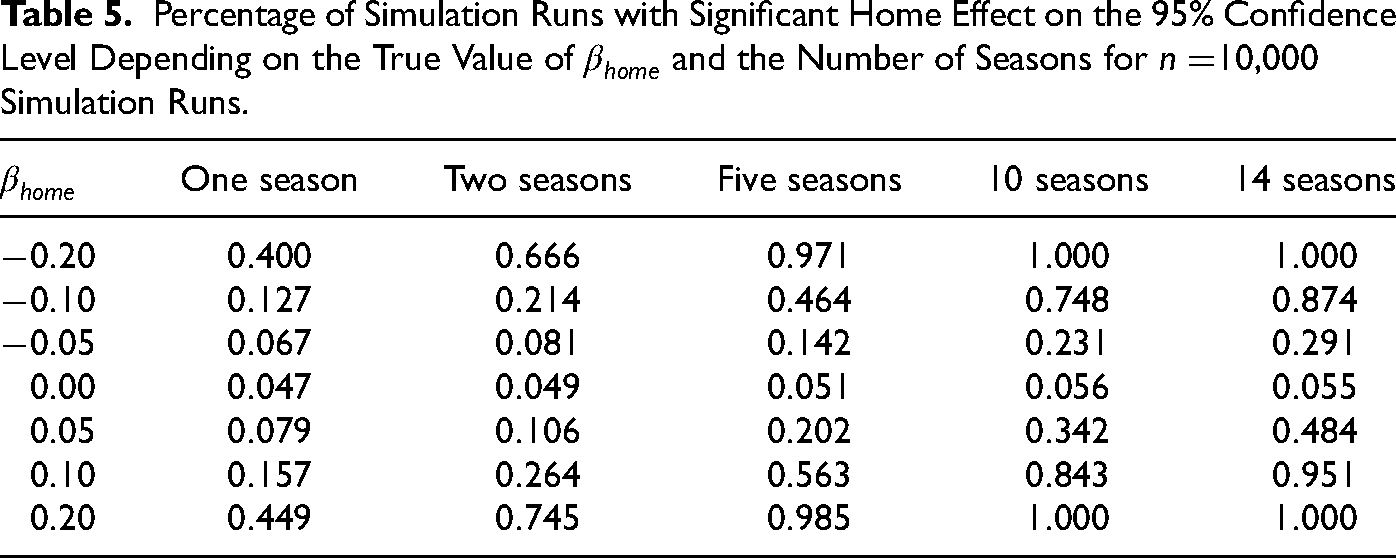
Table 5 displays the proportions out of
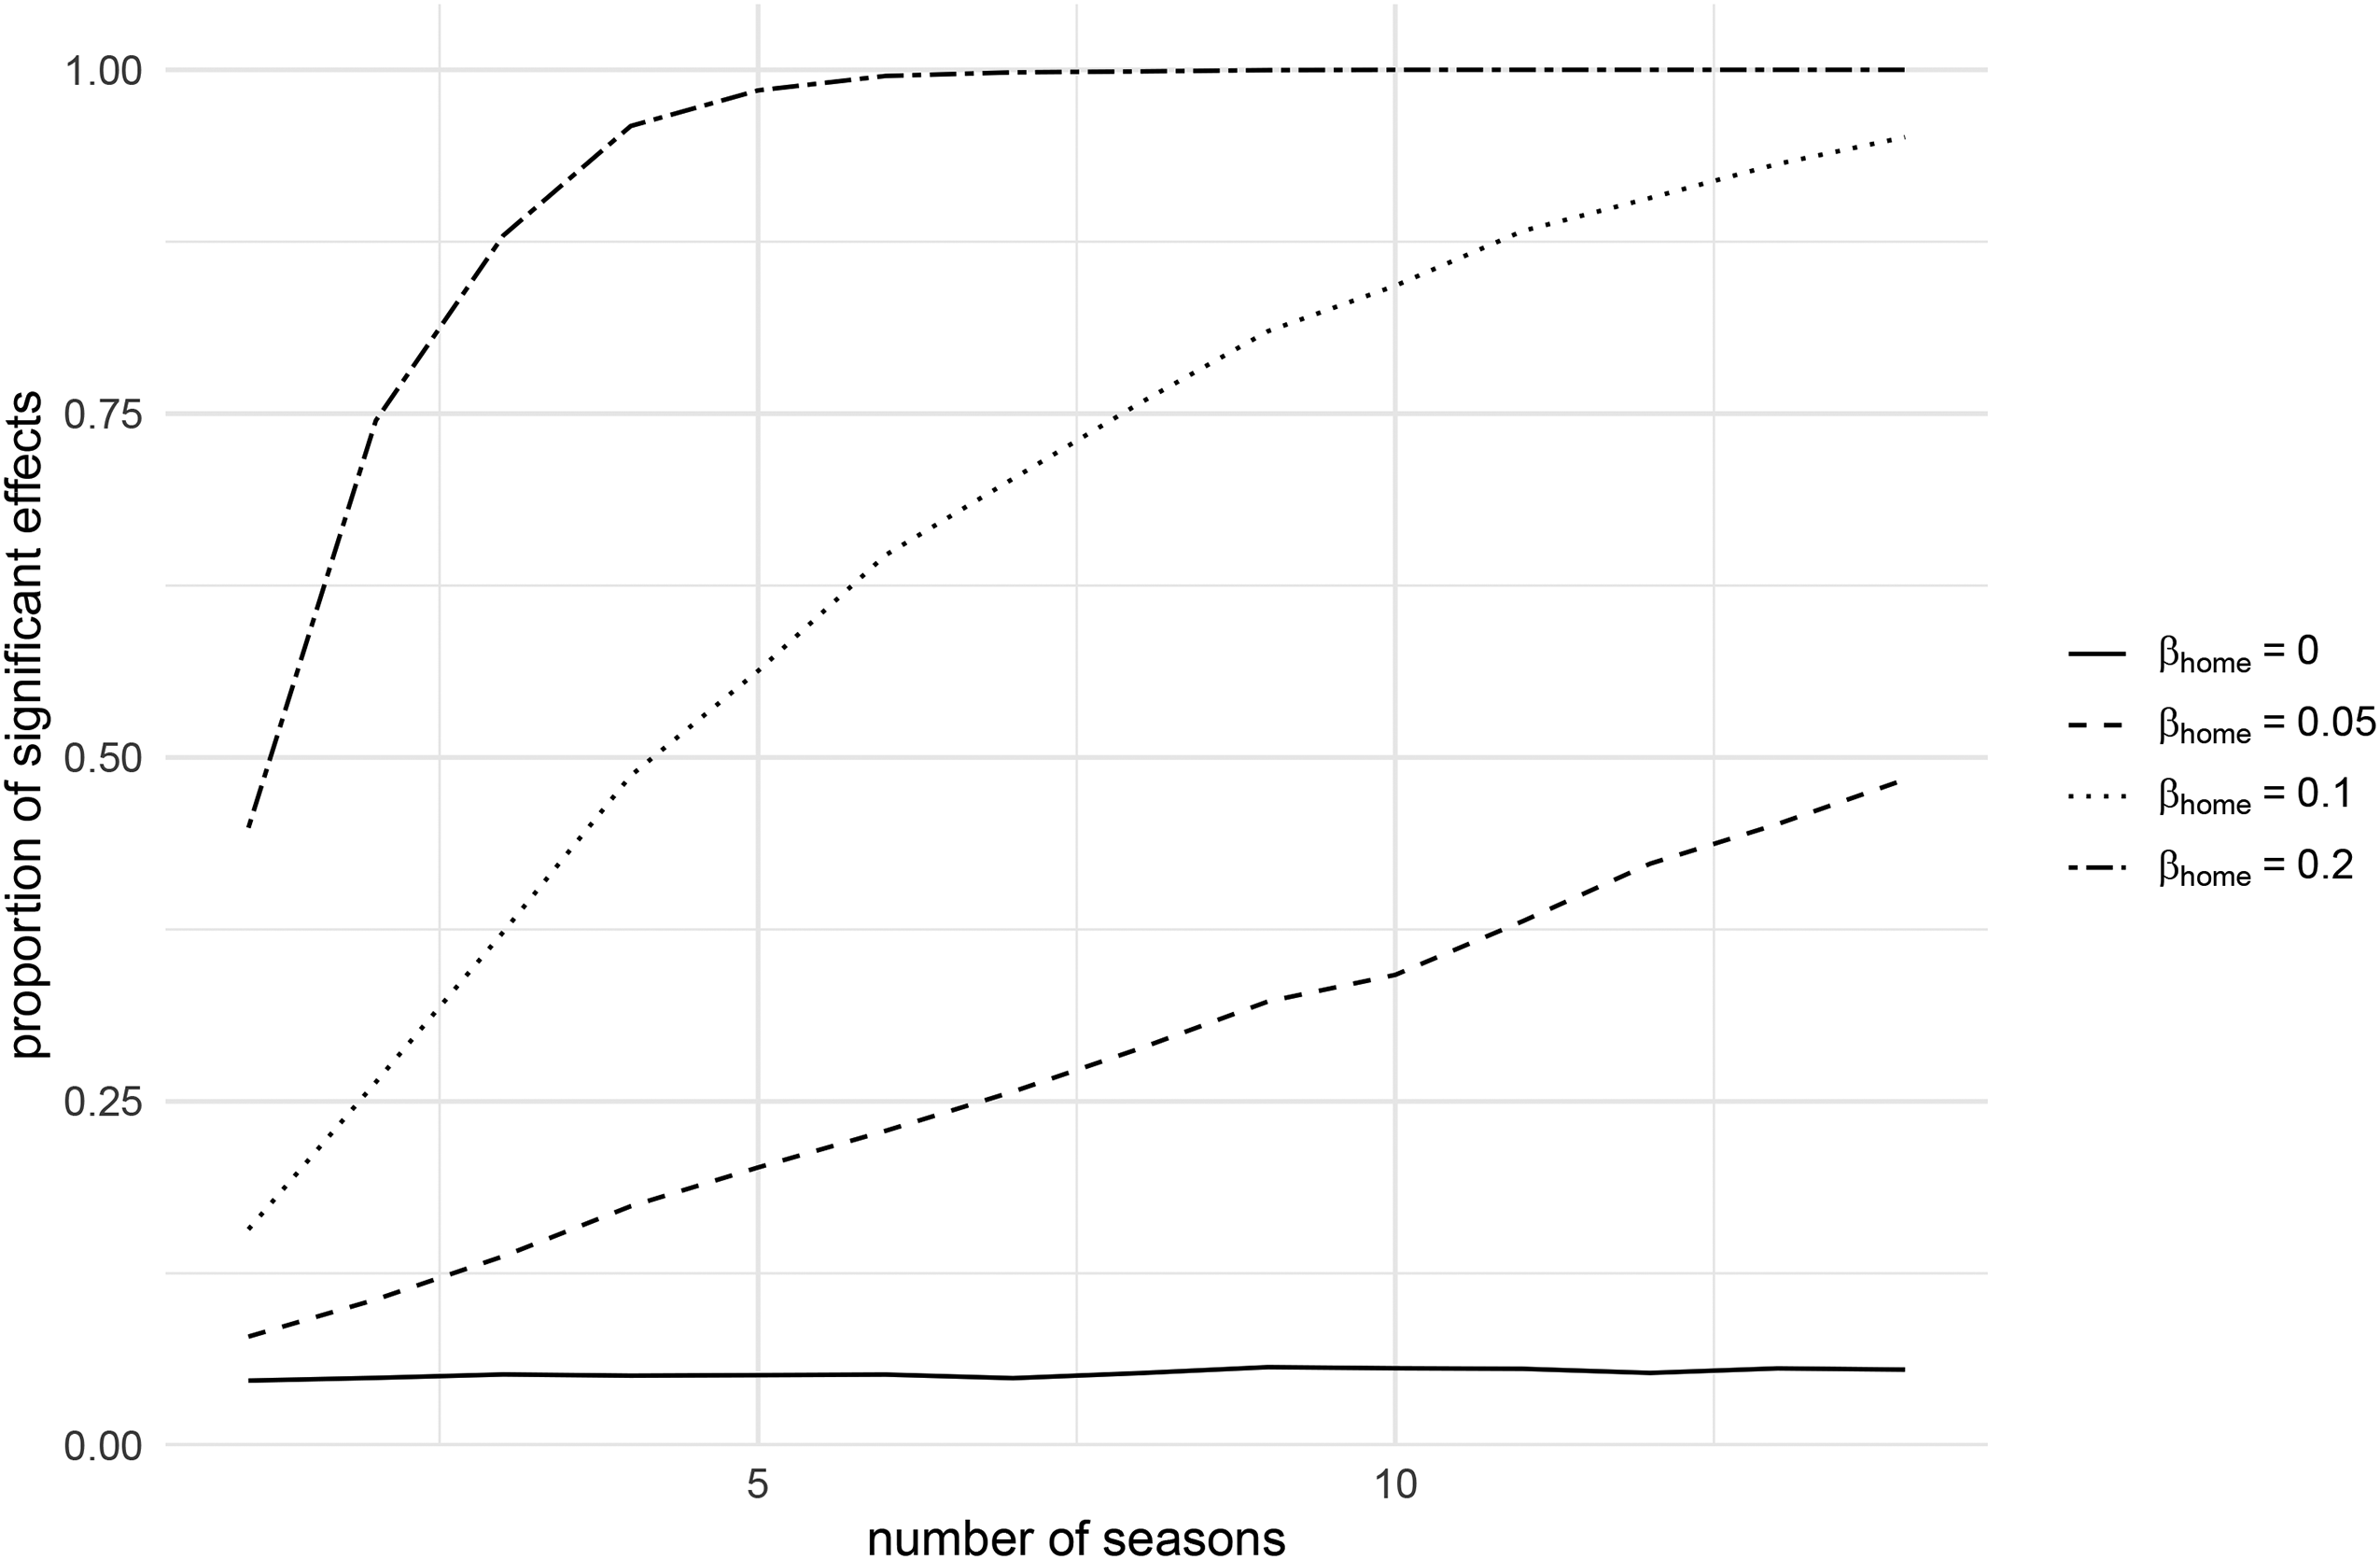
Percentage of simulation runs with significant home effects depending on the number of seasons and the intended underlying bias
Percentage of Simulation Runs with Significant Home Effect on the 95% Confidence Level Depending on the True Value of
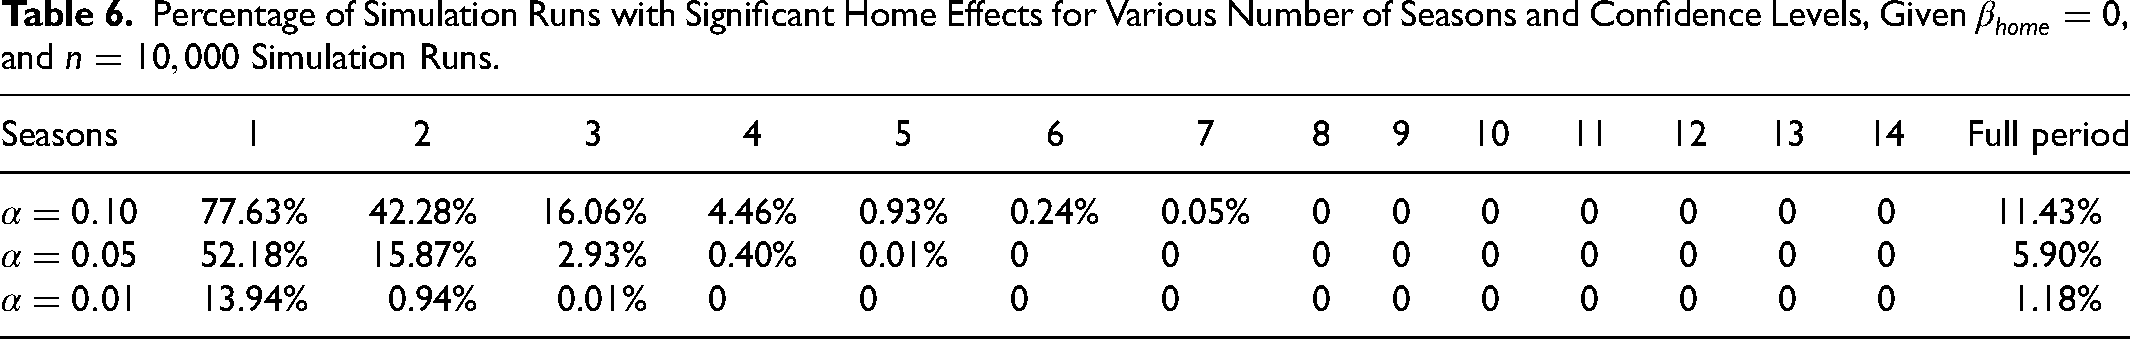
We now turn our focus to the case that bookmakers perfectly predict the probabilities of match outcomes (i.e., the true probabilities are entirely determined by the bookmakers’ odds), leading to a fully efficient market. This allows us to analyze how often inefficient periods occur by chance, potentially driven by statistical noise, for single seasons as well as for the whole observation period. Table 6 displays the results of a corresponding season-by-season analysis. Specifically, the
Percentage of Simulation Runs with Significant Home Effects for Various Number of Seasons and Confidence Levels, Given
We further consider the ROIs obtained in our simulation. While we occasionally observe fairly high returns for single seasons when consistently betting on the home team, Figure 5 shows the boxplots of the average returns when always betting on the home team in all 14 seasons. The average return is close to the negative average margin in the Premier League, obtained as about 6.2% over all 14 seasons analyzed. For single seasons, we find that the variation is much larger with ROI’s for individual simulation runs between
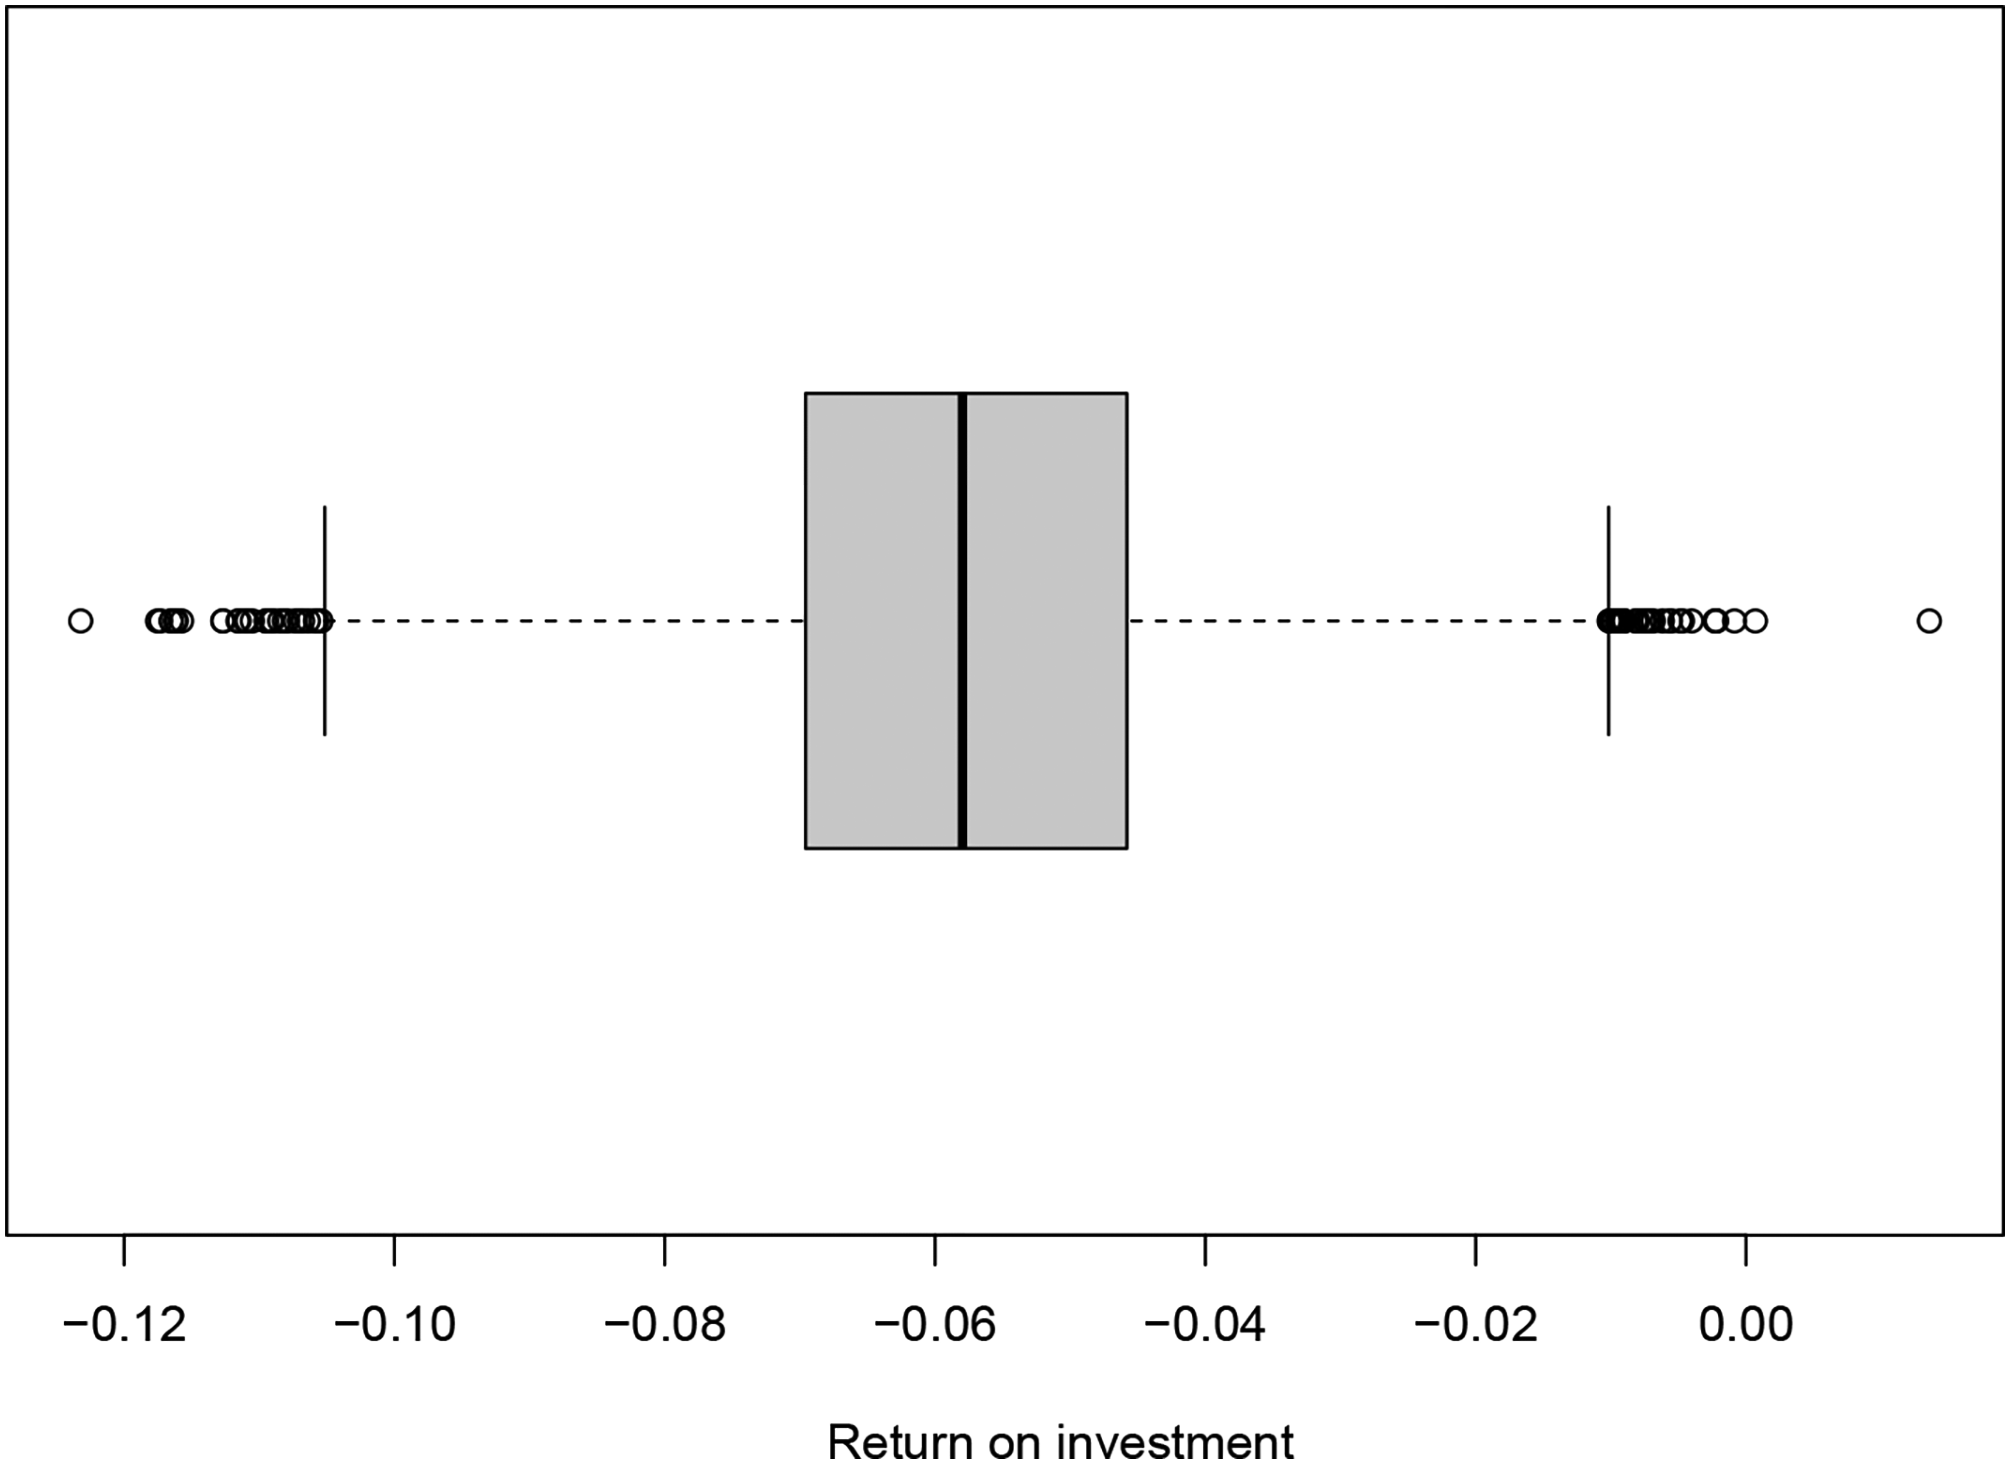
Boxplot on the average returns on investments (ROI’s) over all matches when consistently betting on the home team in the simulation runs under full market efficiency.
Sentiment Bias
For the sentiment bias, we again consider the situation of both, positive and negative biases, as well as a fully efficient market with unbiased betting odds. As introduced in the “Method and Data” section, the continuous-valued difference in the average attendance between both teams serves as the proxy for the difference in the sentiment between the opponents. Similar to the previous section, we vary the number of seasons as well as the magnitude of the induced bias in the set 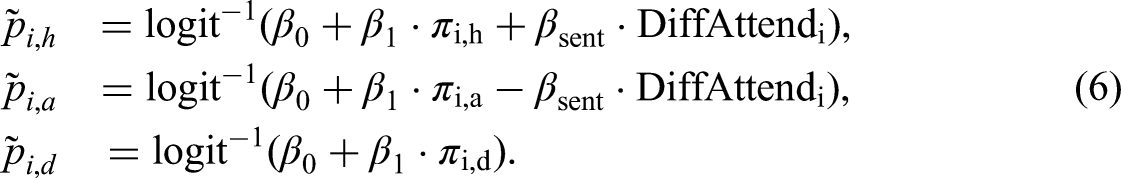
Here, we fit a logit regression model according to Equation 7 and again consider 
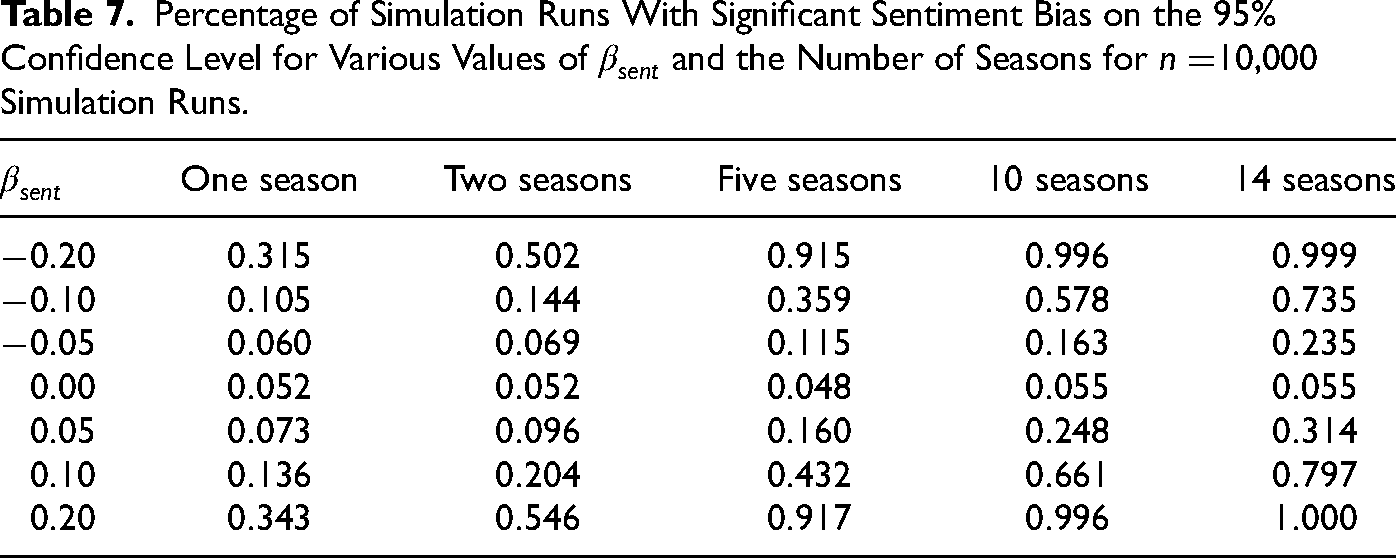
Table 7 gives the proportion of simulation runs where we detect a statistically significant (positive or negative) sentiment bias for

Histogram of the estimates for
Percentage of Simulation Runs With Significant Sentiment Bias on the 95% Confidence Level for Various Values of
Favorite-Longshot Bias
For analyzing the FLB, we follow the approach by Feddersen (2017). Accordingly, we use the following predictor to be applied to the logit link function:
Again, we vary the induced bias in the set 
To determine whether we obtain a (significant) FLB, we fit a logit regression model based on the predictor given in Equation 8. This allows us to test whether the resulting estimation for
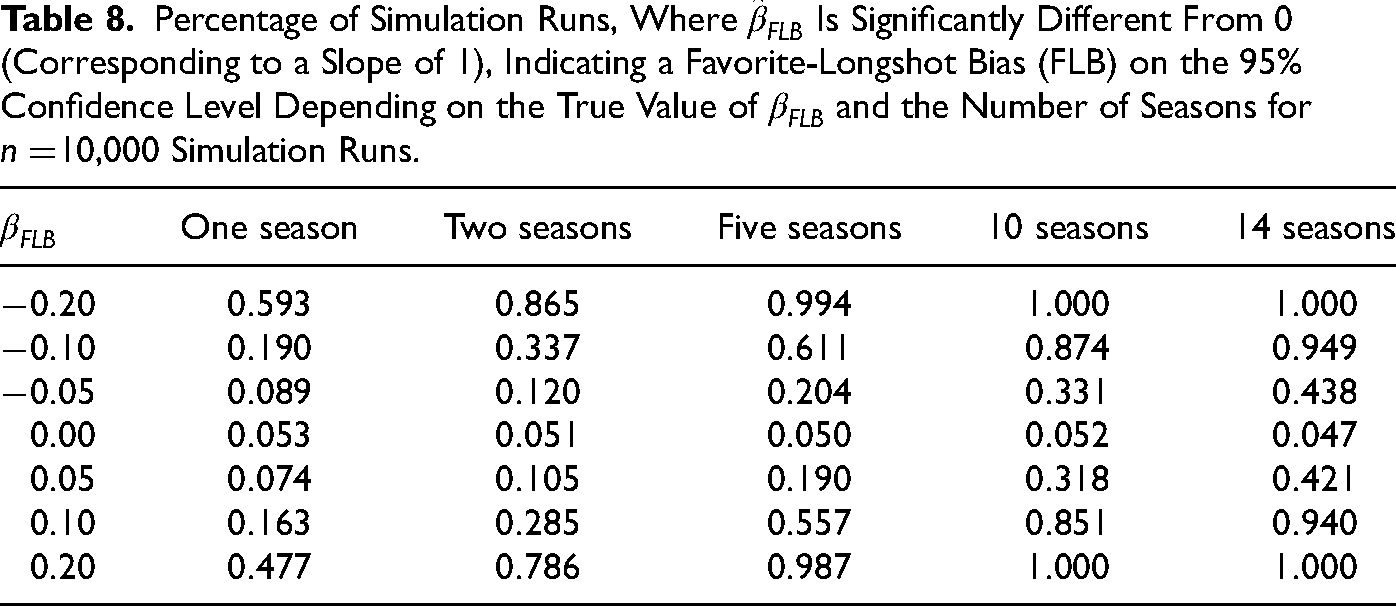
Table 8 gives the proportions out of
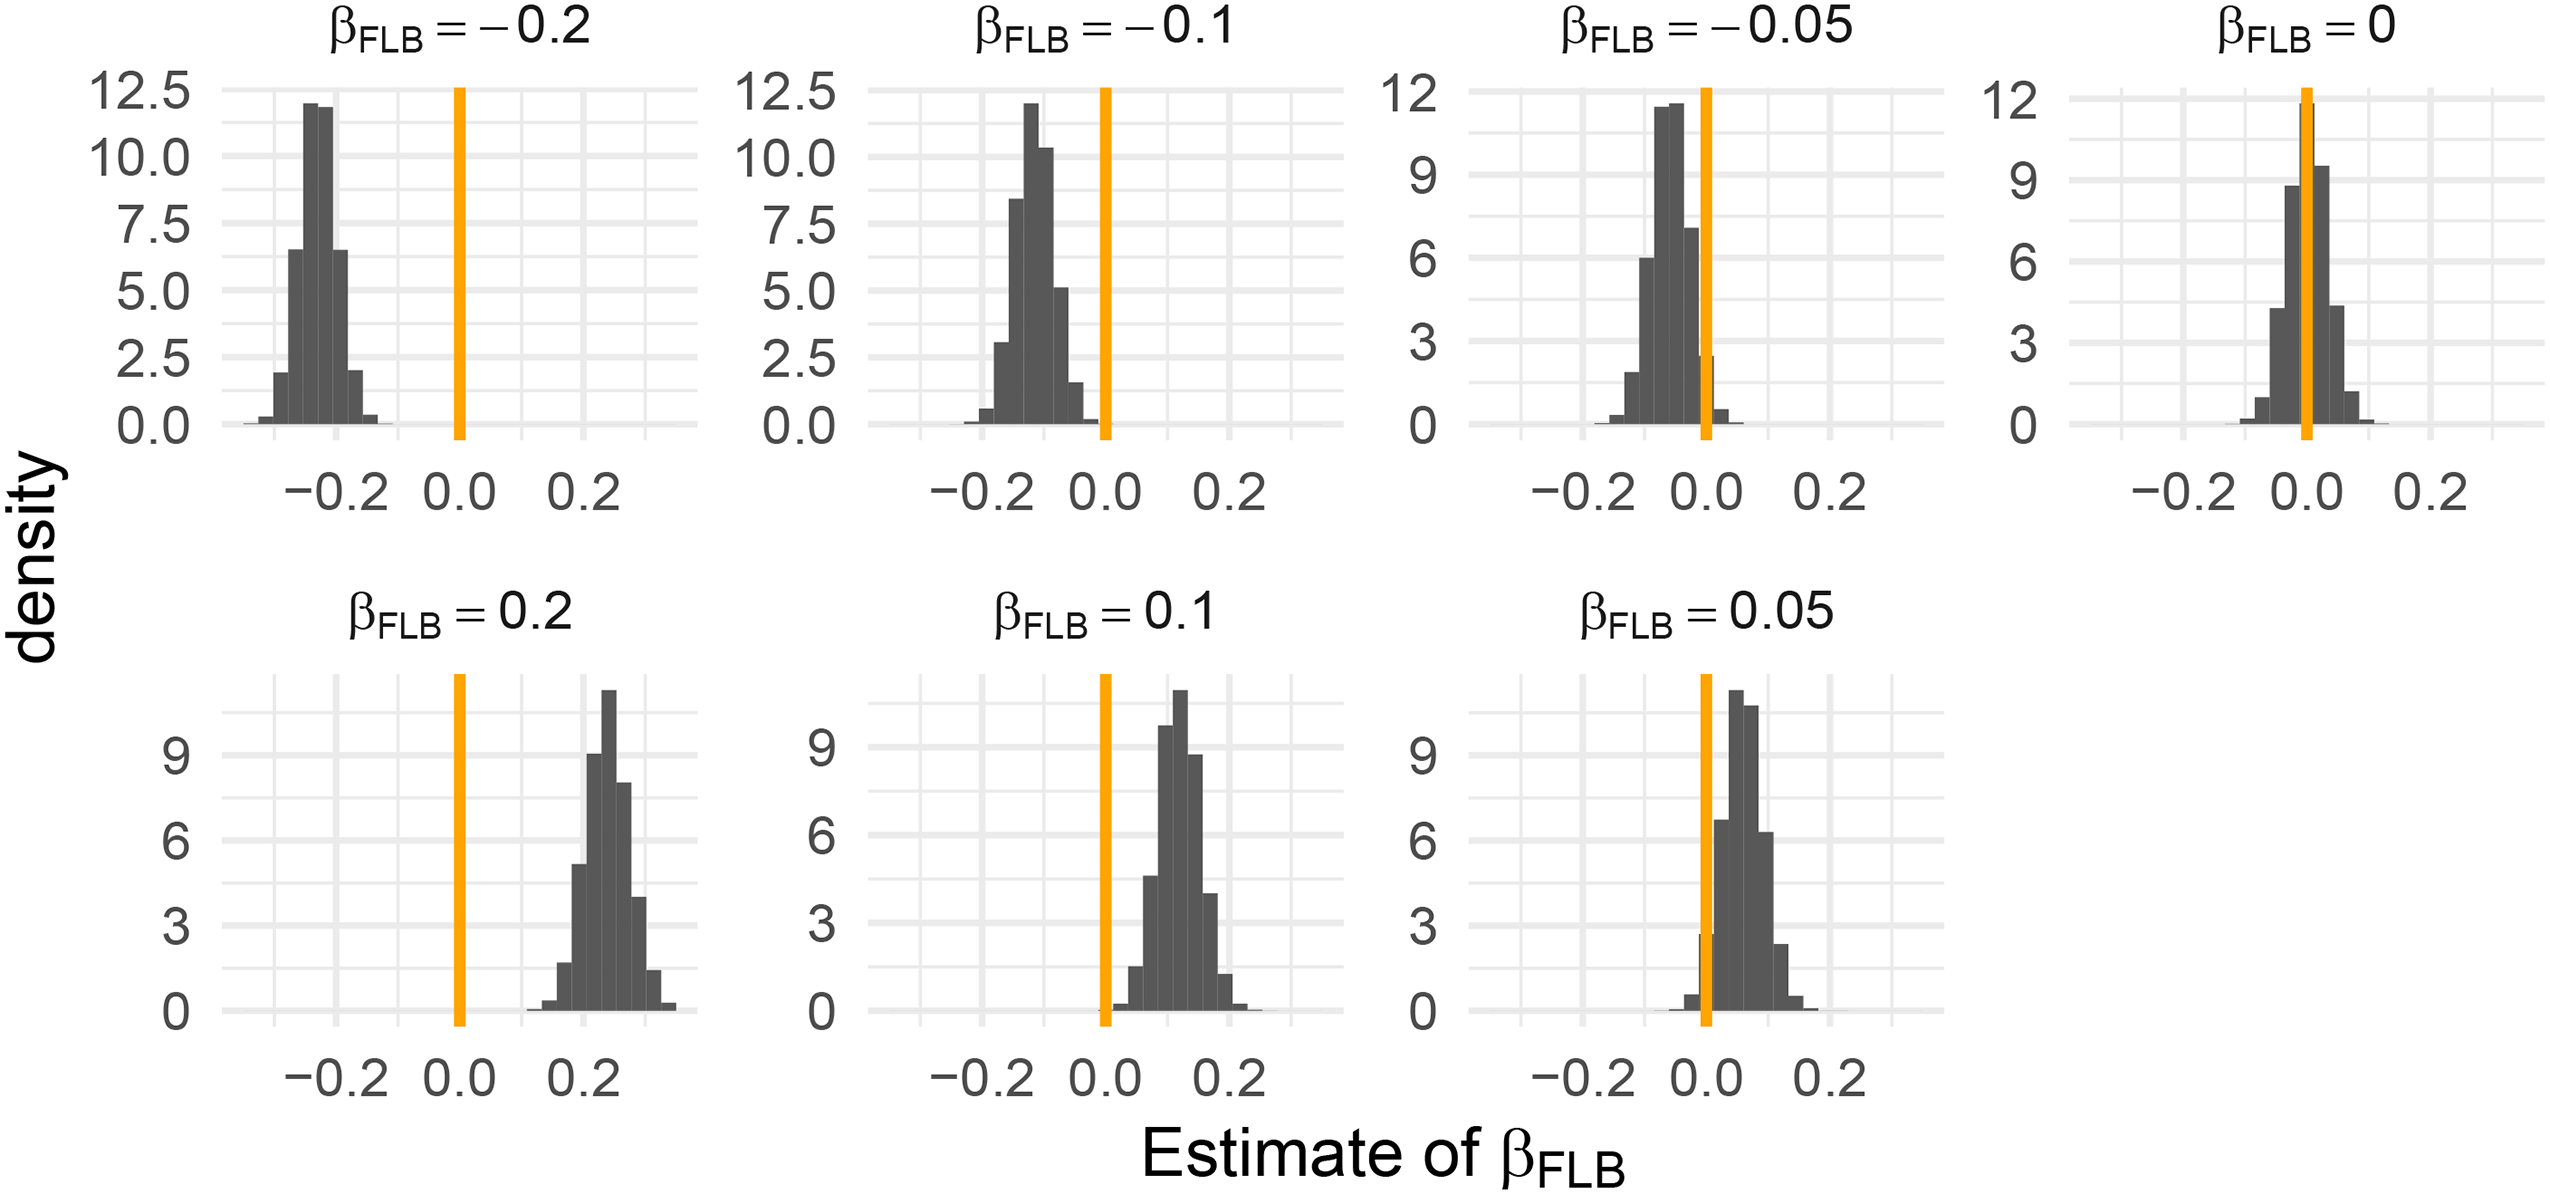
Histograms of the estimates
Percentage of Simulation Runs, Where
Real-World Betting Markets
After discussing the (in)efficiency of betting markets from a theoretical perspective using simulated data, we now consider the data set introduced in the “Method and Data” section to analyze if biased odds persist over time and if their occurrence is as regular as the literature suggests. We first investigate the different biases discussed above for the Premier League for the full sample from season 2005-2006 until 2018-2019. We then fit our model to season-by-season data to investigate whether biases are of temporary nature only. After discussing results for the Premier League in detail, a brief summary of analog results obtained for the other four European top leagues is provided. We then analyze if the identified biases led to profitable betting strategies.
Biases in the English Premier League
The very left column of Table 9 displays the results of the regression model fitted to all seasons of the Premier League. Our results suggest that game outcome is predicted strongly by the implied probability calculated from betting odds. An increase of 1 percentage point in the Implied Probability - all other covariates held constant—increases the odds of winning a bet by
Figure 8 displays the relationship between the probability implied by the bookmaker on the x-axis and the expected winning probability given by our model on the y-axis for home (left panel) and away games (right panel), including corresponding confidence intervals. The dashed line corresponds to full market efficiency, that is, the implied probability equals the probability under the model since further effects beyond the home effect do not have any explanatory power. These results suggest that bookmakers undervalue favorites with implied probabilities between 0.5 and 0.8 in home games, equal to overvaluing underdogs with implied probabilities between 0.2 and 0.4 in away games. While this supports evidence for a FLB in the data and is in line with the findings on the Premier League by Direr (2011) and Franke (2020), our findings from the simulation-based analysis in the “Favourite-Longshot Bias” section indicate that there is a high chance to uncover even a small FLB in large data sets (see Table 8).
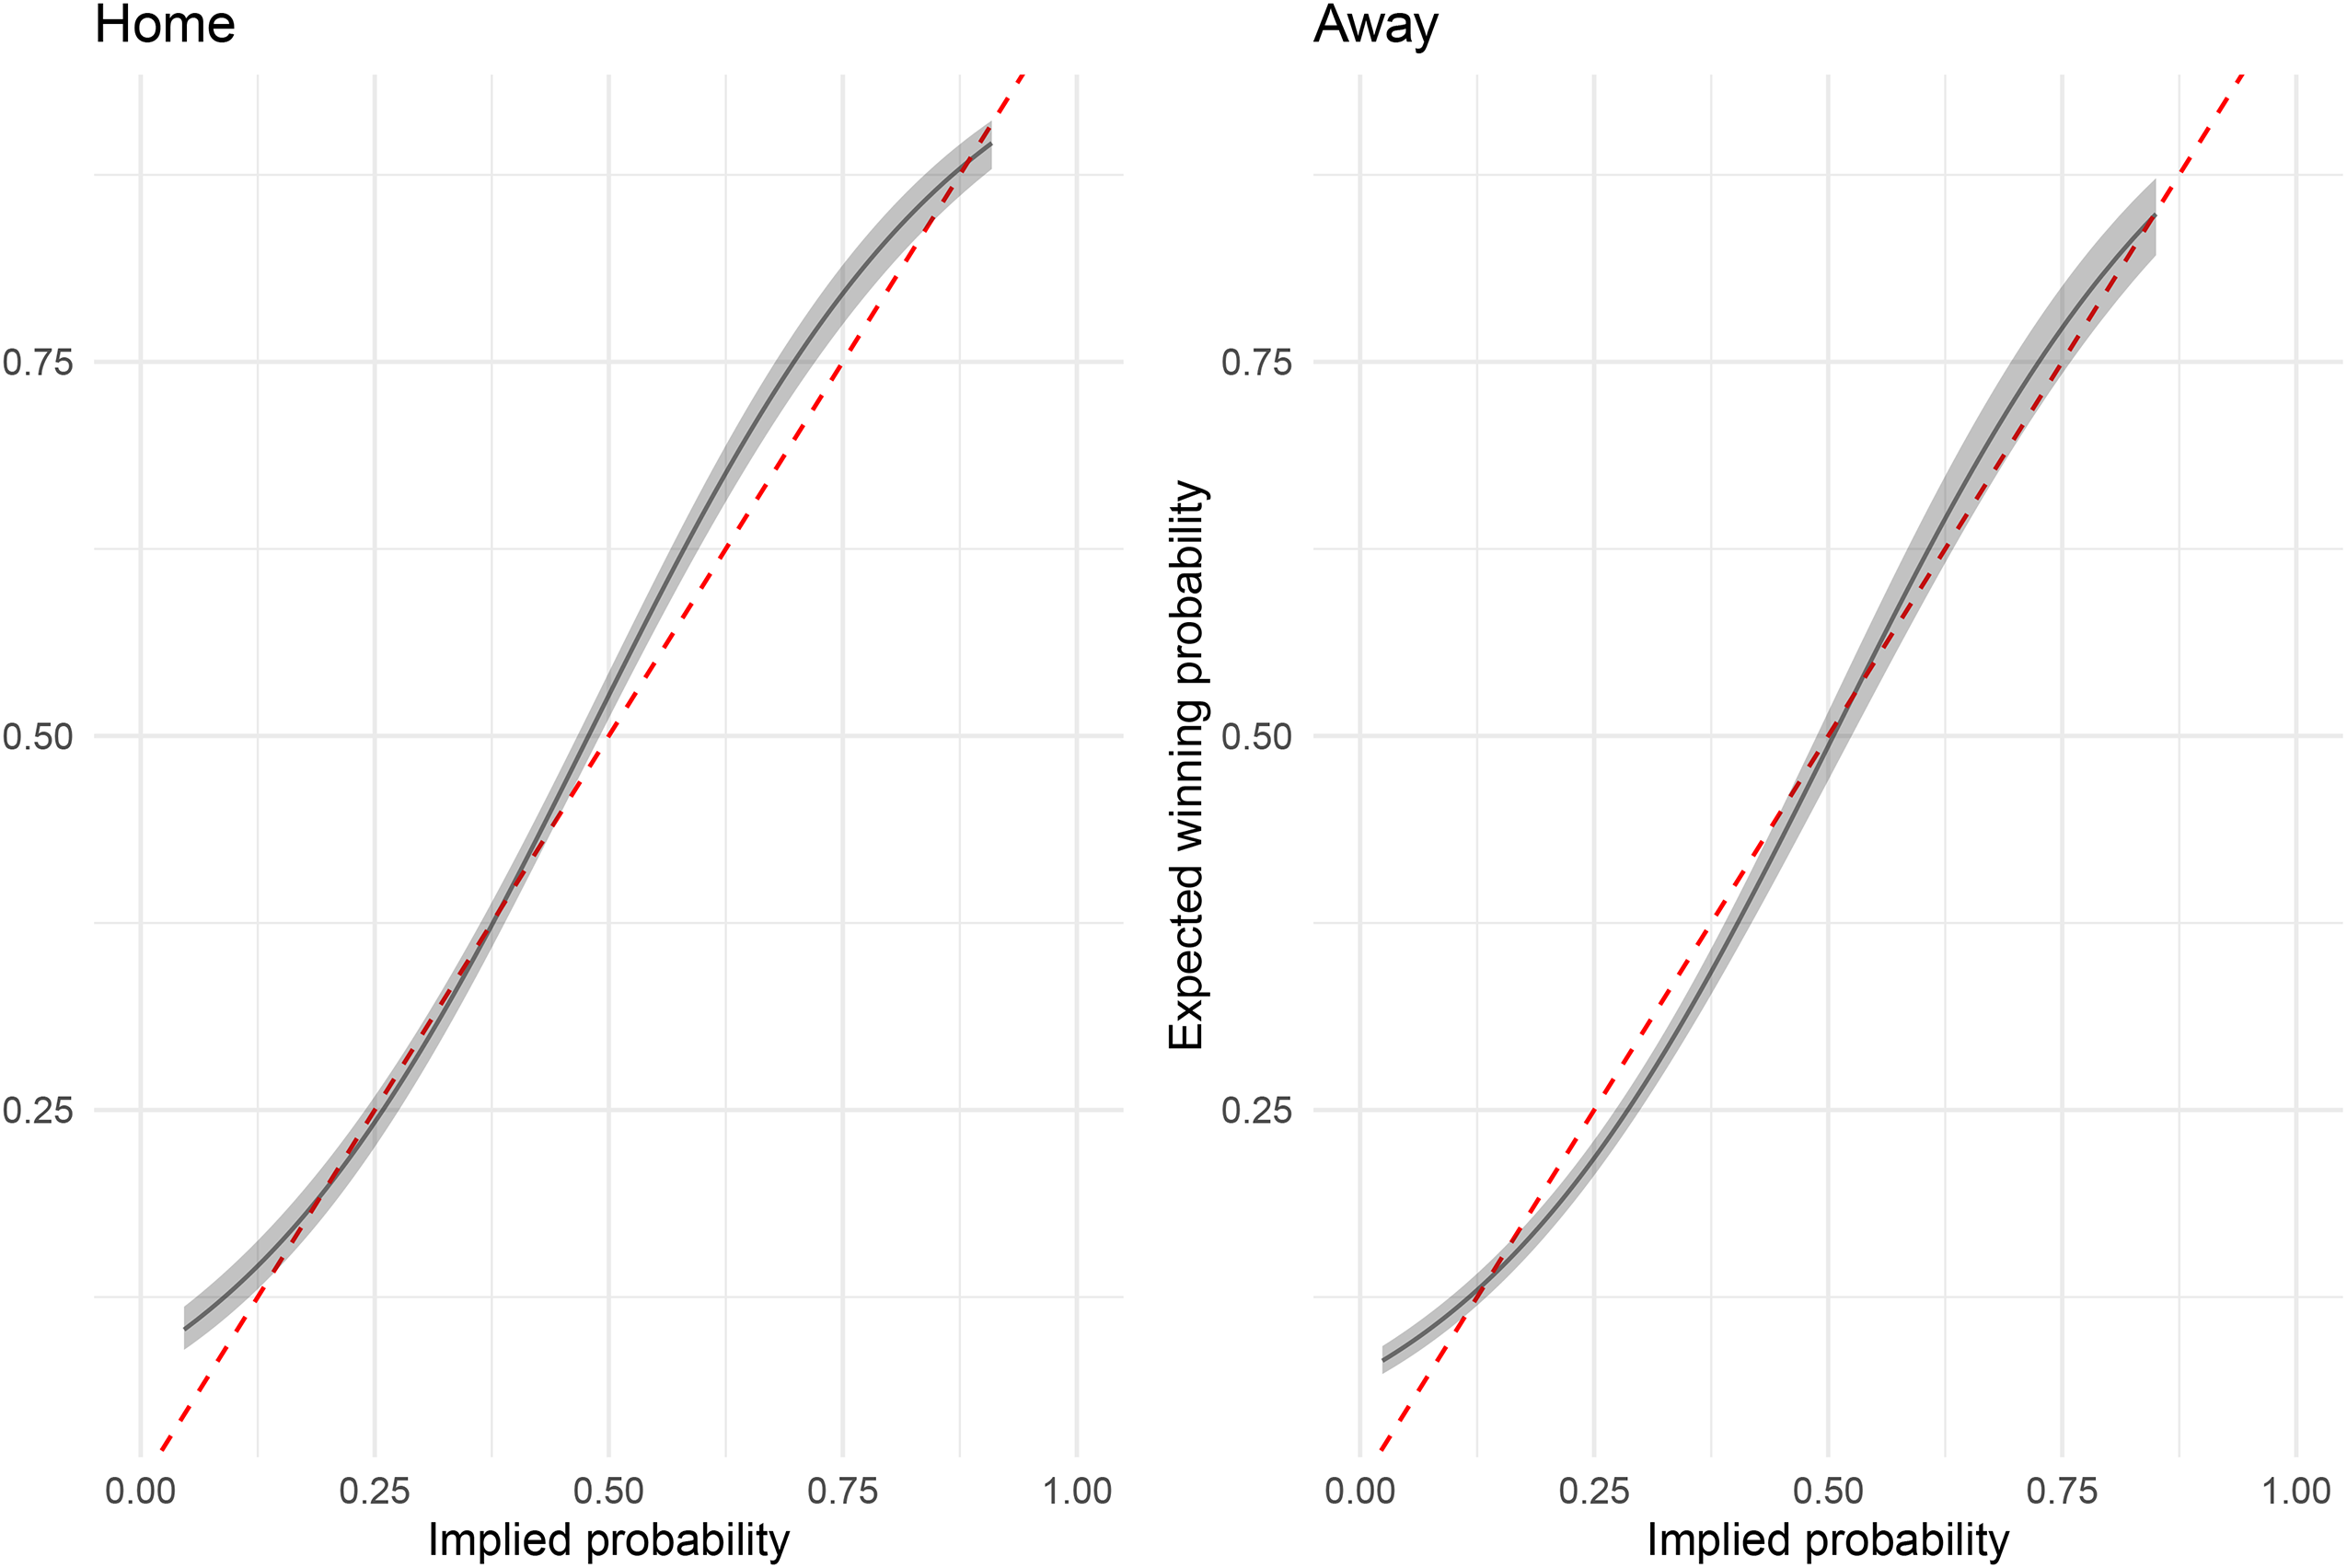
Probabilities for winning a bet under the model for the full observation period in the Premier League for home matches (left panel) and away matches (right panel). The covariate DiffAttend is set to its mean, that is, zero, in this figure.
Estimation Results for the Regression Model Fitted to Data From the English Premier League.
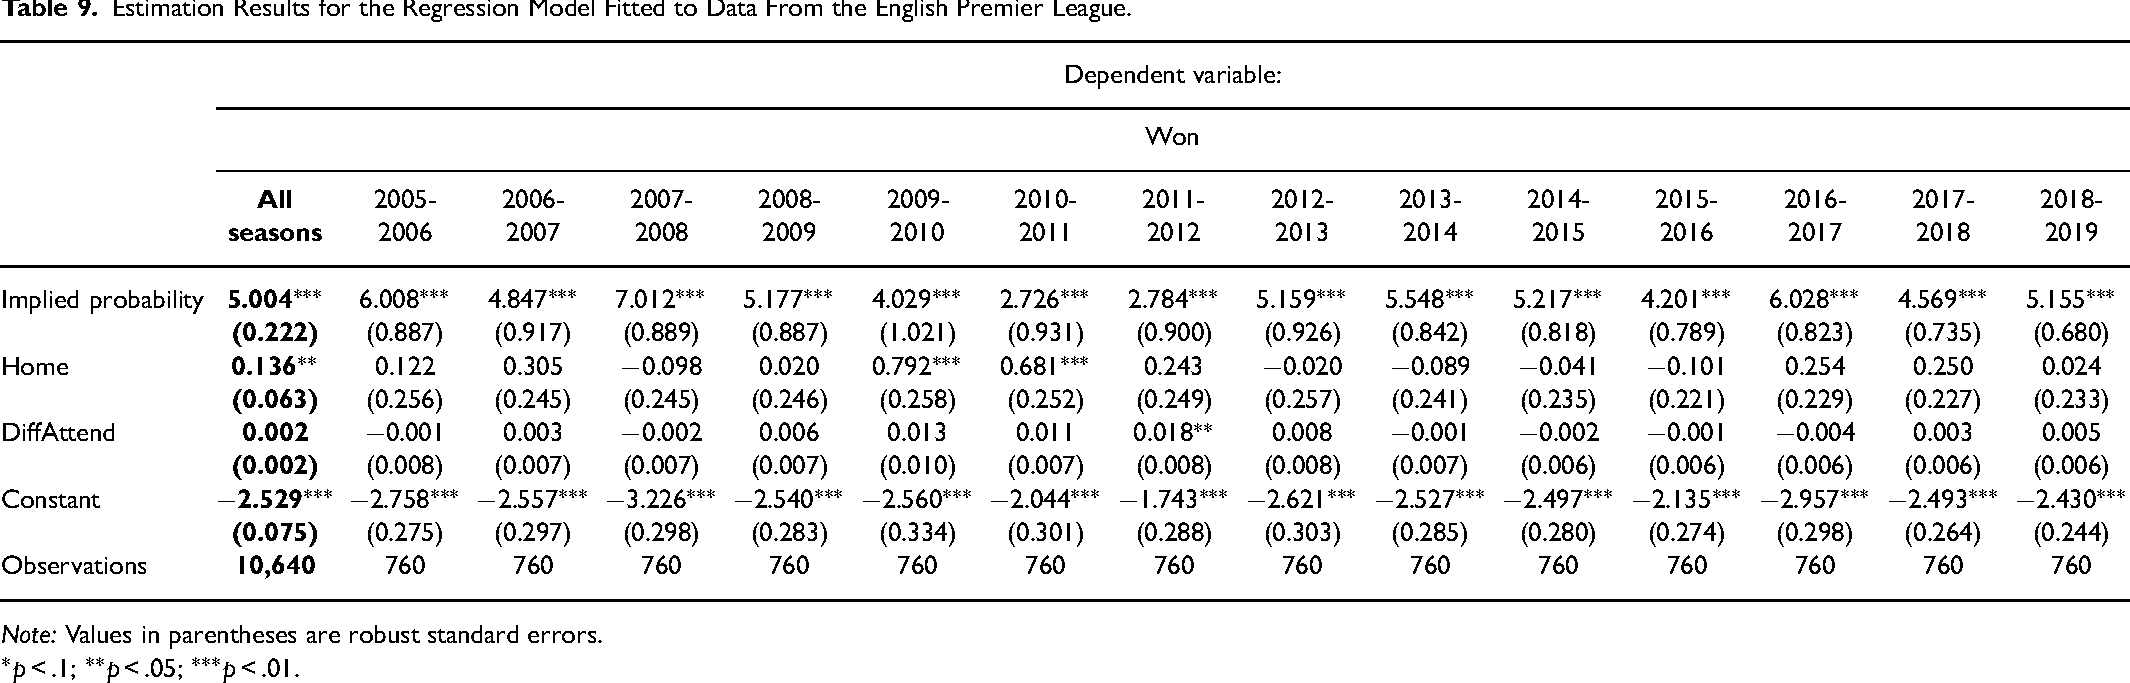
Note: Values in parentheses are robust standard errors.
Table 9 displays the results for the Premier League when fitting our model to individual seasons. Each season contains 760 observations (380 matches per season
As mentioned in the “Method and Data” section, our analysis relies on the calculation of implied probabilities by dividing through the factor (1+margin) for each outcome. Thus, we run robustness checks to consider whether our results remain the same when relaxing this assumption. Previous literature suggests various options to consider differentially weighted margins, for example (1) margins weighted proportional to the odds, (2) using the odds ratio, and (3) using a logarithmic function. In this article, we consider approach (1), while the other two could also be applied. Margins
Further Leagues
The results of the biases analyzed for further European top leagues can be obtained from the Appendix and are only briefly mentioned here. Except for the Bundesliga, the models fitted to data of all seasons indicate a significant FLB for all leagues (see Figures 11–14 in the Appendix). These results extend the findings of Forrest & Simmons (2008) who provide an evidence for the existence of the FLB in La Liga to further leagues. As also revealed by Forrest & Simmons (2008), our results suggest a sentiment bias in the Bundesliga, Serie A, and La Liga (see Tables 14–16 in the Appendix). In addition to the Premier League, we also obtain a home bias in La Liga for the full observation period (see Table 16 in the Appendix). Analyzing single seasons, we find that the effects revealed over the full sample are mostly driven by a small number of seasons and are short-lived. Again, findings for single seasons should be interpreted carefully in the light of our simulation-based analysis.
Returns
The estimated coefficients for the home effect, the sentiment bias, and the implied probability covering a potential FLB indicate that - atleast for a few seasons—the chances of winning a bet are increased when following these strategies. We thus investigate potential profits resulting from these biases in our data set. To become profitable, strategies must exploit biased odds, which more than offset the bookmakers’ margin. The ROIs considered here are calculated as
Positive returns are generated in seven out of 14 seasons when strictly betting on home teams in the Premier League. At the same time, the results of our regression model in Table 9 indicate significantly increased probabilities of winning a bet on home teams for two seasons only (2009-2010 and 2010-2011). As the standard error of the parameter
Returns on Presented Strategies for All Leagues and Seasons.
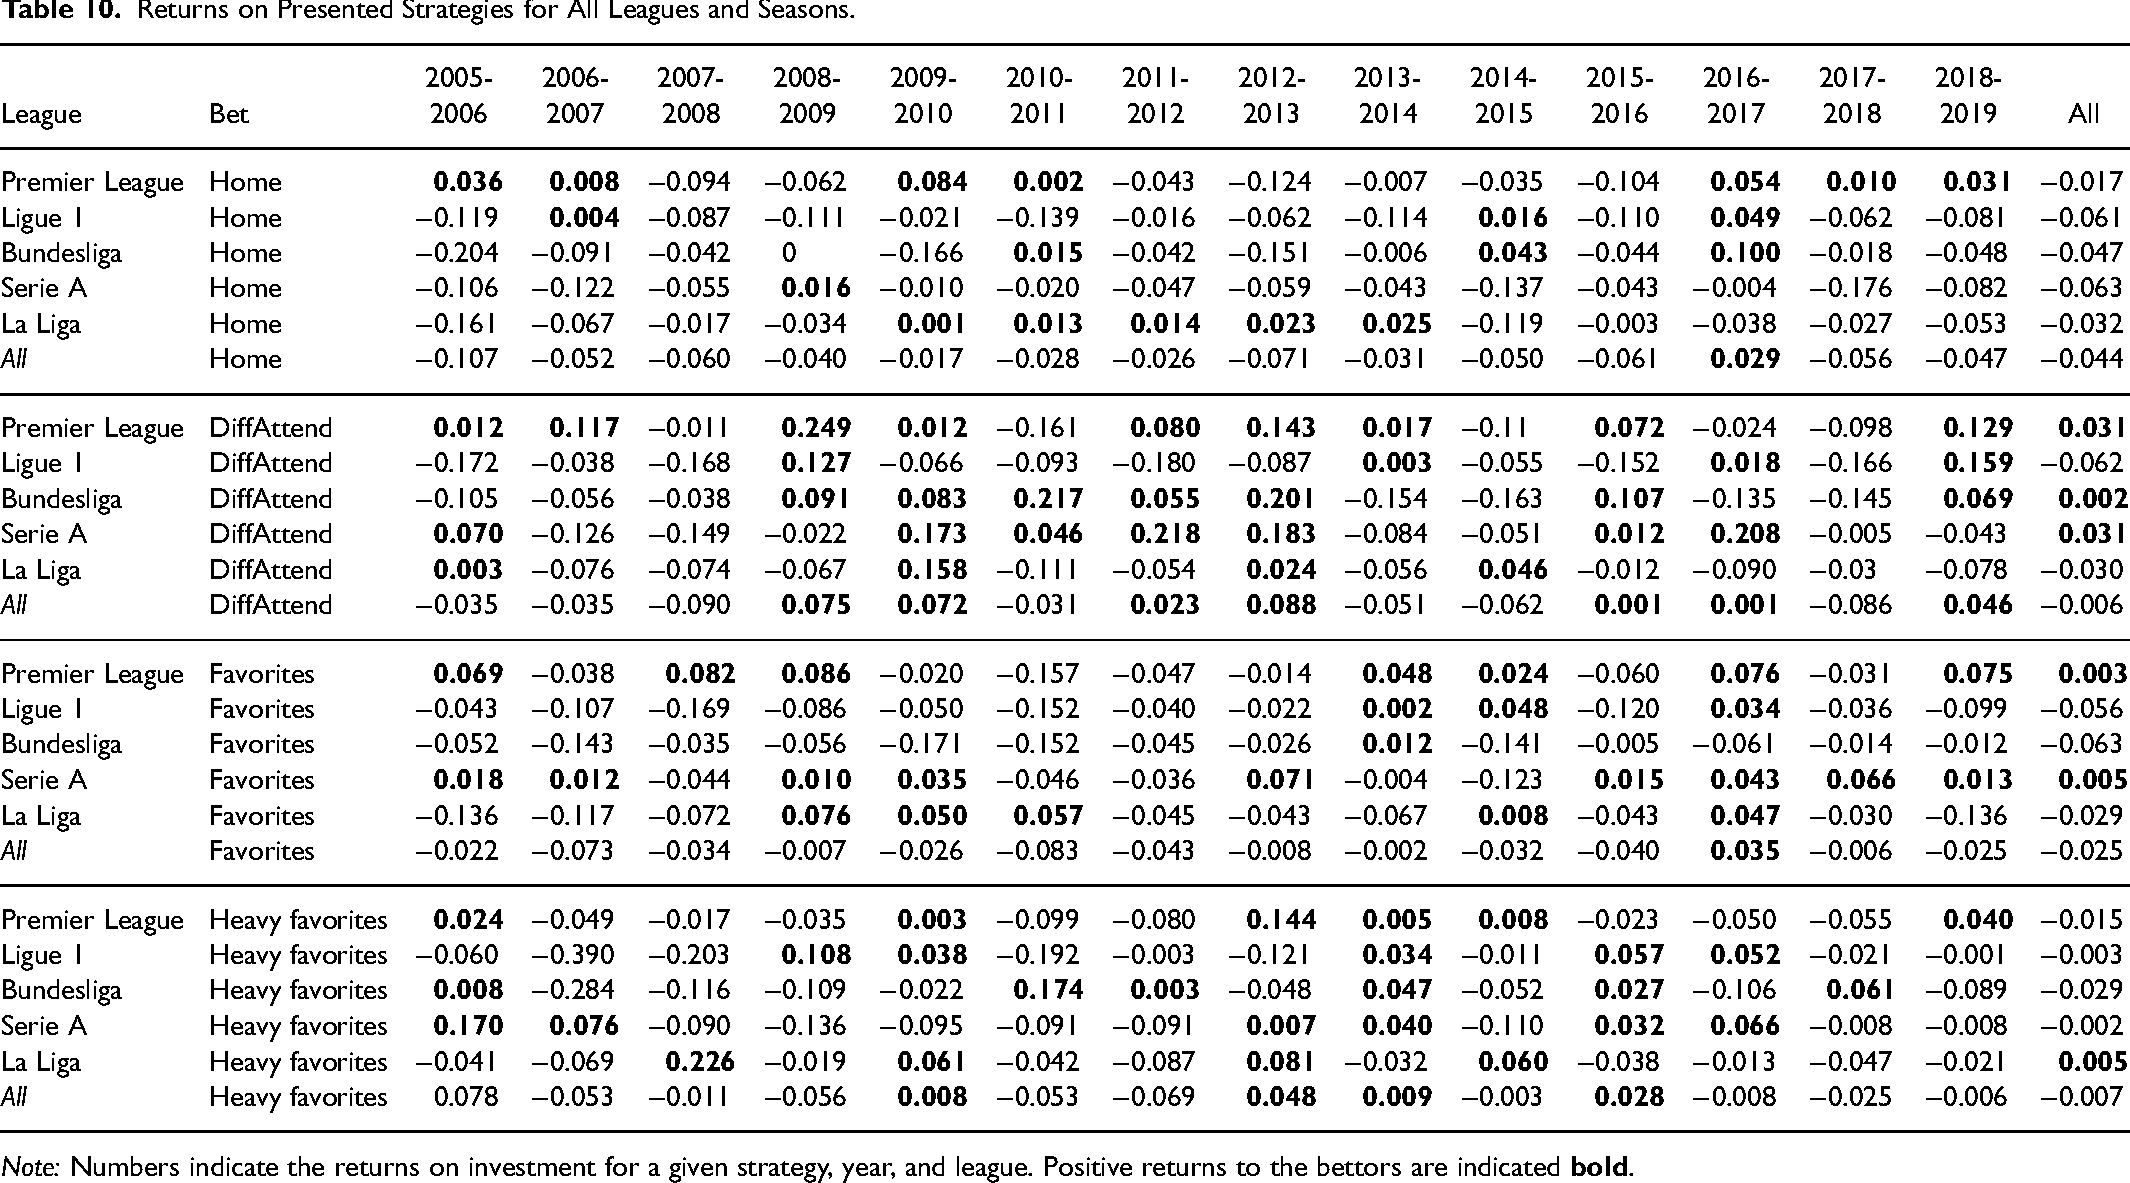
Note: Numbers indicate the returns on investment for a given strategy, year, and league. Positive returns to the bettors are indicated
For teams with higher average attendance, we find positive returns in at least half of the seasons for the Premier League, the Bundesliga, and Serie A, leading to positive returns over the entire period of 14 seasons. For a few seasons, the returns are fairly large (above 20% in the Premier League 2008-2009, the Bundesliga in 2010-2011 and 2012-2013, as well as Serie A 2011-2012 and 2016-2017). Total returns over all seasons are also positive, and account for up to 4%. These results are in line with previous findings on a positive sentiment bias in the Premier League (see Franck et al., 2011) and in La Liga (see Forrest & Simmons, 2008). Comparing the returns from Table 10 to our regression results, we find a positive and significant effect of DiffAttend for Serie A in 2006-2007, while the corresponding returns are negative for these two seasons - this again illustrates that bettors also have to beat the bookmakers’ margin to obtain positive returns.
Betting on favorites, that is, teams with a winning probability above 50%, leads to very small but positive returns of 0.5% in Serie A and 0.3% in the Premier League over the full observation period. However, there are vast differences in results across leagues. While betting on favorites in the Bundesliga leads to a positive return in only one season, nine such seasons can be observed in Serie A. For betting on heavy favorites with implied probabilities exceeding 0.7, results are pretty volatile, especially for early seasons. Over the full observation period, we find positive returns of 0.5% for Serie A only. However, returns are larger than the average negative margin for all leagues. Therefore, betting on (heavy) favorites is generally, a more promising strategy.
Discussion
This article analyses betting market inefficiencies in the long-term perspective. Such a perspective can reveal the frequency and persistence of biased odds and inefficiencies over time and compare such information to simulated, unbiased markets. This is particularly interesting in light of intensifying competition between bookmakers, leading to decreasing margins over time. While bookmakers had to improve their forecast precision, it could still be expected that periods of inefficiencies occur more often during recent years.
For the long-term analysis of the five major European football leagues in the “Real-World Betting Markets” section, we find that most inefficiencies leading to profitable opportunities to bettors are short-lived and do not occur persistently over time or systematically across leagues. Related, significant effects in the regression model do not necessarily lead to positive returns as some effects’ magnitude is insufficient to offset the bookmakers’ margins. On the other hand, effects can remain insignificant due to the fairly high standard errors of parameters for single seasons only while still leading to positive returns when simply applying the corresponding betting strategy for the same period. However, we do not find periods of inefficiencies more often during most recent years, implying that bookmakers successfully improved the predictive power of their betting odds. For further analyses regarding the returns of the different betting strategies, one might consider confidence intervals, as the returns reported throughout this article are only point estimates. In particular, one could consider resampling methods, such as bootstrapping, to obtain confidence intervals for the returns.
At the same time, our simulation-based analyses in the “Simulation-Based Analysis of Betting Markets” section show that markets temporarily record inefficiencies even when full market efficiency is assumed. For example, considering a potential home bias, our analyses disclose that there is a high probability of more than 75% of reporting a significant effect in at least one season out of a season-by-season analysis covering 14 seasons in total by chance only due to the Type I error of hypothesis testing. Therefore, it is not surprising that we find at least a small number of significant effects for different leagues and betting strategies in our analyses of the five major European football leagues. In addition, the simulation-based analyses indicate that it is more likely to reveal a positive than a negative effect of the same magnitude due to the structure of betting odds. This is particularly interesting in the light of a potential publication bias (Franco et al., 2014). Furthermore, the probability of disclosing significant effects is higher for the binary variable Home compared to the continuous-valued variable DiffAttend variable. While our results also show that the chance of detecting significant effects increases with the sample size (equivalent to a reduced risk of Type II error), it is less likely to find longer periods of inefficiencies with the chance to generate positive returns for bettors. Given that the probability of detecting a bias depends on the (true) underlying magnitude of the effect, it is vital for future research to explicitly incorporate the findings of prior studies. For instance, if previous research indicates the presence of a sentiment bias characterized by a relatively small effect size, one should anticipate the necessity of a larger data set to detect such a bias compared to a scenario where the bias exhibits a more substantial effect size.
Concluding, our results suggest that the occurrence of significant positive effects disclosed by a (logit) regression model applied to betting market data is not necessarily driven by systematic and persistent biases as partially implied by previous literature, but may be driven by statistical noise and chance. This is underlined by our simulation-based analysis of a fully efficient market regarding the home bias, where a considerable number of simulation runs lead to positive returns for single seasons and a few even over the full observation period. To address the trade-off on the length of the observation period, future research could refer to a rolling window approach by including multiple seasons in a single data set and applying regression models to those windows. In the light of discussions on the consequences of multiple testing (see e.g., Head et al., 2015), this would reduce the risk of misleading results due to chance only, while also allowing to disclose inefficient periods with the chance to generate positive returns of some consecutive seasons as the power of tests is increased. Nevertheless, our analyses suggest that, in the long run, there are (if any) only a few profitable betting strategies, driven mostly by the sentiment bias or by betting on (heavy) favorites, even in more recent seasons with lower bookmakers’ margins. In addition, returns are highly volatile and differ between seasons, suggesting that potential inefficiencies are short-lived and occur unsystematically.
Footnotes
Declaration of Conflicting Interests
The author(s) declared no potential conflicts of interest with respect to the research, authorship, and/or publication of this article.
Funding
The author(s) disclosed receipt of the following financial support for the research, authorship, and/or publication of this article: This work was supported by the Deutsche Forschungsgemeinschaft (Grant 431536450), which is gratefully acknowledged.