
Abstract
While second-tier stars lack popularity compared to superstars, their marginal contribution to team performance on the pitch relative to that of superstars is unknown. Relying on league-specific preseason market value distributions to define superstars and second-tier stars, we compare the marginal contributions of superstars and second-tier stars to team performance on the pitch in the top five European football leagues. Examining the impact of unexpected injury-related absences, we find that second-tier stars’ marginal contribution is at least equal to that of superstars. Thus, the players with arguably the highest costs for clubs do not contribute accordingly to short-run sportive success.
Introduction
Undoubtedly, the football players Lionel Messi and Cristiano Ronaldo would generally be considered superstars in the 2017/18 season of European football. Both football players were perceived as very talented and contributed to their teams’ performance on the pitch in a significant way. At the same time, they enjoy celebrity status and are known worldwide, as illustrated by their remarkable popularity on social media. For example, Cristiano Ronaldo was the second most-followed celebrity on Instagram in 2017, and Lionel Messi was among the top 10 celebrities who gained the most followers in 2017. 1
Consistent with Adler's (1985) theory on superstar formation, the examples above illustrate that superstars in European football seem to combine both high talent and high popularity. Adler (1985) proposed that in environments where new fans profit from network externalities by patronizing the most popular performers surrounded by the largest networks of existing fans, an initial popularity advantage can trigger a snowballing dynamic, attracting even more new fans. Consequently, superstar emergence can be driven by popularity effects with the capacity to superpose the role of talent (Adler, 1985). This prediction differs from Rosen's (1981) talent-based theory of superstar emergence, according to which superstar status is based solely on differences in talent, even if they are small. The talent differences are then leveraged into disproportionally high salaries through specific demand and supply conditions.
There is ample empirical evidence that European football superstars display “Adler star” characteristics. For example, Franck and Nüesch (2012) show that while talent increases the market values of football players, nonperformance-related popularity has an additional impact, particularly at the top of the market value distribution. In a joint examination of talent, popularity, and a player's agent bargaining power, Carrieri et al. (2018) show that popularity is the strongest predictor for wages in the top decile of Italian football players.
Having extremely popular players in the squad can benefit football clubs because such players typically attract more fans, leading to higher club revenues from ticket sales and merchandising (Brandes et al., 2008; Scarfe et al., 2021). Importantly, a player's popularity has, by definition, no immediate impact on the player's marginal contribution to team performance on the pitch. Higher popularity-related club revenues might lead to better overall team performance in the longer run, as teams with higher revenues can afford a more talented squad in the future. However, research suggests that European football clubs typically try to maximize their wins rather than their revenues (Garcia-del-Barrio & Szymanski, 2009) and often adopt a short-term perspective (Brechot & Flepp, 2020). Thus, maximizing short-term performance on the pitch seems an important goal for many football clubs.
Given that the popularity of a player does not help win games, it remains unclear to what extent “Adler stars” contribute to short-term team performance on the pitch. The popularity of “Adler stars” may even mask their potentially inferior contribution to team performance in comparison to that of other high-performing players with relatively little popularity. In this vein, players barely below superstar status—hereafter referred to as second-tier stars—are of interest. Compared to superstars, second-tier stars lack popularity, and their marginal contribution to team performance on the pitch relative to that of superstars remains unclear. A second-tier star's marginal contribution could be worse, equal, or even superior to that of a superstar.
While research on the performance impacts of superstars in team sports is extensive (Chen & Garg, 2018; Ferguson & Pinnuck, 2022; Taylor & Bendickson, 2021; Wegelin et al., 2022), second-tier stars have not been directly addressed and defined in previous research. Moreover, by applying performance-based definitions of superstars (Chen & Garg, 2018; Ferguson & Pinnuck, 2022; Wegelin et al., 2022), previous literature on team sports has conceptualized superstars predominantly in line with the perspective of Rosen (1981). Most importantly, a direct comparison of the marginal contributions of second-tier stars and superstars to team performance on the pitch in an “Adler star” setting is missing.
This paper aims to fill this research gap using data from the top five European football leagues from the 2016/2017 to 2018/2019 season. We classify players into superstars and second-tier stars relying on league-specific market value distributions from the website www.transfermarkt.com. Market values entail popularity and performance aspects (Franck & Nüesch, 2012), enabling us to capture superstars in line with Adler's (1985) theory of superstar emergence. We define superstars as players in the top 5% of a league's market value distribution (Franck & Nüesch, 2012), while second-tier stars are defined as those within the top 20%–5%. In this respect, we follow Wegelin et al. (2022), who argue that high-performing individuals are those in the top 20% of players.
Taking advantage of injuries as a proxy for unexpected player absences, we determine an individual's marginal contribution to team performance on the pitch. Player injuries are plausibly exogenous (Chen & Garg, 2018), and team performance in an individual's absence is considered a valuable measurement of his marginal contribution (Uribe et al., 2022). We collected over 9,600 injuries from the website www.transfermarkt.com. Once we aggregate this individual-level information to the team level, the final dataset covers 10,344 team performances in 5,172 games.
We measure team performance in terms of the goal difference in our analysis (Brandes et al., 2008; Franck & Nüesch, 2010; Peeters, 2018) and run ordinary least squares (OLS) regressions including team, season, and round fixed effects with robust standard errors clustered on games. The main independent variables are dummies indicating that a team played without at least one player from a specific player group (superstars, second-tier stars, remaining players) due to an injury. We control for the positions of the injured players and the home-field advantage in terms of whether the team played at home or on the road (Goumas, 2014; Nevill et al., 1996; Pollard & Gómez, 2009). We account for the opponent's strength in terms of the last season's final rank (Flepp & Franck, 2021; van Ours & van Tuijl, 2016). We also control for differences between teams that are not constant over time, such as a team's average preseason market value and whether a team had at least one superstar in a given season.
Our results show that the absence of at least one second-tier star significantly reduces the goal difference by 0.123 compared to teams without injured players. In contrast, the superstar coefficient is smaller in magnitude (−0.081) and statistically insignificant. Thus, a second-tier star's contribution to team performance on the pitch is at least equal to that of a superstar.
Our findings hold under alternative measurements of team performance in terms of points achieved per game and whether the team won, achieved a draw, or lost. We also run robustness tests for our independent variables by breaking down the second-tier star variable into the top 10%–5%, top 15%–10%, and top 20%–15% of players, which does not change the main interpretation of our results. In addition, we address the concern that our results might be driven by a coach's incentives to strategically rest superstar players when the team faces a weak opponent (Kaplan, 2022; Parvizi, 2022; Peeters, 2018) by differentiating between short-term and long-term absences of players. We find that the effects of long-term injured superstars and second-tier stars are similar, supporting our main results.
This paper makes several important contributions to the literature. First, we document the importance of second-tier stars in an “Adler star” setting. In such environments, second-tier stars seem as valuable in their marginal contribution to team performance on the pitch as superstars. Moreover, assuming that market values reflect a club's costs for players (Peeters, 2018), our findings imply that the superstars with the highest costs do not contribute to team performance on the pitch by the magnitude that their market value would suggest.
Second, our results suggest that the popularity differences at the top of the market value distribution in European football outweigh the talent differences. Thus, superstars with top market values are not (or at least are no longer) superstars because of their talent but rather, to a great extent, because of their popularity. Finally, our paper highlights that depending on how superstars are defined, the expectations regarding their value for team performance on the pitch can be very different. Our findings should be distinguished from the situation of an apparent “Rosen star” setting. The existence of both the “Adler star” and “Rosen star” definitions of superstars might explain some of the inconclusive findings regarding superstars’ contribution to team performance in the previous literature (Chen & Garg, 2018; Ferguson & Pinnuck, 2022; Taylor & Bendickson, 2021; Wegelin et al., 2022).
From a practical perspective, our findings imply that focusing on second-tier stars rather than superstars could be a promising strategy to improve the short-term cost–performance ratio, especially for managers under budget constraints. Moreover, for second-tier stars, an investment in professional popularity management alongside an investment in improvements to playing strength could increase their chances of becoming superstars in the future.
The remainder of this paper is structured as follows. In the second section, we discuss the theoretical background. In the third section, we describe the data, the variables of interest, and the empirical strategy. In the fourth section, we present the results. We run robustness tests and rule out alternative explanations in the fifth section. The sixth section concludes the paper.
Theoretical Background
Rosen's (1981) talent-based explanation of superstar emergence argues that mediocre quality is an imperfect substitute for outstanding quality in consumers’ perception. In many entertainment industries, modern media (most prominently TV) has allowed producers to dramatically increase their potentially served markets by reaching out to national and global audiences. Instead of being restricted to watching their mediocre local players and teams in the stadium as in the past, modern TV football consumers have the option to shift their viewership to those teams and players satisfying their demand for outstanding quality. Market demand automatically migrates to the teams delivering the highest quality, allowing them to attract and pay the most talented players, which again attracts further market demand. As a result, “superteams” and “superstar players” emerge. The most skilled players can command disproportional salaries compared to those of their slightly less talented colleagues because modern media allows many consumers to simultaneously switch demand at almost no cost if they perceive a small increase in quality. From the perspective of Rosen (1981), superstar status is thus based on differences in talent, even though they may be small. Thus, superstars should make the most significant contribution to team performance on the pitch.
However, seen through the lenses of Adler (1985), the emergence of superstars is possible in the absence of superior talent. Assume a situation with two equally talented performers but where one performer has already attracted a larger network of fans. Economies of joint consumption predict that new fans would profit if they patronized the more popular performer. The accumulation of consumption capital—accumulation of knowledge and information about the performer and her performances—generates higher payoffs for newcomers in the larger network of fans because it is easier to find cospecialized individuals with whom they can exchange views, be entertained, and enjoy joint performances. The case is similar to that of investing in learning a new language. Ceteris paribus, investment in a language such as English should generate higher payoffs than investment in, for example, Hungarian. The search costs of finding compatible counterparts for communication in English are much lower, and the exchange options are much higher. Positive network externalities imply that ceteris paribus, new fans profit from joining a larger network of fans, whether they are fans of a performer or fans of a language. According to Adler (1985), an initial advantage in popularity—whether its source is random or created through deliberate strategy—can snowball such that one of two equally talented performers emerges as a superstar. From this perspective, popularity factors co-influence superstar emergence, and it remains unclear whether, among all players, superstars have the most significant impact on team performance on the pitch.
Testing the theories of Adler (1985) and Rosen (1981) in the context of European football, Franck and Nüesch (2012) show that talent and nonperformance-related popularity explain market values in German football, while popularity is the strongest predictor within the top 5% of the market value distribution. Carrieri et al. (2018) jointly examine the effects of talent proxies (e.g., goals, assists, average grade per season), popularity proxies (number of yearly Google search queries per player), and proxies of a player's agent bargaining power (total market value of players whom a specific agent represents) and find the proxy of popularity to be the strongest predictor of earnings in the top decile of the salary distribution. 2
Building upon Franck and Nüesch (2012) and Carrieri et al. (2018), we assume European football to be, at least in part, an “Adler star” setting where popularity effects complement talent. A superstar's popularity, however, does not affect his marginal contribution to team performance on the pitch. Thus, in the presence of popularity superstars, individuals barely below superstar status—second-tier stars—are of interest here. Second-tier stars may be less popular, and their contribution to team performance might also be slightly inferior to that of superstars. Alternatively, second-tier stars may enjoy less popularity but contribute as much to team performance on the pitch as superstars. In extreme cases, second-tier stars might even be superior in terms of their marginal contribution to team performance on the pitch, with their contribution remaining largely underrated. Indeed, in a nonsports context, Groysberg et al. (2011) outline that superstars might not automatically be significantly better than second-tier stars. They describe that minimal gradations in performance ratings often separate financial analysts who are widely applauded by the public from analysts whose ratings are only just below the top four or five and who are never publicly recognized for their performance.
Previous research on the potential marginal contributions of superstars to team performance on the pitch in various team sports mostly interprets team sports to be a “Rosen star” setting. For example, examining injury-related changes in game lineups in Australian football, Ferguson and Pinnuck (2022) find that relative to substitutes, superstars—defined as the top 5% based on the league's most widely used quantitative performance rating—increase the chances of winning away games by 15 percentage points. Wegelin et al. (2022) rely on the top 20% of the wins produced statistics to define high performers in the NBA, a measurement based on various individual performance statistics, and capture a player's marginal contribution to winning. Team outcomes deteriorate when teams unexpectedly lose a high-performing team member in-game due to an injury (Wegelin et al., 2022). Chen and Garg (2018) find that a temporary absence of a superstar—defined as a player above the 90th percentile in terms of the league-wide value over replacement statistics (VORP), a proxy that assesses a player's performance-based importance to a team in the NBA—leads to a short-term breakdown of team performance. However, the absence of a superstar can be beneficial for a team in the longer term by helping the team overcome overreliance on a superstar (Chen & Garg, 2018).
Taylor and Bendickson (2021) are a notable exception in the literature since they rely on “Adler-based” definitions of superstars (all-star team selection). Taylor and Bendickson (2021) show that the marginal impact of superstars on team performance in Major League Baseball exceeds that of high performers (players within the top 5% in at least one of the performance categories of batting, fielding, and pitching). However, comparing high performers conceptualized as “Rosen superstars” to “Adler superstars” is different from the approach in our paper, in which we compare “Adler superstars” to “Adler second-tier stars.”
The performance-based definitions of superstars employed in the previous literature ignore the role of popularity factors in modern superstardom in times of mass media. Moreover, performance-based definitions of superstars and second-tier stars do not allow for an equally meaningful test of their ordinal contribution to team performance on the pitch because this is, at least partly, already inherent in the definition. By relying on market values, which combine both performance and popularity factors, we can properly assess the role of second-tier stars in football and investigate their importance for team performance relative to that of the “Messis” and “Ronaldos” of their sport.
Data and Model Specification
Data
Focusing on the top five European leagues (i.e., Premier League, La Liga, Serie A, Ligue 1, and 1. Bundesliga) between the 2016/2017 and 2018/2019 seasons 3 , we collect various information on players and teams, such as preseason team compositions, injuries, players’ corresponding team affiliations, positions (goalkeeper, defender, midfielder, striker), and market values at the beginning of each season, from the website www.transfermarkt.com.
We take advantage of injury-related absences to measure the effect of unexpected variation in player availability on team performance on the pitch. Injuries have previously been considered plausibly exogeneous in the sports field (Chen & Garg, 2018; Ferguson & Pinnuck, 2022; Wegelin et al., 2022). The injury reports from the website www.transfermarkt.com can be considered reliable. Leventer et al. (2016) cross-validate the data with available reference sources, and several studies in the field of sports health rely on transfermarkt's injury reports (Grassi et al., 2020; Marotta et al., 2021).
For every registered player, we gather details of the injury start and end dates, the absence duration, the injury type, the team with which the player was under contract while he was injured, and how many games a player missed while he was injured. 4 We also treat absences due to sickness as injuries because, similar to being injured, becoming ill with the flu is unexpected. We exclude absences where players did not miss any games and injuries of players who changed their clubs during the absence period. After we clean the data, our dataset contains information on over 7,500 player injuries.
The data on team performance are obtained from the website www.football-data.co.uk, a source that includes the final result, the date and the location of each game. Since all teams within a league play each other twice during the season, the full sample includes 5,172 games, resulting in 10,344 team performance observations.
Variables
The dependent variable measures team performance on the pitch in a single game in terms of the goal difference (Goal Difference), which has been used in earlier studies on European football (Brandes et al., 2008; Franck & Nüesch, 2010; Peeters, 2018). The goal difference is calculated as the difference between the goals scored and the goals conceded within a game.
Following the “Adler star” view that—apart from talent—popularity factors should be included to capture the superstar phenomenon appropriately (Adler, 1985; Asgari et al., 2021; Call et al., 2015), we rely on a league's market value distribution to define superstars. Market values capture the superstar phenomenon in European football appropriately for various reasons.
First, public opinion on who is a superstar is crucial for a player to achieve superstar status (Asgari et al., 2021). The market values from www.transfermarkt.com reflect this public opinion, as they are created by relying on the opinions of experts and an informed community (Peeters, 2018; Prockl & Frick, 2018). Second, it has previously been shown that transfermarkt's crowd-sourced market values include popularity and performance aspects (Franck & Nüesch, 2012). The reliance on a measurement that accounts for both popularity and performance is crucial because our argument regarding the unclear marginal contribution to team performance on the pitch of second-tier stars relative to that of superstars holds only in an “Adler star” setting. Third, several empirical studies argue that transfermarkt's market values are the most accurate available proxies for players’ salaries (Bryson et al., 2013; Peeters, 2018; Prockl & Frick, 2018). Similar to the substantial skewness of the salary distribution in Italian football (Lucifora & Simmons, 2003), the market value distribution in our sample is also right-skewed. Moreover, market values are used in contract negotiations and reflect, at least ordinally, the overall costs that clubs must incur for a particular player (Peeters, 2018). Finally, market values are advantageous because they allow us to rely on the same scale to define superstars and second-tier stars, which is crucial for capturing individuals barely below superstar status. In contrast, defining second-tier stars using other popularity-influenced measures of superstardom, such as selection to the all-star team (Taylor & Bendickson, 2021), would be challenging because the limited information available makes it very difficult to capture those who fell just short of making the all-star team.
We rely on the end-of-season market values (due date June 30) to determine players’ preseason market values, which serve as the basis for the formation of our status categories. We focus on the market value distribution within a given league and season, as teams make their investment decisions primarily in relation to the teams with which they directly compete (Franck & Nüesch, 2011).
We follow Franck and Nüesch (2012) and define the top 5% of a league's market value distribution as the threshold for superstar status. While still somewhat arbitrary, this definition follows previously applied superstar definitions in the context of sports (Ferguson & Pinnuck, 2022; Weinberg, 2016) and fulfills the requirement that only a minor share of individuals achieve superstar status (Lehmann & Schulze, 2008; Rosen, 1981). Brandes et al. (2008) define the top 2% of the league's market value distribution as superstars but consider the top 5% and the top 8% in their robustness tests.
Our use of the top 5% as the upper threshold to define second-tier stars is determined by our superstar definition, while we apply the top 20% as a lower threshold following Wegelin et al. (2022). Wegelin et al. (2022) argue that key players should be predominantly within the top 20%, reflecting the practitioner's rule that 20% of individuals account for 80% of output (Chen & Garg, 2018).
To build the main independent variables, we aggregate individual-level information on player injuries to the team level. We form dummy variables that capture whether a team is missing at least one player due to injury corresponding to a superstar (Superstar injured), second-tier star (Second-tier Star injured), or other player (Below Top20% injured). In addition, we form a variable capturing that at least one player was injured in a given game (Player injured) to estimate the effect of injured players on the goal difference in general.
The goal difference of a team in a specific game may be influenced by the position of injured players. For example, an injured first goalkeeper must be replaced by the second or third backup goalkeeper. This could have a direct negative effect on the goal difference because the backup goalkeeper may be more likely to fail to catch a simple shot. We build corresponding variables measuring how many players per position were missing in a given game (#Goalkeepers injured, #Defenders injured, #Midfielders injured, #Strikers injured). Moreover, this approach allows us to account for the overall number of injured players per team, which is also expected to affect team performance on the pitch.
To address the home advantage (Goumas, 2014; Nevill et al., 1996; Pollard & Gómez, 2009), we include a dummy variable Home indicating that a team played at home. Following van Ours and van Tuijl (2016) and Flepp and Franck (2021), we further control the strength of the opponent by including the league table rank of the opponent at the end of the previous season (Opponent Rank).
Furthermore, the marginal contribution to team performance on the pitch of superstars and second-tier stars could be influenced by the number of superstars in a team. Research has shown that the number of superstars has potentially diminishing marginal utility (Groysberg et al., 2011; Taylor & Bendickson, 2021). The best solution would be to control the number of superstars per team. In doing so, however, we would run into multicollinearity problems. 5 Unfortunately, we have to sacrifice some of the information available and address this issue by introducing a dummy capturing whether a team has any superstars in a given season (Superstar Team). However, to be transparent, Table A1 provides an overview of superstar and second-tier star teams along with the corresponding number of superstars and second-tier stars per season.
To control for an additional, nontime-constant difference between teams, we include the logarithm of the average preseason market value of a team (Ln AvgTeam MV) to account for the fact that teams with higher wage expenditures can afford more talented squads, which may lead to better performance on the pitch (Frick & Simmons, 2008; Madsen et al., 2018).
Finally, we include team, season, and round fixed effects in our baseline regressions to control for unobserved but time-constant differences across teams, seasons, and rounds.
Table 1 depicts the summary statistics for the main variables. In 88.4% of the team performance observations, teams had at least one injury-related absence. In 11.6% of all team performances, teams had to cope with an injury-related absence of at least one superstar, and in 30.5% of the cases, teams played without at least one second-tier star. For the playing position variables, defenders tend to be injured more often than strikers or midfielders, while goalkeepers are least likely to be injured. On average, approximately one defensive player per team was missing in a game. In addition, 31.1% of the team performance observations in our dataset have at least one superstar.
Descriptive Statistics of the Main Variables.
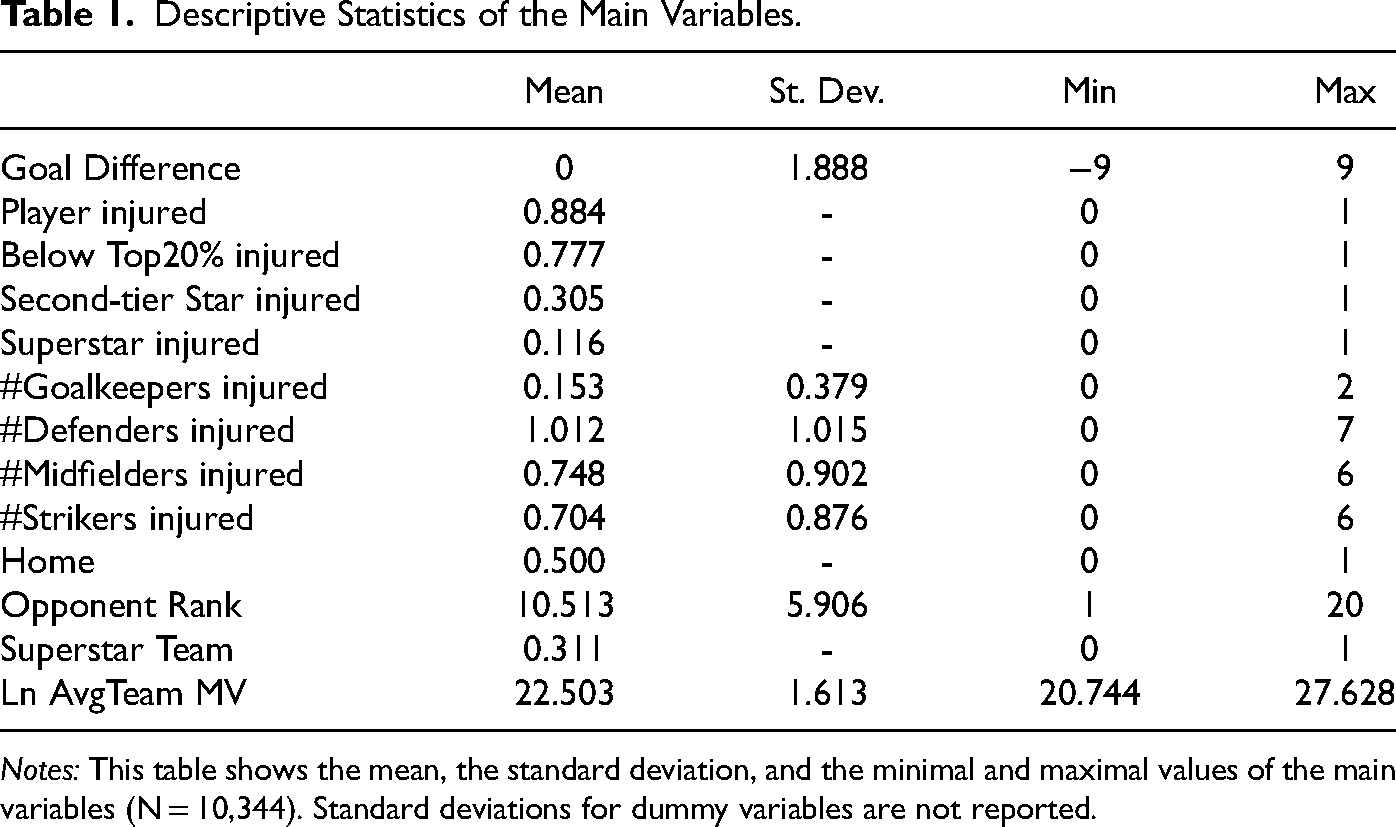
Notes: This table shows the mean, the standard deviation, and the minimal and maximal values of the main variables (N = 10,344). Standard deviations for dummy variables are not reported.
Model Specification
We run OLS regressions including season, round, and team fixed effects and calculate robust standard errors clustered on games to account for the fact that games are not independent to each other, as every game appears twice in our analysis. We explain the Goal Difference for team i in season t in a specific round m in game g as indicated by equation (1). The set of controls Wi,t,m,g contains all the position controls and the home game dummy. Xi,t includes the controls for superstar teams and team strength. Zi,t−1,m,g captures the opponent's last season rank. 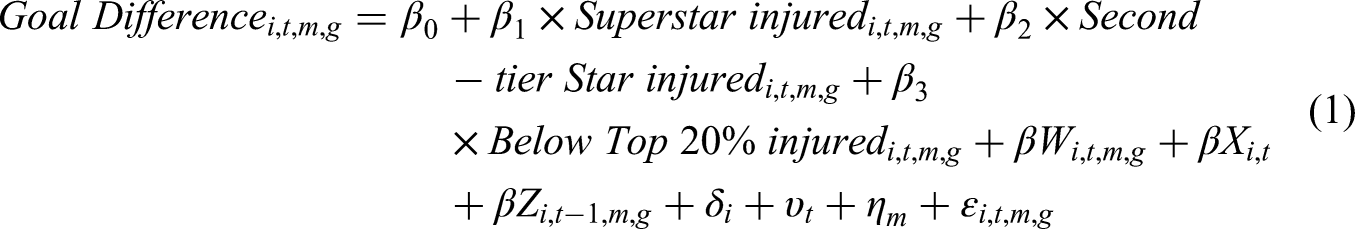
Results
The findings designed to compare second-tier stars’ and superstars’ marginal contributions to team performance on the pitch are shown in Table 2. We first estimate the overall effect of the absence of at least one injured player by the variable Player injured in column (1). In column (2), we focus on the effects of player injuries within status groups: the superstars (Superstar injured), the second-tier stars (Second-tier Star injured), and the remaining players (Below Top20% injured).
Regression Analysis on the Effect of Injured Superstars, Second-Tier Stars, and Remaining Players.
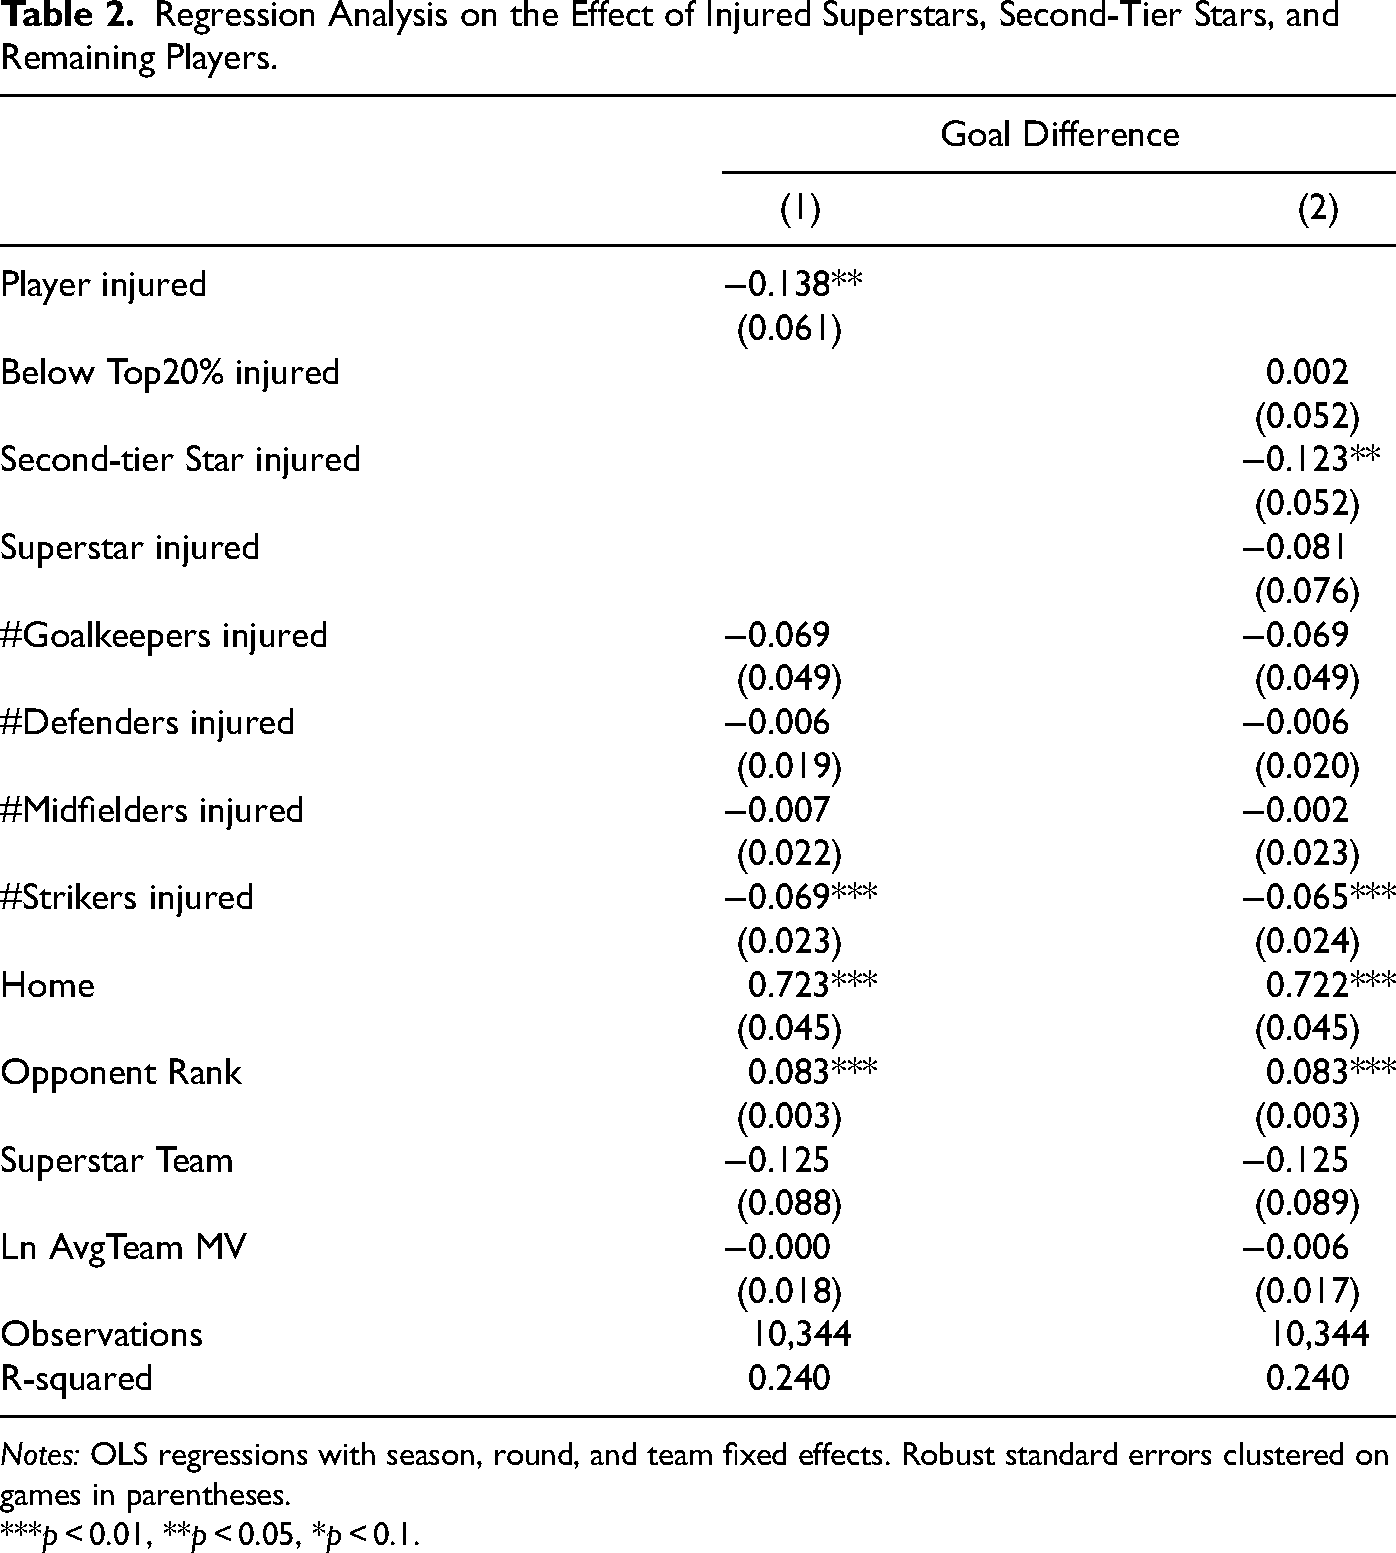
Notes: OLS regressions with season, round, and team fixed effects. Robust standard errors clustered on games in parentheses.
***p < 0.01, **p < 0.05, *p < 0.1.
Injuries decrease the goal difference in general, as indicated by the negative and significant coefficient on Player injured in column (1) of Table 2. On average, teams dealing with at least one injured player are associated with a 0.138 lower goal difference than teams with the whole squad available. Column (2) of Table 2 reveals that the coefficient of the indicator for an injury-related absence of at least one superstar (Superstar injured) is negative (−0.081) and statistically insignificant. The coefficient on Second-tier Star injured is also negative (−0.123) but statistically significant at the 5% level. The coefficient of the indicator for injured players who are neither superstars nor second-tier stars (Below Top20% injured) is slightly positive (0.002) but statistically insignificant. The regression results reveal that compared to teams without injury-related player absences, teams with at least one second-tier star absent have a significantly lower goal difference of 0.123.
To draw conclusions about the differences between the marginal contributions to team performance on the pitch of superstars and second-tier stars, we test the null hypothesis that the coefficients on Superstar injured (−0.081) and Second-tier Star injured (−0.123) are equal. The Wald test results in an F statistic of 0.23. With a p-value of 0.634, we cannot reject the null hypothesis of equality of the coefficients. This implies that although injuries to second-tier stars have a significant negative effect on the goal difference that is also more pronounced than the effect of injured superstars, the two coefficients are not significantly different from each other. We thus conclude that the marginal contribution to team performance on the pitch of superstars and second-tier stars is equal.
We further test the null hypothesis of the equality of the Second-tier Star injured and Below Top20% injured coefficients. The Wald test shows an F statistic of 3.44. The corresponding p-value of 0.064 allows us to reject the null hypothesis of equality of the coefficients at the 10% level. Thus, injury-related absences of second-tier stars have a more pronounced effect on the goal difference than injury-related absences of the remaining players. Stated differently, second-tier stars’ marginal contribution to team performance on the pitch is superior to that of the players below the top 20% of the market value distribution.
Regarding the estimated coefficients of our controls, it is noteworthy that the number of injured strikers has a significantly negative effect on the goal difference, while the other position controls remain statistically insignificant. We further confirm previous findings on the home advantage. We find that on average, teams that play at home have a significantly higher goal difference than teams that play on the road, as indicated by the variable Home. Finally, as expected, playing against an opponent with a higher league table rank in the last season (Opponent Rank) significantly increases the goal difference, while the remaining controls do not significantly affect the goal difference.
Robustness Tests
Alternative Specifications
This section aims to validate the robustness of our results by means of other operationalizations of team performance and different measurements of our key independent variables.
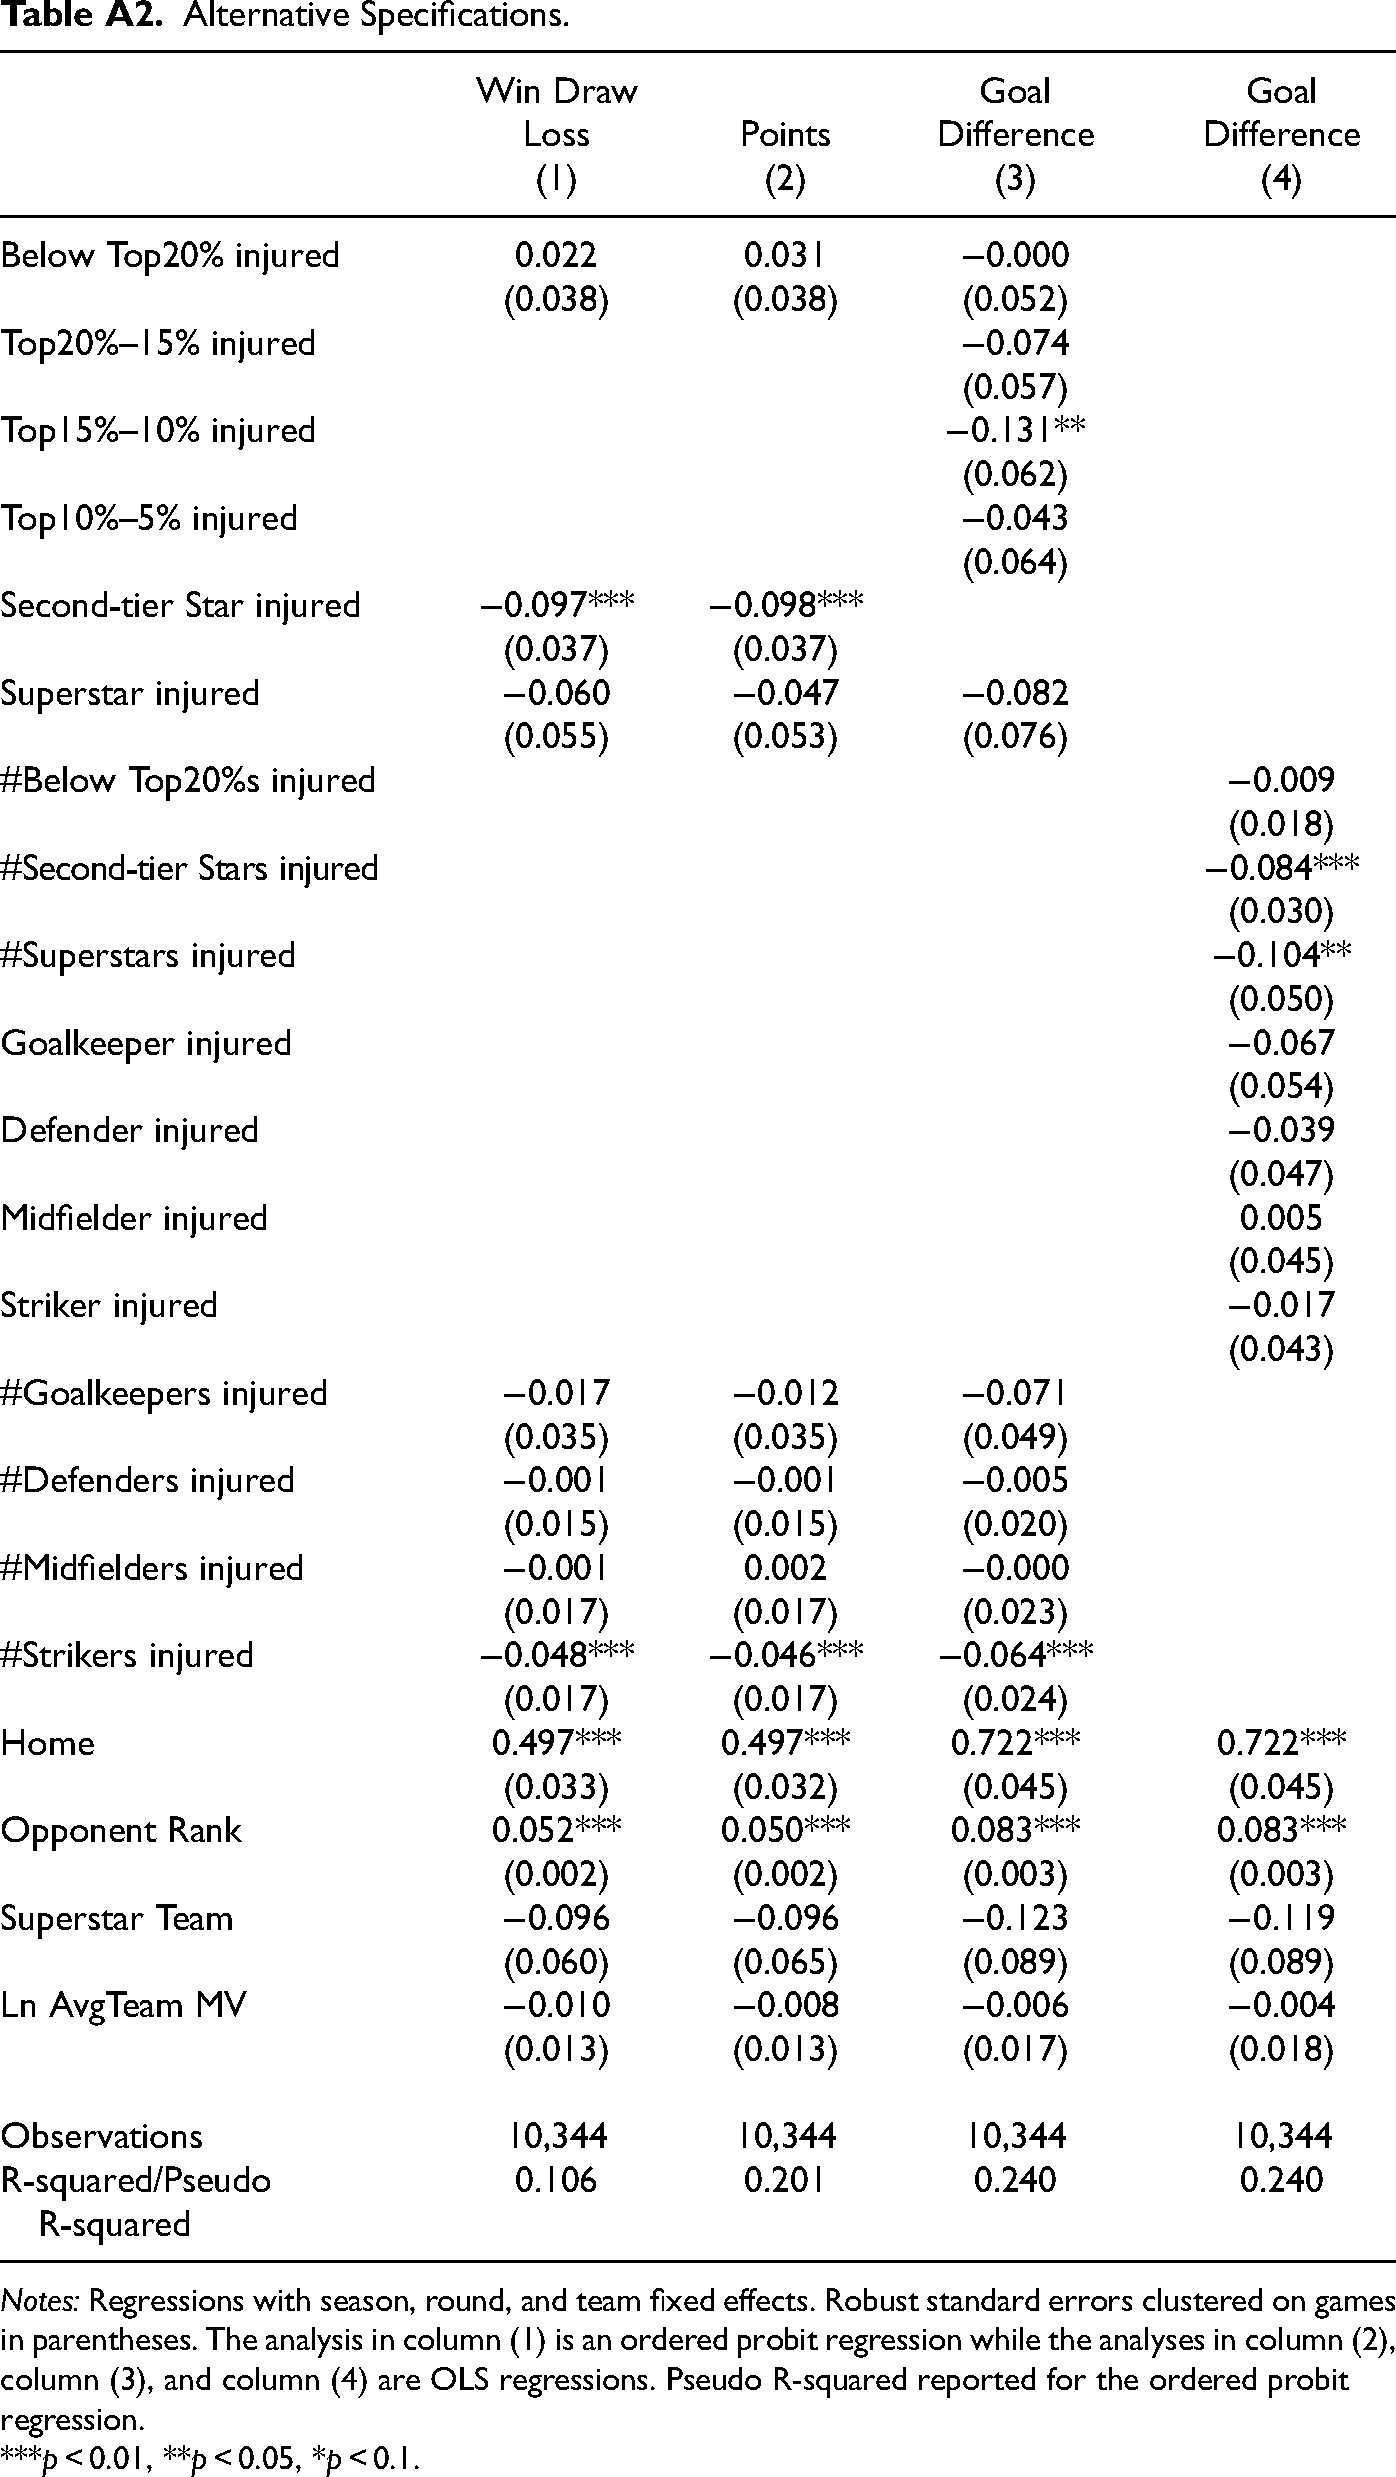
We start with alternative measurements of team performance that have previously been used in studies on European football (Franck & Nüesch, 2010; Peeters, 2018; van Ours & van Tuijl, 2016). To capture a game's final result, we reestimate our main regression equation using an ordinal variable Win Draw Loss, which captures whether a team won the game, achieved a draw, or lost the game. Additionally, we regress the effects of our leading independent variables on the number of points achieved per game (Points), a variable with the value of three for games won, the value of one for games ending in a draw, and the value of zero for games lost. We first run an ordered probit regression with the dependent variable Win Draw Loss. Then, we run an OLS regression with the dependent variable Points. Column (1) and column (2) of Table A2 in the appendix depict the results of the regression analyses. The results remain robust to these alternative measures of team performance. We confirm that a second-tier star's talent is at least equal to that of a superstar.
In the next step, we focus on variations in the independent variables in our baseline regression. We examine the individual quantiles of second-tier stars in more detail by investigating the impacts of injury-related absences of players within the top 10%–5%, the top 15%–10%, and the top 20%–15% of the league-specific market value distribution separately. By doing so, we address the concern that our results could be influenced by the comparison of many players (second-tier stars) with a few players (superstars).
Column (3) of Table A2 illustrates the OLS regression analysis results with the corresponding dummy variables Superstar injured, Top10%–5% injured, Top15%–10% injured, Top20%–15% injured, and Below Top20% injured, capturing that at least one player was injured per player category. The results show that the only significant coefficient (−0.131) captures injury-related absences of players within the top 15%–10% of a league's market value distribution (Top15%–10% injured). Thus, our results are not driven by the fact that we compare many players with few players.
Finally, we change our choice to operationalize our main independent variables as dummies because it likely makes a difference whether one or several players are injured simultaneously. We modify our regression equation by replacing the dummies indicating whether at least one player from a given category was absent with variables that measure how many players per category were injured in a given game (#Superstars injured, #Second-tier Stars injured, #Below Top20%s injured). To prevent multicollinearity, we simultaneously replace the controls for the number of injured players per position with dummy variables capturing that at least one player per position was absent (Goalkeeper injured, Defender injured, Midfielder injured, Striker injured). The results in column (4) of Table A2 show that the superstar effect is slightly more pronounced (−0.104) than the second-tier star coefficient (−0.084) in this specification. Nonetheless, we cannot reject the null hypothesis that the two coefficients are equal (p-value = 0.717). 6
Overall, our conclusions remain unchanged irrespective of the team performance measurement used and the various operationalizations of our leading independent variables employed.
Alternative Explanations
In this section, we evaluate two potential alternative explanations for our results. We first address the possibility that our results could be driven by coaches’ decision to strategically rest key players. Then, we focus on the potential concern that our results could be driven by the quality of substitute players in superstar teams.
European football teams simultaneously participate in various competitions, such as domestic leagues, domestic cups, and European competitions. Such a setting provides incentives for coaches to engage in strategic resting of key players in nondecisive games (Parvizi, 2022; Peeters, 2018). Ahead of a decisive game (e.g., Champions League final), coaches may want to conserve the forces of key players such as superstars. In the NBA, consecutive games and the competitiveness of the opponents, among others, have been cited as driving incentives to rest key players (Kaplan, 2022). 7 Coaches’ decision to strategically rest key players may be an omitted variable in our baseline analysis. Suppose that superstars tend to rest more against weaker opponents; then, the absence of superstars is likely to be less damaging. This could, for example, explain why the superstar coefficient is smaller in magnitude than the second-tier star coefficient and statistically insignificant in our analysis.
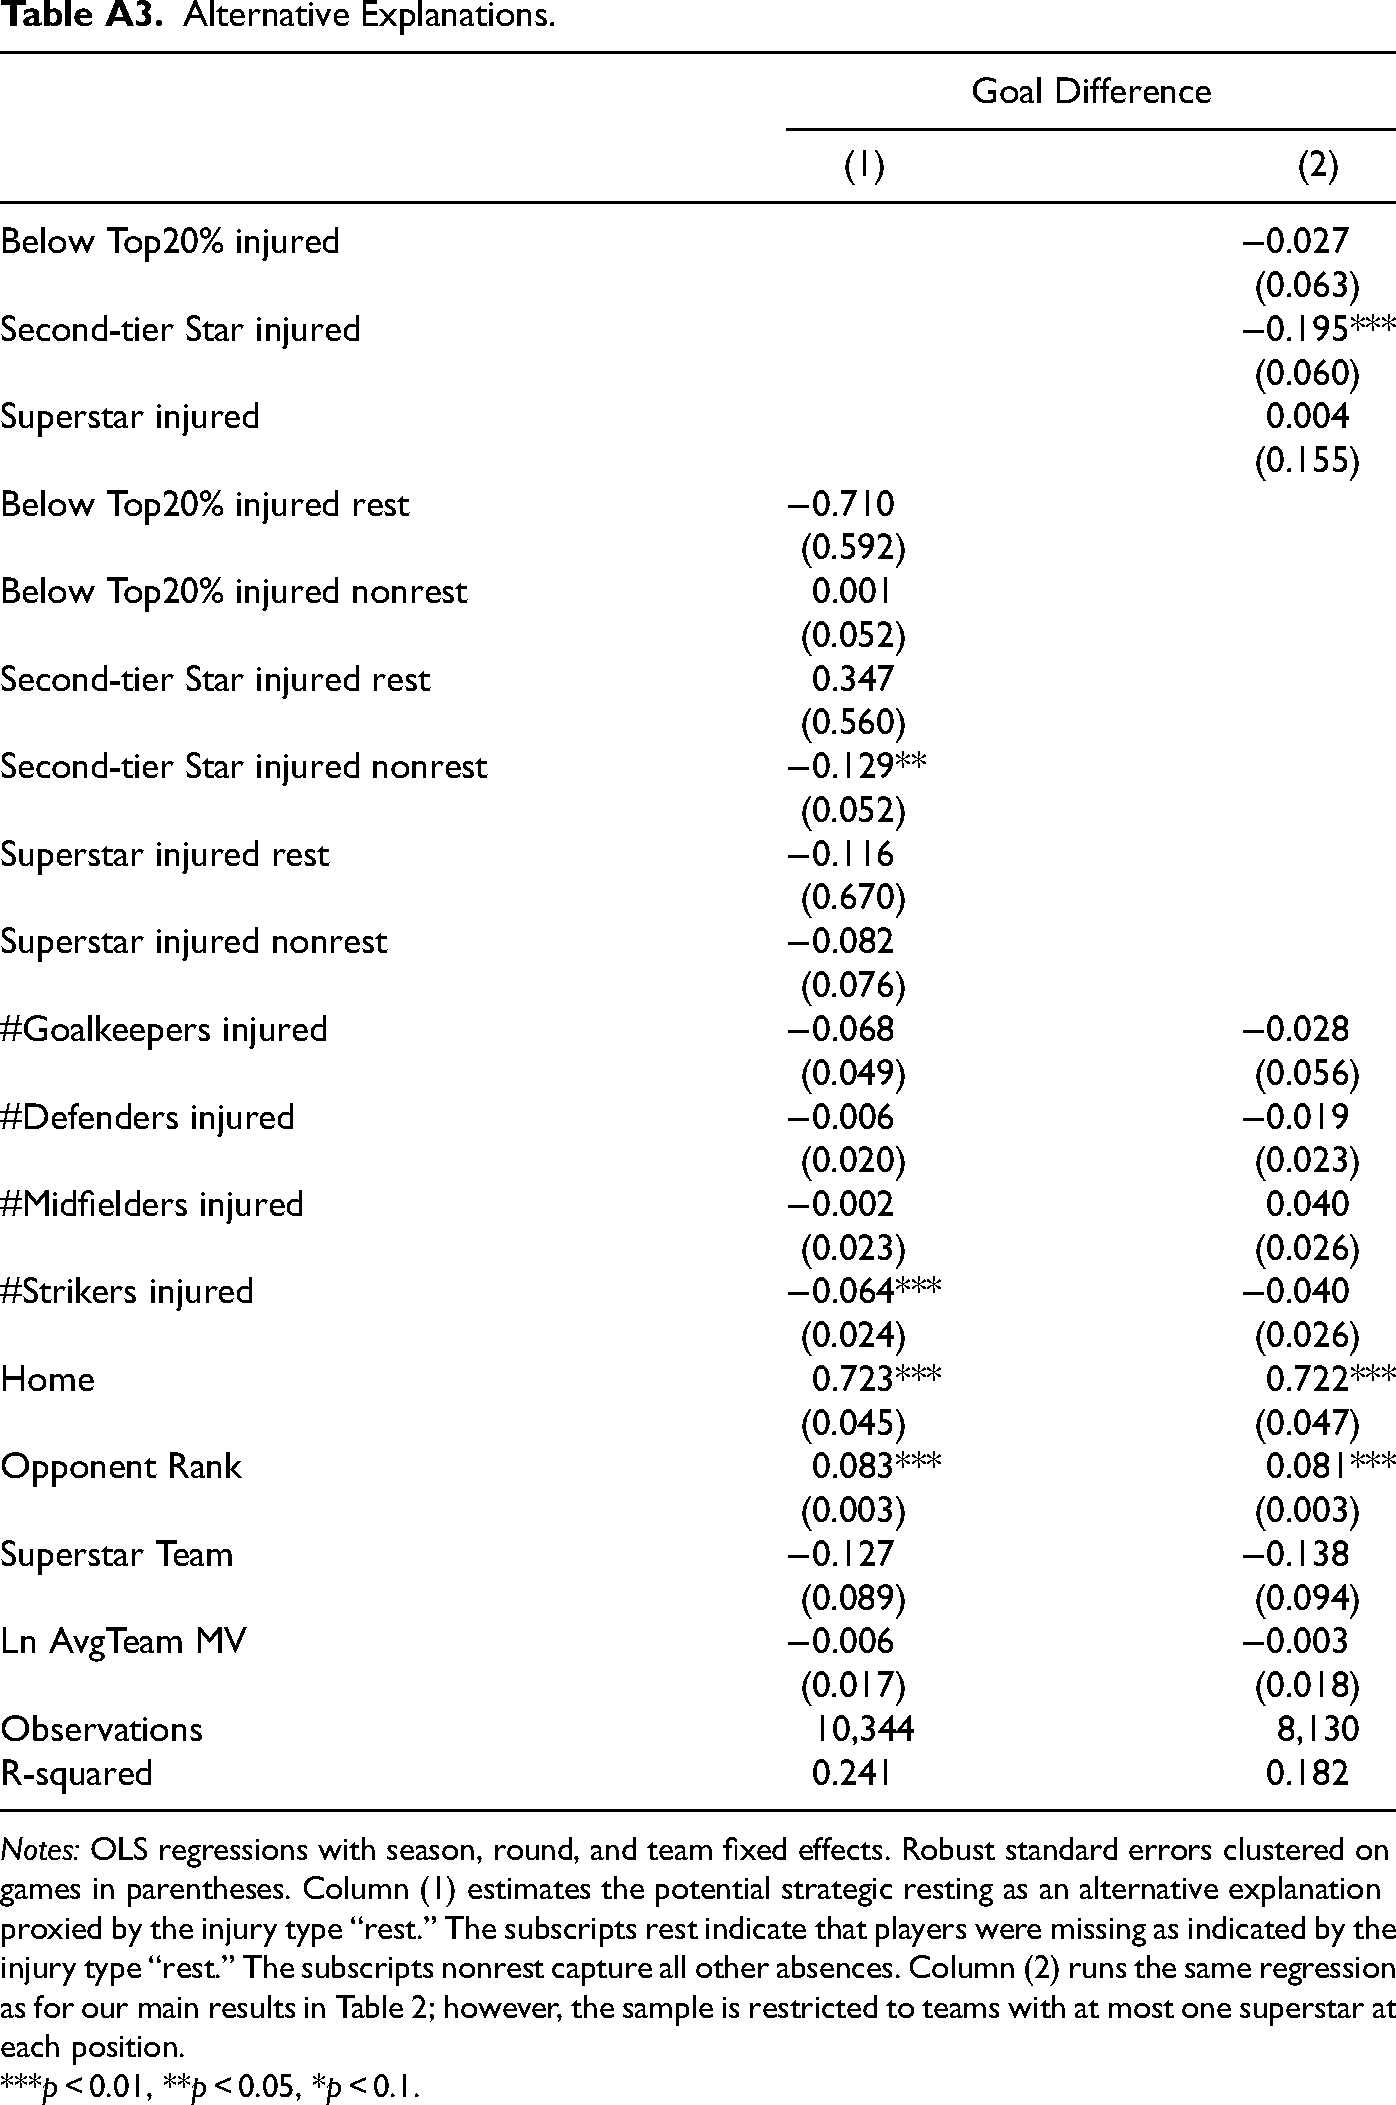
Because we have detailed information about the reasons for absences, we are able to capture the potential resting of players. In particular, we observe a specific “rest” injury type in our dataset. We reestimate our baseline regression by splitting each of our main variables into two groups. We form dummies indicating whether the absence was due to rest (Superstar injured rest, Second-tier Star injured rest, Below Top20% injured rest) or any other reason (Superstar injured nonrest, Second-tier Star injured nonrest, Below Top 20% injured nonrest).
The regression analysis in column (1) of Table A3 depicts that our main results do not seem to be driven by strategically resting superstars. The pattern is very similar to that in our main analysis. The coefficient of Second-tier Star injured nonrest is −0.129 and statistically significant, while the coefficient of Superstar injured nonrest is −0.082 and statistically insignificant. Moreover, the two superstar coefficient coefficients Superstar injured rest (−0.116) and Superstar injured nonrest (−0.082) are not significantly different from each other (p-value = 0.959).
There are, however, specific issues with the “rest” injury type that require further investigation. This absence type covers, on the one hand, resting for nonspecified reasons and, on the other hand, periods where players were still recovering from an injury. Moreover, injuries are principally self-reported, and some coaches and clubs rest their key players under the pretense of injury, citing a minor injury or illness (Ferguson & Pinnuck, 2022). To address this, we need an additional test that covers the potential strategic resting of key players under the guise of injuries or sickness.
Our second strategy relies on a combination of absence duration and missed games. The first condition that we include to capture possible resting covered under minor injuries is missing only one game. However, depending on the league's schedule, our conditioning on missing only one game is not sufficient. For example, injuries ahead of the last game of the preliminary round (or even the end of the season) automatically mean that players have to miss only one game, even if they are injured for a duration of, for example, three weeks. We thus add the second condition of absence duration smaller than or equal to three days. We argue that this absence duration quite appropriately captures the concealed resting often indicated by reasons such as soreness, cold, and sickness (Ferguson & Pinnuck, 2022). The underlying reason is that the strategic resting of key players is unlikely to be reported as an injury with a duration of more than three days, as the training participation of key players is essential for all players (Franck & Nüesch, 2010; Hamilton et al., 2003).
We again form two groups out of our leading independent variables by comparing short-term absences where players missed one game and were absent for no more than three days (Superstar injured short-term, Second-tier Star injured short-term, and Below Top20% injured short-term) with longer-term absences (Superstar injured long-term, Second-tier Star injured long-term, and Below Top20% injured long-term).
The results in Table 3 show that only longer-term injured second-tier stars (Second-tier Star injured long-term) have a significant negative effect on the goal difference (−0.110). Second-tier stars’ potential absences covered by the pretense of minor injuries have a negative but insignificant effect on the goal difference, as indicated by the coefficient Second-tier Star injured short-term (−0.151). Most importantly, the superstar coefficient for nonresting absences (Superstar injured long-term) is −0.104 and statistically insignificant. Thus, the marginal contributions of longer-term injured second-tier stars and longer-term injured superstars are again similar (p-value = 0.951), suggesting that our results are unlikely to be driven mainly by a coach's decision to strategically rest superstars.
Strategic Resting of Key Players Proxied by Short-Term and Long-Term Absences as Alternative Explanation.
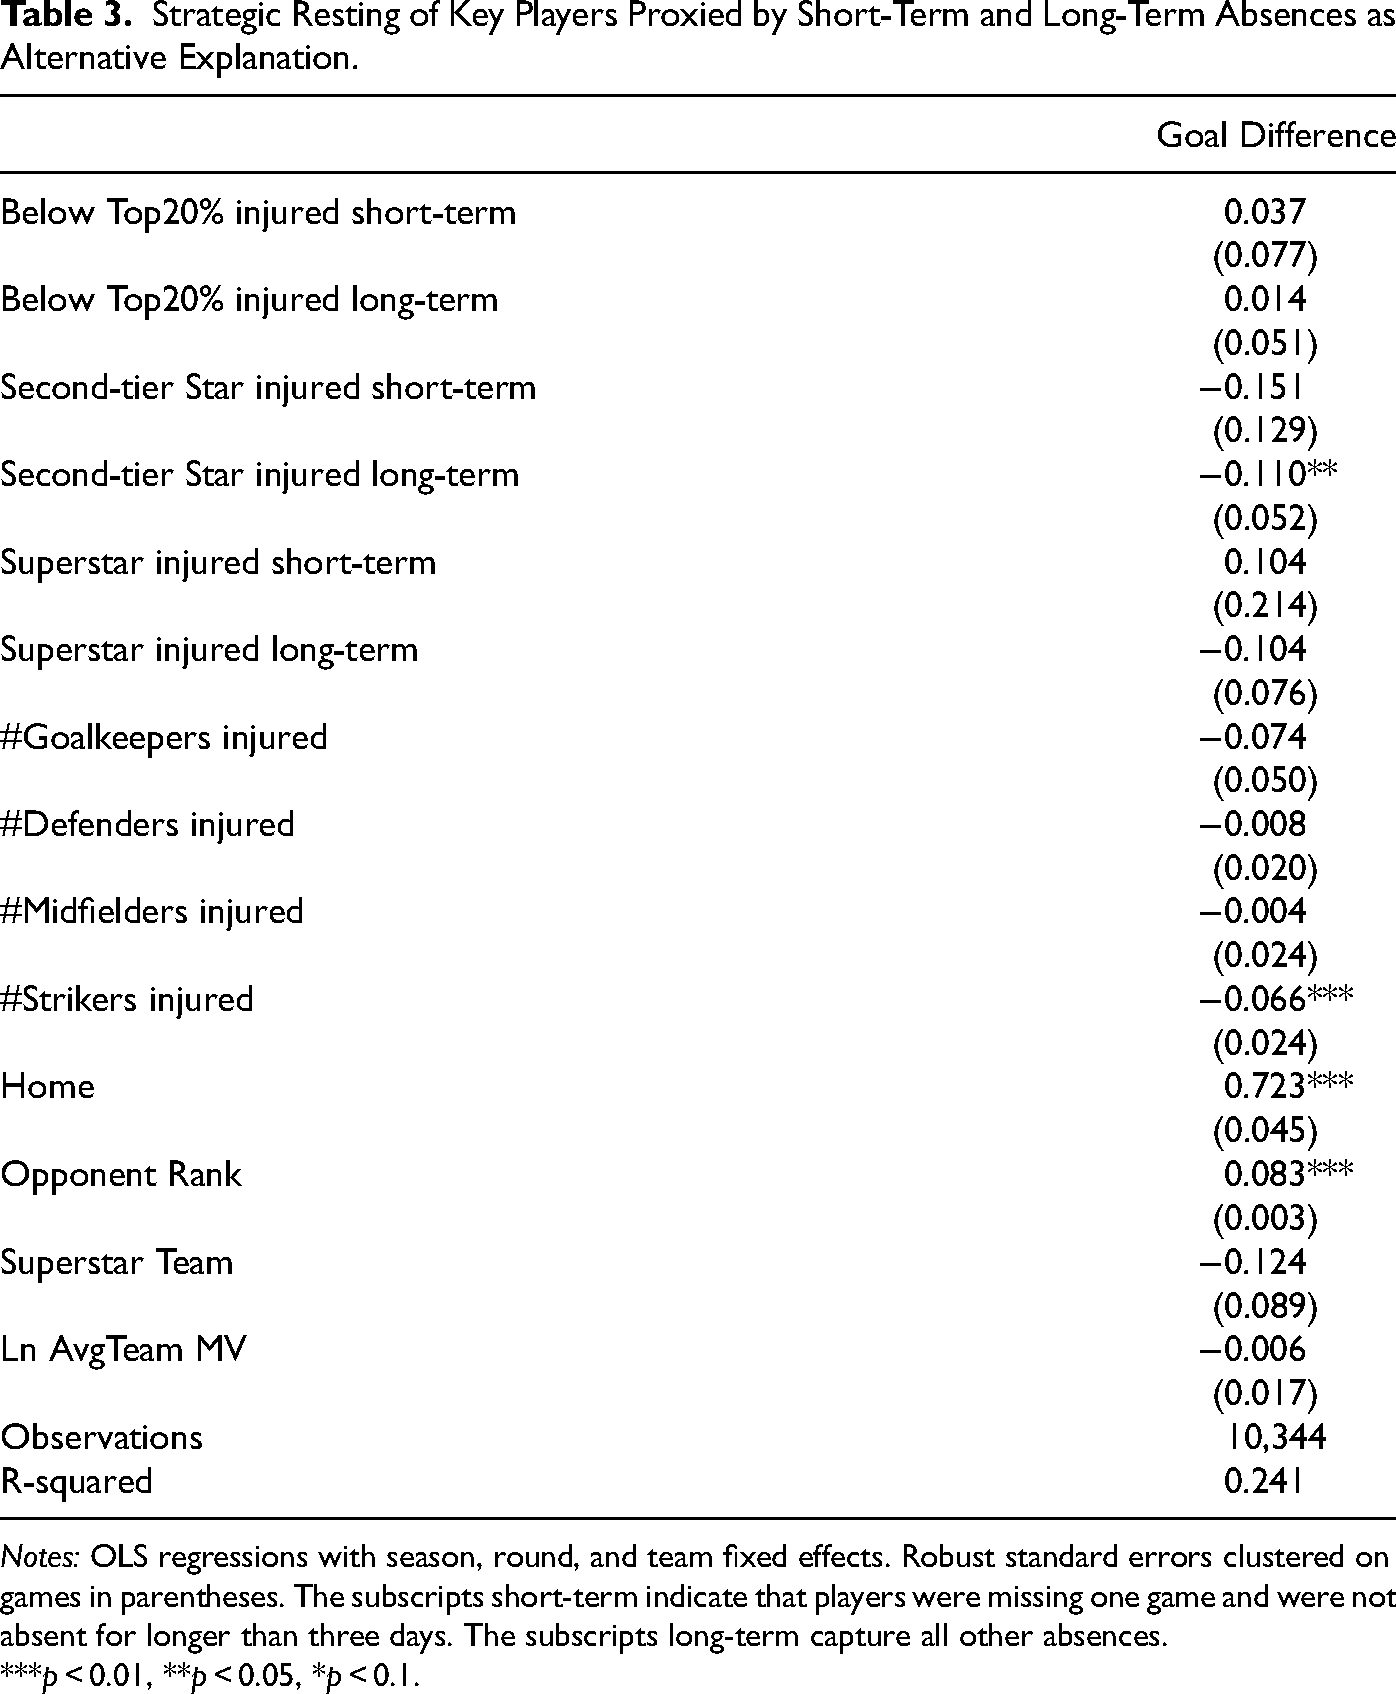
Notes: OLS regressions with season, round, and team fixed effects. Robust standard errors clustered on games in parentheses. The subscripts short-term indicate that players were missing one game and were not absent for longer than three days. The subscripts long-term capture all other absences.
***p < 0.01, **p < 0.05, *p < 0.1.
Another explanation for why the effect of injured superstars is weaker than that of second-tier stars could be the quality of the substitutes. Suppose that teams with many superstars tend to have better replacement players than teams with second-tier stars. Superstar teams might then be better at cushioning the effects of injured players than teams with second-tier stars. This concern is already implicitly addressed in the robustness tests in column (3) of Table A2, where we estimate the impacts of superstars, the top 10%–5%, the top 15%–10%, and the top 20%–15% separately. If the substitution explanation is valid, we would expect the effect of players from the top 10%–5% to be more pronounced than the effect of superstars. Moreover, we would expect the effects of players from the top 15%–10% and the top 20%–15% to become successively more pronounced. However, because the coefficient on Top10%–5% injured is −0.043 and thus not larger in magnitude than the coefficient on Superstar injured (−0.082), the results in column (3) of Table A2 show that better substitutes are unlikely to be the main driver of our results.
We also address this concern with a second strategy by introducing a third-tier player group in our analysis. If superstar teams tend to have better substitutes than second-tier star teams, the same should be true for second-tier star teams compared to third-tier player teams. Moreover, this additional analysis allows us to test the validity of our main argument that compared to superstars, second-tier stars lack popularity and that their contribution to team performance on the pitch relative to that of superstars is unclear. Because neither second-tier stars nor third-tier players are expected to exhibit strong popularity, the ordinal ranking of the market value distribution should reflect their contribution to team performance.
We define third-tier players as players belonging to the top 35%–20% of the market value distribution (Third-tier Player injured) to include the same number of quantiles as we do for the second-tier stars. The remaining players are captured with the coefficient Below Top35% injured. Table 4 reveals that while the superstar coefficient is similar to that in our main regression analysis (−0.070), the second-tier star coefficient is −0.112, the coefficient for the third-tier players is −0.004, and the coefficient for the remaining players is 0.066. The second-tier star coefficient is significant at the 5% level, while the remaining player categories’ coefficients are insignificant. We test for the equality of second-tier stars’ and third-tier players’ coefficients. The Wald test results in an F statistic of 3.01. With a p-value of 0.083, we reject the null hypothesis of equality of second-tier stars (Second-tier Star injured) and third-tier players (Third-tier Player injured) at the 10% level. We conclude that this pattern of results is inconsistent with the substitution argument. Moreover, third-tier players are significantly worse than second-tier stars in their marginal contribution to team performance on the pitch, reaffirming our main argument.
Quality of Substitutes as Alternative Explanation.
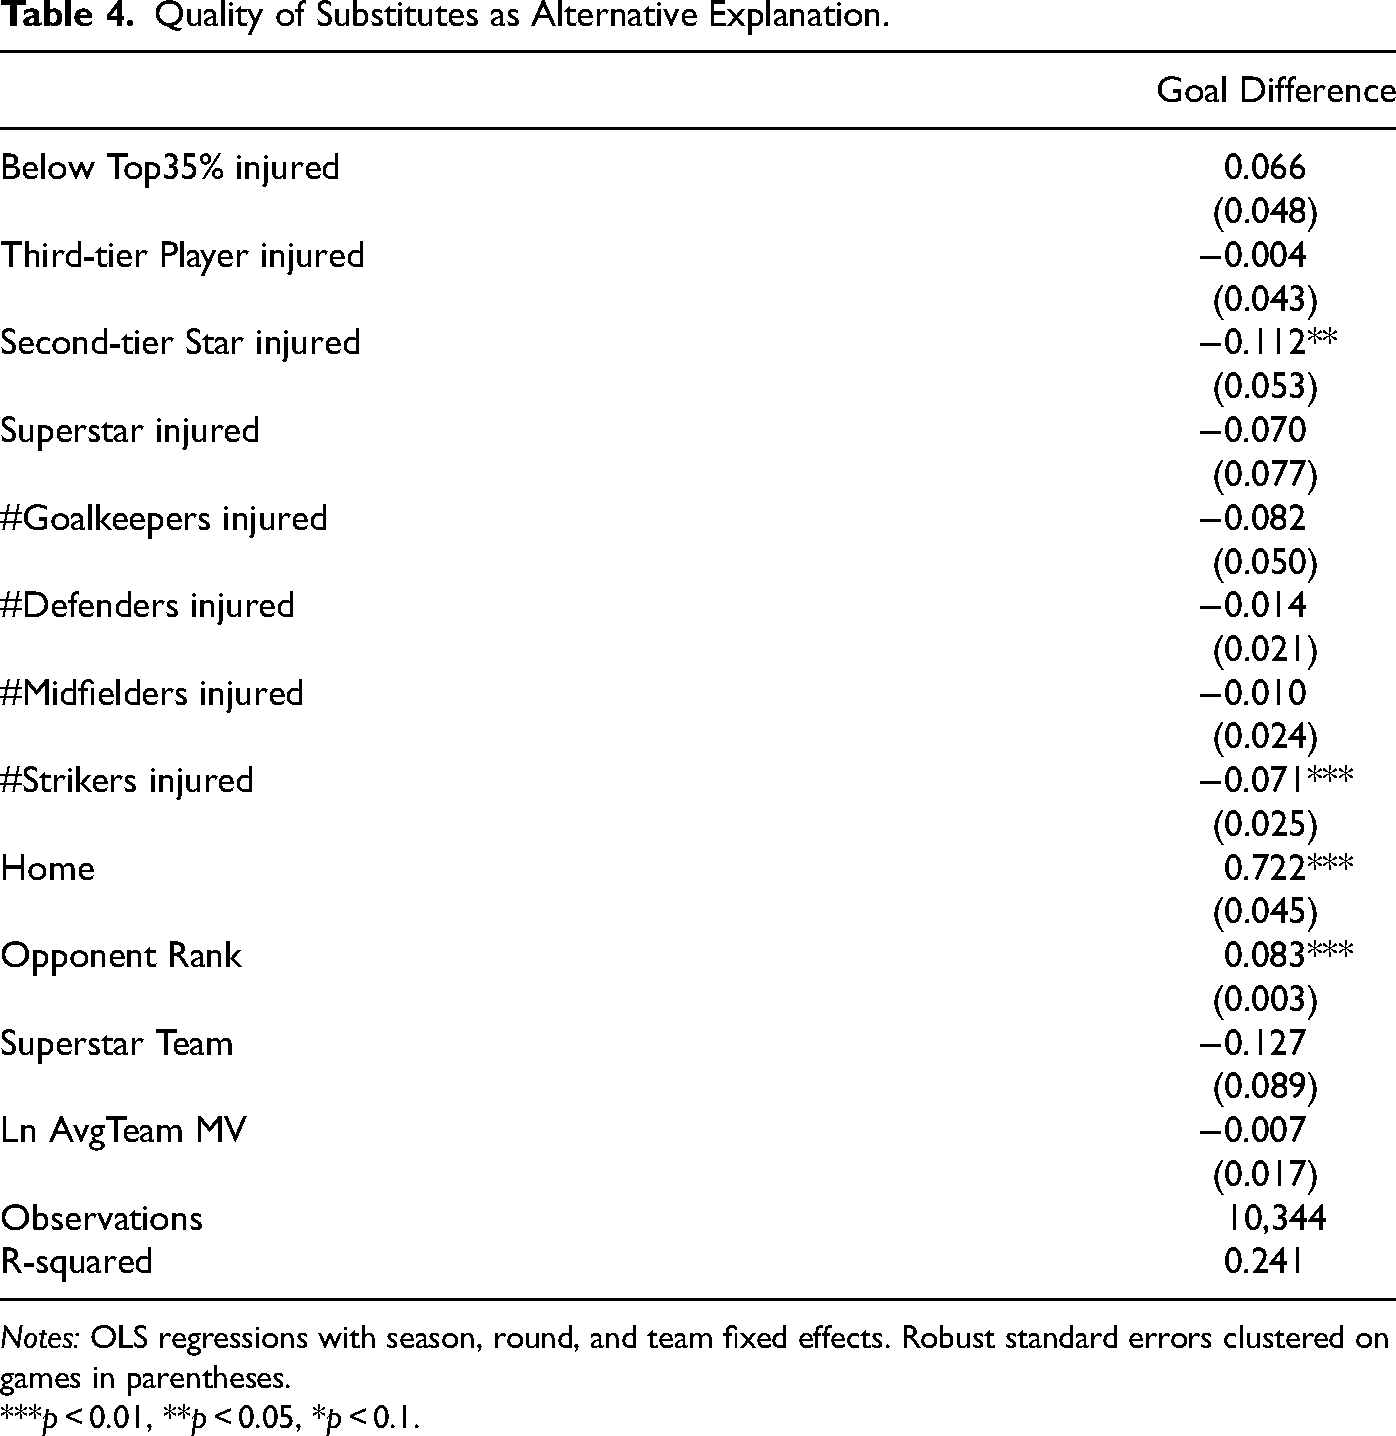
Notes: OLS regressions with season, round, and team fixed effects. Robust standard errors clustered on games in parentheses.
***p < 0.01, **p < 0.05, *p < 0.1.
Finally, to further address the concern that we might underestimate the effect of an injured superstar in teams with many superstars, we restrict our sample to teams with at most one superstar at each position. The restriction requires us to drop 2,214 observations. Column (2) of Table A3 reveals that the Second-tier Star injured coefficient (−0.195) is larger in magnitude compared to Table 2 (−0.123). The Superstar injured coefficient turns positive but remains insignificant, and the Second-tier star injured coefficient is not significantly different from the Superstar injured coefficient (p-value of 0.229). Thus, our main results also hold for this restricted sample. 8
Conclusion
We compare the marginal contributions of superstars and second-tier stars to team performance on the pitch in the top five European soccer leagues by defining superstars and second-tier stars based on league-specific preseason market value distributions. We find that the marginal contribution of second-tier stars is at least as high as that of superstars, exploiting injury-related absences to determine this contribution. Under the assumption that market values reflect, at least ordinally, the overall costs that clubs pay for a particular player, we show that superstars who arguably carry the highest costs for clubs do not contribute the most to team performance on the pitch. Their comparatively unpopular, less expensive, but still highly productive peers—the second-tier stars—appear to be just as important in the short term.
Our paper contributes to the literature by being the first to present evidence on the importance of second-tier stars in an “Adler star” setting, an environment where popularity factors co-influence superstar emergence. Although we find no significant difference between the effects of the unexpected absence of superstars and second-tier stars, our comprehensive comparison of the marginal contribution of superstars and second-tier stars to team performance on the pitch underlines that second-tier stars are at risk of being underestimated due to their lack of popularity. In particular, our results imply that at the upper end of the market value distribution, additional popularity rather than additional marginal contributions to team performance on the pitch is crucial for achieving superstar status.
However, two limitations of our paper must be highlighted. First, because our estimation strategy of marginal contributions to team performance on the pitch relies on injury-related absences, we cannot entirely rule out that incentive effects of noninjured players might partly explain our findings. In individual sports, a superstar's presence or absence influences contest participants’ incentives in terms of effort or risk taking (e.g., Babington et al., 2020; Brown, 2011; Meissner et al., 2021). As the presence of a superstar has an adverse incentive effect by reducing other players’ efforts in golf (Brown, 2011), the injury-related absence of a superstar may increase noninjured players’ efforts. However, the presence of a superstar has also been shown to lead to motivating effects in golf and alpine skiing, at least among lower-ranked athletes (Babington et al., 2020). From this perspective, the effect of an injury-related superstar absence on noninjured players’ effort remains ambiguous. Moreover, if enhanced efforts of noninjured focal players or decreasing efforts of noninjured opponent players are the main drivers of our results, we would expect the second-tier star coefficient to decrease in magnitude when we restrict our sample to teams without superstars, as in teams without superstars, the second-tier stars are the “team-specific stars.” However, as limiting the sample to teams without superstars leads to more pronounced estimates for injured second-tier stars, we are confident that the effort effects of noninjured players are not the primary source of our findings.
Second, our analysis relies on estimated market values because reliable salary information on European football players is not publicly available. Thus, some caution is warranted when interpreting our results in terms of player salaries. However, while transfermarkt's market values might understate some players’ true values (Coates & Parshakov, 2022), scholars continue to argue that transfermarkt's market values are the best publicly available proxy for salaries and/or transfer fees (e.g., Bryson et al., 2013; Prockl & Frick, 2018).
Our findings have several practical implications. Under the assumption that market values can be interpreted as proxies for the overall costs incurred by a club for a single player (Peeters, 2018), football managers can potentially achieve a better cost–performance ratio by investing in second-tier stars rather than superstars to increase playing strength in the short run. However, we do not argue that superstars are generally overvalued in European football because the popularity of superstars can have positive spillover effects on revenues from merchandising and ticket sales in the longer term. Furthermore, football professionals should become aware of the importance of popularity factors at the upper end of the market value distribution. In this regard, an improvement in self-promotion skills and an investment in professional popularity management could be beneficial for second-tier stars. By strategically improving their popularity, second-tier stars can improve their chances of becoming superstars in the future.
Footnotes
Acknowledgements
The authors would like to thank seminar participants at the University of Zurich and participants at the ESEA 2022 conference in Helsinki for their constructive feedback.
Declaration of Conflicting Interests
The author(s) declared no potential conflicts of interest with respect to the research, authorship, and/or publication of this article.
Funding
The author(s) received no financial support for the research, authorship, and/or publication of this article.
Notes
Author Biographies
Appendix
Teams that Employ Superstars and Second-Tier Stars from the 2016/2017 Season Until the 2018/2019 Season. Notes: This table only lists teams that employed superstars and/or second-tier stars during the period covered by our paper. Teams that employed neither superstars nor second-tier stars are not listed. Alternative Specifications. Notes: Regressions with season, round, and team fixed effects. Robust standard errors clustered on games in parentheses. The analysis in column (1) is an ordered probit regression while the analyses in column (2), column (3), and column (4) are OLS regressions. Pseudo R-squared reported for the ordered probit regression. ***p < 0.01, **p < 0.05, *p < 0.1. Alternative Explanations. Notes: OLS regressions with season, round, and team fixed effects. Robust standard errors clustered on games in parentheses. Column (1) estimates the potential strategic resting as an alternative explanation proxied by the injury type “rest.” The subscripts rest indicate that players were missing as indicated by the injury type “rest.” The subscripts nonrest capture all other absences. Column (2) runs the same regression as for our main results in Table 2; however, the sample is restricted to teams with at most one superstar at each position. ***p < 0.01, **p < 0.05, *p < 0.1.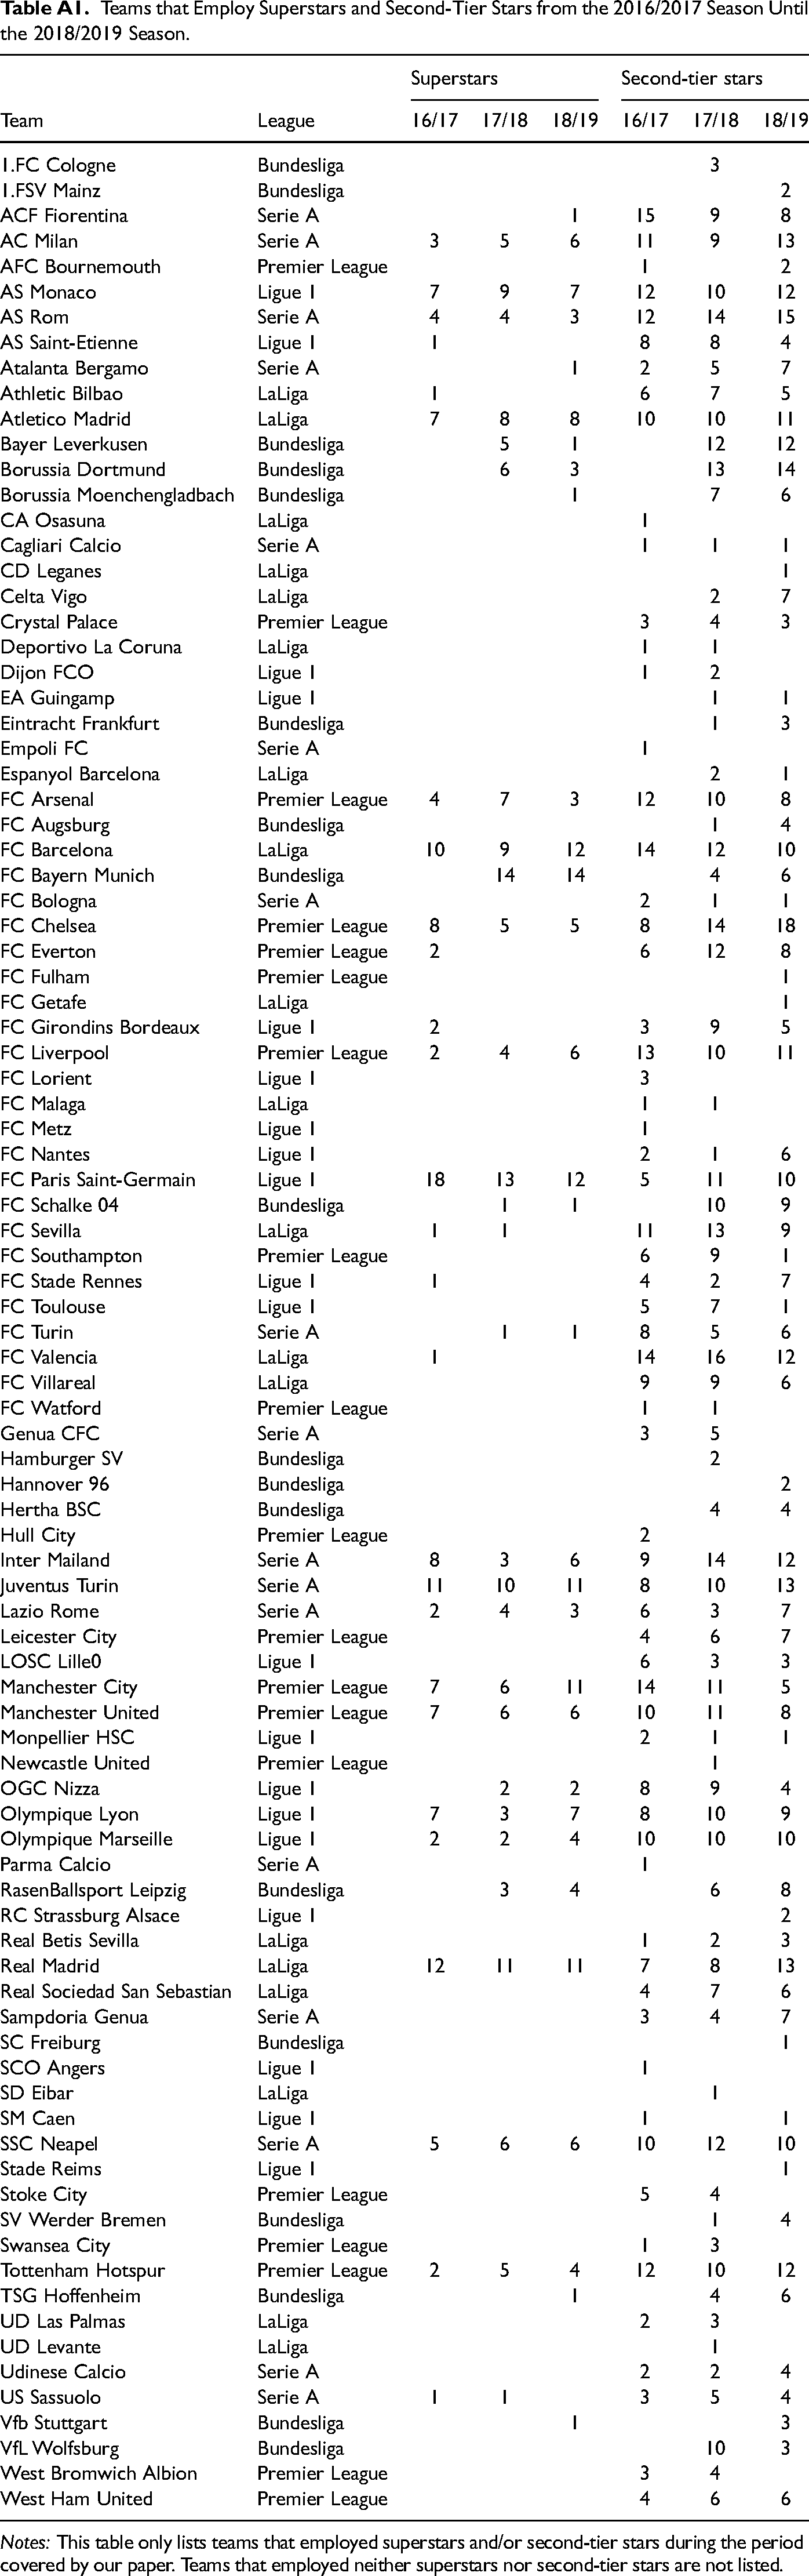
Superstars
Second-tier stars
Team
League
16/17
17/18
18/19
16/17
17/18
18/19
1.FC Cologne
Bundesliga
3
1.FSV Mainz
Bundesliga
2
ACF Fiorentina
Serie A
1
15
9
8
AC Milan
Serie A
3
5
6
11
9
13
AFC Bournemouth
Premier League
1
2
AS Monaco
Ligue 1
7
9
7
12
10
12
AS Rom
Serie A
4
4
3
12
14
15
AS Saint-Etienne
Ligue 1
1
8
8
4
Atalanta Bergamo
Serie A
1
2
5
7
Athletic Bilbao
LaLiga
1
6
7
5
Atletico Madrid
LaLiga
7
8
8
10
10
11
Bayer Leverkusen
Bundesliga
5
1
12
12
Borussia Dortmund
Bundesliga
6
3
13
14
Borussia Moenchengladbach
Bundesliga
1
7
6
CA Osasuna
LaLiga
1
Cagliari Calcio
Serie A
1
1
1
CD Leganes
LaLiga
1
Celta Vigo
LaLiga
2
7
Crystal Palace
Premier League
3
4
3
Deportivo La Coruna
LaLiga
1
1
Dijon FCO
Ligue 1
1
2
EA Guingamp
Ligue 1
1
1
Eintracht Frankfurt
Bundesliga
1
3
Empoli FC
Serie A
1
Espanyol Barcelona
LaLiga
2
1
FC Arsenal
Premier League
4
7
3
12
10
8
FC Augsburg
Bundesliga
1
4
FC Barcelona
LaLiga
10
9
12
14
12
10
FC Bayern Munich
Bundesliga
14
14
4
6
FC Bologna
Serie A
2
1
1
FC Chelsea
Premier League
8
5
5
8
14
18
FC Everton
Premier League
2
6
12
8
FC Fulham
Premier League
1
FC Getafe
LaLiga
1
FC Girondins Bordeaux
Ligue 1
2
3
9
5
FC Liverpool
Premier League
2
4
6
13
10
11
FC Lorient
Ligue 1
3
FC Malaga
LaLiga
1
1
FC Metz
Ligue 1
1
FC Nantes
Ligue 1
2
1
6
FC Paris Saint-Germain
Ligue 1
18
13
12
5
11
10
FC Schalke 04
Bundesliga
1
1
10
9
FC Sevilla
LaLiga
1
1
11
13
9
FC Southampton
Premier League
6
9
1
FC Stade Rennes
Ligue 1
1
4
2
7
FC Toulouse
Ligue 1
5
7
1
FC Turin
Serie A
1
1
8
5
6
FC Valencia
LaLiga
1
14
16
12
FC Villareal
LaLiga
9
9
6
FC Watford
Premier League
1
1
Genua CFC
Serie A
3
5
Hamburger SV
Bundesliga
2
Hannover 96
Bundesliga
2
Hertha BSC
Bundesliga
4
4
Hull City
Premier League
2
Inter Mailand
Serie A
8
3
6
9
14
12
Juventus Turin
Serie A
11
10
11
8
10
13
Lazio Rome
Serie A
2
4
3
6
3
7
Leicester City
Premier League
4
6
7
LOSC Lille0
Ligue 1
6
3
3
Manchester City
Premier League
7
6
11
14
11
5
Manchester United
Premier League
7
6
6
10
11
8
Monpellier HSC
Ligue 1
2
1
1
Newcastle United
Premier League
1
OGC Nizza
Ligue 1
2
2
8
9
4
Olympique Lyon
Ligue 1
7
3
7
8
10
9
Olympique Marseille
Ligue 1
2
2
4
10
10
10
Parma Calcio
Serie A
1
RasenBallsport Leipzig
Bundesliga
3
4
6
8
RC Strassburg Alsace
Ligue 1
2
Real Betis Sevilla
LaLiga
1
2
3
Real Madrid
LaLiga
12
11
11
7
8
13
Real Sociedad San Sebastian
LaLiga
4
7
6
Sampdoria Genua
Serie A
3
4
7
SC Freiburg
Bundesliga
1
SCO Angers
Ligue 1
1
SD Eibar
LaLiga
1
SM Caen
Ligue 1
1
1
SSC Neapel
Serie A
5
6
6
10
12
10
Stade Reims
Ligue 1
1
Stoke City
Premier League
5
4
SV Werder Bremen
Bundesliga
1
4
Swansea City
Premier League
1
3
Tottenham Hotspur
Premier League
2
5
4
12
10
12
TSG Hoffenheim
Bundesliga
1
4
6
UD Las Palmas
LaLiga
2
3
UD Levante
LaLiga
1
Udinese Calcio
Serie A
2
2
4
US Sassuolo
Serie A
1
1
3
5
4
Vfb Stuttgart
Bundesliga
1
3
VfL Wolfsburg
Bundesliga
10
3
West Bromwich Albion
Premier League
3
4
West Ham United
Premier League
4
6
6
Win Draw Loss
Points
Goal Difference
Goal Difference
(1)
(2)
(3)
(4)
Below Top20% injured
0.022
0.031
−0.000
(0.038)
(0.038)
(0.052)
Top20%–15% injured
−0.074
(0.057)
Top15%–10% injured
−0.131**
(0.062)
Top10%–5% injured
−0.043
(0.064)
Second-tier Star injured
−0.097***
−0.098***
(0.037)
(0.037)
Superstar injured
−0.060
−0.047
−0.082
(0.055)
(0.053)
(0.076)
#Below Top20%s injured
−0.009
(0.018)
#Second-tier Stars injured
−0.084***
(0.030)
#Superstars injured
−0.104**
(0.050)
Goalkeeper injured
−0.067
(0.054)
Defender injured
−0.039
(0.047)
Midfielder injured
0.005
(0.045)
Striker injured
−0.017
(0.043)
#Goalkeepers injured
−0.017
−0.012
−0.071
(0.035)
(0.035)
(0.049)
#Defenders injured
−0.001
−0.001
−0.005
(0.015)
(0.015)
(0.020)
#Midfielders injured
−0.001
0.002
−0.000
(0.017)
(0.017)
(0.023)
#Strikers injured
−0.048***
−0.046***
−0.064***
(0.017)
(0.017)
(0.024)
Home
0.497***
0.497***
0.722***
0.722***
(0.033)
(0.032)
(0.045)
(0.045)
Opponent Rank
0.052***
0.050***
0.083***
0.083***
(0.002)
(0.002)
(0.003)
(0.003)
Superstar Team
−0.096
−0.096
−0.123
−0.119
(0.060)
(0.065)
(0.089)
(0.089)
Ln AvgTeam MV
−0.010
−0.008
−0.006
−0.004
(0.013)
(0.013)
(0.017)
(0.018)
Observations
10,344
10,344
10,344
10,344
R-squared/Pseudo R-squared
0.106
0.201
0.240
0.240
Goal Difference
(1)
(2)
Below Top20% injured
−0.027
(0.063)
Second-tier Star injured
−0.195***
(0.060)
Superstar injured
0.004
(0.155)
Below Top20% injured rest
−0.710
(0.592)
Below Top20% injured nonrest
0.001
(0.052)
Second-tier Star injured rest
0.347
(0.560)
Second-tier Star injured nonrest
−0.129**
(0.052)
Superstar injured rest
−0.116
(0.670)
Superstar injured nonrest
−0.082
(0.076)
#Goalkeepers injured
−0.068
−0.028
(0.049)
(0.056)
#Defenders injured
−0.006
−0.019
(0.020)
(0.023)
#Midfielders injured
−0.002
0.040
(0.023)
(0.026)
#Strikers injured
−0.064***
−0.040
(0.024)
(0.026)
Home
0.723***
0.722***
(0.045)
(0.047)
Opponent Rank
0.083***
0.081***
(0.003)
(0.003)
Superstar Team
−0.127
−0.138
(0.089)
(0.094)
Ln AvgTeam MV
−0.006
−0.003
(0.017)
(0.018)
Observations
10,344
8,130
R-squared
0.241
0.182