
Abstract
This paper empirically examines the determinants of Summer Olympic success during the period 1996-2016. By modifying the panel Tobit estimator using the Mundlak transform, the results find that population size and the host effect are the only statistically significant determinants of Olympic attainment. We also show that participating in front of a home crowd will stimulate athletic performance equally for each gender, but the impact of population differs between the sexes. These findings are confirmed using a hurdle estimator. This relaxes the assumption that the factors determining Olympic success are the same as those that influence the quantity of success.
Introduction
Using the correct economic models to gauge how successful a country will be at the Olympic Games is important, as large sums of money are often invested in elite athlete training. The accuracy of these models is pivotal, as the ability to benchmark performance, given a nation’s resources, may influence the willingness to fund elite sports.
For example, the Canadian government spent C$110 m on a program called “Own the Podium” between 2006-2010, focused on enhancing Canadian performance at the Vancouver Winter Olympics (Humphreys et al., 2016). At an annual cost of C$13 per household, prior to the Games, 54% of survey respondents were happy to pay this fee. But after a successful Winter Olympics by Team Canada, who finished third in the medal table, 81% of Canadians were happy to maintain this level of funding. Therefore, willingness to fund elite athletes is success driven, with funders expecting results from their spending.
If a team is correctly found to overperform at the Games, then it may enable a National Olympic Committee (NOC) to lobby the government for greater expenditure on sport. This then may be used to support the strongest medal candidates.
Performance is usually benchmarked using the two main determinants of Olympic attainment, population and income. However, countries with similar sized populations and income levels often exhibit wide disparities in their Olympic attainment. What may explain this unexplained component of Olympic success are time-invariant, country-specific unobservables.
Therefore, this paper examines whether the previously identified determinants of Olympic success, according to Bernard and Busse (2004), become insignificant once unobservable, time-invariant country-specific factors are included in the economic model. This is done by applying the Mundlak correction to the standard Tobit model. If these variables are found to lose their explanatory power upon this change, existing models used to allocate funding would need revisiting.
In further regressions we relax the assumption that a single mechanism determines if countries are successful at the Games, and how much success they achieve, by implementing both the Cragg and Heckman hurdle models. Once again, we apply the Mundlak correction to these models.
The main results show that when the Mundlak correction is used in our empirical specification, only two variables remain statistically significant. These include: the size of a country’s population and the host effect. When using the hurdle models, we show that population size matters more in determining whether or not a country is successful, whereas hosting the Games helps to explain both whether a nation will be successful, and how successful they will be. We further find that the correlates of Olympic success, in particular political orientation, have reduced in importance over time, complementing Noland & Stahler (2017).
This paper further contributes to the academic literature in several ways. First, by considering time-invariant country-specific unobservables in our modeling, we build upon work by Tcha & Pershin (2003) and Groot (2008) who claim that a nation’s Olympic success is because of comparative advantage. Kenya’s unique physical landscape has given them a comparative advantage in long distance running, where based upon their population percentages alone, the odds of them dominating these events should be one in a billion (Groot, 2008). Unmeasurable cultural factors can also lead to a comparative advantage, such as India’s strong preference for cricket, directing talent and resources away from Olympic sports, explaining their poor attainment.
Second, this paper changes how certain variables are measured. In doing so, rather than examining the effect of total population size on Olympic performance, this paper focuses on population of the working age (15–65), providing more precise estimates.
Furthermore, as De Bosscher et al. (2008) state, the definition of Olympic success is typically expressed in absolute terms, such as the total number of medals that a country wins. However, other Olympic federations have broader targets. Some are to increase Olympic participation, (Johnson & Ali, 2004), while others are merit-based. Canada’s objective at the Rio Olympics in 2016 was to improve the number of their top 16, top 12 and top 8 finishes, and UK Sport allocated funding to Judo on the premise that it secured two top 8 finishes at Tokyo 2020. 1
As a result, this paper considers an athlete reaching an Olympic final as a successful outcome following Condon et al. (1999). However, we would expect the results to be similar for alternative dependent variables as De Bosscher et al. (2015) show that a number of variables that measure Olympic attainment are highly correlated with one another.
Next, this paper examines whether gender equality—measured by the ratio of females enrolled in secondary schools to males—impacts Olympic success. It then further investigates whether the determinants of Olympic success differ between the sexes, adding to the literature on gender and sport.
Finally, as Bernard and Busse (2004) stop their data set during the earlier periods of this sample, by testing these older models using contemporary data, we further contribute to the literature.
Literature Review
Theory dictates that population size is a critical factor in determining Olympic achievement (Bernard & Busse, 2004). Larger populations, or countries with a larger share of the world’s population, should contain a higher number of world-class athletes, if we assume a global distribution of athletic talent. Therefore, larger nations should be more triumphant at the Olympic Games. However, there are limits to the number of athletes a country may send to the Olympics. This may constrain their success and result in a larger unexplained component when modeling sporting attainment. Despite these limits, we would still anticipate that countries with larger populations will contain more high-quality athletes, thus strengthening the internal competition between them, which may indirectly correspond to higher Olympic attainment.
A second variable that explains Olympic achievement is income. With more resources available to train athletes, for a given population, wealthy countries should outperform their poorer counterparts. However, despite being neighboring countries with similar sized populations and income levels, Kenya and Uganda have vastly different levels of Olympic success. This example shows that both income and population do not completely explain differences in sporting attainment, suggesting that other factors matter. To address this, the literature has considered a number of other possible determinants of Olympic attainment. For brevity, we direct the reader to De Bosscher et al. (2006) who provide a summary of past studies.
As the purpose of this paper is to re-evaluate the covariates used by Bernard and Busse (2004), we focus on the determinants of Olympic success used in their study. In addition, we examine the role of gender to supplement the growing literature in this important field of research.
Bernard and Busse (2004) find that former Soviet nations attain a disproportionate number of Olympic medals given their GDP and population sizes. Furthermore, the authors show that nations who were not part of the Soviet Union, but operated under planned economies, successfully manufactured Olympic success. This suggests that political ideology is also important in explaining Olympic attainment.
Using contemporary data, Forrest et al. (2010) contest these findings and show that only former Soviet states, rather than countries with planned economic systems, reap the benefits of success at the Olympics. Expanding the literature on politics, Lowen et al. (2016) use the Polity-2 index, a time-varying measure of political ideology, in their study to account for the fact that political regimes may change over time. This index ranks countries from autocratic to democratic and Lowen et al. (2016) find that using this index, political orientation is an insignificant determinant of Olympic success.
However, Andreff (2013) examines variation in political ideology by splitting Soviet bloc and other command economies into four sub-groups. His results suggest that all four sub-groups outperformed capitalist market economies at the Olympic Games but by differing amounts. This is an important finding, as it confirms that politics matters, but regional variation may further explain cross-country differences.
Likewise, Hoffman et al. (2004) demonstrate the importance of regions, showing that countries from the Association of Southeast Asian Nations (ASEAN) have underperformed at the Olympic Games. Moreover, from 1960-2000, no African country was ranked in the top 20 teams. Thus, if regional-specific effects may influence Olympic attainment independent of politics, then it is plausible that country-specific effects may dictate Olympic performance in addition to politics.
It is observed that Olympic achievement for the host is usually above their average, with numerous factors attributing to home advantage (Balmer, 2003). These include: travel, where athletes are rested prior to the Games; familiarity of race routes, pitches and the climate; or participating in front of a home crowd, which may stimulate an athlete to succeed, (Clarke, 2000). Additionally, in subjectively judged events such as boxing, the crowd may influence an official’s decision in favor of the home athlete.
As the hosts of the Olympic Games are chosen 7 years in advance, Forrest et al. (2010) suggest that there may be an ex-ante host effect that determines Olympic success. In the run-up to hosting the Olympics, a nation may mobilize resources toward sport and raise their performance in the preceding Games, as well as the ones that they host.
Climatic factors may explain Olympic attainment, as if it is too hot to train in a country, an athlete’s practice time may become limited. However, as athletes are incredibly mobile, it is common for them to train abroad in suitable climates. Therefore, climate may matter far less than initially perceived.
This study includes gender equality as a further explanatory variable into the economic model. As the Olympic Games have a number of female-only events, an Olympic delegation with no women will impede a nation’s overall attainment. Brunei, Qatar and Saudi Arabia only included women in their Olympic squads for the first time in 2012, therefore, it is unsurprising that their historic success is lower than many other nations. Moreover, Zheng and Chen (2016) state that China’s rise to become a modern-day Olympic superpower is attributable to the country’s equal focus on male and female sports since the 1950s. However, Leeds and Leeds (2012) claim there is considerable overlap between the countries who achieve success in male and female events.
Method and Data
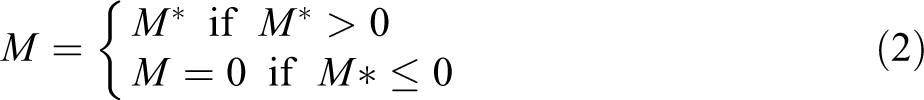
The preferred estimator is a panel Tobit, as the dependent variable equals zero for a number of observations. Equation 1 shows the benchmark equation where

The Tobit model assumes that the factors that determine success at the Games are the same as those that determine the quantity of success, given a country is successful. This may be a restrictive assumption, although plausible. An alternative framework that relaxes this assumption is to use a hurdle model.
In our sensitivity analysis, we adopt this procedure, using two different hurdle models. The first is the standard Cragg model which permits for all the covariates to appear in both parts of the model, first whether a country achieves success, and second how much success it attains. However, unlike the Tobit model, it does not assume that a single mechanism governs success,
However, we may still encounter a sample selectivity problem, as certain countries may not enter certain events or the Games in general. To address this we use the Heckman selection model. This model’s parameters are technically identified when using the same covariates in both stages, although it requires that a subset of variables is statistically significant in the first stage, but insignificant in the second stage. Thus, it is good practice to seek additional variables that influence the first stage, but do not impact the second stage.
Three variables were selected and differ based upon the specifications. For overall and male success, we use a dummy variable equal to one if a nation is ranked in the top 10 of the men’s FIFA World Rankings 6 months prior to the Olympic Games. Given that a U-23 soccer tournament is one of the events at the Olympics, this variable should indicate whether a nation will be successful, but we would not expect it to influence the quantity of success, given soccer is just one of many sports at the Olympic Games.
Using the corresponding women’s rankings when examining female success was not possible. This is because the women’s FIFA rankings only became available mid-way through the sample period. Thus, we use rankings from softball and karate, both of which will debut at the Tokyo Olympics. In softball, we used a country’s tournament ranking 2 years prior to the Games, and for karate, a nation’s world championship ranking the year of the Games.
As we assume that individual country-specific effects may explain cross-country variation in Olympic attainment, a fixed effects estimator would be most suited to estimate the research question. However, no fixed effects Tobit estimator exists. The best alternative is to modify the panel Tobit using the Mundlak transform, also known as correlated random effects, (Wooldridge, 2005). This procedure is quasi-time demeaning, removing a fraction of the fixed effect from each unit. The resulting and preferred specification is shown in Equation 3.
To estimate the causal relationship between the selected covariates and Olympic success, an instrumental variable approach was considered. However, the suitability of a number of instruments used at the macroeconomic level has been questioned, (Bazzi & Clemens, 2013). This is one limitation of the work, however, by advancing the methodology, the results should lead to a development in the knowledge of the determinants of Olympics success.

Equation 3 augments Equation 1 with the country means of the independent variables as additional regressors. These are denoted as
The data runs from 1996-2016 and includes six Summer Olympic Games. We focus on the Summer Olympics as opposed to the Winter Olympics for two reasons. First, due to the greater diversity in sports and second, because the geographical make-up of participants at the Summer Games is typically more heterogeneous compared to the Winter Games.
There are a number of reasons why our sample begins in 1996 as opposed to earlier. First, when plotting the data, in 1996, the share of medals for the top 10 nations drops below 60% for the first time, deviating from its prior downward trend and remains constant throughout the rest of the sample period. By commencing in 1996, we do not have to worry about a break in the time series. Second, the modern Olympics were initially focused on competition between individual amateur athletes, but post-1992 they became increasingly professional. 2 Third, our sample avoids data that encompasses the Soviet Union and the complications that would arise from the East German doping years, the Cold War period and various Olympic boycotts (Celik & Gius, 2014). Finally, 1996 was the first year that the proportion of female athletes was greater than 30% of all total athletes.
The independent variables
Due to data availability, our sample size falls to 767 nation participations out of a hypothetical 1,212 observations. To ensure that our results are not being driven by the sample, we maintain this sample size in each specification.
The summary statistics are available in Table 1 and a correlation matrix is shown in Table 2. The data for the dependent variables is from the IOC website, where a request was sent for up-to-date data including results for finalists. 3 The data for GDP, population and schooling equality are available from the World Development Indicators. The data on political orientation is from the Polity-IV project. 4 The host dummy was created manually using information from the Olympic Games website.
Summary Statistics.
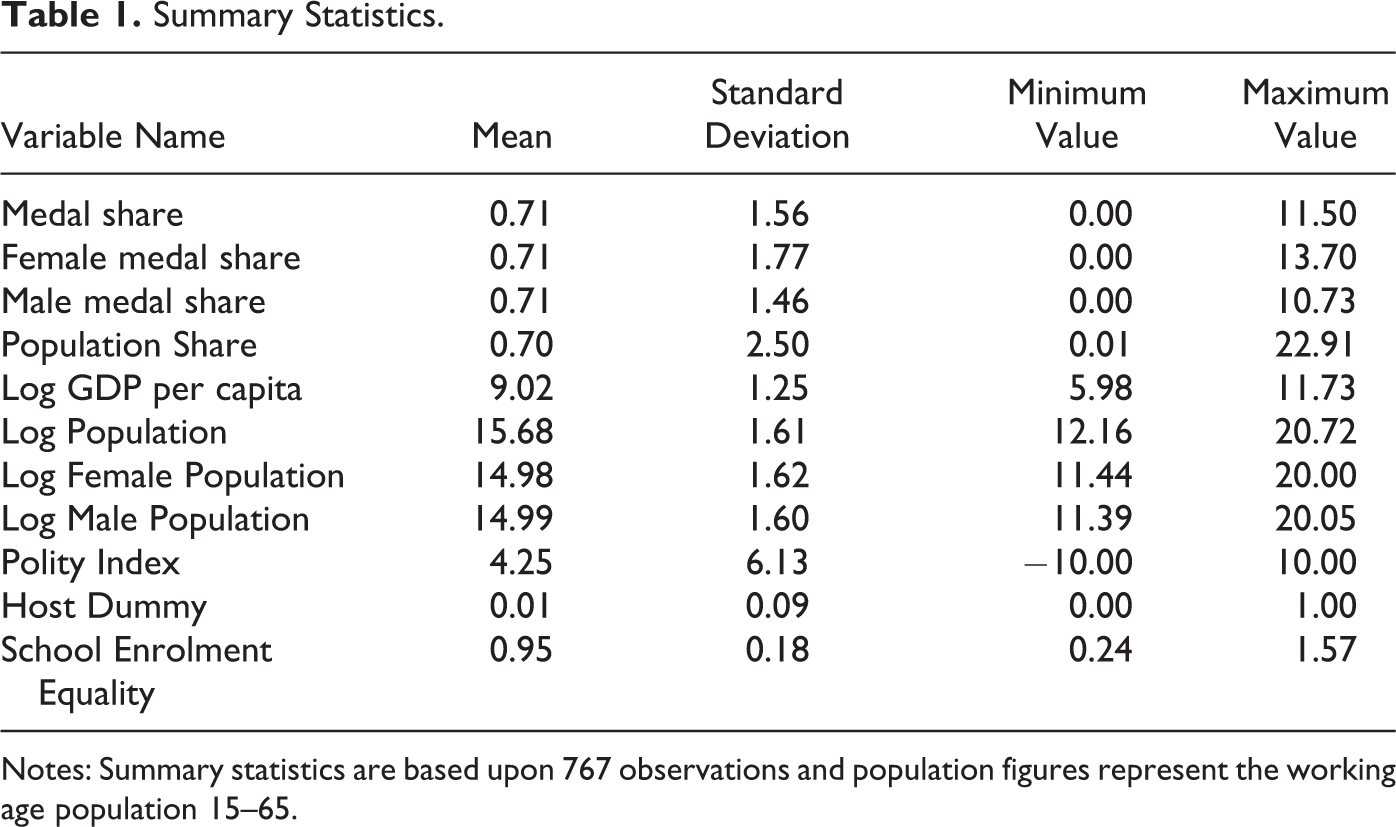
Notes: Summary statistics are based upon 767 observations and population figures represent the working age population 15–65.
Correlation Matrix.
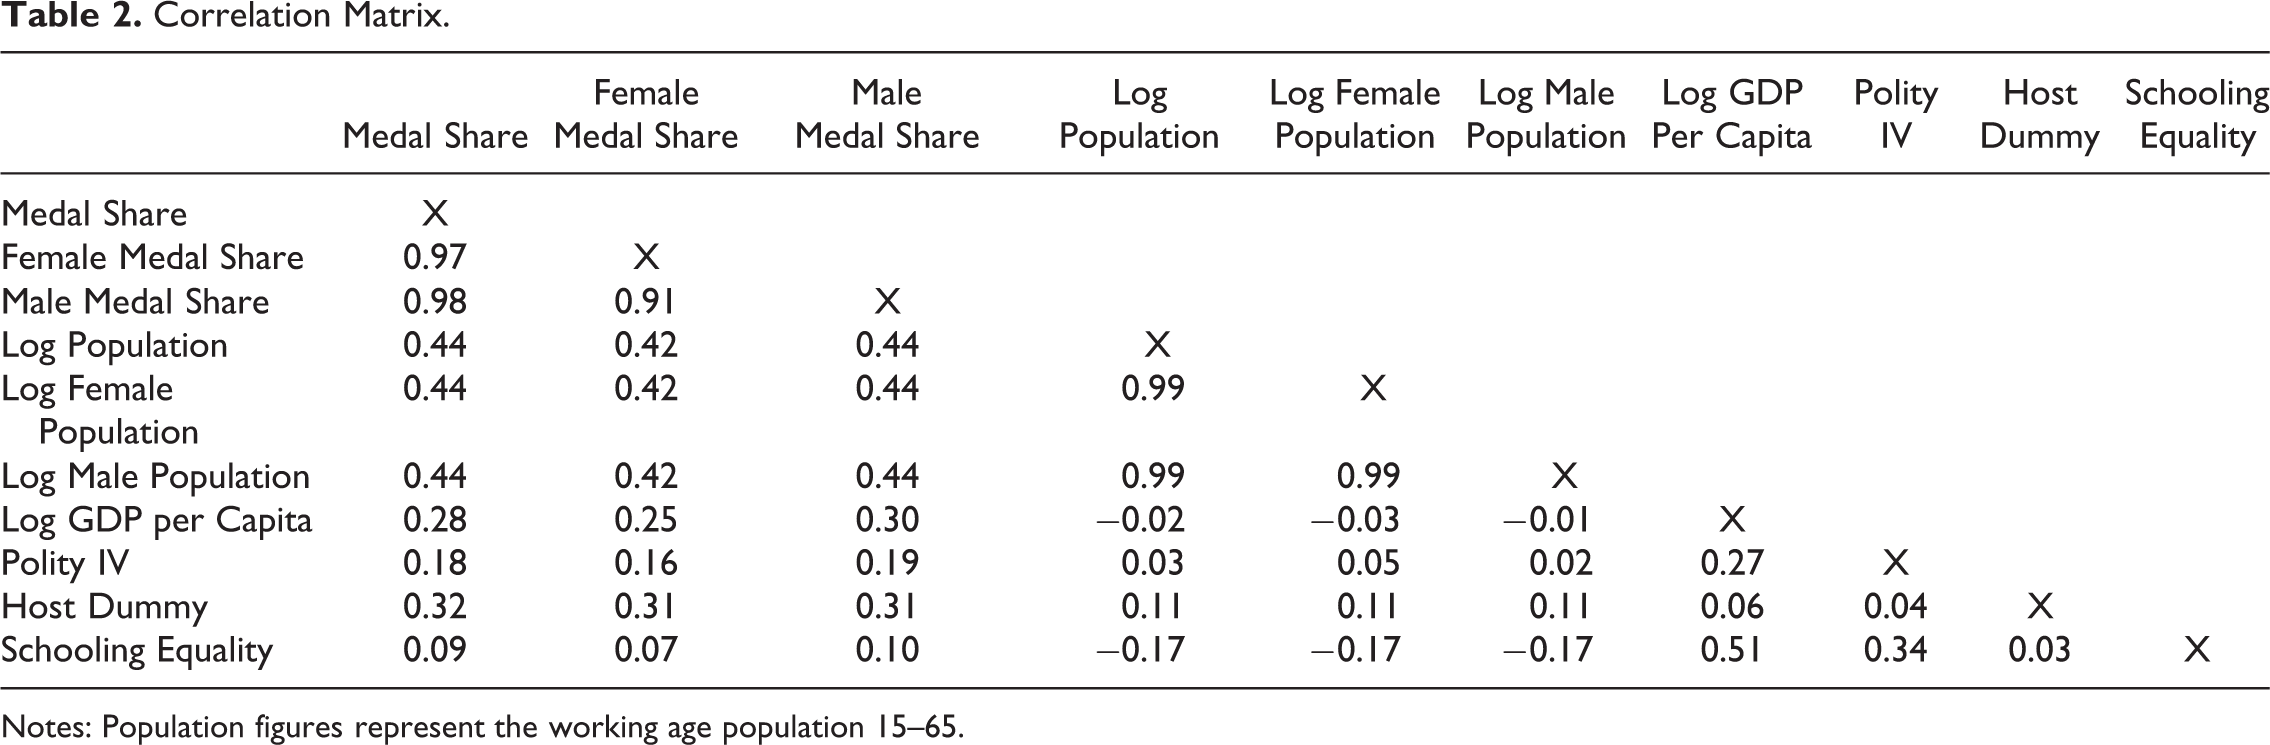
Notes: Population figures represent the working age population 15–65.
The dependent variable is the share of points country
Between Atlanta and Rio, the total number of sports increased from 271 to 306, and the number of medals awarded increased from 842 to 973. While this is not an excessive difference, as a precautionary measure, we focus on points share.
We use a Fibonacci sequence and weight our points system to address performance quality, as a gold medal is a better output compared to a final finish. In comparison to the traditional Fibonacci sequence of assigning three points for a gold medal, two points for a silver and a point for bronze (Mitchell & Stewart, 2007), we allocated a point for all finalists achieving fourth to eight place. We then begin our Fibonacci sequence and assign two points for a bronze medal, three points for a silver and five points for a gold as in Condon et al. (1999).
This is carried out for two reasons. First, it reduces the number of censored observations, and second, for certain countries, their Olympic strategy is not solely about medal success, but to increase the number of finalists. Nevertheless, our results should be quantitatively similar to those using alternative dependent variables such as total medal share, top eight finishes, or the absolute number of gold medals, as these variables are all correlated with one another (De Bosscher et al., 2015). This further ensures the transferability of our findings.
As this paper builds upon Bernard and Busse (2004), we select the independent variables to match their work. In addition, we include a measure of gender equality. A number of additional controls were considered, however, upon their inclusion, the number of observations fell below half the hypothetical maximum. Nevertheless, in our sensitivity analysis we altered the set of covariates to include many of these variables to ensure that our results remained consistent.
The first independent variable is population size. As the competitors at the Olympics are rarely aged below 16, and the oldest rarely above 40, rather than using total population size, we use the population of working age (16–65) as our preferred independent variable. 5
The second independent variable is GDP per capita which is converted into international dollars using purchasing power parity rates. Developing athletes to reach their potential is costly. Therefore, richer countries should have more resources available to ensure their athletes fulfil their potential in comparison to poorer nations.
As many former Soviet nations have won a disproportionate number of Olympic medals, given their economic development and population size we include a measure of political ideology. As it may be difficult to classify a country into a specific political regime, and as political regimes change over time, we use a time-varying measure of politics as in Lowen et al. (2016). The Polity Index is scaled between −10 and +10, where a value of −10 indicates a fully autocratic regime, and a value of +10 implies a fully democratic regime. A country in the middle of the two would score 0. If communist nations do engineer Olympic success, we would expect a negative coefficient associated with this variable.
We include a host dummy in our model because countries tend to improve their performance when competing in front of a home crowd. An ex-ante host dummy was considered following Forrest et al. (2010). While, the variable was significant in the aforementioned study, we omitted it for two reasons.
First, with a 7-year preparation process for hosting, the previous Games would provide only 3 years to develop a new sporting strategy to achieve success. Second, when exploring the data, the deviations from mean performance for the countries in question—while increasing—was negligible compared to the host effect. 6
The final explanatory variable is gender equality. As a large number of female-only events exist at the Olympics, nations that fail to send female participants to the Games will hinder their overall success. We measure gender equality as the female secondary school enrolment rate divided by the male rate, where an increase in the ratio signifies stronger gender equality.
Lowen et al. (2016) use the gender inequality index to measure female empowerment on Olympic success. We prefer our measure, as their index contains variables such as adolescent fertility and maternal mortality, which may be confounded by additional factors and are highly correlated with income, (−0.69) for adolescent fertility and (−0.70) for maternal mortality. Furthermore, it may capture economic development rather than gender empowerment. 7
Results
Main Findings
Table 3 presents the benchmark findings, replicating the preliminary regressions of Bernard and Busse (2004) using contemporary data. In column 1, we estimate Olympic performance solely on a country’s share of the world population. Column 2 changes the population variable to be an absolute rather than a relative measure. The results suggest that a 10% increase in the population will result in a 0.06 percentage point increase in a country’s points share at the Olympic Games. The following column examines the impact of income, where a 10% increase in income per capita may increase points share by 0.04 percentage points. In the final column, the variables are entered into the specification simultaneously and both coefficients remain statistically significant, although the coefficient on income slightly increases. 8
Replicating the Model of Bernard and Busse (2004) With Contemporary Data Using a Random Effects Tobit Model for Olympic Medal Share.
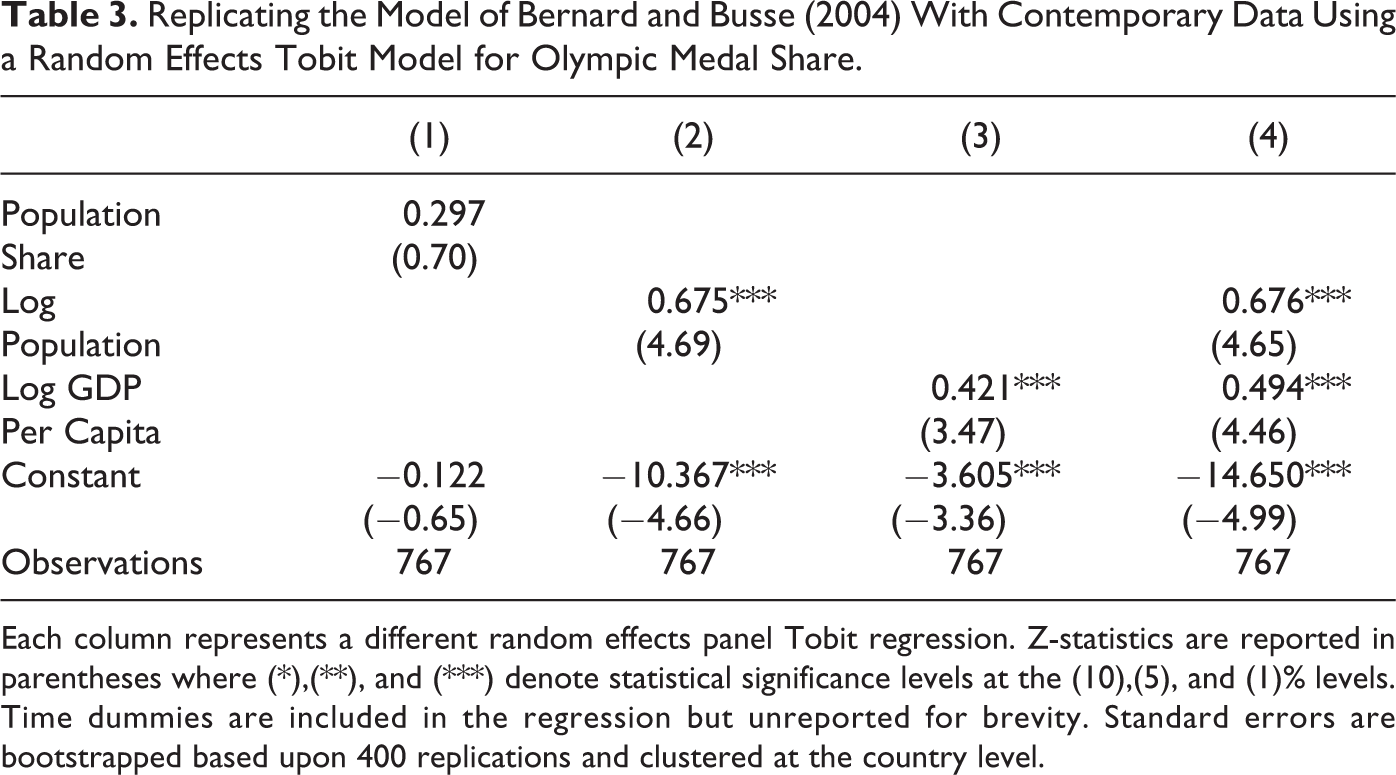
Each column represents a different random effects panel Tobit regression. Z-statistics are reported in parentheses where (*),(**), and (***) denote statistical significance levels at the (10),(5), and (1)% levels. Time dummies are included in the regression but unreported for brevity. Standard errors are bootstrapped based upon 400 replications and clustered at the country level.
Compared with Bernard and Busse (2004), the magnitudes of the variables differ but the conclusions remain consistent, that both income and population influence Olympic attainment. It is unsurprising that the coefficients are not identical, due to the subtle difference in how certain variables are measured and the sample period.
Table 4 adds the remaining variables into the specification. In column 1, we include a measure of political ideology, as former Soviet countries have been found to overperform at the Games relative to their population and income levels (Ball, 1972), although Noland and Stahler (2017) show that the effects of communism on Olympic success have decreased through time. The following column adds a host dummy into the specification, as countries that host the Olympics tend to perform better than when participating abroad. In column 3, we include the gender equality variable, and column 4 inserts all the variables into the specification simultaneously.
Results Comparing Findings From a Random Effects Tobit Model and the Correlated Random Effects Tobit Model for Olympic Medal Share.
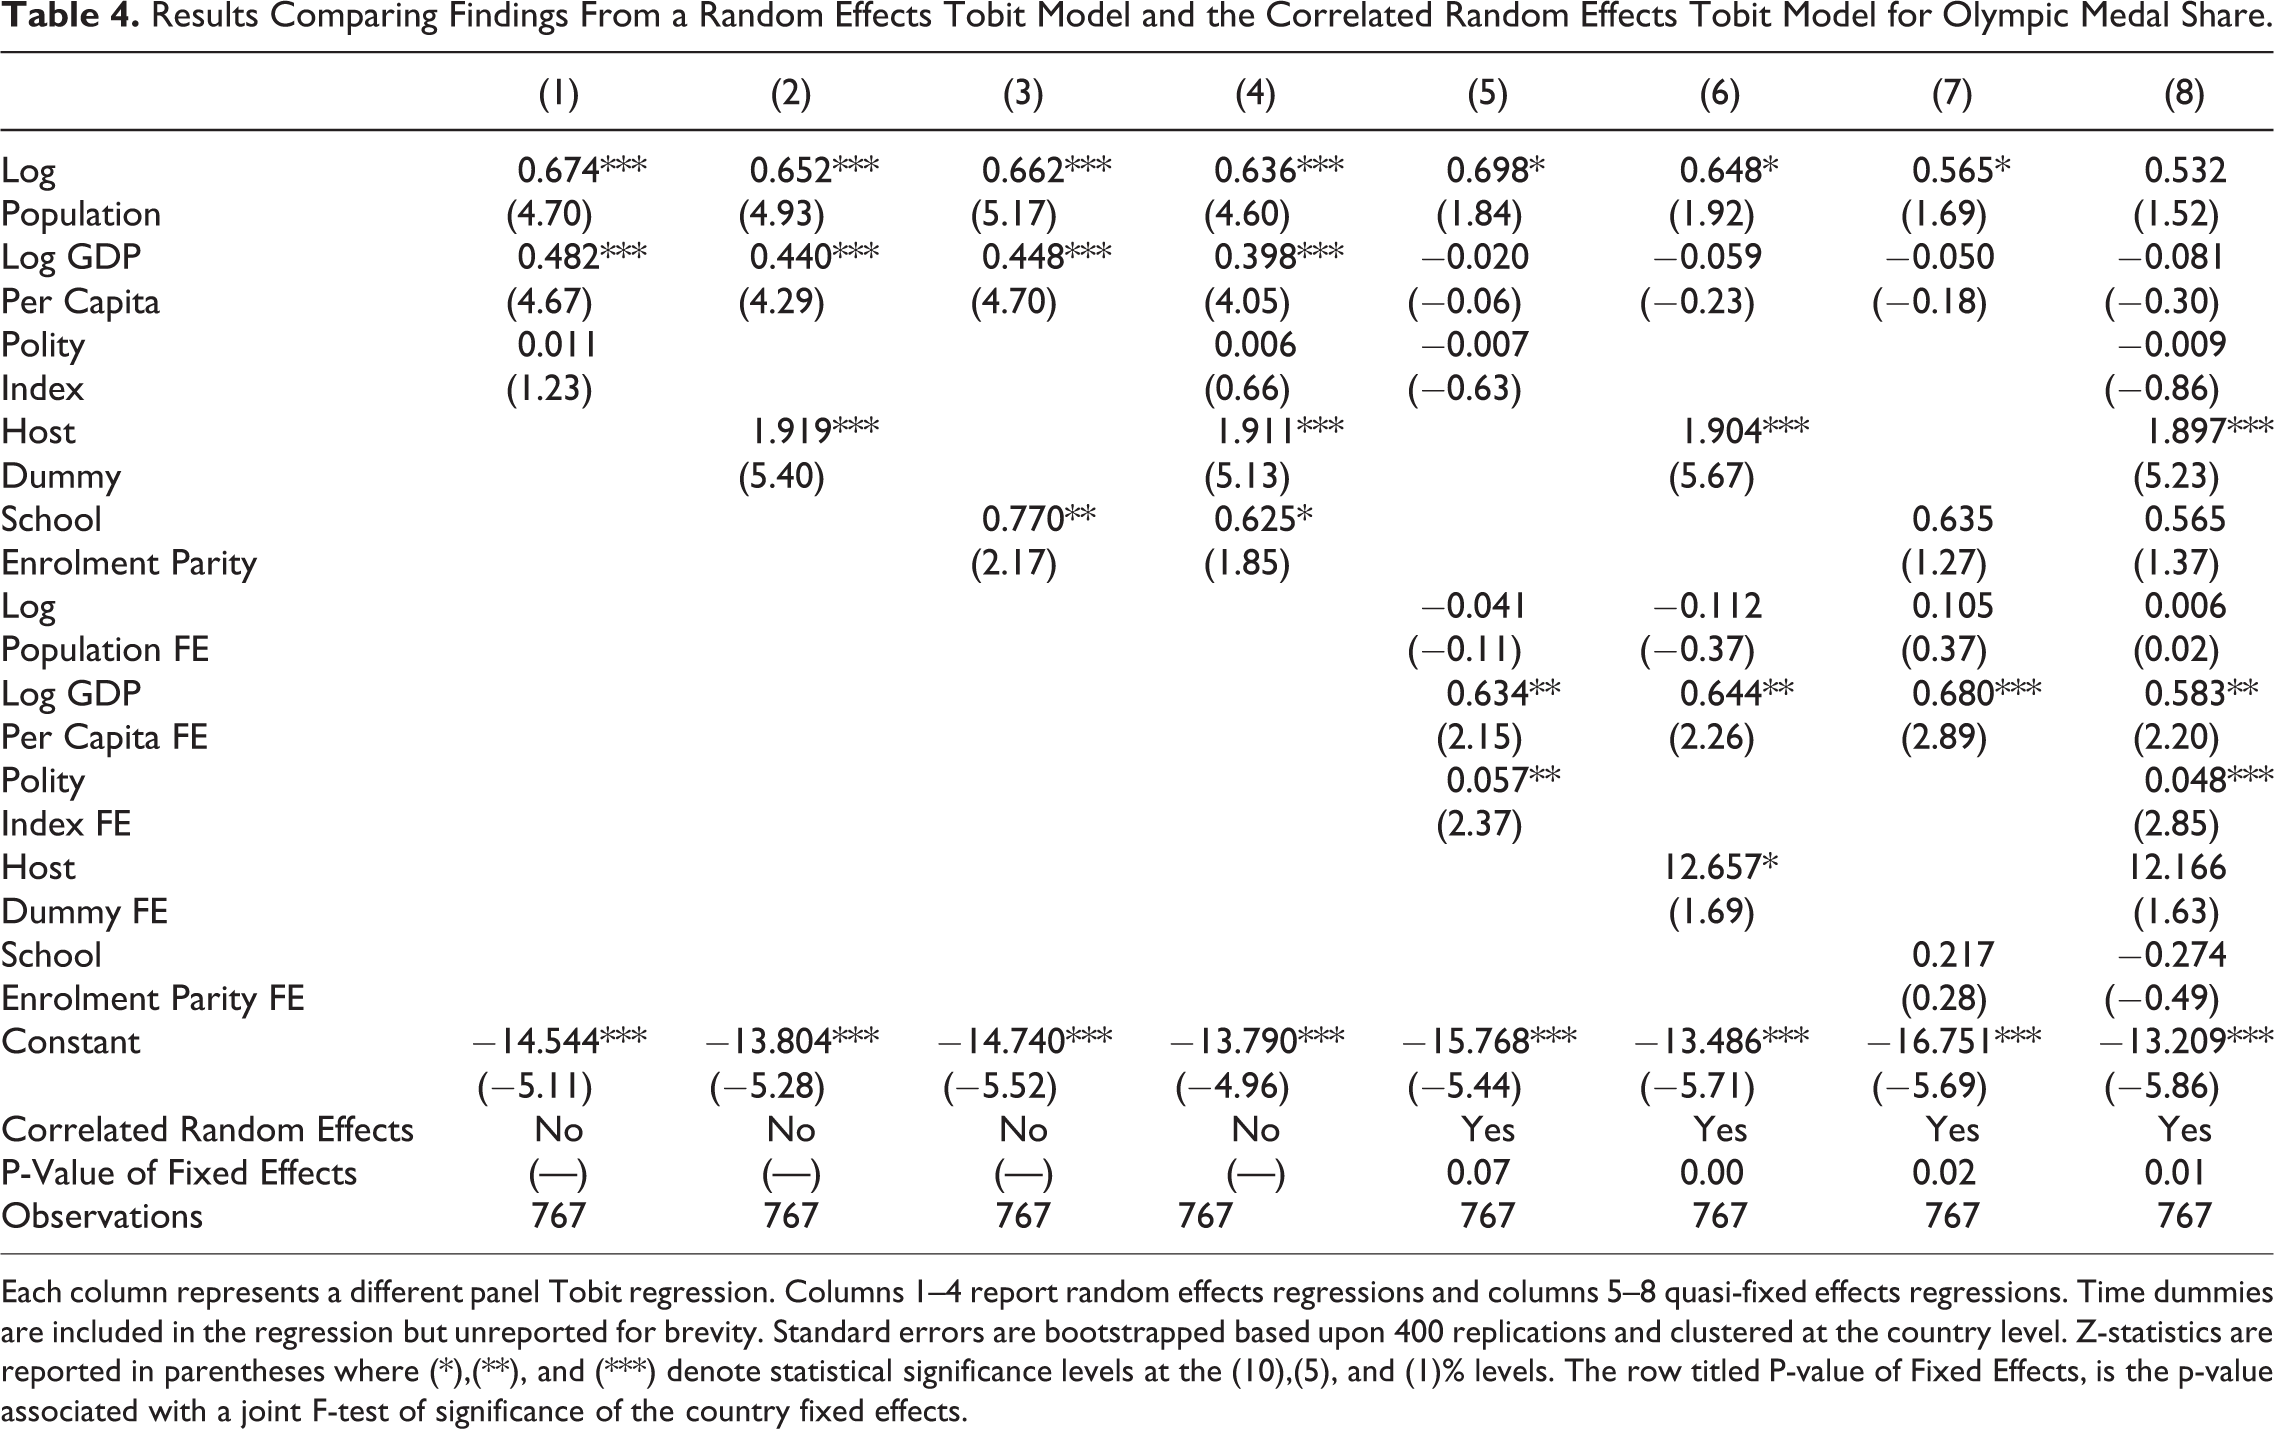
Each column represents a different panel Tobit regression. Columns 1–4 report random effects regressions and columns 5–8 quasi-fixed effects regressions. Time dummies are included in the regression but unreported for brevity. Standard errors are bootstrapped based upon 400 replications and clustered at the country level. Z-statistics are reported in parentheses where (*),(**), and (***) denote statistical significance levels at the (10),(5), and (1)% levels. The row titled P-value of Fixed Effects, is the p-value associated with a joint F-test of significance of the country fixed effects.
Columns 1–4 propose that population size is a key determinant of Olympic success, as the variable is positive and significant at the 1% level. The coefficient’s magnitude is similar to the results in Table 3. In addition, income per capita and the host dummy are both statistically significant at the 1% level. By hosting the Games, a country may increase their points share by almost 2 points. A more gender inclusive society may also increase a country’s points share, although the variable is only statistically significant at the 10% level.
Columns 5–8 replicate the previous four regressions but include the Mundlak transform. The coefficients of the country mean variables are jointly significant which provides evidence that our covariates and country-specific effects are highly correlated. Therefore, ignoring them may result in inaccurate conclusions.
The inclusion of these Mundlak fixed effects may be a cause of concern as it is possible that they contain all the explanatory power of the model. To alleviate such concerns, the pseudo R-squared for the random effects model in column four was compared with the corresponding specification using the Mundlak transform in column eight. The fit improved from 16.4% to 19.5%, providing evidence that the inclusion of these variables was not overly inflating the model’s explanatory power.
Upon the inclusion of the country-mean variables, a number of variables become statistically insignificant. Notably, GDP per capita no longer determines Olympic success in contrast to previous studies. Gender equality is a further variable that loses statistical significance.
Table 5 extends the study and tests whether our findings differ between sex, or whether certain determinants of Olympic success matter more for one gender compared to the other. For example, if women are prohibited from becoming Olympic athletes, then regardless of female population growth, we would not expect Olympic success to increase. The first four columns estimate the determinants of Olympic success for women. The following four columns repeat this exercise for men.
Results Broken Down by Gender from a Correlated Random Effects Tobit Model for Olympic Medal Shares.
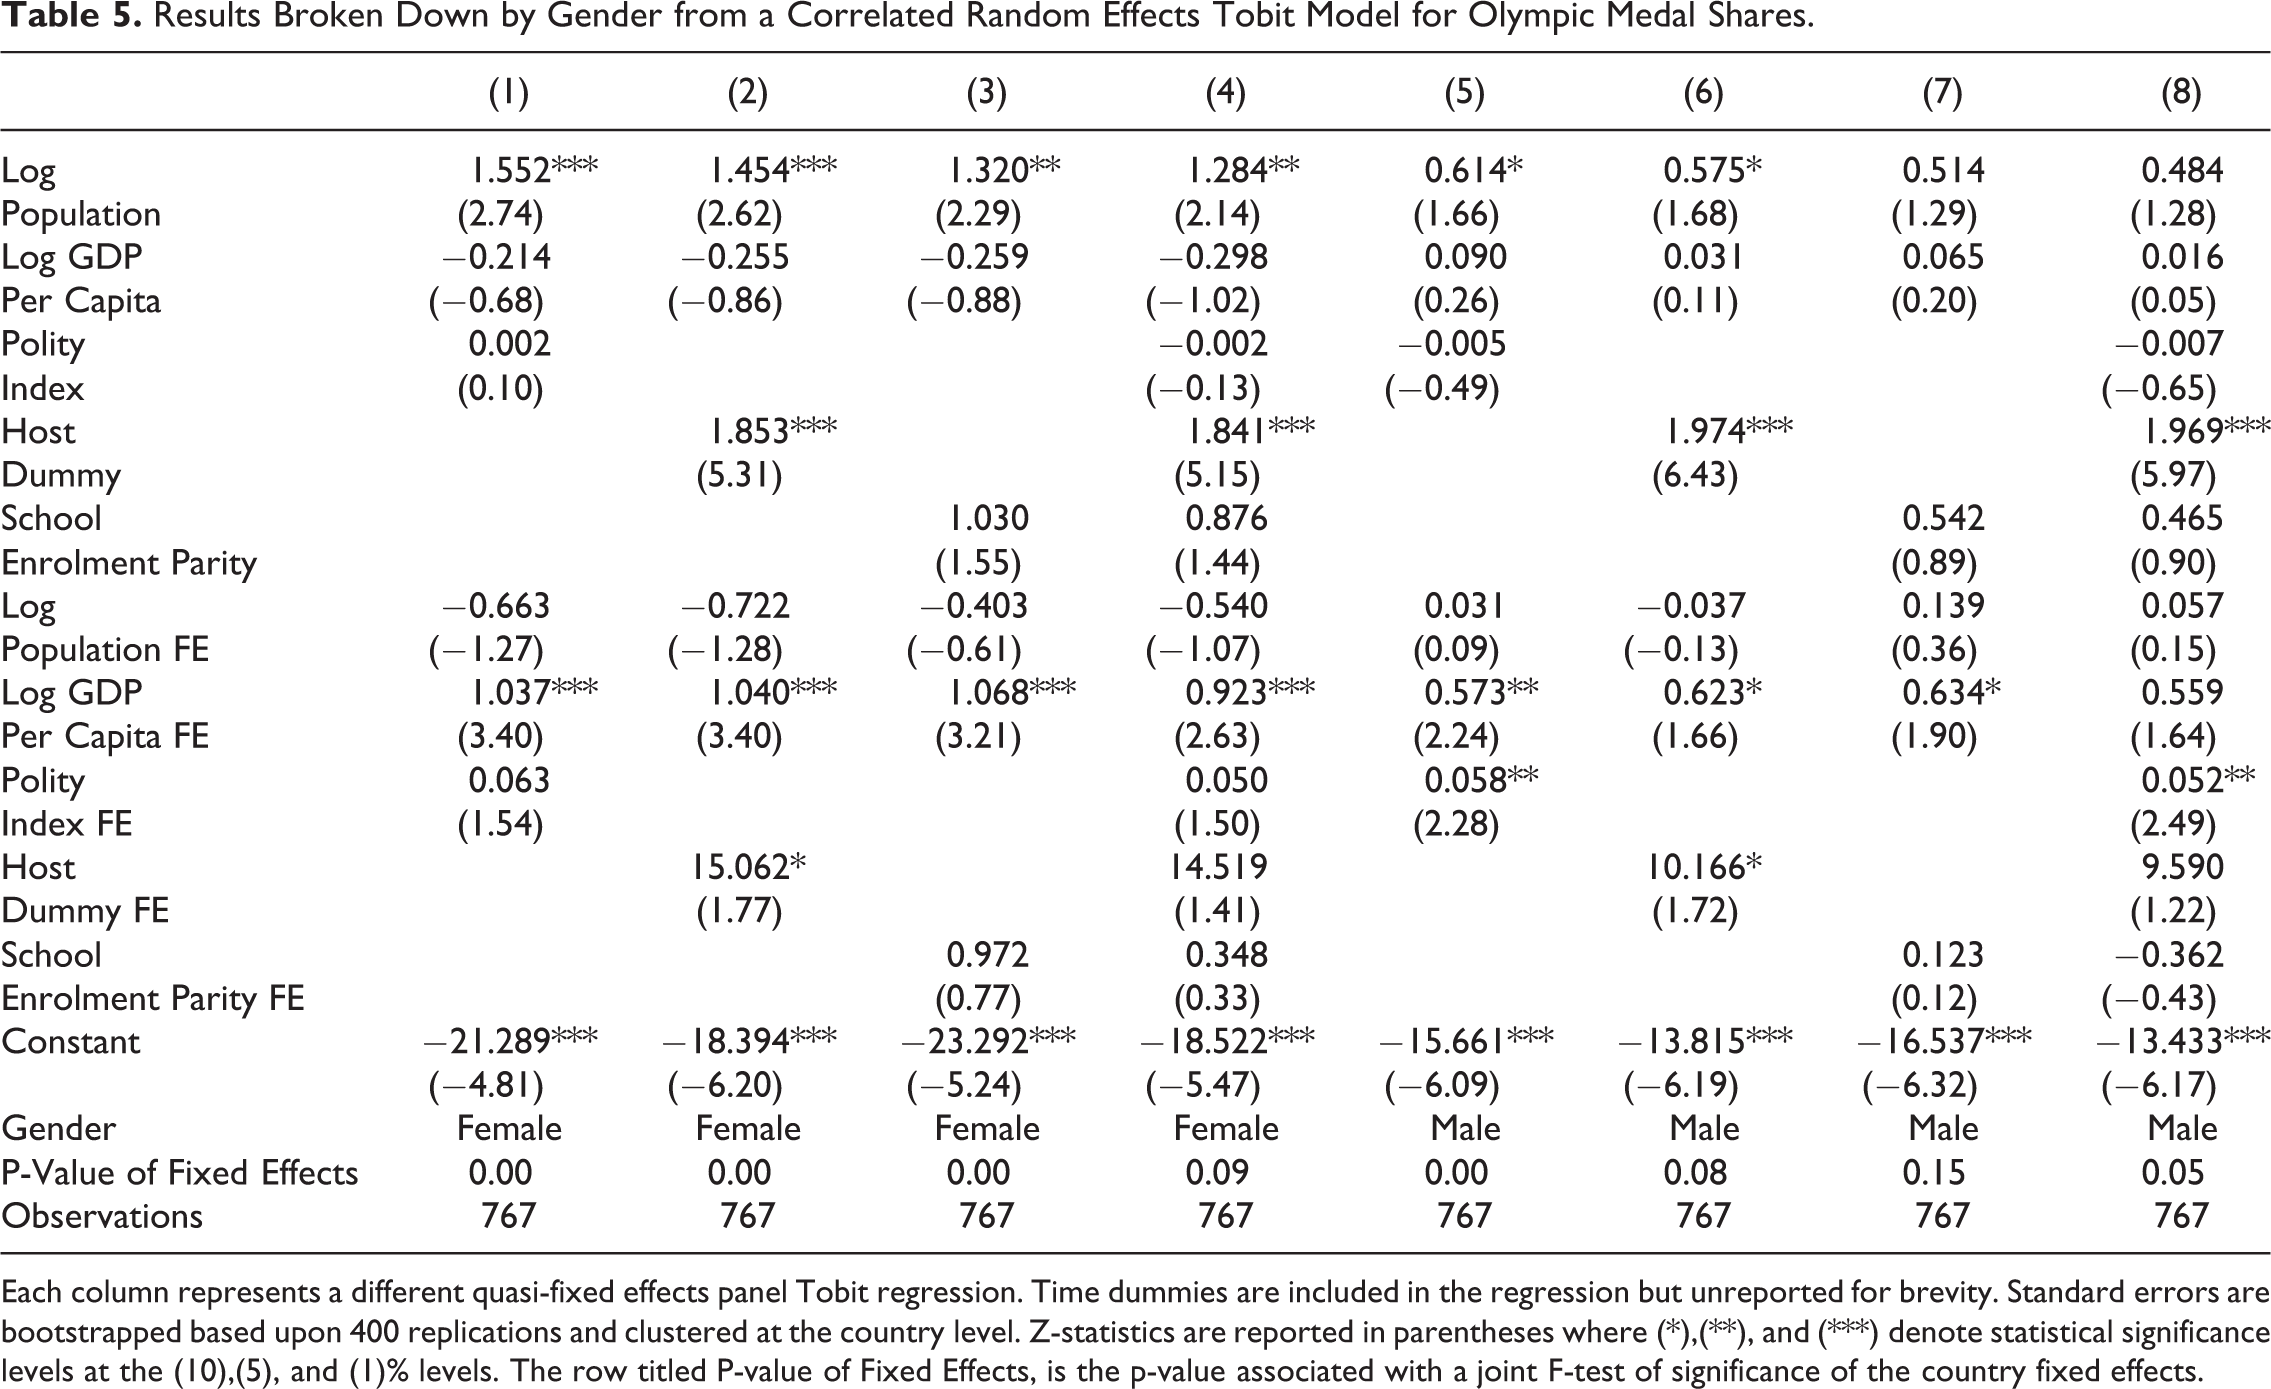
Each column represents a different quasi-fixed effects panel Tobit regression. Time dummies are included in the regression but unreported for brevity. Standard errors are bootstrapped based upon 400 replications and clustered at the country level. Z-statistics are reported in parentheses where (*),(**), and (***) denote statistical significance levels at the (10),(5), and (1)% levels. The row titled P-value of Fixed Effects, is the p-value associated with a joint F-test of significance of the country fixed effects.
The host effect is a statistically significant determinant of Olympic success for both genders. This differs to Leeds and Leeds (2012), who find that while hosting the Games may dictate the number of gold medal wins for both genders, there is no host effect on silver and bronze medals for females, but a positive effect for males. Our results show that the host effect is homogeneous as both females and males may increase success by approximately 1.9 points when participating in front of a home crowd. Population is also a statistically significant determinant in female Olympic attainment, and as columns 1 and 2 show, an increase in the population may increase female medal share over twice the amount it would for men. 9 In columns 3 and 4, an increase in female population retains its statistical significance at the 5% level, although the magnitude of the coefficient falls. Nevertheless, in comparison to columns 7 and 8, an increase in the male population has no effect on male Olympic performance.
Examining the remaining covariates, GDP per capita is statistically insignificant, as is the Polity index. Complementing the findings of Lowen et al. (2016), gender equality is also statistically insignificant.
Robustness Tests
A number of robustness tests were performed to examine the sensitivity of the results. First, we use two different hurdle models that drop the restrictive assumption that the factors that determine whether a country achieves Olympic success, also determines the quantity of success. The first is the Cragg model and the second is the Heckman selection model. The latter is used to alleviate any concerns of sample selection, as certain nations may choose not to participate in specific events, or only send male delegations to the Olympic Games.
The results are reported in Table 6 where columns 1–3 report the findings for the Cragg model and the subsequent three columns the Heckman model. The additional covariates used to identify the Heckman model are reported in Table 7 in the online Appendix.
Hurdle Models.
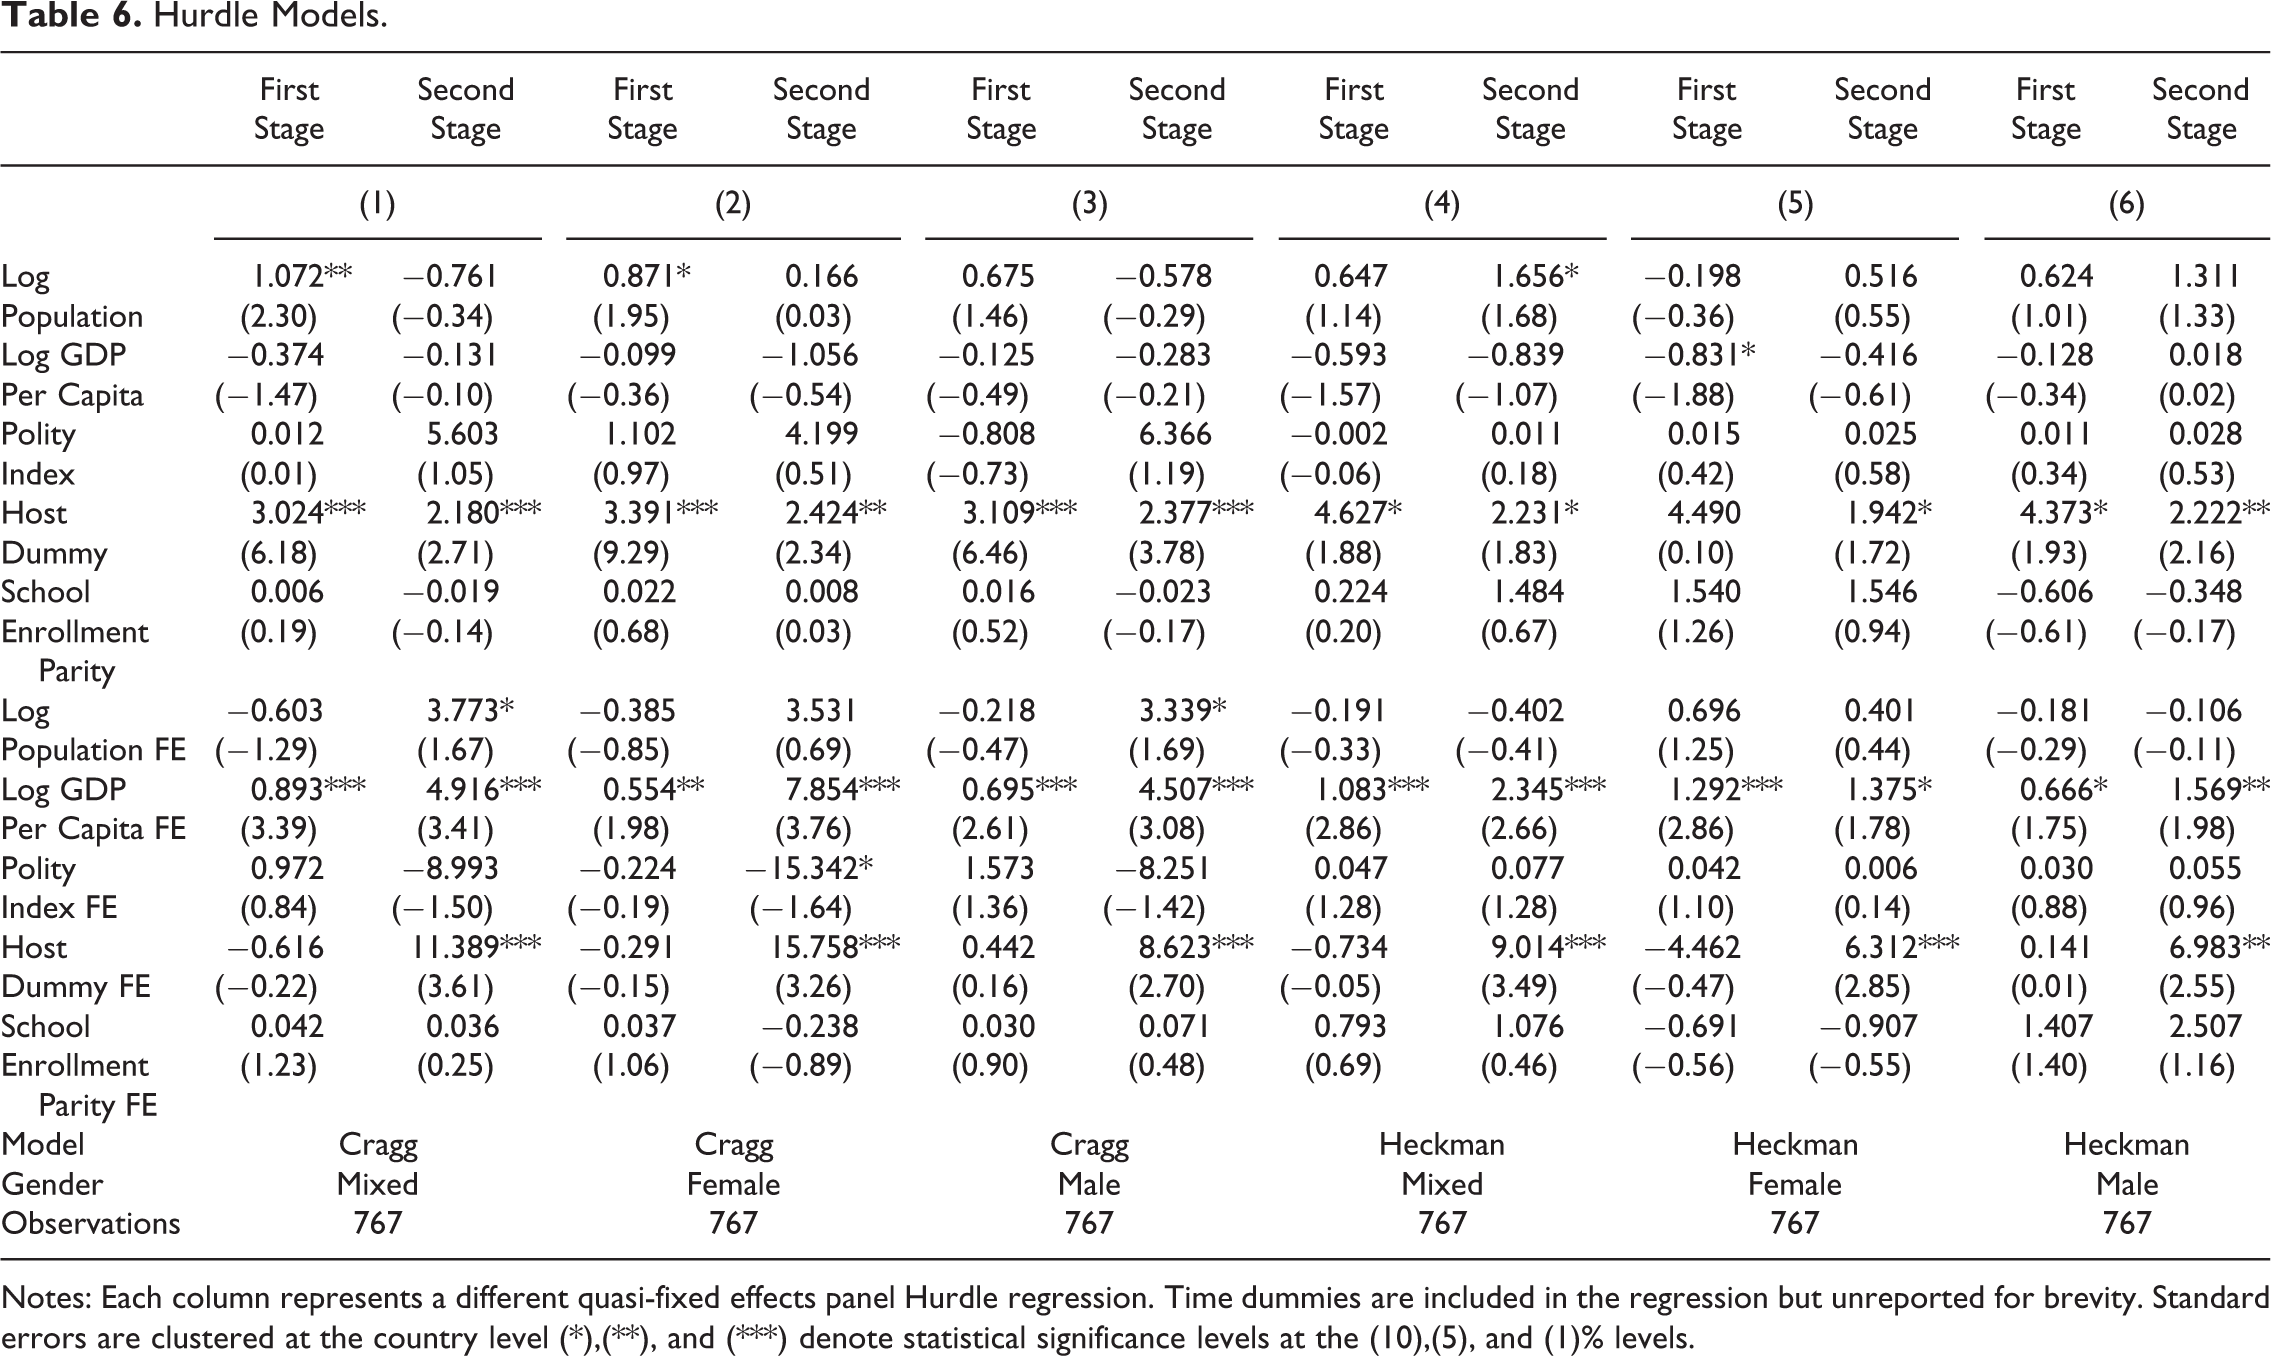
Notes: Each column represents a different quasi-fixed effects panel Hurdle regression. Time dummies are included in the regression but unreported for brevity. Standard errors are clustered at the country level (*),(**), and (***) denote statistical significance levels at the (10),(5), and (1)% levels.
The findings show that across all six specifications, the host dummy is a strong determinant of whether a nation attains success, and how much success is achieved. Only in the first stage of regression five is the host dummy insignificant. From the remaining variables, only two are significant. The size of a nation’s population is shown to influence the first stage of the Cragg model, and the second stage in regression four of the Heckman model. Additionally, GDP per capita in negatively signed in the first stage of regression five.
The country fixed effects are shown to be important. The country mean of income is statistically significant in all first and second stage equations, and the host dummy, population and polity index are statistically significant in a subset of the specifications. Thus, as with the Tobit model, the Mundlak transform is necessary to avoid making potentially misleading conclusions. 10
The inverse mills ratio from the Heckman model is statistically significant and is reported in Table 7 of the online Appendix. This ratio represents the covariance between the two error terms in each equation, and given its statistical significance, we cannot reject the null hypothesis that the errors in both stages are uncorrelated. Furthermore, Table 7 of Online Appendix shows our exclusion restriction is valid where our chosen variables are significant in the first, but not the second stage of the Heckman equation.
Overall, Table 6 shows the importance of hosting the Games in order to attain success as shown with the standard Tobit model. However, the findings using a hurdle model extend the previous results. They show that the role of population size determines whether a country will achieve success but does not determine the quantity of this success.
As a second robustness test, the empirical equation was estimated using a traditional fixed effects estimator and the findings are reported in Table 8 of the Online Appendix. It is presented as follows: Column 1 examines the corresponding regression in column eight of Table 4. Column 2, the corresponding regression in column four in Table 5, and column 3, the final regression from Table 5.
As anticipated, the magnitude of the coefficients fall due to the censoring bias. However, the purpose of this exercise is to test whether the Mundlak correction that generates the quasi-fixed effects, is performing well in picking up country-specific unobservables. Therefore, we focus on the T-statistics of the results in Table 8 of the Online Appendix. The results show that the two main variables, population and the host effect, remain statistically significant determinants of Olympic attainment and the Mundlak correction proxies well for time-invariant country-specific effects. This supports our previous findings.
The following three columns then examine the determinants of Olympic success, only on countries who attained medals in both male and female events over the entire sample period. Cross-country coverage remains strong, with over 50 nations represented, and the benefit of this approach is that it removes the censoring aspect, permitting the use of linear regression.
The results provide some interesting insights. In columns 4–6, the determinants of the quantity of success, conditional on being successful at the Olympic Games, are shown to be hosting the Games, reaffirming the conclusions in Table 6. However, in column 5 when examining female success, both the population variable and gender equality variables become statistically significant. Larger and more gender inclusive nations are associated with more success at the Olympic Games, pending they are part of the subset of successful nations.
This suggests that by creating a more gender equal society, Olympic success should increase. However, this strategy would only work if rival nations do not follow the same strategy. For example, during the era of the Soviet Union, communist nations lobbied for an increasing number of events and female competitions to be included at the Olympics. Coates (2017) shows that during this period, the Soviet and East German (GDR) teams had more female competitors than their Western counterparts. They achieved extraordinary success, but over time as other nations increased their female delegations, for a fixed number of medals, this advantage declined.
Further sensitivity analysis then examined whether the results changed when altering the conditioning set of variables. As income may proxy for numerous factors which determine Olympic success, for example, government expenditure on sports or infrastructure, or the health of a nation, we examine those factors directly. Table 9 in the Online Appendix showcases these further findings.
In column 1, we inserted government spending into our regression, then in the following two columns, different measures of a nation’s infrastructure, both commonly used in previous empirical research.
11,12
The first is the square of railroad length in km, divided by country size in km
The findings are relatively unchanged when altering the set of conditioning variables. Hosting the Olympic Games is the key method of increasing Olympic success as well as being a large country. In the regressions, the total amount of air pollution was also statistically significant, although it is unexpectedly signed. We would anticipate that high levels of air pollution would be detrimental to Olympic success as they would result in lower levels of health. However, in this instance, this variable could be just capturing industrial production, demonstrating the caveats of using heavy aggregate data which is a limitation of this work.
The next robustness test examined whether the results differed when replacing working age population with the total population measure. As the two variables are very highly correlated (0.97) the changes in the results were negligible, although the coefficient on total population was slightly larger in magnitude. However, our chosen measure increased the precision of our estimates with greater T-statistics.
In further sensitivity analysis a dummy variable for Soviet countries was entered into the regressions and interacted with the time dummies, to test for a waning effect of communism as found by Noland and Stahler (2017). The findings show that former communist nations outperformed the rest of the nations in the sample, although the magnitude of the variables falls as the sample progresses, with the exception of 2004. This shows that the historical ties to the Soviet Union are still determinants to success, although declining in importance.
The final robustness check examined the results upon the omission of the time dummies. The main results were unchanged, although the population variable became statistically significant at the 5% level in columns 5–8 in Table 4 and columns 5–6 in Table 5. Furthermore, the population variable was statistically significant at the 10% level in the final two columns of Table 5.
Discussion
A number of significant findings arise from this study that differentiate it from the literature. First, GDP per capita becomes an insignificant determinant of Olympic success when the Mundlak transform is used. We believe that this may arise because income may be correlated with certain unobservable country-specific effects that assist in athletic development.
Alternatively, the role of income may manifest itself via the host effect. Maennig and Vierhaus (2019) find that growing economies are more likely to bid for the Olympic Games. As hosting the Olympics is expensive, typically, cities from affluent nations are more likely to bid. Given the strong host effect found in this paper, it is plausible that the role of income appears via this channel.
Another plausible reason for this finding is that since 1992, the Olympic Games have become increasingly professional and globalization of sport more prominent. While athletes have been supported by sponsors prior to 1992, the scale of this increased over our sample period. Many world class athletes no longer rely (or rely as much) on their home nation for funding. For example, Britain’s Mo Farah, sponsored by Nike, was provided residence and training at the Oregon Project (USA) and Daphne Schippers’s warm weather training in Spain was funded by Nike, not the Dutch Sports Federation. Therefore, a nation’s income may not matter as much as it has in the past.
A further interesting finding is that when splitting the sample by gender, the population coefficient differs between women and men. We propose a number of suggestions to explain this result. First, we examine the role of pregnancy and the challenges of returning to peak physical condition after giving birth. 14 A female athlete may lose over 12 months of peak performance during pregnancy and child birth from a relatively short career. Moreover, if this period coincides with an Olympic Games, it will reduce the pool of high-quality female athletes, negatively impacting attainment. Therefore, a larger female population may compensate for females temporarily withdrawing themselves from Olympic selection to have children.
This effect may be amplified via cost or income barriers. Modern Olympic athletes rely upon lucrative sponsorship deals that facilitate their careers. During the gestation period, many female athletes have experienced their sponsorship payments being unfairly terminated or reduced. 15 Post-pregnancy, if the contracts are not reinstated, or with an absence of full funding, this could act as a barrier to participation, further explaining this result.
The second explanation may be due to participation effects. As women participate in sports less than men, if the male participation rate is enough to identify “all” of the country’s Olympic-caliber athletes, then it requires a larger increase in female population (or participation rates—ceteris paribus) to find the equivalent number of female Olympic-caliber athletes.
Finally, the coefficient on female population, may exceed that of males, as it may capture historic coaching practices. Typically, most sport coaches are male and Table 10 of the Online Appendix shows the dominance of accredited male coaches compared to females using data from London 2012. Only one in 10 coaches are female when examining the global average, with the highest percentage of female coaches located in North America (16%). This is despite von Allmen (2013) and Darvin et al. (2018) finding no statistical difference in performance attributing to a coach’s gender.
During the youth development phase of an athlete, male dominance in coaching may lead to an unconscious bias favoring male athletes. This may be due to familiarity factors of coaching individuals of the same gender, or due to coaches naively selecting athletes based upon their absolute ability rather than relative ability. In this situation, young females who have Olympic potential, can be overlooked and may never break through.
A larger female population may break these barriers in two ways. First, a larger female population may increase the probability of a nation possessing a high-ability, young, female athlete that a coach may simply not ignore. Alternatively, a larger female population may transcend into more female coaches. This should then provide aspirational role models and greater attention to female athletes, nurturing them to become Olympians, improving Olympic attainment.
In addition, this study shows that political orientation appears to matter less for Olympic success than in prior studies. We offer an explanation for this finding below.
Throughout the era of the Soviet Union, the USSR and other communist nations, often lobbied the IOC for an increasing number of events and female competitions to be included at the Olympics. During this period, Soviet and East German (GDR) teams were composed with far more female competitors than their Western counterparts. This advantage was so great, that it led to Avery Brundage, a US representative on the IOC from 1952-1978, to motion that women’s competition be eliminated from the Games, as it gave socialist countries advantages in the medal rankings (Coates, 2017). In addition to this, many communist nations during the Cold War period outspent their rivals to showcase the success of their political system.
After the dissolution of the Soviet Union, this relative advantage declined as rival nations increased their female participation rates and sports spending. Thus, for a fixed number of medals, former communist nations no longer experienced vast success, explaining the waning effect of communism. Moreover, since the break-up of the Soviet Union, many of the newly formed independent states had alternative priorities, such as acclimatizing to market economies, rather than intensely focusing on sport, as they did during the era of the Soviet Union.
Prediction
We evaluate model performance in Figure 1. The Y-axis shows our model predictions and the X-axis shows a country’s actual Olympic points share. Figure 1 shows the predicted probabilities from model eight in Table 4.
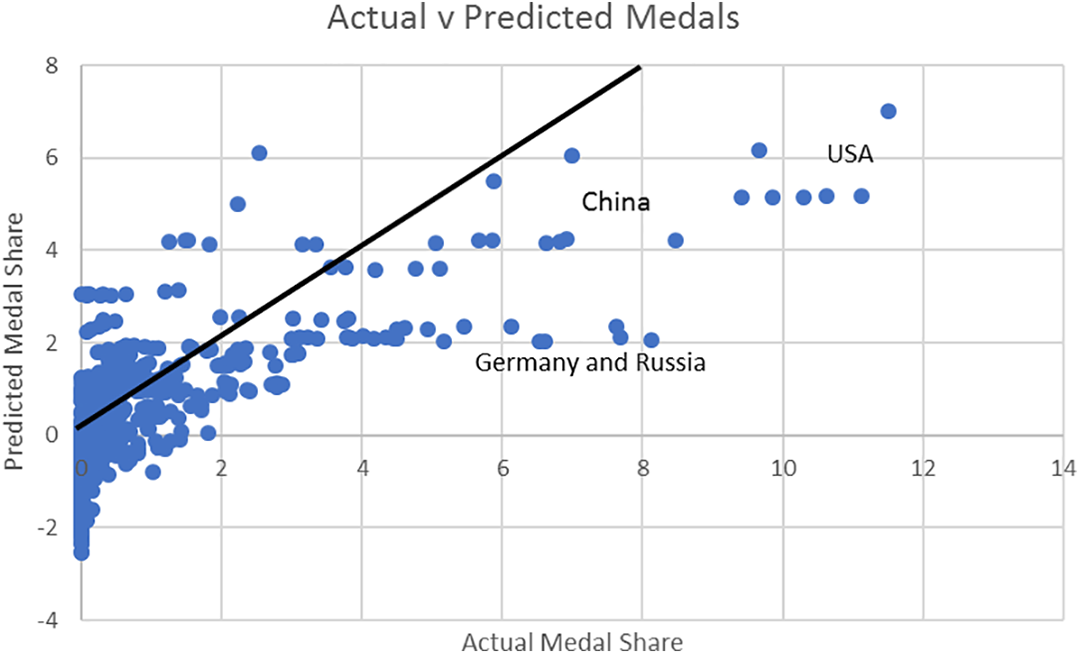
Prediction Model I.
Our model is similar to previous empirical studies and tends to under-predict highly successful nations. This is evident with the number of points below the 45-degree line. Several nations stand out including: the United States of America, Russia, Germany and China.
China’s actual medal share is similar to both Russia and Germany, and while the model predicts China to underperform, the model seriously under-predicts Russian and German performance. While the model predicts the United States to be incredibly successful and similar to China in terms of success, the United States achieves far greater glory than the model proposes. Figure 1 labels these countries for comparative purposes.
These outliers do propose the model lacks some predictive power. However, compared with the corresponding figure in Bernard and Busse (2004), our model does improve the fit with far fewer observations below the main diagonal.
Conclusion
This paper investigates the factors that determine Summer Olympic success. Previous studies find that population, income per capita, hosting a Games and political ideology all contribute to Olympic achievement. In this paper, once applying the Mundlak transform to the commonly used panel Tobit estimator, only the host effect and population size remain statistically significant.
When the data is split by gender, the host effect is similar in magnitude for both sexes, indicating that home support improves performance for both genders equally. However, the coefficient on population differs between females and males. This is an interesting finding and while participation factors are used as a possible explanation for this result, it offers a direction for future studies.
When assessing the robustness of these findings using a hurdle estimator, it is found that the host effect impacts both stages of the model, whereas the role of population appears to only determine whether a country will achieve success. This does propose that the determinants of Olympic success are not governed by a single mechanism, offering a further platform for future research.
This study does have limitations. First, it does not seek to address the causal relationship between the covariates and Olympic success. This is due to the difficulties of finding suitable instrumental variables at the macroeconomic level, which are often weak, leading to inferior estimates.
Second, by using macroeconomic data, the mechanisms driving these relationships may be imprecise. One issue is the lack of cross-country data with a rich time series on a country’s sport expenditure or alternative metrics. If scholarly research on the determinants of Olympic success wants to advance, such data needs to become available. However, this may not fully address the issues of finding the direct linkages between inputs and outputs.
This research has important implications for policymakers. As athletic funding is often contingent on success, being able to monitor realised performances versus anticipated performances would be helpful when determining future funding allocations.
This research shows that country-specific unobservables matter, as many previously identified determinants become statistically insignificant when factoring these time-invariant effects in the regression equation. Thus, if funders evaluate realized versus expected performance without considering these effects, it may lead to funding being incorrectly allocated.
Supplemental Material
Supplemental Material, sj-pdf-1-jse-10.1177_1527002521992833 - The (non) determinants of Olympic success
Supplemental Material, sj-pdf-1-jse-10.1177_1527002521992833 for The (non) determinants of Olympic success by Johan Rewilak in Journal of Sports Economics
Footnotes
Acknowledgments
I would like to thank the delegates at the 2018 European Sports Economics Association Conference, colleagues at Aston University, Eva Marikova Leeds, Nola Agha, Caroline Elliott, Tomasz Mickiewicz, the participants at the NAASE sessions at the Western Economic Association Conference 2019 and all others that have helped advance this manuscript. In addition, I am extremely grateful to the editor at the Journal of Sports Economics. Finally, thank you to the anonymous reviewers for their time and effort in improving this article.
Declaration of Conflicting Interests
The author(s) declared no potential conflicts of interest with respect to the research, authorship, and/or publication of this article.
Funding
The author(s) received no financial support for the research, authorship, and/or publication of this article.
Supplemental Material
Supplemental material for this article is available online.
Notes
References
Supplementary Material
Please find the following supplemental material available below.
For Open Access articles published under a Creative Commons License, all supplemental material carries the same license as the article it is associated with.
For non-Open Access articles published, all supplemental material carries a non-exclusive license, and permission requests for re-use of supplemental material or any part of supplemental material shall be sent directly to the copyright owner as specified in the copyright notice associated with the article.