
Abstract
This is the first study to examine the potential effects of property tax levy limits on school infrastructure assets and expenditures (IAE). Specifically, we examine how the limit on school district’s property tax levy in New York may affect school IAE. Although this limit imposes a restriction only on operating, rather than capital, property tax levy, we hypothesize that the limit may have spillover effects on school IAE. We examine this hypothesis by employing a difference-in-differences estimation approach together with an event-study design on a panel of school districts between 2011 and 2020. We find that at-limit school districts that exhaust their limit, especially urban high-need districts, reduce the expenditures on machinery and equipment. In addition, the limit has a negative effect on rural high-need infrastructure assets captured by the building value. We also find that at-limit school districts do not issue more debt and that urban high-need districts seek out more matching state infrastructure aid. All these results indicate that school districts that are most likely to be constrained by the limit treat operation and capital resources as complements rather than substitutes.
Introduction
Capital investments in school infrastructure are important. Existing studies that have found significant effects of capital expenditures on student achievement and outcomes (e.g., Conlin & Thompson, 2017; Hashim et al., 2018; Kai & Zimmer, 2016; Lafortune & Schönholzer, 2022; Rauscher, 2020) outnumber the studies that have found no significant effect (e.g., Baron, 2022). However, it is well known that the infrastructure of public schools in the United States is in poor condition. For example, a survey conducted in the early 2010s revealed that the overall condition of over one fifth of schools with permanent buildings was fair or poor (Alexander & Lewis, 2014). Although the grades for America’s public school facilities, as assessed by the American Society of Civil Engineers, have improved from D− in 2001 and 2003 to D in 2005, 2009, and 2013, and further to D+ in 2017 and 2021, these D grades still fall within the “poor” category. All of this suggests that public schools in the country need substantial investment to improve their condition.
Although there have been recent calls for the federal government to provide more funding for public school facilities (Jackson & Johnson, 2021; Modaffari & Alleyne, 2022), financial support for school infrastructure still primarily comes from state and local governments. Several states, such as Iowa and New York (NY), have aid earmarked for school infrastructure (Nguyen-Hoang & Damiano, 2023; Wang et al., 2011). However, school districts typically raise school facility funds by either pay-(as-you-) use using debt instruments, usually bonds, or pay-(as-you-) go using general fund revenues (Wang & Hou, 2009). 1
While several existing studies examine the effects of tax and expenditure limits (TELs) on school districts’ total or operating expenditures (Blankenau & Skidmore, 2004; Buerger & Lofton, 2023; Nguyen-Hoang, 2013; Nguyen-Hoang & Zhang, 2022), no study has focused on the effects of a TEL on infrastructure assets and expenditures (or IAE for short) for school districts. This study seeks to fill this gap in the literature by examining the effects of the NY property tax levy limit (LL) (hereinafter referred to as the limit) on school IAE. 2
Under Chapter 97 of the Laws of 2011, NY established a limit on school district’s property tax levy for operating purposes. Effective in fiscal year 2013, the limit basically restricts the annual growth of property tax levies to 2% or the rate of inflation, whichever is less. Nguyen-Hoang and Zhang (2022) find that the total current expenditures of at-limit school districts are significantly lower than what they would have spent absent the limit. Although the limit does not impose a restriction on the property tax levy for capital projects, we hypothesize that the tax limit may have spillover effects on school IAE. This hypothesis is based on the fact that school districts make concurrent decisions on resources for both operating and capital purposes. This paper, therefore, builds upon Nguyen-Hoang and Zhang (2022) but focuses on the potential effects of the limit on school IAE.
Using a panel of 663 NY school districts during the 2011 to 2020 period, we investigate three research questions. The first question examines whether the limit constrains NY school districts’ IAE. The second research question explores whether the limit-induced effects vary by district groups. The third question aims to determine the extent to which debt and infrastructure state aid explain the effects, or lack thereof, found in the previous two research questions.
As explained by Nguyen-Hoang and Zhang (2022), not all school districts feel constrained by a limit. Only a specific category of school districts do so when they want to raise more property tax levies for operating activities beyond the limit. “At-limit” school districts—those that exhaust the limit—are most likely to fall into this category. We adopt a difference-in-differences (DID) estimation approach by exploiting unaffected or far-from-limit districts as counterfactuals for at-limit school districts. We also employ an event study specification to support causal links between the tax limit and changes in school districts’ IAE. We find evidence that despite no property tax cap on capital levy, the limit induces some negative spillovers on at-limit school districts’ IAE, particularly high-need school districts.
Our study makes two contributions to the literature. First, previous research has been conducted on the effects of TELs on total or operating expenditures for school districts or on municipalities’ IAE. This is the first study to examine the effects of a TEL on school districts’ IAE. Second, the findings of our evaluation of the ongoing limit in NY can be helpful to policymakers in the state to make better-informed decisions about the law in the future.
The remainder of the article proceeds as follows. The next section provides the background for our study, including a brief formula overview of the limit, a simple theoretical prediction on the effect of the limit, and a review of the thin literature related to this study. The next section describes our empirical strategy and data, followed by a discussion of regression results. The last section concludes with policy implications and suggestions for future research.
Background
Property Tax LL Formula
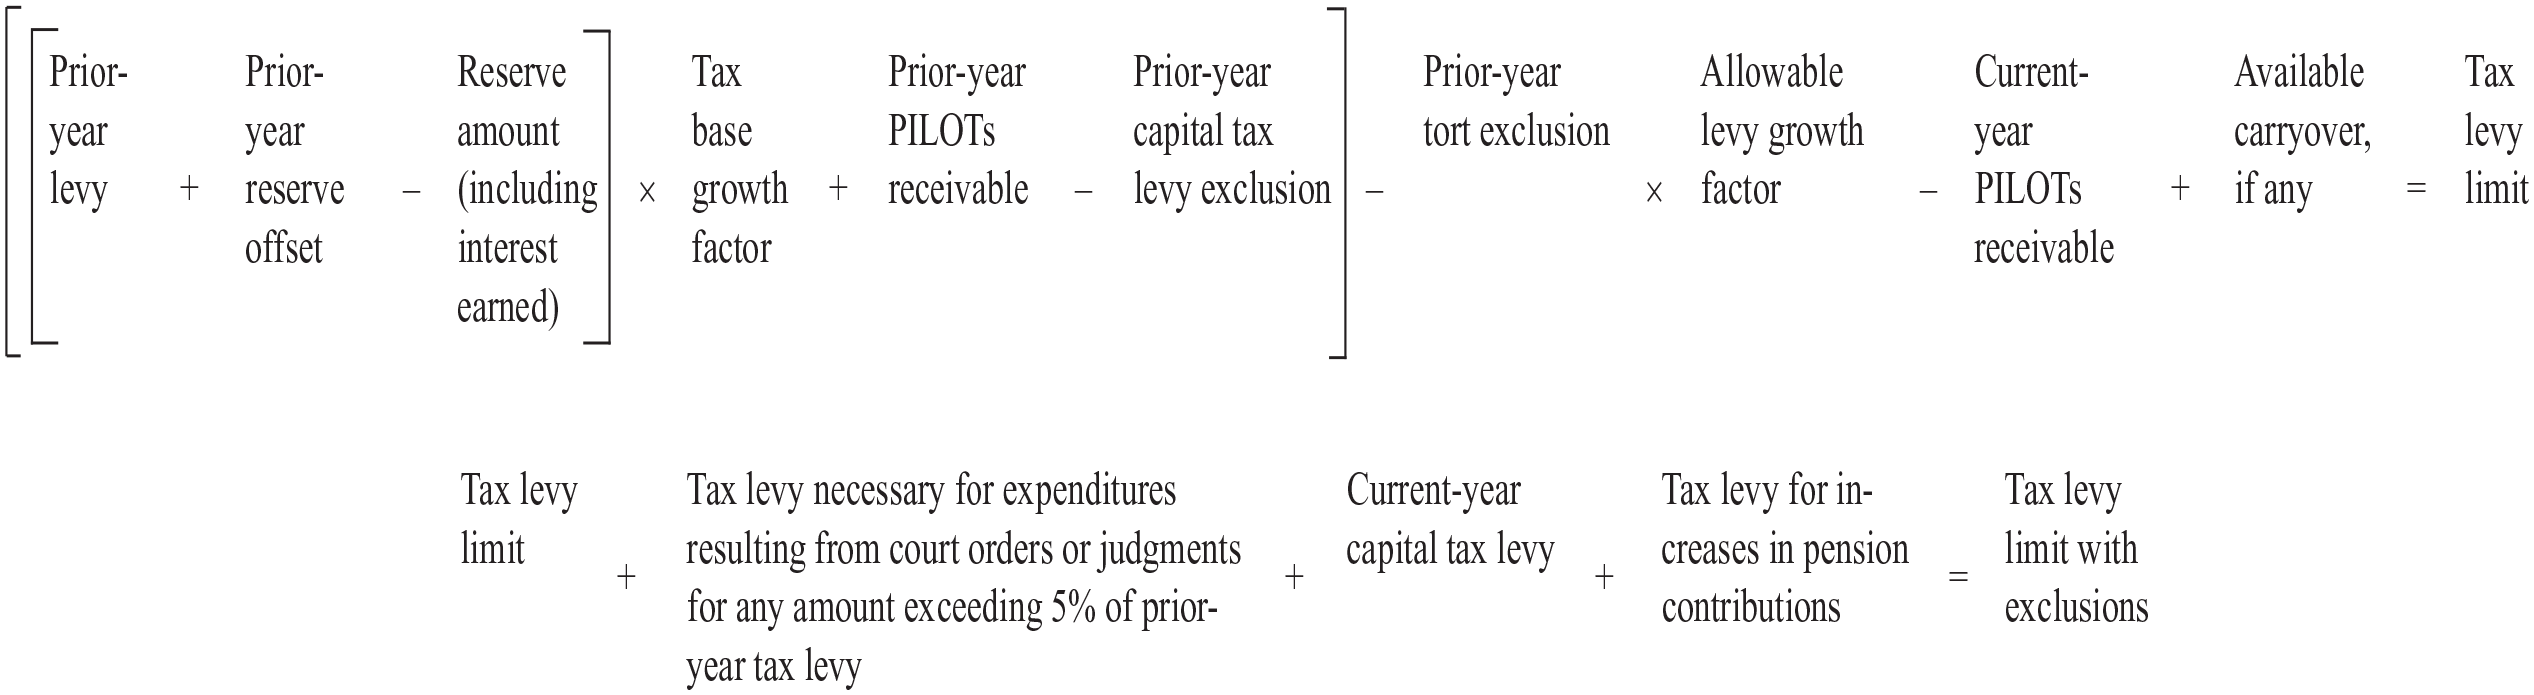
The property tax LL in NY imposes a percentage limit on total property tax levies for operating purposes without any restriction on assessed property values or tax rates. The limit’s formula starts with the district’s total prior-year property tax levy and then adds prior-year reserve offset, from which the reserve amount (including interest earned) needs to be deducted, as shown in Figure 1. It is multiplied by a district-specific tax base growth factor determined by the NY State Department of Taxation and Finance. Prior-year payments in lieu of taxes (PILOTs) receivable are then added to the resulting product, while the prior-year capital tax levy and tort exclusions are subtracted, leading to an adjusted prior-year tax levy. The adjusted prior-year tax levy is multiplied by the allowable levy growth factor, which is the lesser of either 2% or the inflation rate. During the 2013 to 2020 period, the levy growth factors used in the limit formula were 2% only in 4 years (2013, 2014, 2019, and 2020), but lower than 2% in the remaining years. The lowest growth factor was 0.12% in 2017. After subtracting PILOTs receivable in the coming year and adding available carryover, a school district will subsequently obtain its limit for its operating purposes in the coming or current fiscal year.
Property Tax Limit Formula
This limit may be exceeded due to three specific property tax exclusions: levies for court orders or judgments that surpass 5% of the previous year’s tax levy, a levy for an increase of more than 2 percentage points in the state-mandated contributions to district pension funds, and the current-year levy for capital projects. Moreover, a school district may override the exclusion-included limit if it obtains 60% voter approval. 3
What is notable from the formula is that while a district’s capital levy in the prior year is subtracted from the limit, capital levy in the current year is added to the limit. In other words, if the capital levies in the prior and current year are the same, they cancel each other out and have no effect on the limit.
How Might the Limit Affect a School District’s IAE?
There are typically three scenarios regarding how a limit on operating activities affects school districts’ IAE. The first and most straightforward scenario is that it may not have a significant effect on school IAE. As previously indicated, the limit does not impose restrictions on capital levies. Therefore, even when the limit constrains operating expenditures in at-limit districts, these districts set aside resources for their IAE separately from those used for operating purposes (Heyndels & Van Driessche, 1998; Hines & Thaler, 1995; Thaler, 1999).
The second scenario occurs when the IAE of at-limit school districts increases. Several scholars argue that school districts consider capital and labor (i.e., capital and operating expenditures) as substitutes in the production of education (Callan & Santerre, 1990; Gyimah-Brempong & Gyapong, 1992). When revenue sources for operating activities are constrained, at-limit school districts may substitute revenue away from operations and toward IAE. In other words, one might expect an increase in IAE among at-limit school districts.
The third scenario is that the constraint imposed by the limit has negative spillover effects on at-limit districts’ IAE. This scenario arises when school districts consider labor and capital as complements rather than substitutes. More specifically, an investment in school infrastructure today would require costly annual maintenance of the infrastructure in the future to keep it operational and in good condition. At-limit districts may choose to reduce their IAE due to concerns about future maintenance costs. 4
Given these three scenarios, we let the data indicate which ones apply to at-limit school districts in NY.
A Brief Review of Related Studies
Because the tax limit under investigation is imposed by the state on local governments, this review focuses on state-imposed TELs. Nguyen-Hoang and Zhang (2022) provide a literature review on the effects of TELs on school districts’ total and operating expenditures, as well as their allocation of resources across various operating expenditure functions, such as instruction versus administration. We therefore review the studies that examine the effects of state-imposed TELs on capital investments or expenditures. This body of literature is thin. Benson and Marks (2010) find that proposed and imposed revenue caps in the City of Houston led to bond yields, resulting in increased interest costs for new debts issued by the city. Park et al. (2018) found that municipalities constrained by TELs spent more on debt service and made less net capital investment during the 2008 to 2009 recession. Wang and Wu (2018) examined 100 large municipalities from 1992 to 2012 and found that municipalities in states without a legal limitation on general obligation bonds spent more on capital investments than those in states with such a limitation. Kioko and Zhang (2019) find that property tax LLs have a negative effect on county government use of tax-supported debt. Chen et al. (2019) examine 100 central cities during the 1988 to 2012 period and find that TELs measured by a debt limit indicator and a stringency index constrain these cities’ capacities to invest in capital assets, particularly for city roads. None of these studies focus on school districts. This is a gap in the literature that this study seeks to fill.
Empirical Strategy
Estimation Models
We use DID and event-study estimation methods to estimate the effects of the limit on school IAE. A limit on a school district’s property tax levy for operating purposes does not necessarily impose a constraint on its ability to raise the levy. Therefore, we follow Nguyen-Hoang and Zhang (2022) and measure the degree of constraint by distance to limit (DL). More specifically, a school district’s DL is defined as the percentage gap between the annually-varying LL and the district’s proposed property tax levy (PL), or DL = ([LL–PL]/LL)*100.
While DL is continuous, one plausibly expects that the effect of the limit is not continuous. As fully explained in Nguyen-Hoang and Zhang (2022), a unit increase in DL does not necessarily capture a unit decrease in the degree of constraint. As previously mentioned, only at-limit school districts that fully utilize the limit are most likely to be constrained by it. These districts raise nearly every property tax dollar legally permitted for its operating purposes. Therefore, the DL for at-limit districts must be really small; that is, DL ≤
At-limit school districts whose DL ≤ 0.1% are considered to be “treatment” school districts. They include districts that override their limits or DL < 0. All remaining districts with DL > 0.1% are not at limit and are referred to as comparison districts. We use a sample period of 2011 to 2020 for a panel of school districts on the following DID model:

where
We include a series of control variables (
The more a school district would like to spend on operating activities, the more likely it is to reach its limit. As we argued in the previous section, operating, and capital expenditures are simultaneously determined by the school district. All of this suggests that the key variables,
An event-study specification takes the following form:
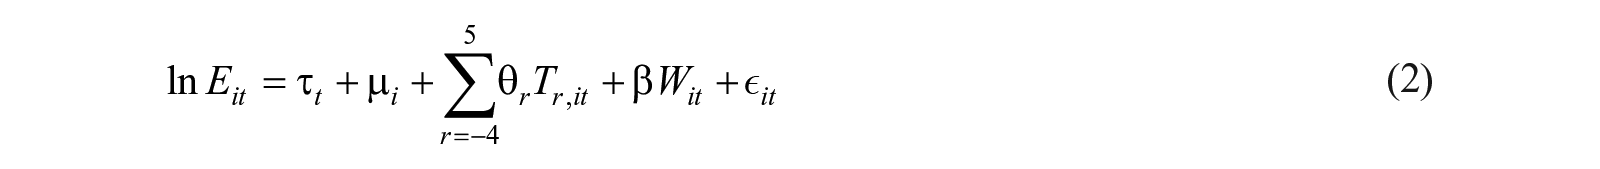
where
We estimate equations (1) and (2) with various dependent variables that are discussed in the subsequent section. Hypothesis testing is done using robust standard errors clustered at the school district level.
Additional Analyses
We conduct multiple additional analyses. The first set of these analyses revolves around examining the heterogeneity in the effects of the limit by district groups—the answer to the second question. As with Nguyen-Hoang and Zhang (2022), we use four groups of school districts categorized by the state-calculated need/resource capacity (NRC) index: urban high-need, rural high-need, average-need, and low-need school districts.
5
In other words, we allow each group,
As indicated earlier, infrastructure can be funded by property tax revenues, debt, and state aid. The second set of additional analyses is to address the third research question, that is, the extent to which the observed effects in the three primary dependent variables of IAE can be attributed to changes in school districts’ debt financing and state infrastructure aid.
Third, we conduct a series of sensitivity analyses. In the main estimations, we do not consider the subsequent events of being at limit. Following Lafortune et al. (2018) and Nguyen-Hoang and Zhang (2022), we replicate the data for school districts with multiple events. Specifically, a district with four at-limit events has four copies (or cohorts); each cohort has only one event. We then stack all replicated cohorts with no-event districts. The coding method for
Variables and Data
To capture a school district’s IAE, we use two variables: the values on machinery and equipment (M&E) and buildings. The values of these two items are reported on a school district’s balance sheet. M&E represents the acquisition values of machinery, tools, trucks, buses, computers, and furnishings. The building account reflects the original purchase prices of all permanent buildings and the fixtures attached to those buildings as well as all annually completed building improvements and upgrades. While district fixed effects control for the stable components of M&E and building (i.e., acquisition values), our estimation model captures the effects of annual changes in M&E and building values.
Given that school districts may issue debt or seek more state aid to finance infrastructure, we use two variables, namely debt outstanding and building aid. In NY, the building aid program is an open-ended matching aid for state-approved instructional (not administrative) buildings costing more than $10,000 and for school bus garages. The building aid covers between 10% and 95% of the approved project cost and gives more incentives for renovation than for new construction (State Aid Work Group, 2002).
Table 1 provides summary statistics of the variables (and their sources) we used in our regressions. The sample is panel data for 663 NY state school districts from 2011 through 2020; 29 of these 663 districts were never at limit during the sample period. This study focuses on two main dependent variables: machinery and equipment and buildings. The average values of M&E and building are $5.3 and $60 million, respectively. Among the four subgroups, urban high-need school districts have the highest average values, while rural high-need school districts have the lowest average values for these two dependent variables. The mean value of the indicator, D, is 0.43, indicating that during the study period, approximately half of the district years were at-limit occurrences. In addition, low-need districts that rely the least on property taxes have the highest share (0.5) of at-limit years among the four district groups.
Descriptive statistics
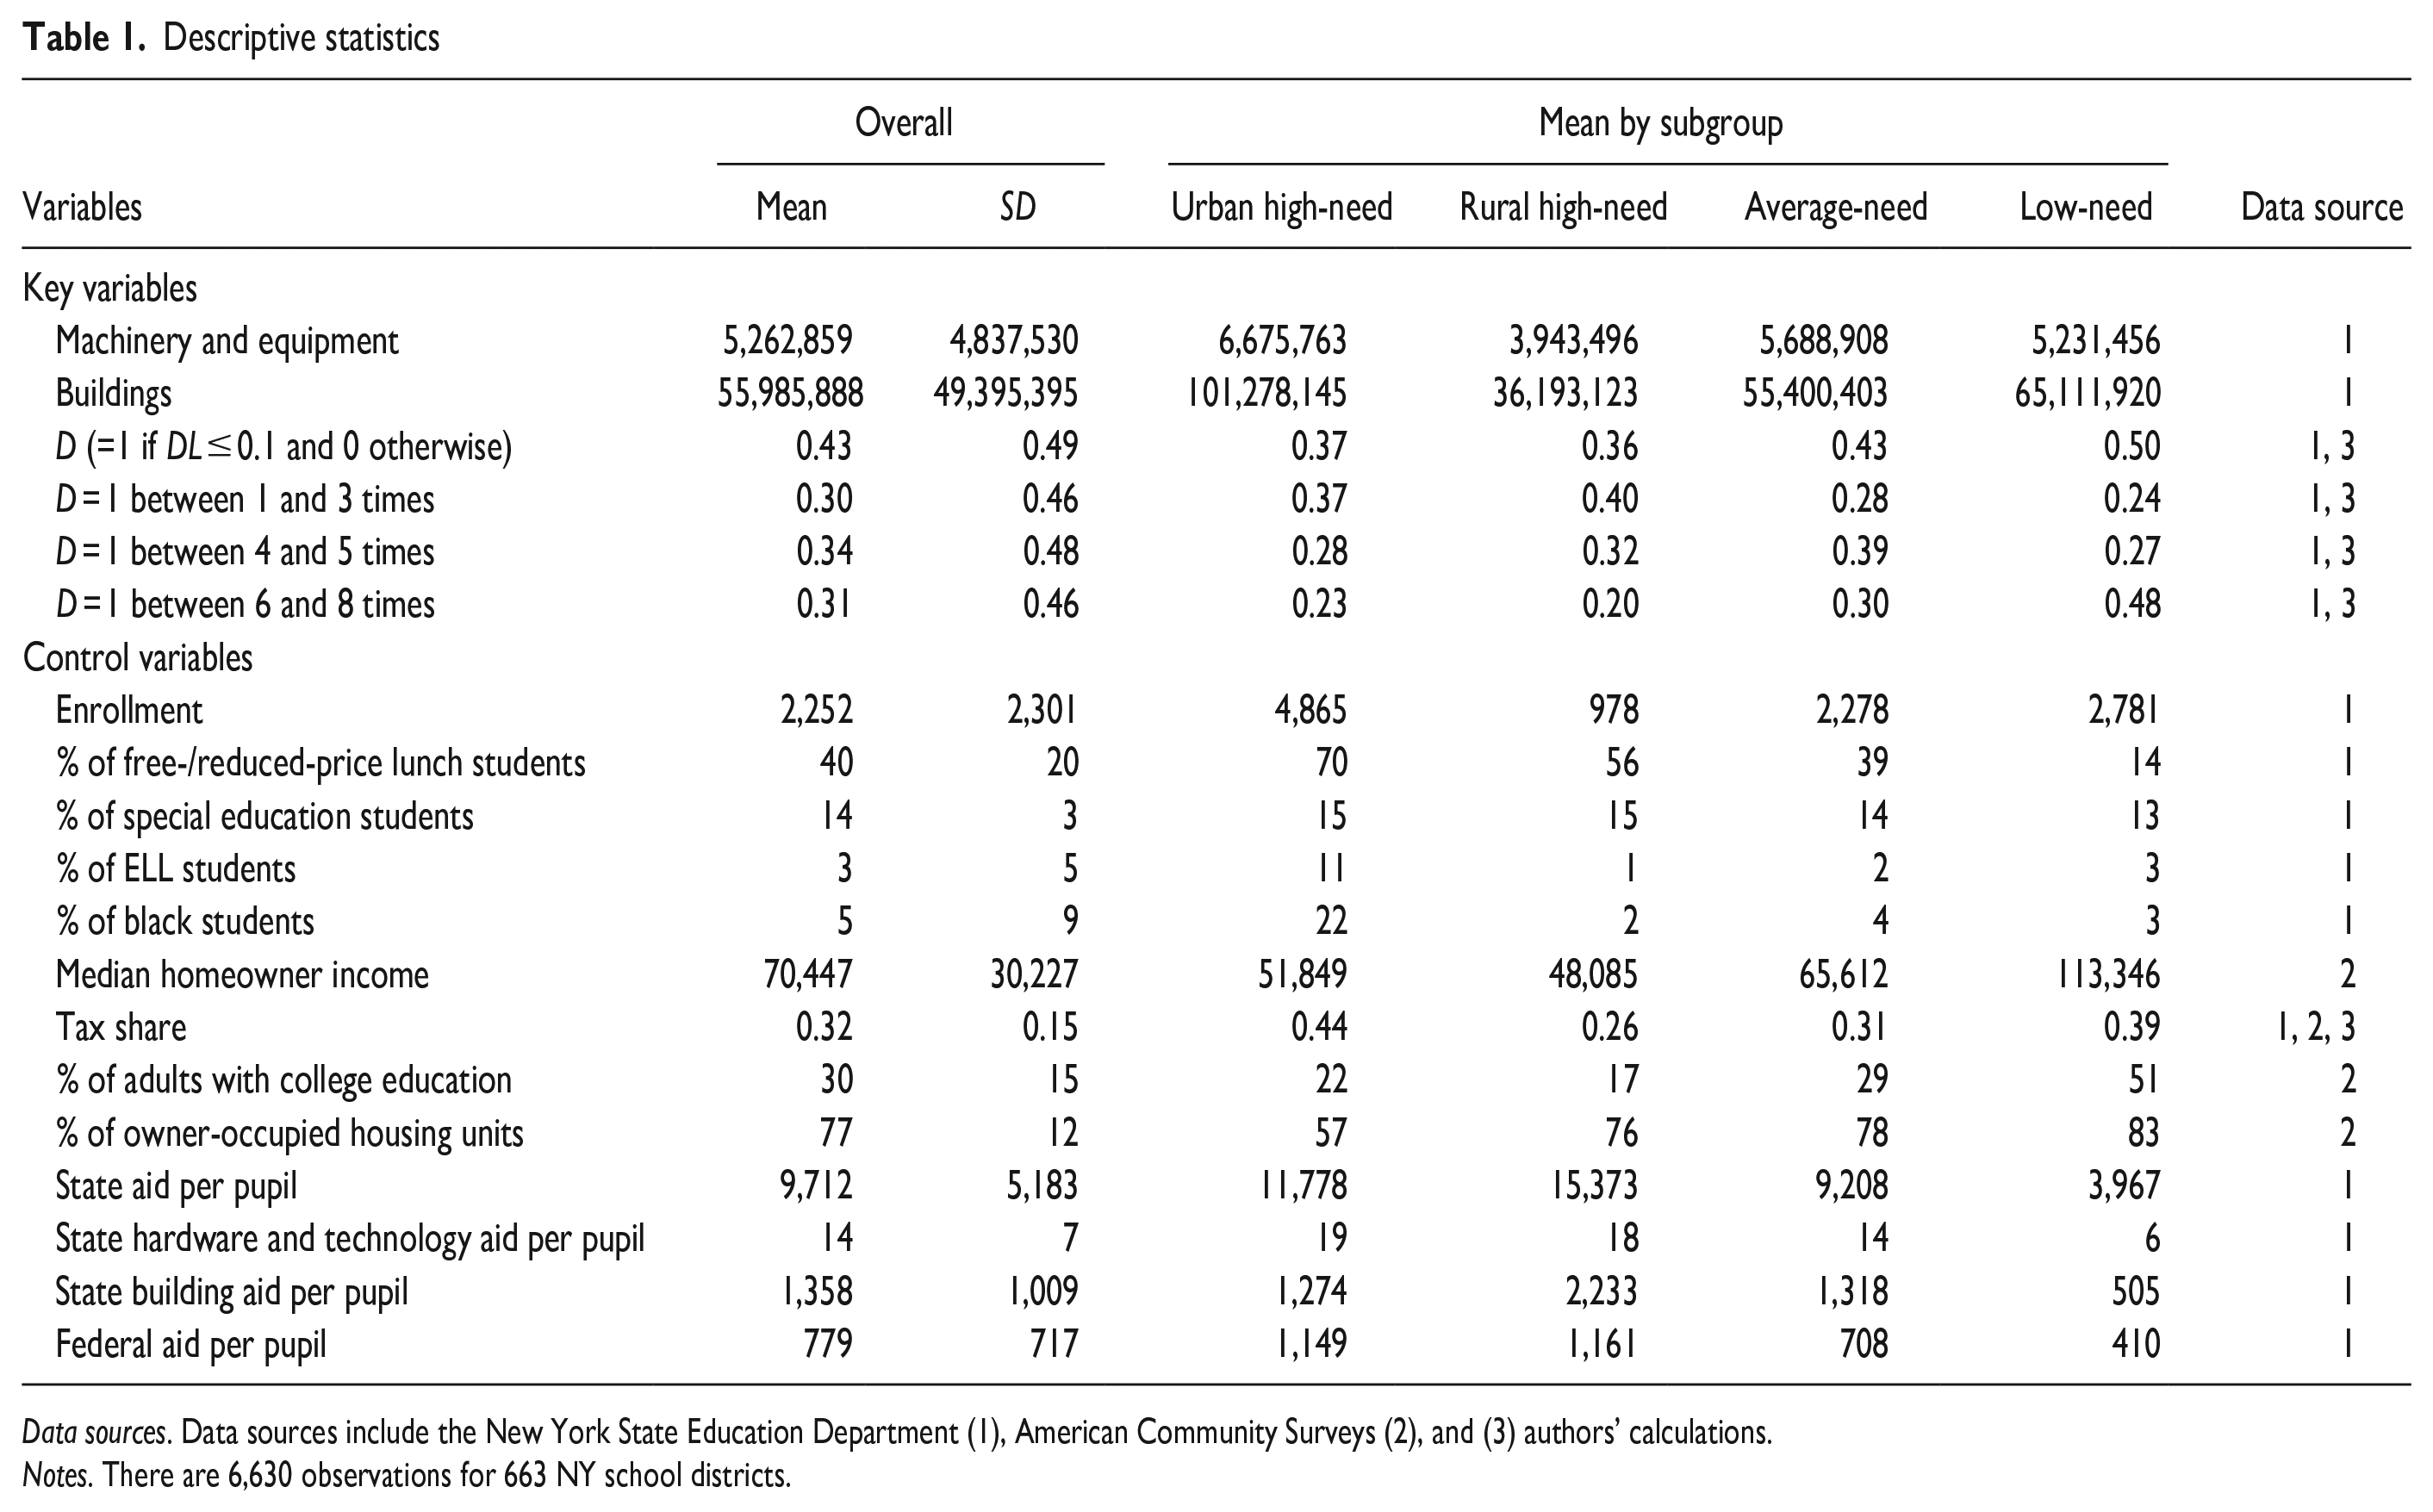
Data sources. Data sources include the New York State Education Department (1), American Community Surveys (2), and (3) authors’ calculations.
Notes. There are 6,630 observations for 663 NY school districts.
Results
We estimate the DID models and present the main results in Table 2. Columns 1 and 3 show results from models with a single dummy treatment indicator, D. These columns show that the limit has some negative effects on M&E and buildings, but these effects are not statistically significant. Columns 2 and 4 present results from models with both pre- and post-trend variables. When controlling for the two trend variables, the limit does not have an immediate effect on at-limit districts immediately (i.e., D is not statistically significant). Instead, these districts annually lower their investments in M&E and buildings by 1% and 0.5%, respectively, as a result of the limit. These effects, however, are statistically significant at the 10% level. While the results are only marginally significant, they suggest potential effects of the limit that justify using more flexible specifications, including the event-study design. In addition, the three pre-trend variables are not statistically significant, offering initial support for the common pre-trend assumption.
DID Results
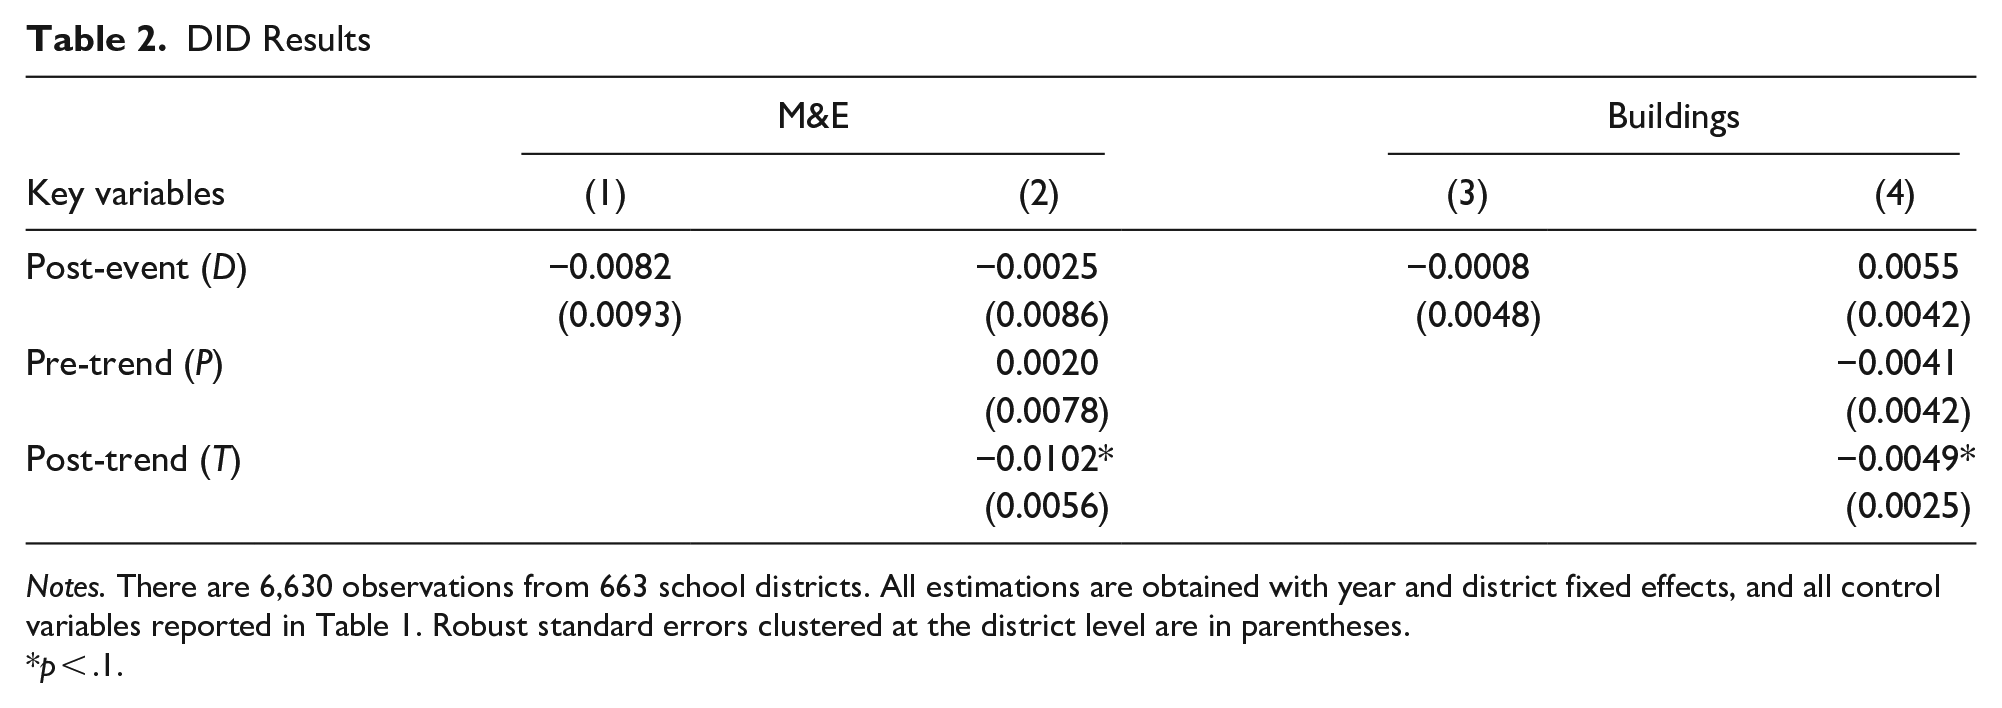
Notes. There are 6,630 observations from 663 school districts. All estimations are obtained with year and district fixed effects, and all control variables reported in Table 1. Robust standard errors clustered at the district level are in parentheses.
p < .1.
Figure 2 presents nonparametric event-study results obtained by estimations of equation (3). The figure does not show strong evidence of the effects of the limit on the two outcomes of interest. The coefficients of T1 to T5 show the imprecise negative effects of the limit on the two outcomes. The absolute values of the coefficients increase over time. However, none of the point estimates is statistically significant at the 5% level. We also find no statistically significant effects in the years preceding the limit, providing additional support for the common pre-trend assumption. Overall, the findings provide some evidence of small, gradual decreases; however, all these coefficients are estimated imprecisely.
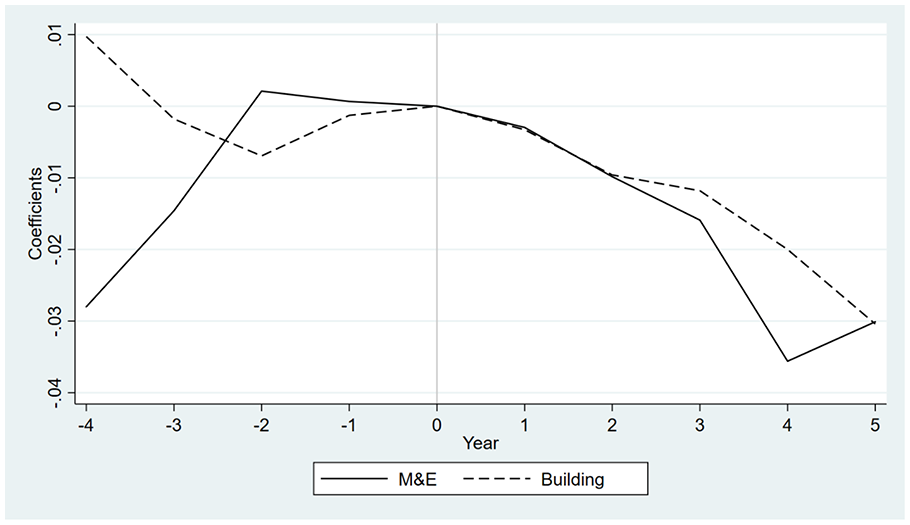
Event-Study Results
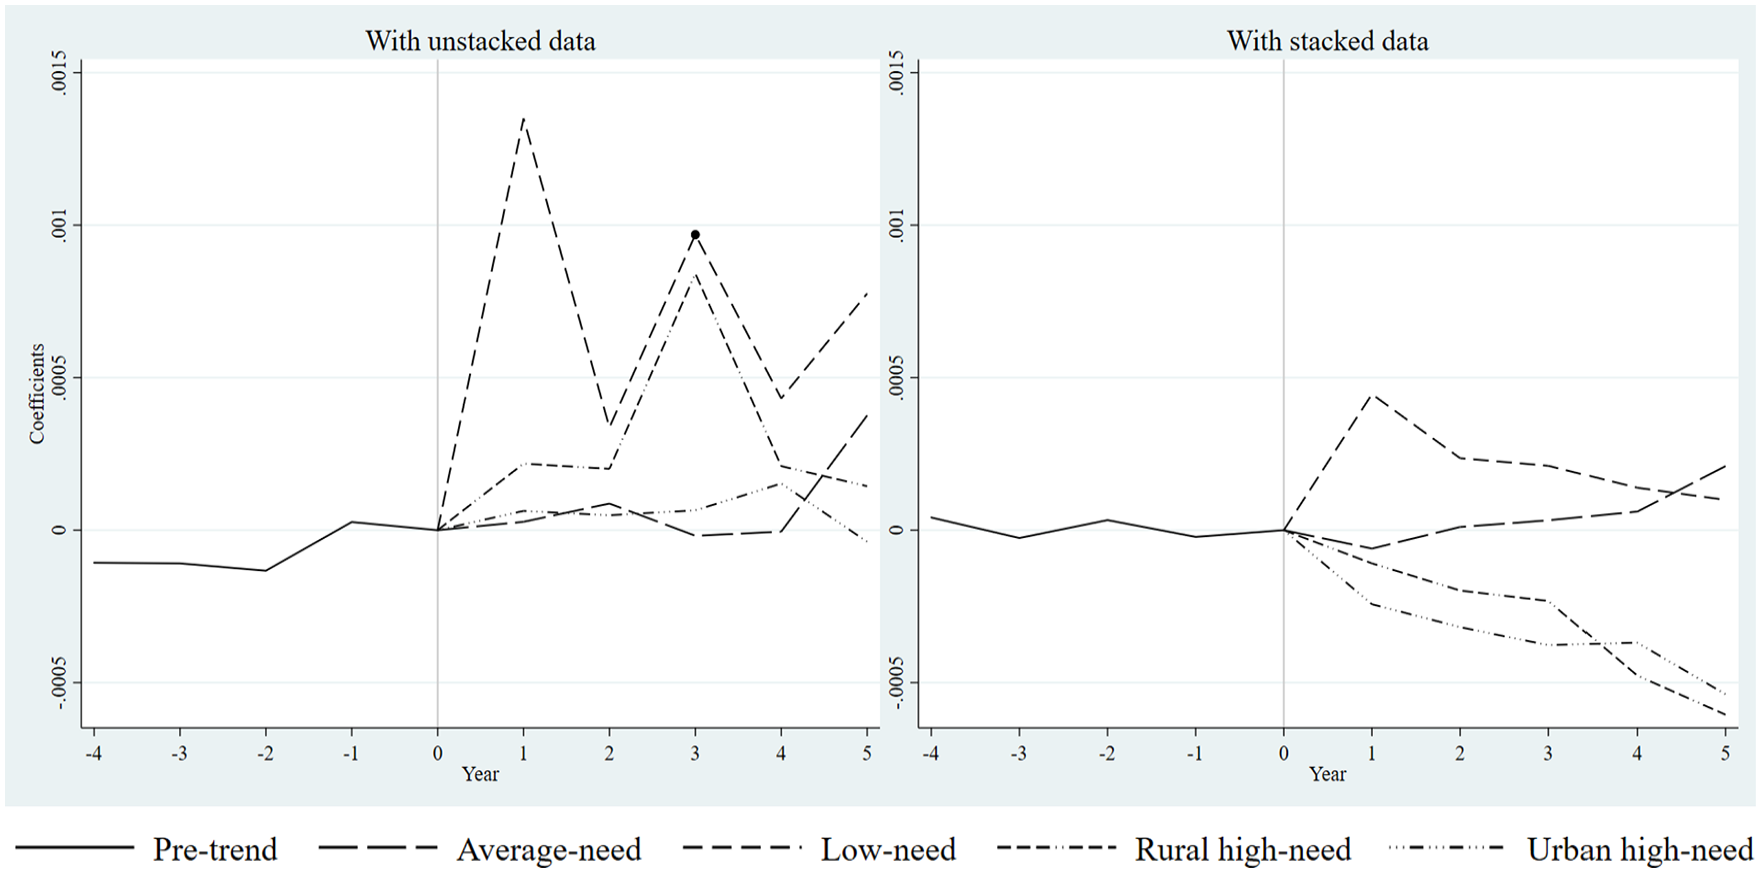
Figure 3 displays the results regarding whether the effects or the absence of effects, differ by four NRC-based district groups. The results reveal that the limit has no significant effect on average and low-need school districts. However, it is worth noting that Nguyen-Hoang and Zhang (2022) find that the operating expenditures of both district types are significantly constrained by the limit. The results in Figure 3 suggest that the limit follows the expected pattern for these districts when the capital levy is not subject to any limitation.
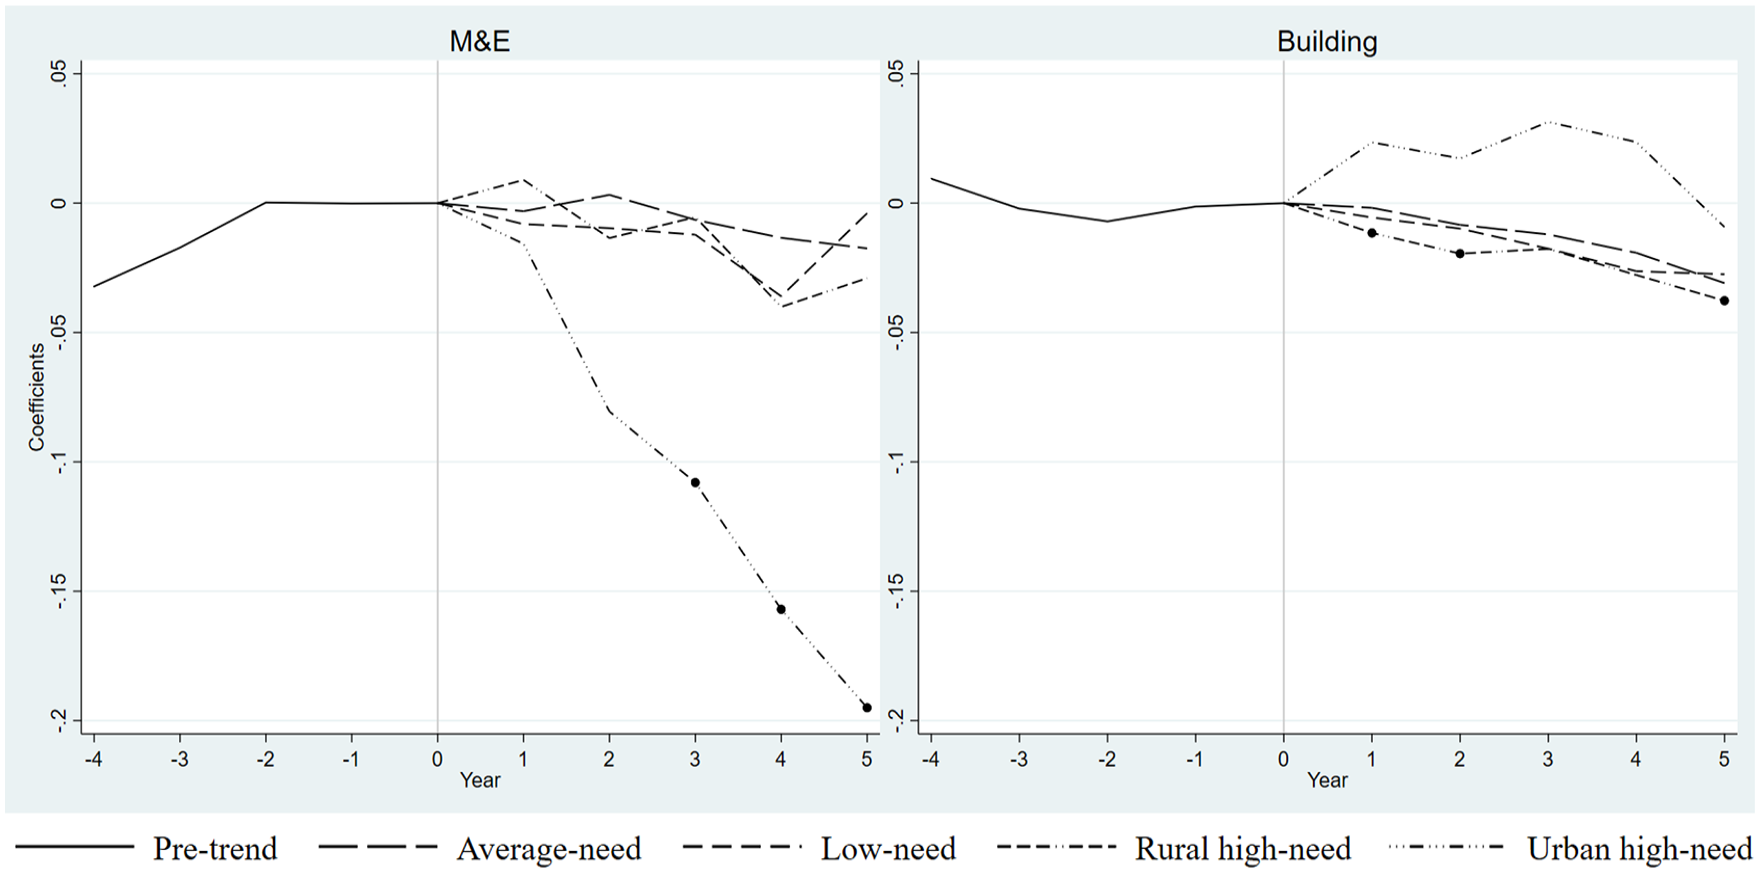
Event-Study NRC-Based Subgroup Analysis
In contrast, we find that at-limit urban high-need school districts are the only district type whose values of M&E are negatively affected by the limit. Specifically, the districts’ M&E values would have been higher by 10.8% in year 3, 15.7% in year 4, and 19.5% in year 5 and beyond. Similarly, rural high-need school districts would have had higher building values in years 1, 2, and 5 onwards. For example, the limit reduced this district group’s building value by 3.8% in year 5 and beyond. Overall, these results suggest that rural and urban high-need districts treat labor and capital as complements, which aligns with the third scenario we explained earlier.
Figure 4 represents the results using stacked data. The results in Figure 4 show similar patterns to those in Figure 3. However, there are a few differences. First, there are more statistically significant point estimates with stacked data than with the original (unstacked) data. For example, the M&E values for urban high-need school districts are significant in all post-event years, as opposed to only in years 3 and beyond, as shown in Figure 3. This makes sense because the larger number of observations with stacked data leads to smaller standard errors and, thus, more precise estimations. Second, the absolute values of the point estimates are smaller with stacked data than with unstacked data. For example, the building values of rural high-need districts would have been 3.8% higher with unstacked data but 1.9% higher with stacked data. This observation is explained by the fact that each cohort in stacked data contains only one event, whereas 73% of at-limit districts experience more than one event during the sample period. In other words, the effects of the limit on the districts with more than one event accumulate over the years, resulting in larger (in absolute value) point estimates.
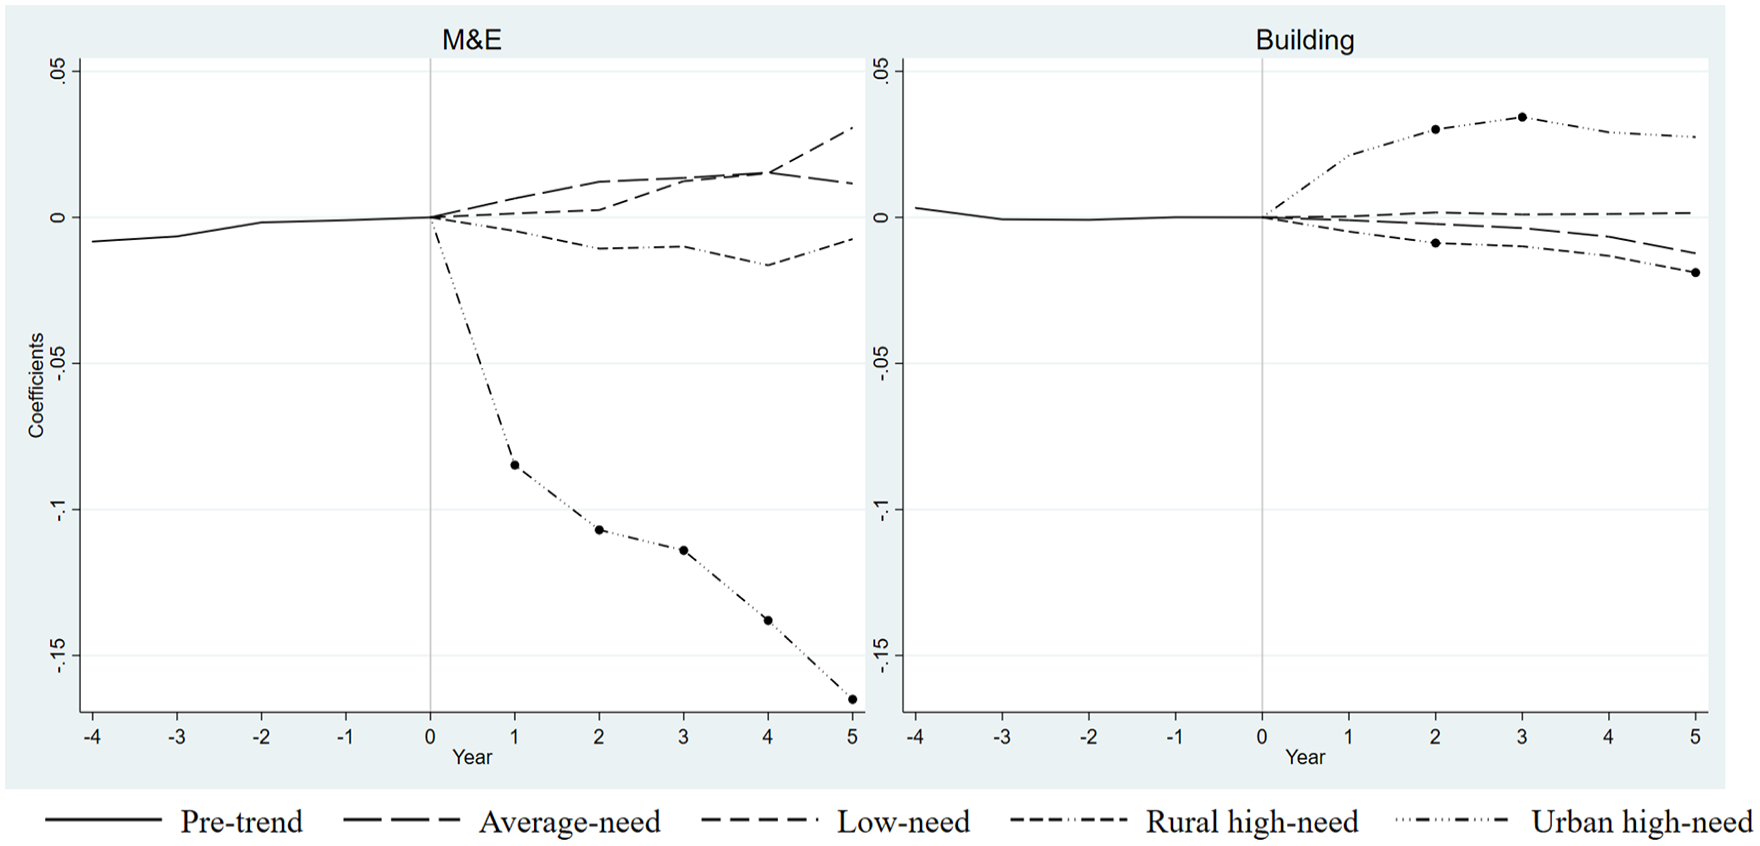
Event-Study NRC-Based Subgroup Analysis with Stacked Data
Figure 5 shows the results using the numbers of at-limit years that represent the intensity of the limit. Since these numbers vary from one district to another, we categorize at-limit districts into three groups using this intensity measure: 201 districts being at limit 1 to 3 times (light), 228 districts being at limit 4 to 5 times (moderate), and 205 districts being at limit 6 to 8 times (heavy). Given that Figure 3 shows that the limit has significant effects on the M&E of urban high-need districts and the building value of rural high-need districts, Figure 5 focuses on these two types of districts. This figure shows that the negative effects of the limit on districts’ M&E increase in absolute value with the duration of being at limit. The moderate group districts, for example, show more significant large decreases than the light group of districts. However, we find similarities in the effects of the limit among the three groups in year 5 and beyond. The findings for rural high-need districts’ building values show no clear patterns that differ by the three groups.
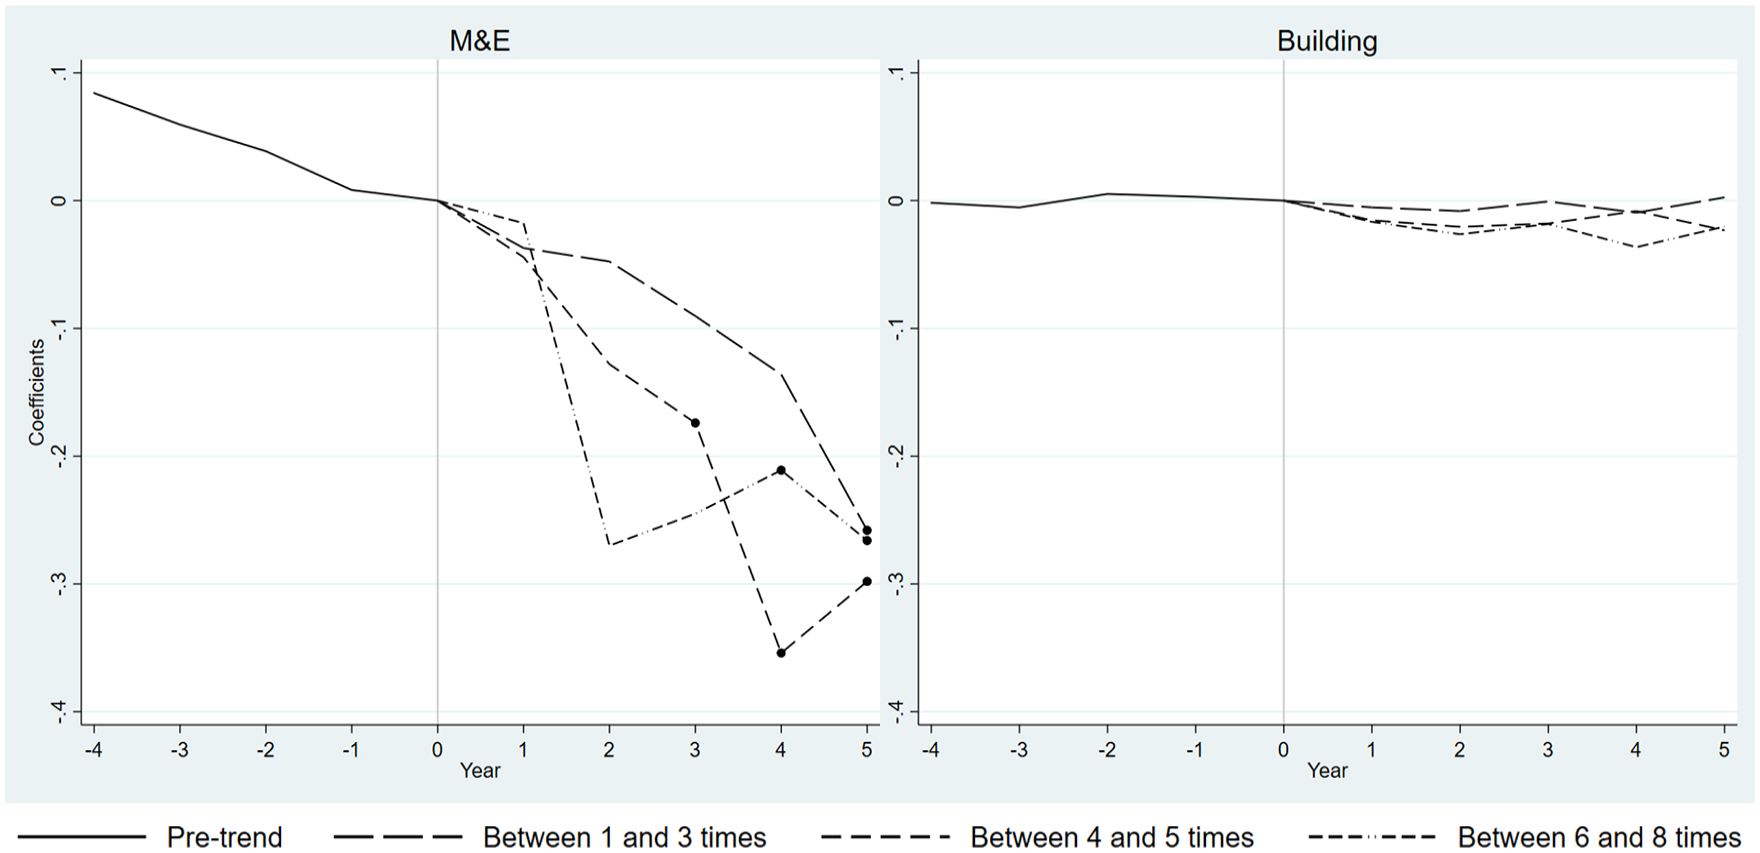
Event Study Subgroup Analysis with Treatment Duration
Figures 6 and 7 address the third research question, that is, whether at-limit school districts issue more debt or seek out more state aid. Figure 6 shows that almost all point estimates are not statistically significant, regardless of whether the data are unstacked or stacked. In other words, at-limit school districts do not seem to issue more debt for infrastructure projects. Figure 7 shows that with unstacked data, the building aid of at-limit school districts has no significant change in event years. However, the results obtained with stacked data show significant increases in building aid in all post-event years for urban high-need districts. Compared to the results in Figure 4, these increases in building aid correspond with higher building value, suggesting that urban high-need school districts may be using the building aid for annual renovations. Overall, there is no evidence that, except for urban high-need districts, districts manage to issue more debt or seek out more state aid in response to the limit.
Event-Study NRC-Based Subgroup Analyses for Debt Outstanding
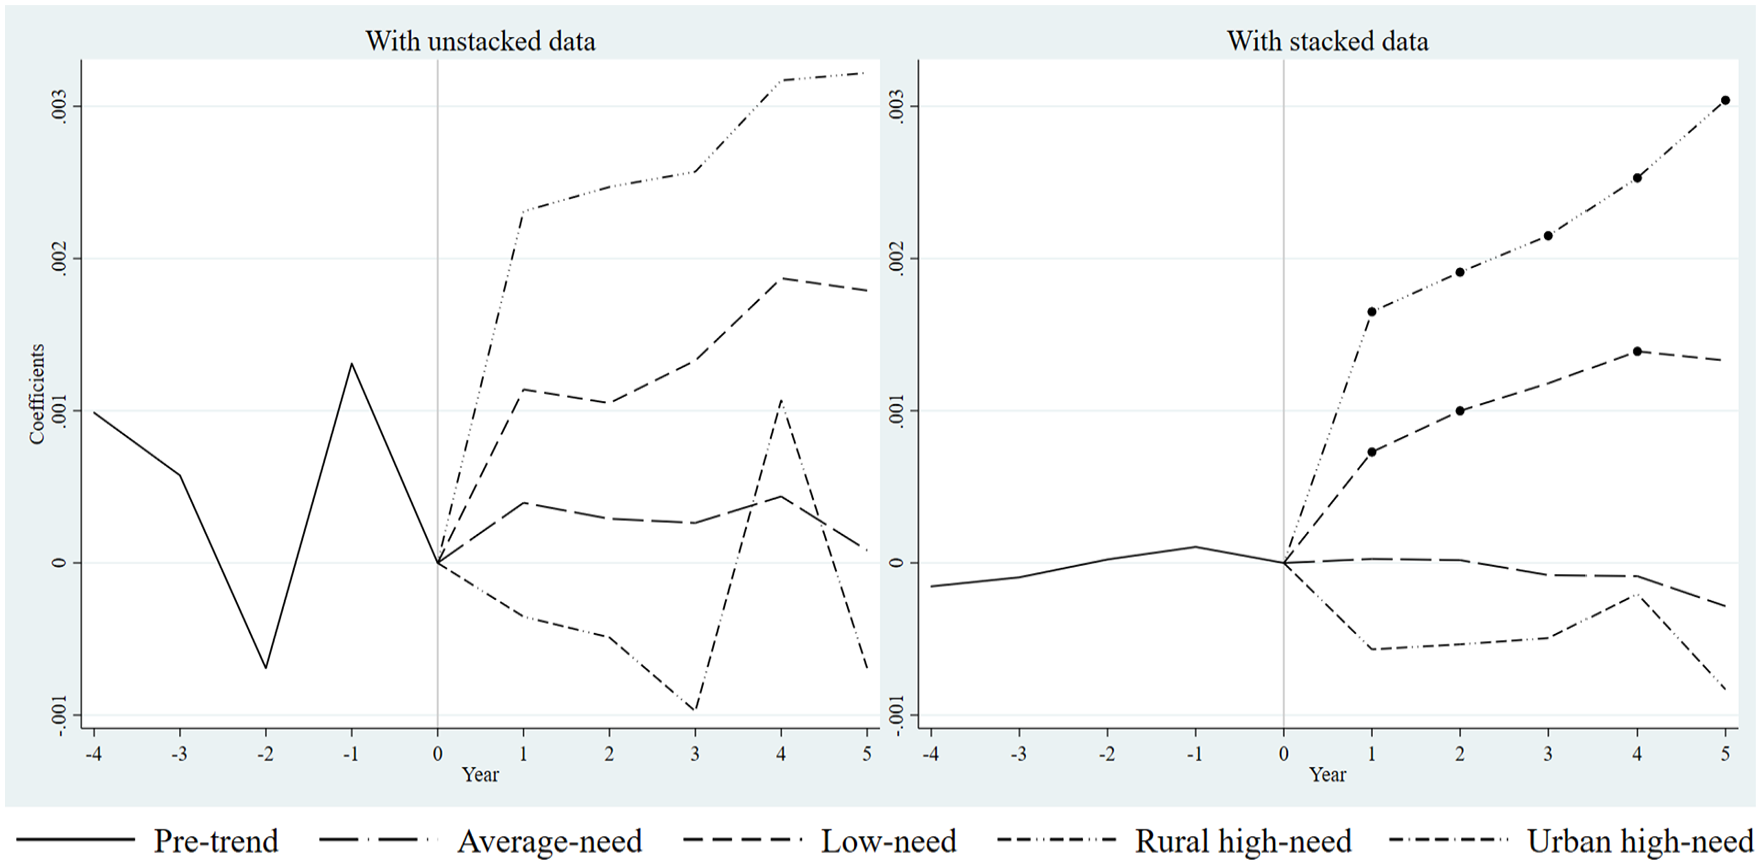
Event-Study NRC-Based Subgroup Analyses for State Building Aid.
The results we previously discussed are based on at-limit districts, defined as those with a proposed levy within 0.1% of their LL in a year or with an annual DL,
Sensitivity Main Results with
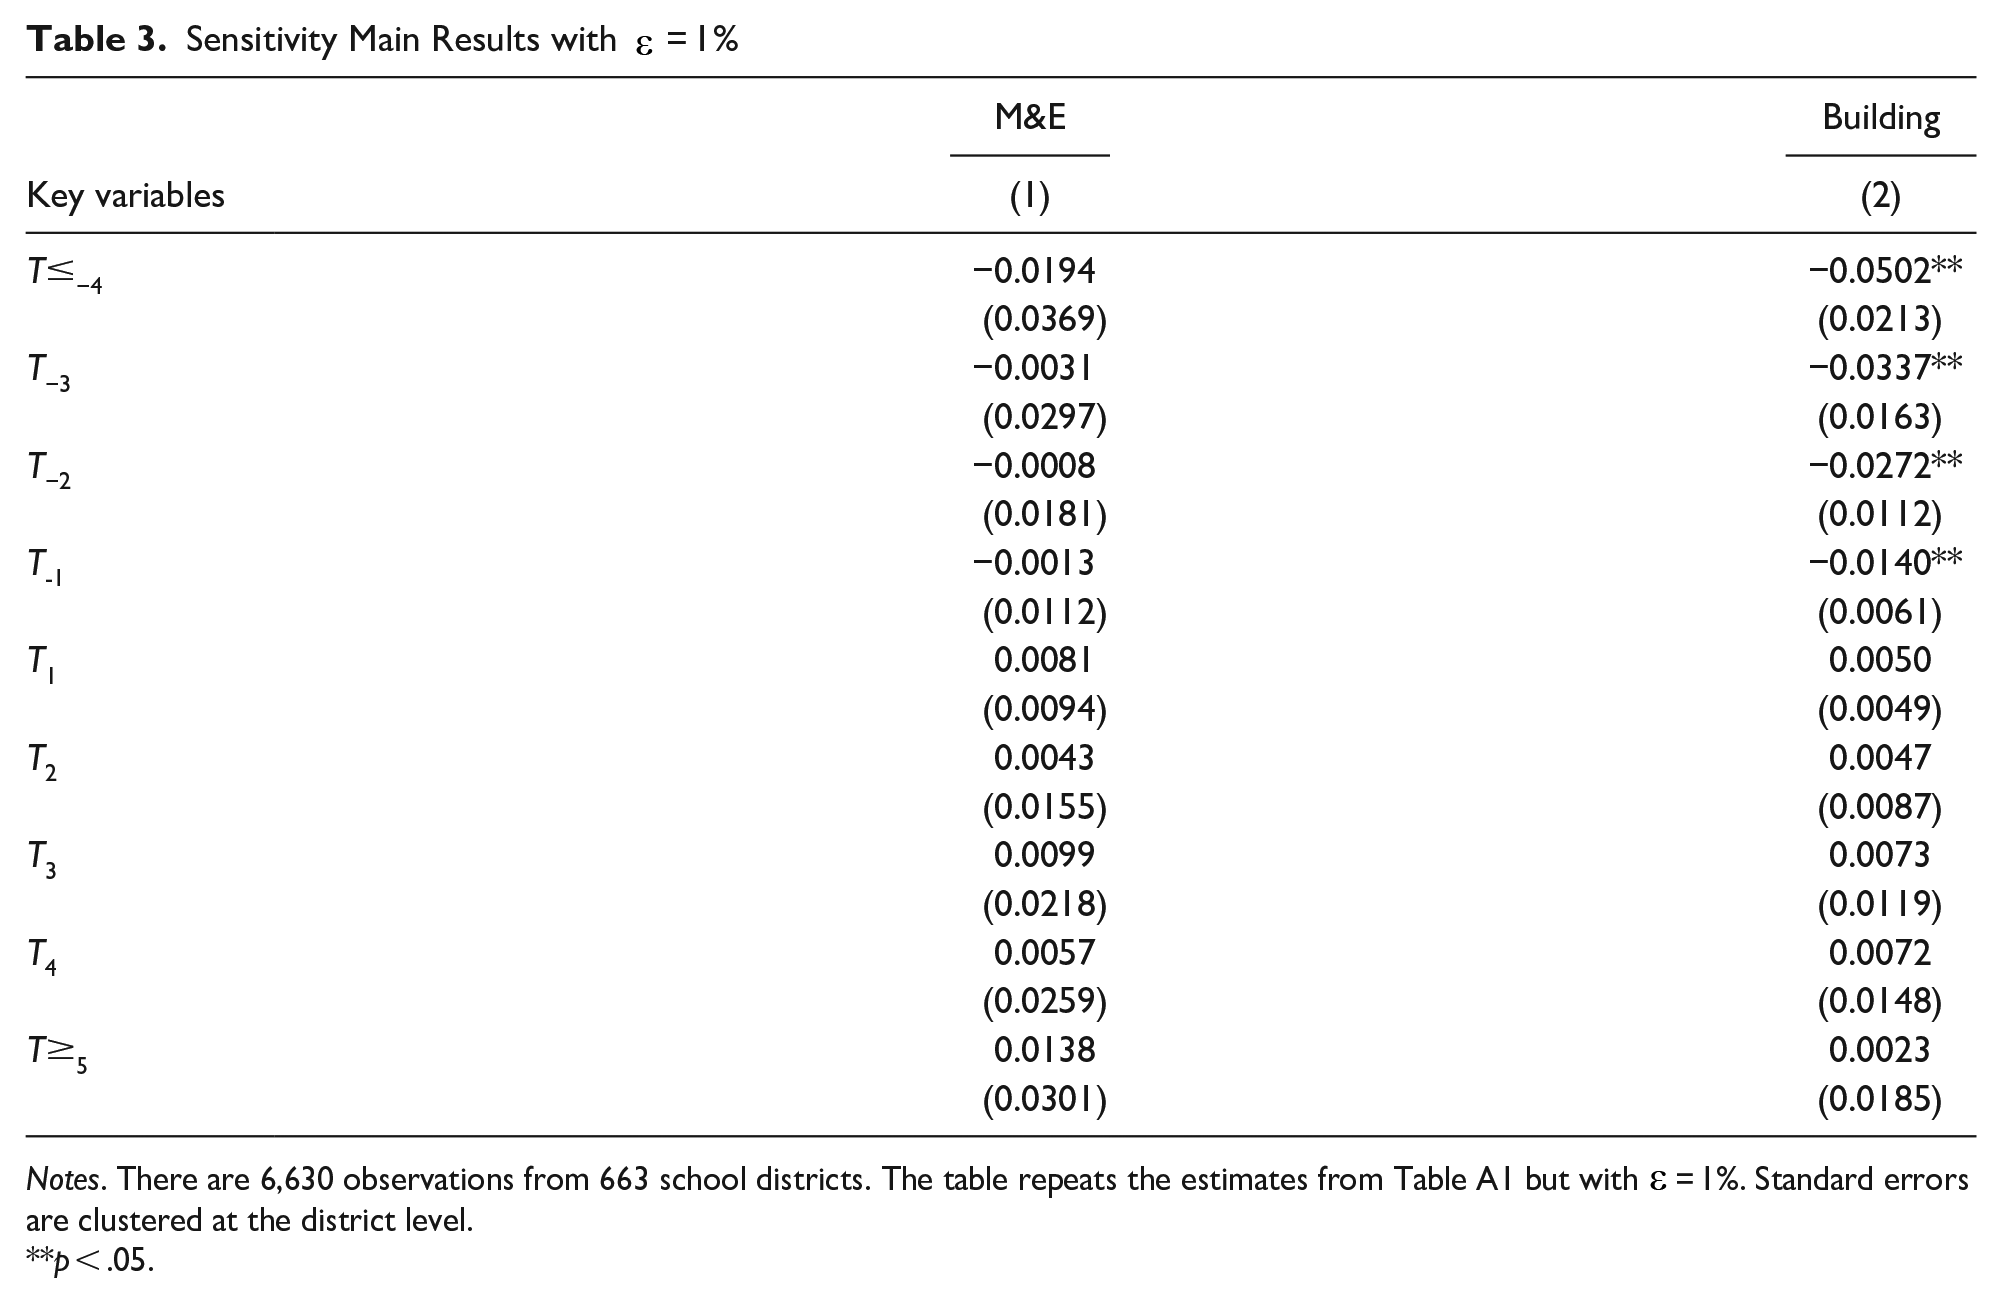
Notes. There are 6,630 observations from 663 school districts. The table repeats the estimates from Table A1 but with
p < .05.
Event Study Subgroup Analysis with
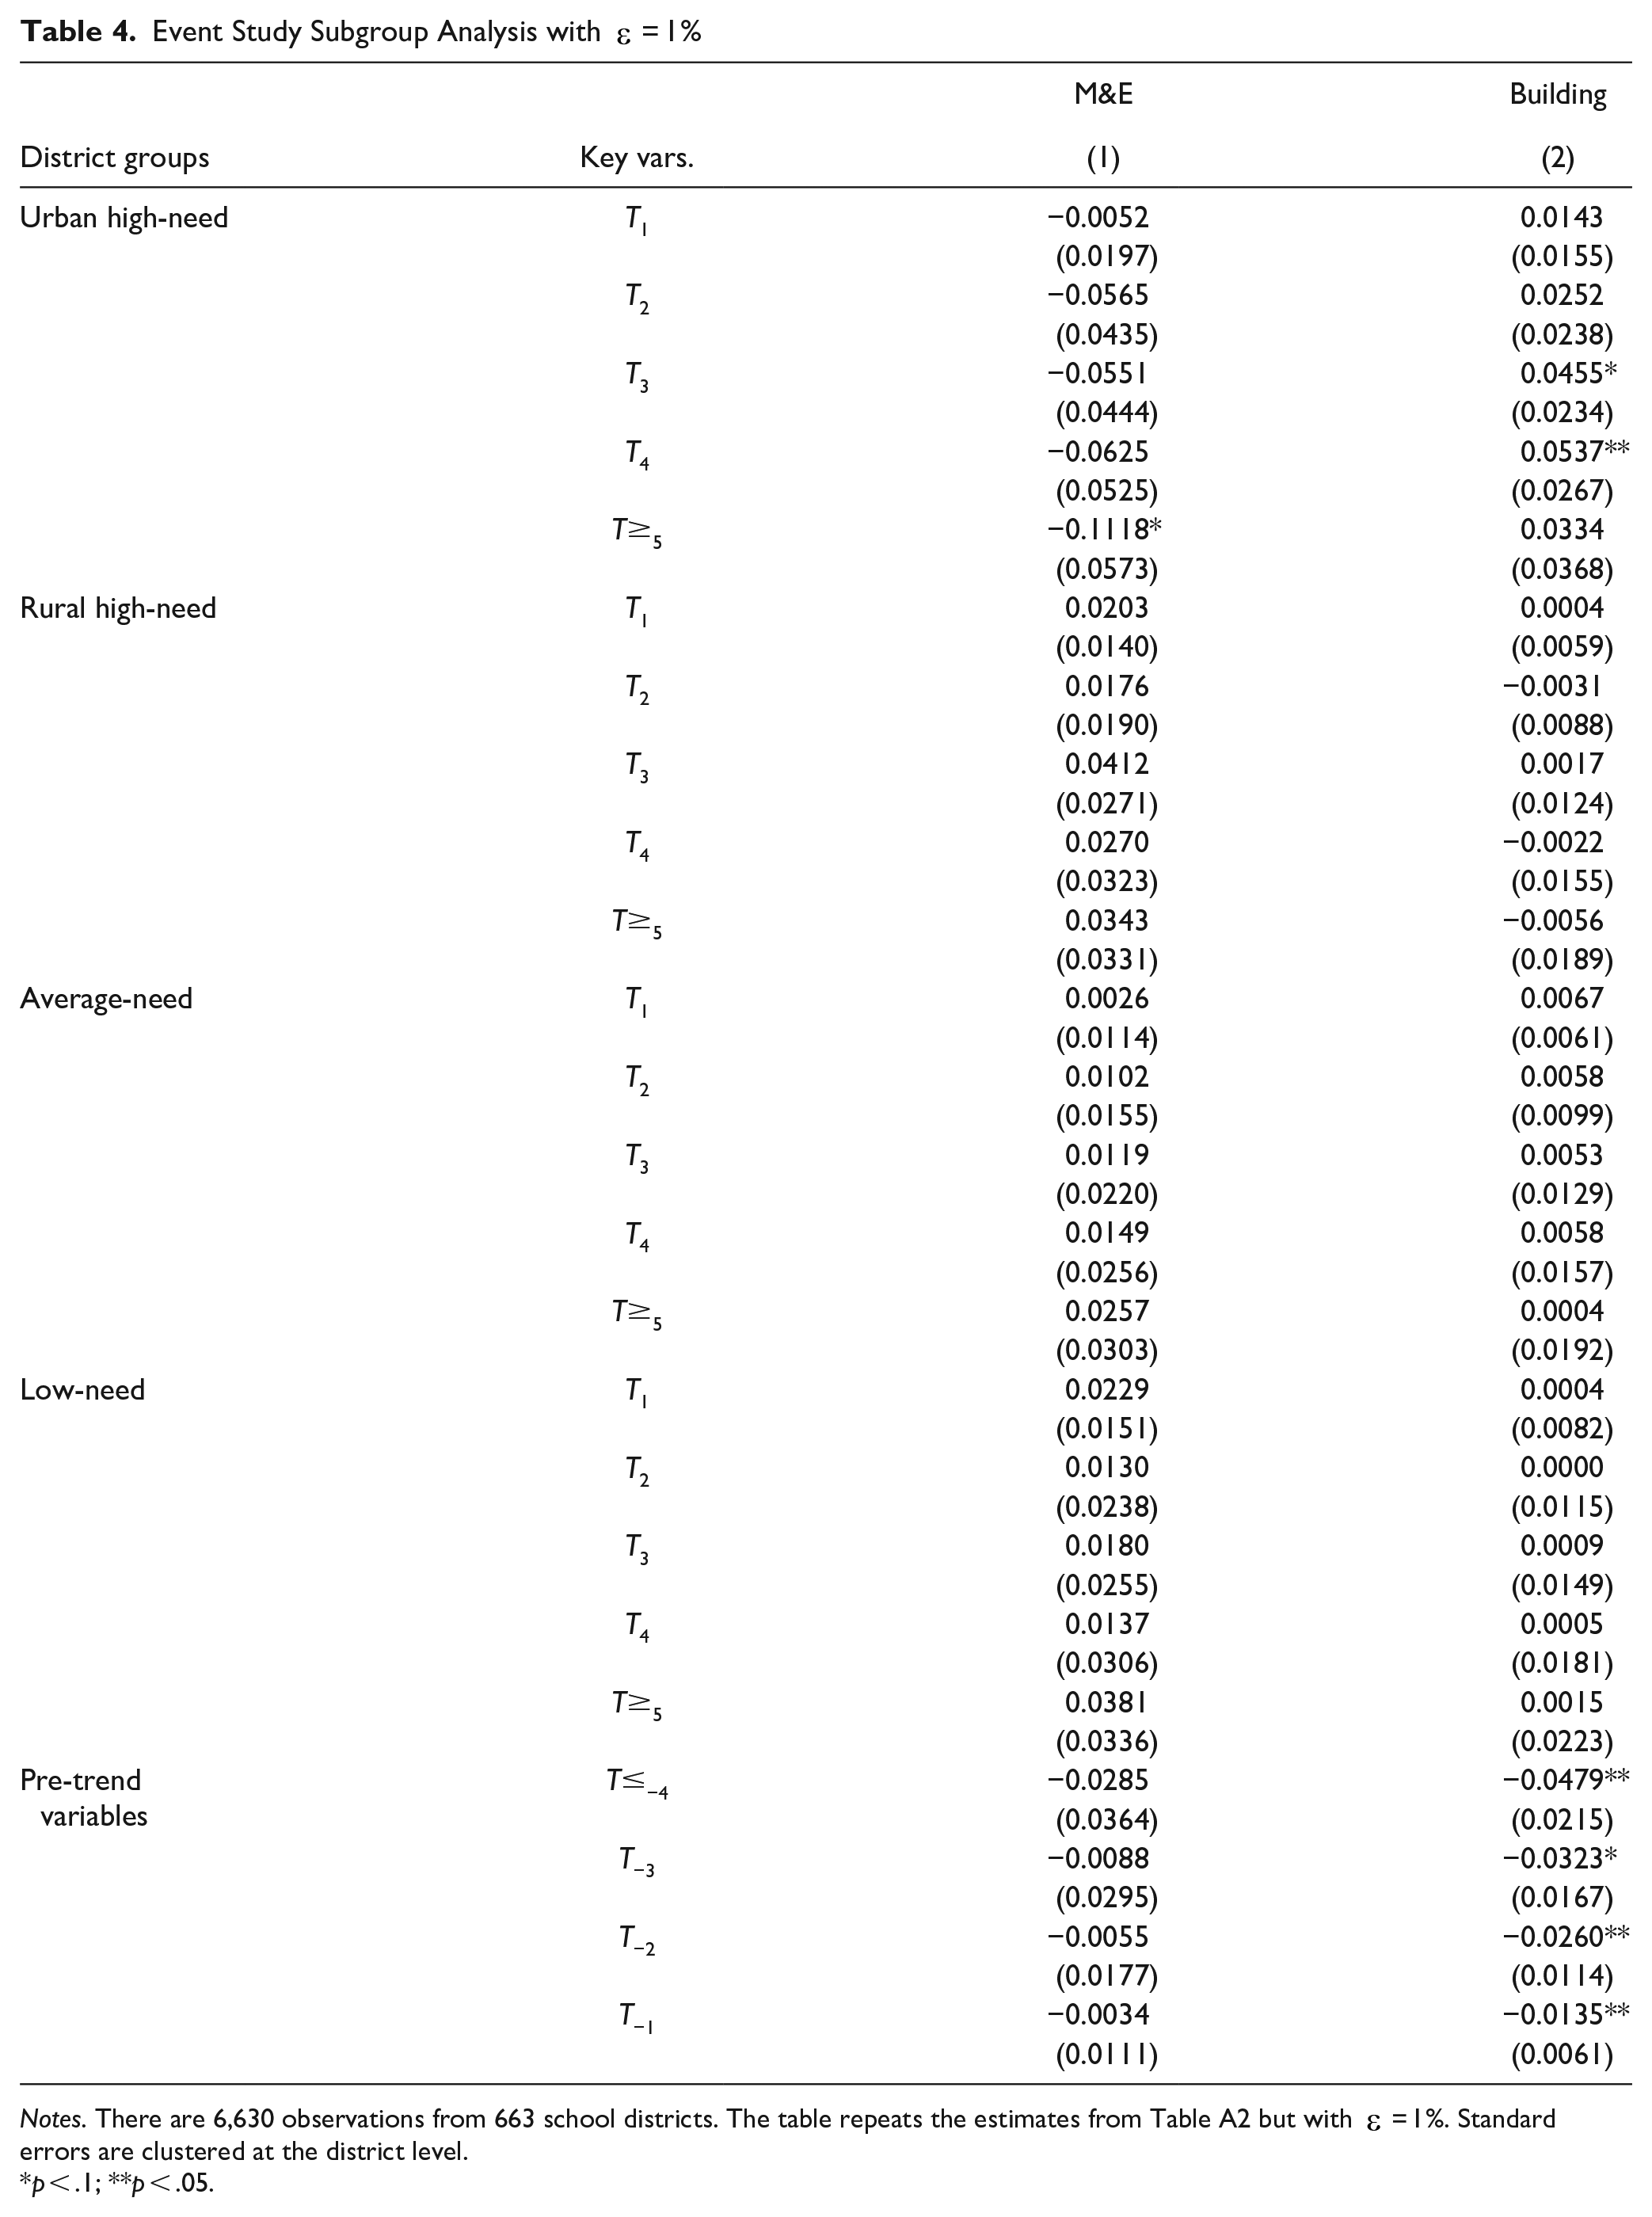
Notes. There are 6,630 observations from 663 school districts. The table repeats the estimates from Table A2 but with
p < .1; **p < .05.
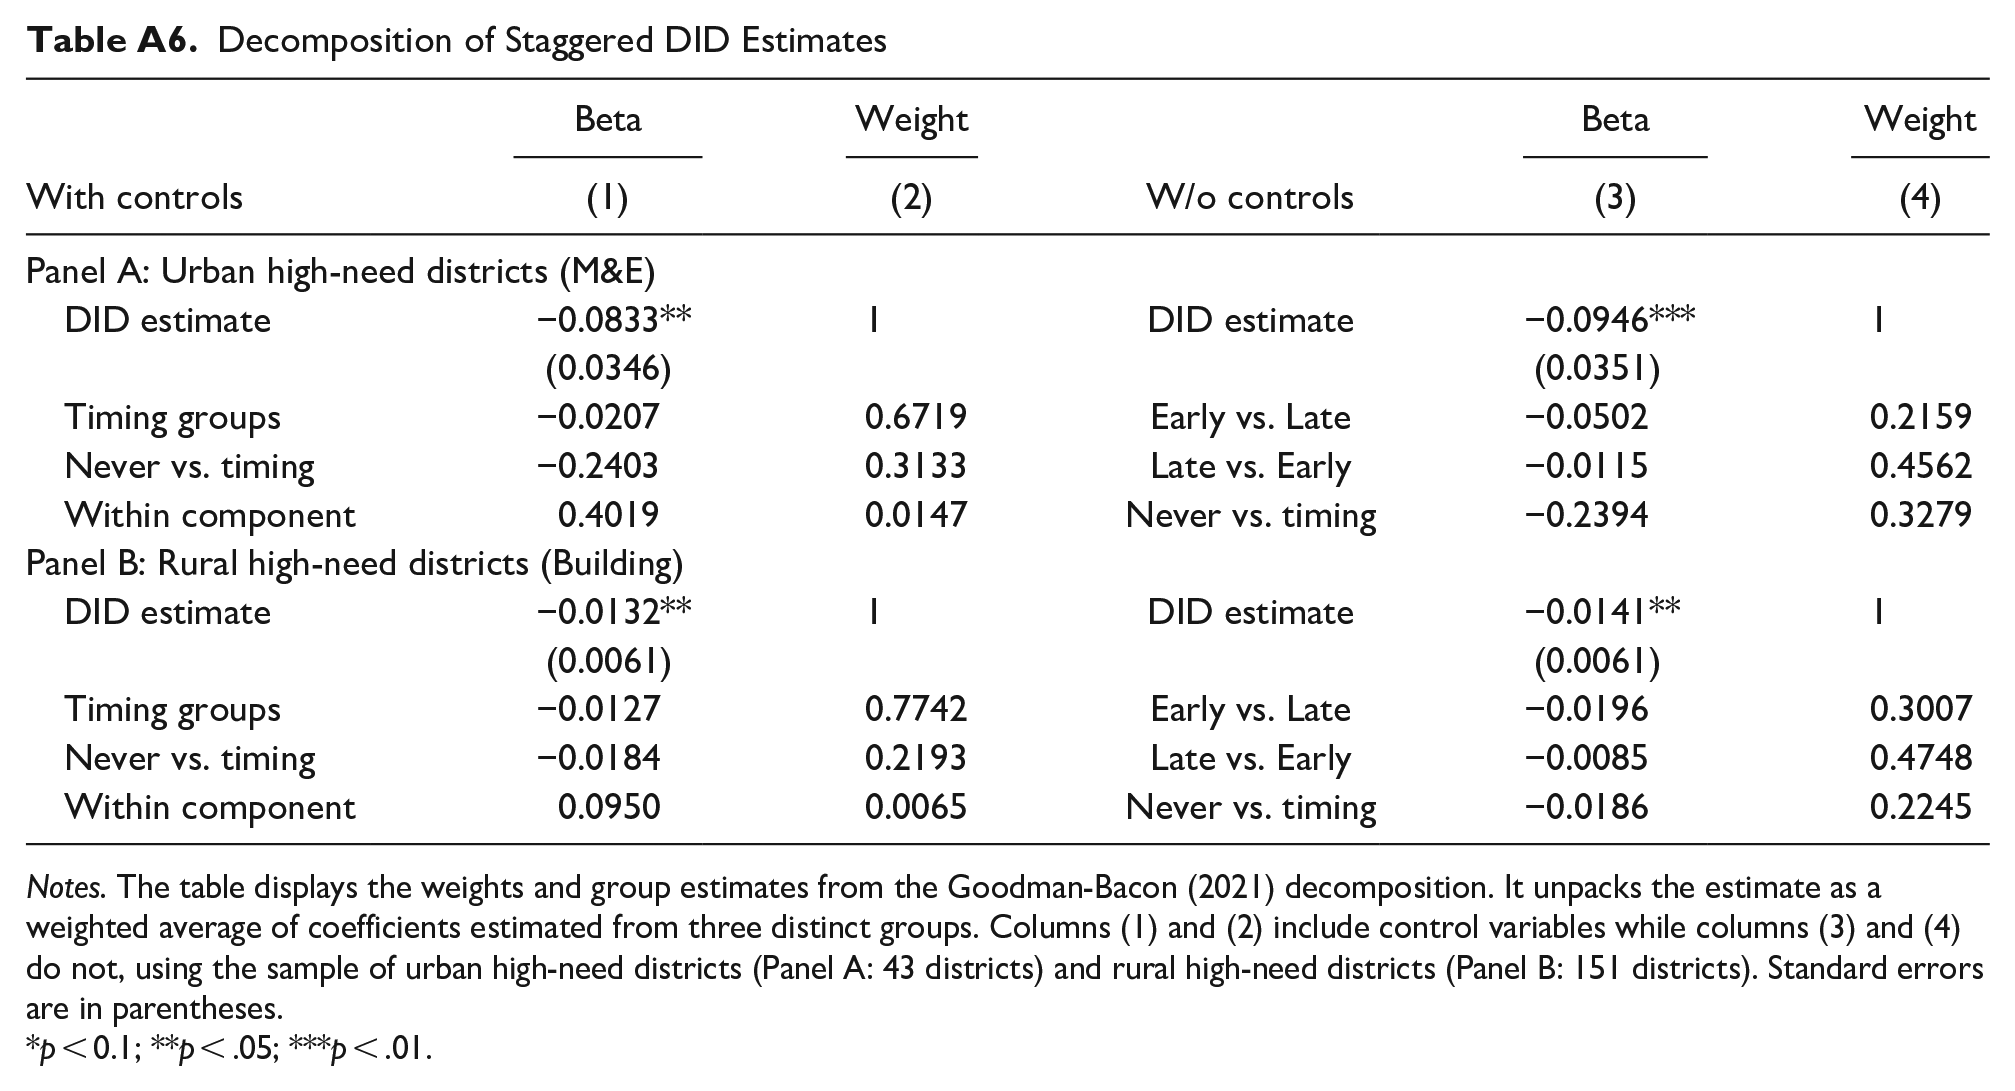
We perform the Goodman-Bacon’s (2021) decomposition to analyze the weights underlying our staggered DID estimates. Appendix Table A6 displays the results that estimate for the subgroups using districts with different treatment times (“Timing groups”) are more heavily weighted and are smaller in absolute value than the comparisons between districts treated during the sample period and those that did not (“Never versus timing”), indicating the potential for downward bias in the average estimates. Weights associated with the clean comparison of treated districts to never treated districts are around 31% for the high-need urban sample and 22% for the high-need rural sample. The estimates for the two outcomes are all negative in these highly weighted comparisons.
We also check the portion driven by comparisons, with later-treated districts as the treatment group and earlier-treated districts as the control group. Despite receiving a higher weight (0.4562 and 0.4748), the estimated effects are relatively smaller, indicating that these late-versus-early district comparisons do not substantially drive the results. Overall, these tests indicate consistently negative estimates when excluding this source of late-versus-early district comparisons and relying solely on treated and untreated unit comparisons. This supports the robustness of the results presented previously in this paper.
Conclusions
Several studies examine the effects of TELs on municipal capital fiscal outcomes or school district operating expenditures (Wang & Wu, 2018). Moreover, many other studies investigate the important role of school facility conditions or school capital investments on student performance (Lafortune & Schönholzer, 2022). However, no study has been conducted to focus on the effects of TELs on school districts’ infrastructure investments.
Starting in 2013, school districts in NY are subject to property tax limits on their levy for operating purposes. Two recent studies examine the effects of this limit. Nguyen-Hoang and Zhang (2022) find that the limit puts a constraint or cap on at-limit school districts that exhaust their limits. Sorensen et al. (2021) find that the limit-induced revenue decline reduces student test performance. This study contributes to the limited literature on the NY tax limit and aims to fill the previously mentioned literature gap. Specifically, this is the first study to examine the potential effects of property tax LTs on school IAE. We examine how the limit on school district’s property tax levy in NY may affect school IAE. Although this limit imposes a restriction only on operating, rather than capital, property tax levy, we hypothesize that the limit may have spillover effects on school IAE. We examine this hypothesis by employing a DID estimation approach together with an event-study design on a panel of school districts between 2011 and 2020. We find that at-limit school districts, especially urban high-need districts, reduce the expenditures on M&E. In addition, the limit has a negative effect on rural high-need infrastructure assets captured by the building value. We also find that at-limit school districts do not issue more debt and that urban high-need districts seek out more matching state infrastructure aid. All these results indicate that school districts that are most likely to be constrained by the limit treat operation and capital resources as complements rather than substitutes.
This study suggests that while the limit aims to constrain school operating expenditures, our findings reveal additional consequences not addressed in Nguyen-Hoang and Zhang (2022). In light of other research highlighting the positive effects of school capital investments on student performance, our study offers an additional plausible explanation for Sorensen et al.’s (2021) finding regarding the limit’s negative effect on student performance. Specifically, a fall in student performance may be due to both a reduction in school IAC and a drop in operating revenues.
Footnotes
Appendix
Decomposition of Staggered DID Estimates
| With controls | Beta | Weight | W/o controls | Beta | Weight |
|---|---|---|---|---|---|
| (1) | (2) | (3) | (4) | ||
| Panel A: Urban high-need districts (M&E) | |||||
| DID estimate | −0.0833** | 1 | DID estimate | −0.0946*** | 1 |
| (0.0346) | (0.0351) | ||||
| Timing groups | −0.0207 | 0.6719 | Early vs. Late | −0.0502 | 0.2159 |
| Never vs. timing | −0.2403 | 0.3133 | Late vs. Early | −0.0115 | 0.4562 |
| Within component | 0.4019 | 0.0147 | Never vs. timing | −0.2394 | 0.3279 |
| Panel B: Rural high-need districts (Building) | |||||
| DID estimate | −0.0132** | 1 | DID estimate | −0.0141** | 1 |
| (0.0061) | (0.0061) | ||||
| Timing groups | −0.0127 | 0.7742 | Early vs. Late | −0.0196 | 0.3007 |
| Never vs. timing | −0.0184 | 0.2193 | Late vs. Early | −0.0085 | 0.4748 |
| Within component | 0.0950 | 0.0065 | Never vs. timing | −0.0186 | 0.2245 |
Notes. The table displays the weights and group estimates from the Goodman-Bacon (2021) decomposition. It unpacks the estimate as a weighted average of coefficients estimated from three distinct groups. Columns (1) and (2) include control variables while columns (3) and (4) do not, using the sample of urban high-need districts (Panel A: 43 districts) and rural high-need districts (Panel B: 151 districts). Standard errors are in parentheses.
p < 0.1; **p < .05; ***p < .01.
Correction (November 2025):
The authors would like to alert readers to the following changes in their article: The following Disclosure Statement has been added:
Phuong Nguyen-Hoang is the Editor-in-Chief of Public Finance and Management. The author was not a member of he editorial team at the time of submission and did not take part in the peer review or decision-making process and as no further conflicts to declare.
Declaration of Conflicting Interests
The author(s) declared no potential conflicts of interest with respect to the research, authorship, and/or publication of this article.
Funding
The author(s) received no financial support for the research, authorship, and/or publication of this article.
Disclosure Statement
Phuong Nguyen-Hoang is the Editor-in-Chief of Public Finance and Management. The author was not a member of e editorial team at the time of submission and did not take part in the peer review or decision-making process andÚs no further conflicts to declare.