
Abstract
The United States faces a critical policy dilemma with respect to transportation funding: how to fund roads, highways, and public transportation into the future given the dwindling productivity of fuel taxes. This paper explores survey data that shed light on public opinion about one promising replacement for fuel taxes, so-called “mileage fees.” We analyzed 14 years of national survey data from U.S. adults to provide policymakers and researchers with evidence to answer three questions. First, what percent of Americans support the concept of mileage fees and has that support changed over time? Second, does support for mileage fees vary substantially by personal characteristics such as income or annual mileage driven? And third, are some mileage fee design choices more popular with the public than others?
Keywords
Introduction
The United States faces a critical policy dilemma with respect to transportation funding: how to fund roads, highways, and public transportation into the future given the dwindling productivity of fuel taxes. This paper explores survey data that shed light on public opinion about one promising replacement for fuel taxes, so-called “mileage fees.” We analyzed 14 years of national survey data to provide policymakers and researchers with evidence about not only overall public support for the mileage fee concept but also support among population subgroups and preferences for certain mileage fee design choices.
Mileage fees, which are also known as road-user charges, mileage-based user fees, or vehicle-miles traveled (VMT) fees, are increasingly discussed as a potential replacement for fuel taxes. Like fuel taxes, mileage fees can raise large revenue streams by charging drivers in proportion to how far the vehicle is driven. Because American vehicles cover roughly three trillion miles a year (Federal Highway Administration, 2023), even a small charge per mile would raise substantial revenue.
The interest in mileage fees has grown swiftly over the past decade as the fuel tax has come to be seen as an increasingly unreliable source, especially in the future. Motor fuel excise taxes suffer from three specific problems: a structural problem, a political problem, and a technological problem.
The first, a problem of tax structure, has bedeviled state and federal fuel taxes ever since they were first introduced in Oregon in 1919. These excise taxes have almost always been levied as a fixed number of cents per gallon and so do not maintain their spending power in the face of inflation. The typical fix for this tax structure weakness, regular legislative votes to increase the rate, creates the second problem: elected officials have regularly failed to pass legislation to raise fuel tax rates enough to keep revenues growing at the pace of inflation.
The second problem, the failure to regularly adjust fuel tax rates to keep pace with inflation, has been particularly dire at the federal level; Congress has not raised the cents-per-gallon gasoline excise tax rates for gasoline and diesel since 1993. Although more than half of states have adjusted their rates since 2013, that leaves many states that have not (National Conference of State Legislatures, 2024). Further, even among states who recently updated their rates, this change usually came only after a long period of stagnation. In 2021, the Institute on Taxation and Economic Policy found that 10 states had not raised their tax rates for over 2 decades (Davis, 2021). One positive change among some states, however, is that newly adopted legislation builds in a process for automatic periodic rate increases to keep pace with inflation rates, thus removing the need for regular legislative votes to adjust the rates.
Finally, the third problem that fuel taxes face is technological: motor vehicles are increasingly burning less fuel per mile—or using none at all. Increasing vehicle fuel efficiency for gasoline and diesel vehicles has translated into drivers paying less fuel tax per mile driven. Further, the nation is poised to see a rapid growth in electric vehicles (EVs) that require no gasoline or diesel at all. Although many states have aimed to replace lost fuel tax with new registration fees on EVs (and, in some cases, plug-in hybrid vehicles), these fixed fees are not tied to how much the vehicles are driven (National Conference of State Legislatures, 2023).
For decades, mileage fees had been the focus of periodic scholarly research but of little interest to policymakers. One key reason policymakers have dismissed mileage fees as a practical replacement for fuel taxes is the assumption that the public would not accept the mileage fee concept. However, in the face of falling fuel tax revenue, some legislators are increasingly interested in exploring if perhaps the American public would, after all, be willing to accept mileage fees as a major new source of revenue for roads, highways, and public transportation.
This paper contributes to the growing literature on public opinion about mileage fees by drawing on 14 years of data from an annual trend survey conducted by the Mineta Transportation Institute that asks respondents a variety of questions about transportation taxes and fees (Agrawal & Nixon, 2023). Core questions asked over multiple years include support for mileage fees and for raising the federal gas tax rate. We conducted bivariate analyses of all 14 years of survey data to provide policymakers and researchers with an opportunity to explore findings related to three key questions about mileage fees:
What percent of Americans support the concept of mileage fees and has that support changed over time?
Does support for mileage fees vary substantially by personal characteristics such as income or annual mileage driven?
Are some mileage fee program design choices more popular with the public than others?
The remaining sections of the paper present an overview of the literature on public support for mileage fees, describe the study methods and findings, and conclude with a discussion of findings, policy implications, and recommendations for future research. Technical appendices present additional details about the survey respondents and results. Appendix A summarizes respondents’ characteristics for key variables used for analysis for each survey year, while Appendix B presents cross-tabulations analyzing how different subgroups of the population responded to key survey questions each year.
Literature Review
This paper builds upon a growing literature about public opinion on mileage fees and gasoline taxes that has been conducted largely to aid policymaking. Public approval for a policy typically increases (though does not guarantee) the likelihood that elected officials will support the initiative (Page & Shapiro, 1983; Saris & Sniderman, 2004). This is especially true if the proposed policy is of personal interest to community members. Since the great majority of Americans travel in personal vehicles as either drivers or passengers, changes to taxes on driving are of direct interest to most people.
Studies on public support for transportation tax policies have typically looked at support among the full population in a single point in time. The great majority of these studies have found support among the public at large to be well below 50%, though findings vary widely from study to study, and public support has ticked up over the past decade (Agrawal & Nixon, 2018). Agrawal and Nixon reviewed 38 U.S. surveys with questions about mileage fees and found support ranging from 10% all the way to 65%. One likely explanation for the wide variation is the very different ways that mileage fees were described in the surveys.
A smaller set of studies have considered the second question at the core of this study: what personal characteristics and mileage-fee program design choices predict support for a mileage fee (Findley et al, 2022; Nelson & Rowangould, 2023; Zhang et al. 2012)? Studies analyzing support by personal characteristics most often rely on simple crosstab analysis without any statistical significance testing. A few studies do, however, use multivariate analysis to explore support by personal characteristics. Collectively, these studies find relatively few consistent patterns of what personal characteristics correlate with higher support for mileage fees (Agrawal et al., 2010; Duncan et al., 2017; Dill & Weinstein, 2007). A unique feature of the current study is that we explore whether support by different segments of the population has changed over time, in contrast to looking just at changes in support across the full population.
Finally, a few studies have directly explored how the specific design of a mileage fee may shape public opinion, and these found that program design does indeed matter, including the rate structure, technology for documenting miles driven, and how the revenue will be spent (Agrawal, Nixon, & Hooper 2016; Duncan, Li, & Graham, 2020; Duncan et al., 2017; Ubbels & Verhoef 2006). For example, Duncan, Li, and Graham (2020) found higher support for mileage fees if the rate is adjusted by pollution or fuel economy, as compared to a flat-rate fee. An earlier study by Duncan et al. (2017) found higher support among U.S. adults for a mileage fee if mileage data were collected through odometer readings rather than a GPS-based technology. Looking at the Netherlands, Ubbels and Verhoef (2006) found higher support for a new mileage fee if it was paired with reduced rates for taxes on vehicle ownership, as compared to a new mileage fee with the revenue dedicated to expanding the road network.
Methods
The dataset analyzed in this paper combines the results from 14 national public opinion surveys administered annually from 2010 to 2023. This section of the paper describes the survey questionnaire, survey administration process, sampling approach to recruit respondents who were representative of the U.S. adult population, and approach to the analysis.
The Survey Questions Analyzed
For all 14 years the survey asked respondents core questions about their opinions and knowledge related to tax and fee options for raising federal transportation revenue. Additional questions probed opinions about the quality of the transportation system and gathered details on the respondents’ personal characteristics (socio-demographic characteristics, travel choices, and residential location). To allow for longitudinal analysis, the researchers made as few changes as possible to the core survey questions from year to year.
This paper explores a subset of the survey questions. Table 1 shows the exact language of each question asking respondents their opinions related to federal transportation revenue options. (The survey questions asked to gather information on the personal characteristics used for analysis are discussed below and presented in Table 3.)
Survey Questions Analyzed
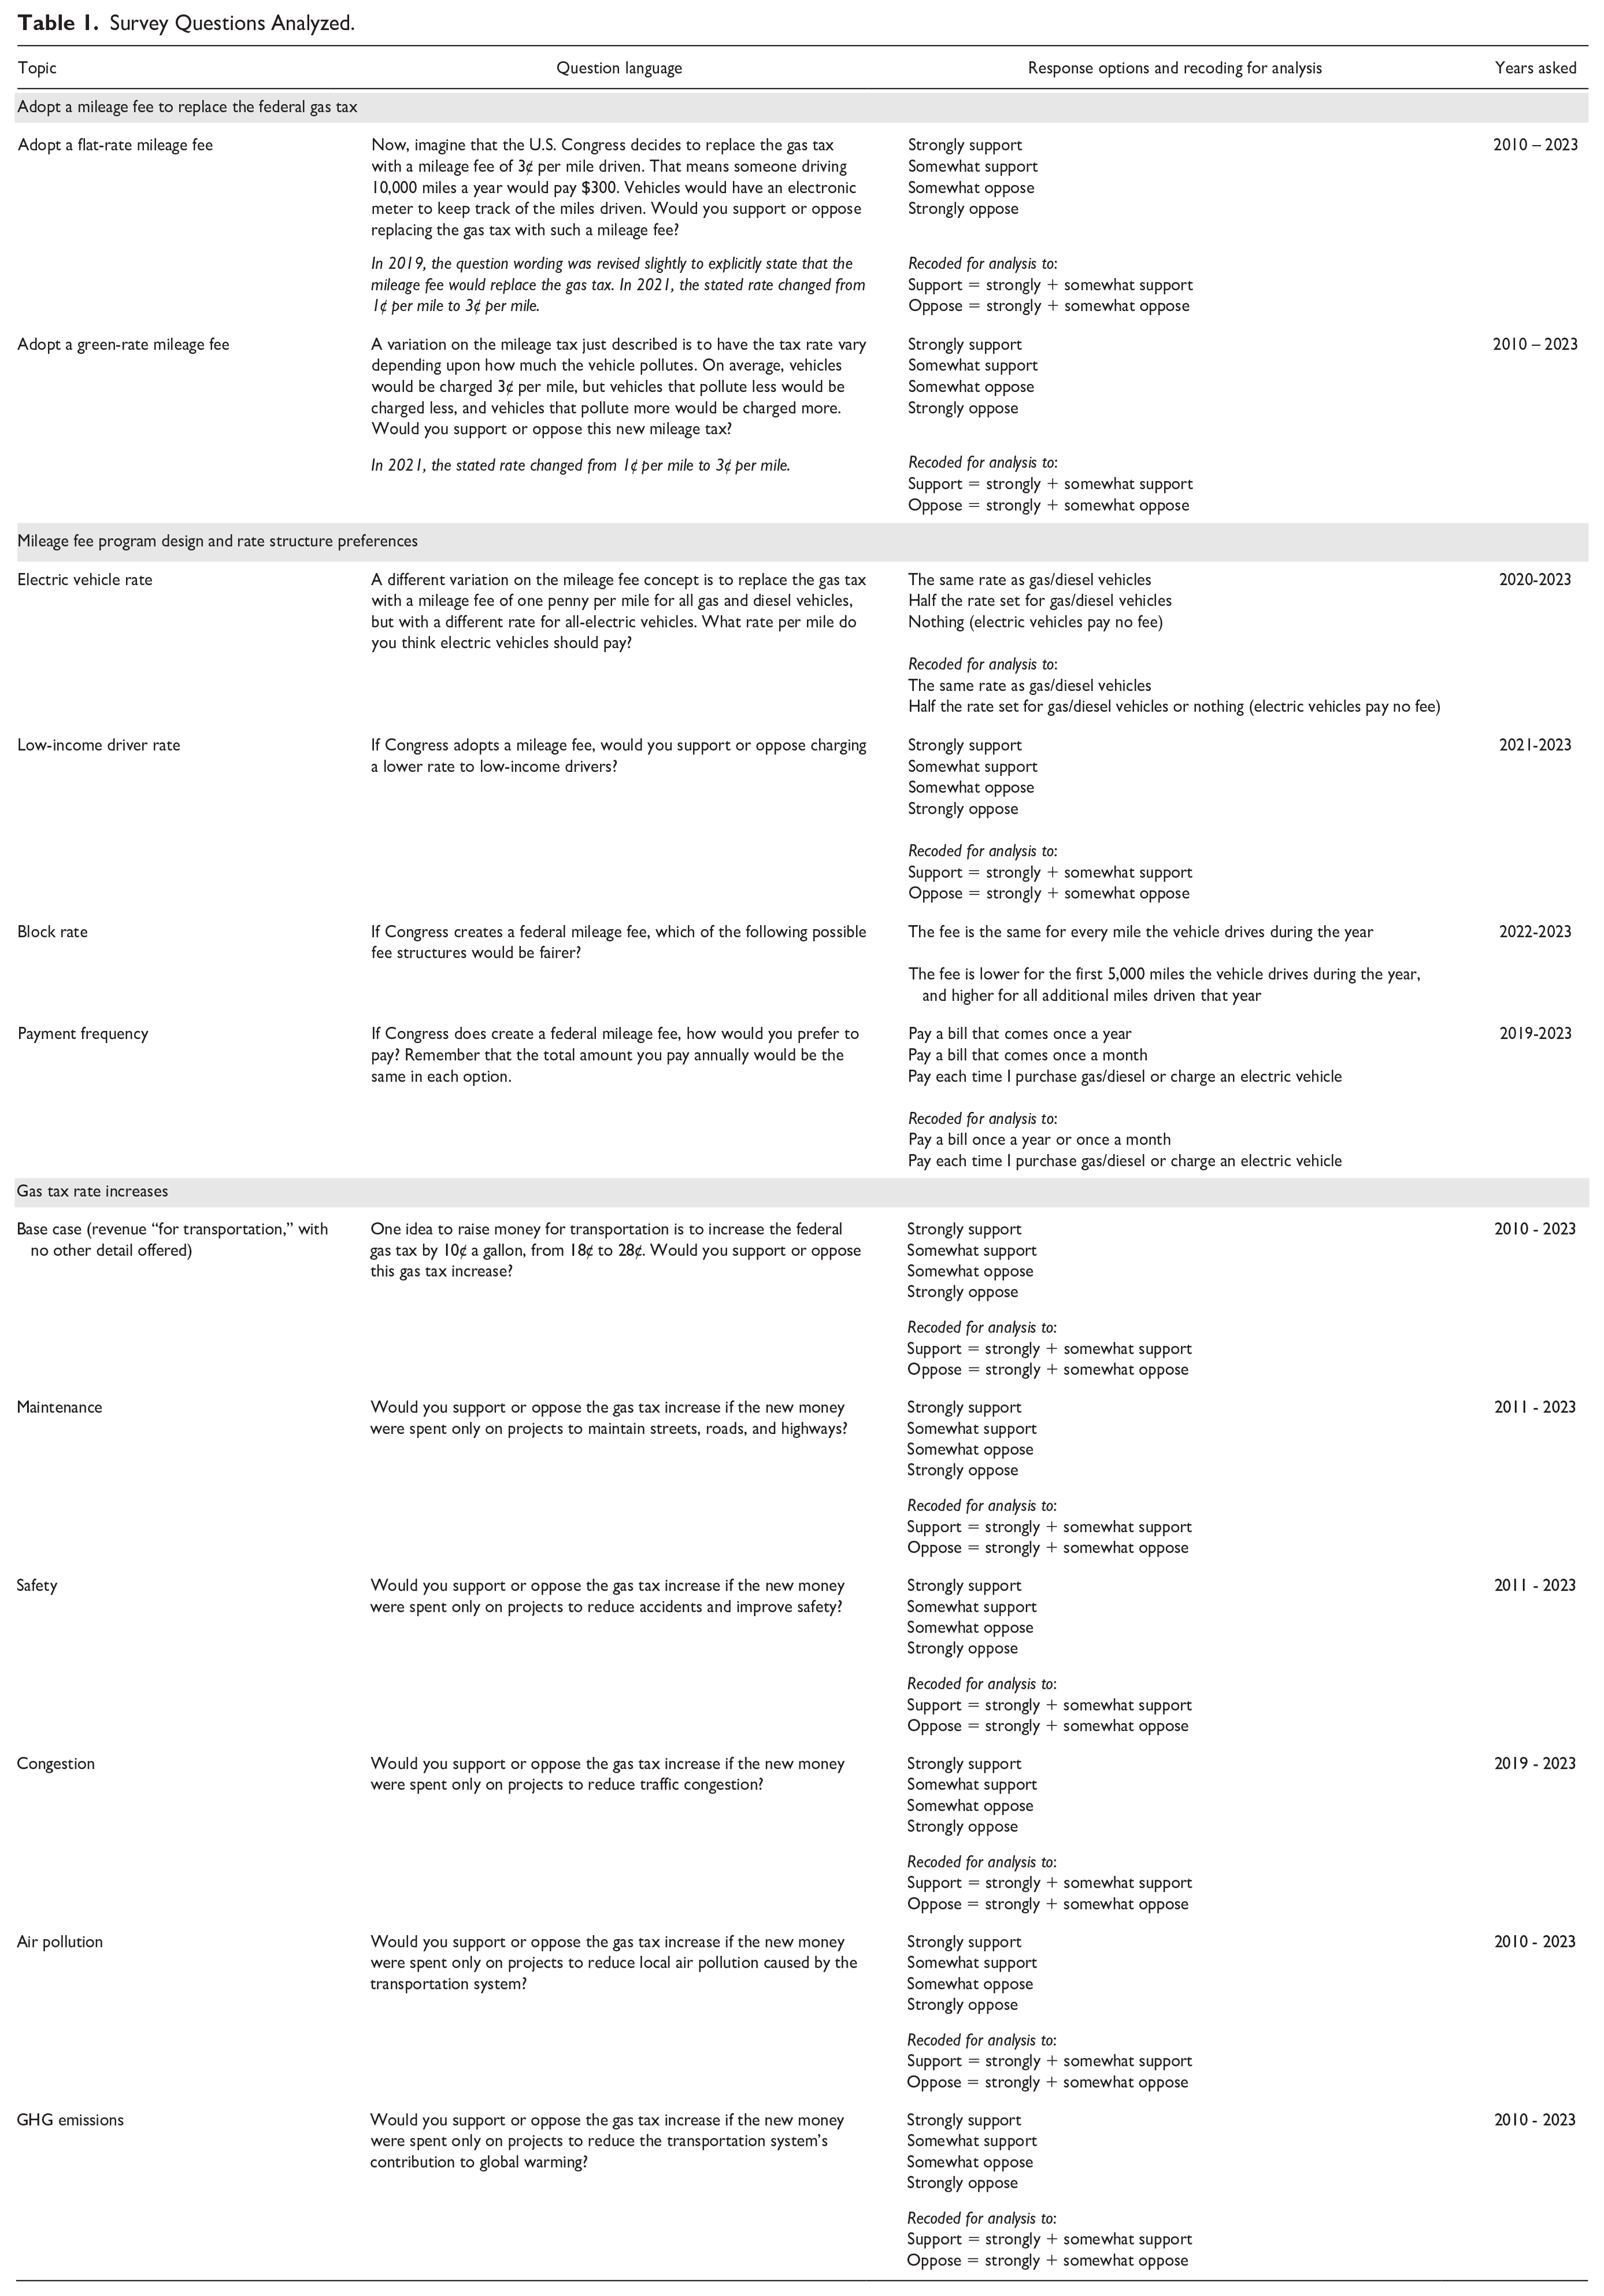
Since 2010, the survey has asked respondents about their support for a flat-rate mileage fee as well as a green mileage fee where the rate would vary based on how much the vehicle pollutes. More recently, questions have been added to the survey that focus on mileage fee program design and rate structure. These questions include opinions about whether EVs should pay the same or less than internal combustion engine (ICE) vehicles, whether low-income drivers should be assessed a discounted rate, preference for a flat-rate versus block rate fee structure, and respondents’ preferences for how often they would pay the mileage fee.
The surveys also ask a set of six questions asking respondents if they would support raising the federal gas tax rate. In each case the rate would be raised by 10 cents per gallon, but the purpose of the revenue raised is different for each question. For the first question, respondents are told that the revenue would be spent “for transportation,” with no other details. The next five alternatives each present a different, dedicated purpose for the tax revenues: maintenance of the transportation system, improving safety, reducing congestion, reducing local air pollution, and reducing transportation’s impact on climate change. As discussed below, the findings from these questions reveal how mileage fee program designers could increase public support for the fees by dedicating the revenue raised to specific types of transportation expenditures.
Survey Administration
The surveys were administered as random-digit-dial (RDD) phone surveys until 2018, and then from 2019 onwards the surveys were administered online. The sample size ranged from 1,201 to 2,796 respondents annually. Table 2 presents an overview of the survey administration details for each year.
Survey Administration Details
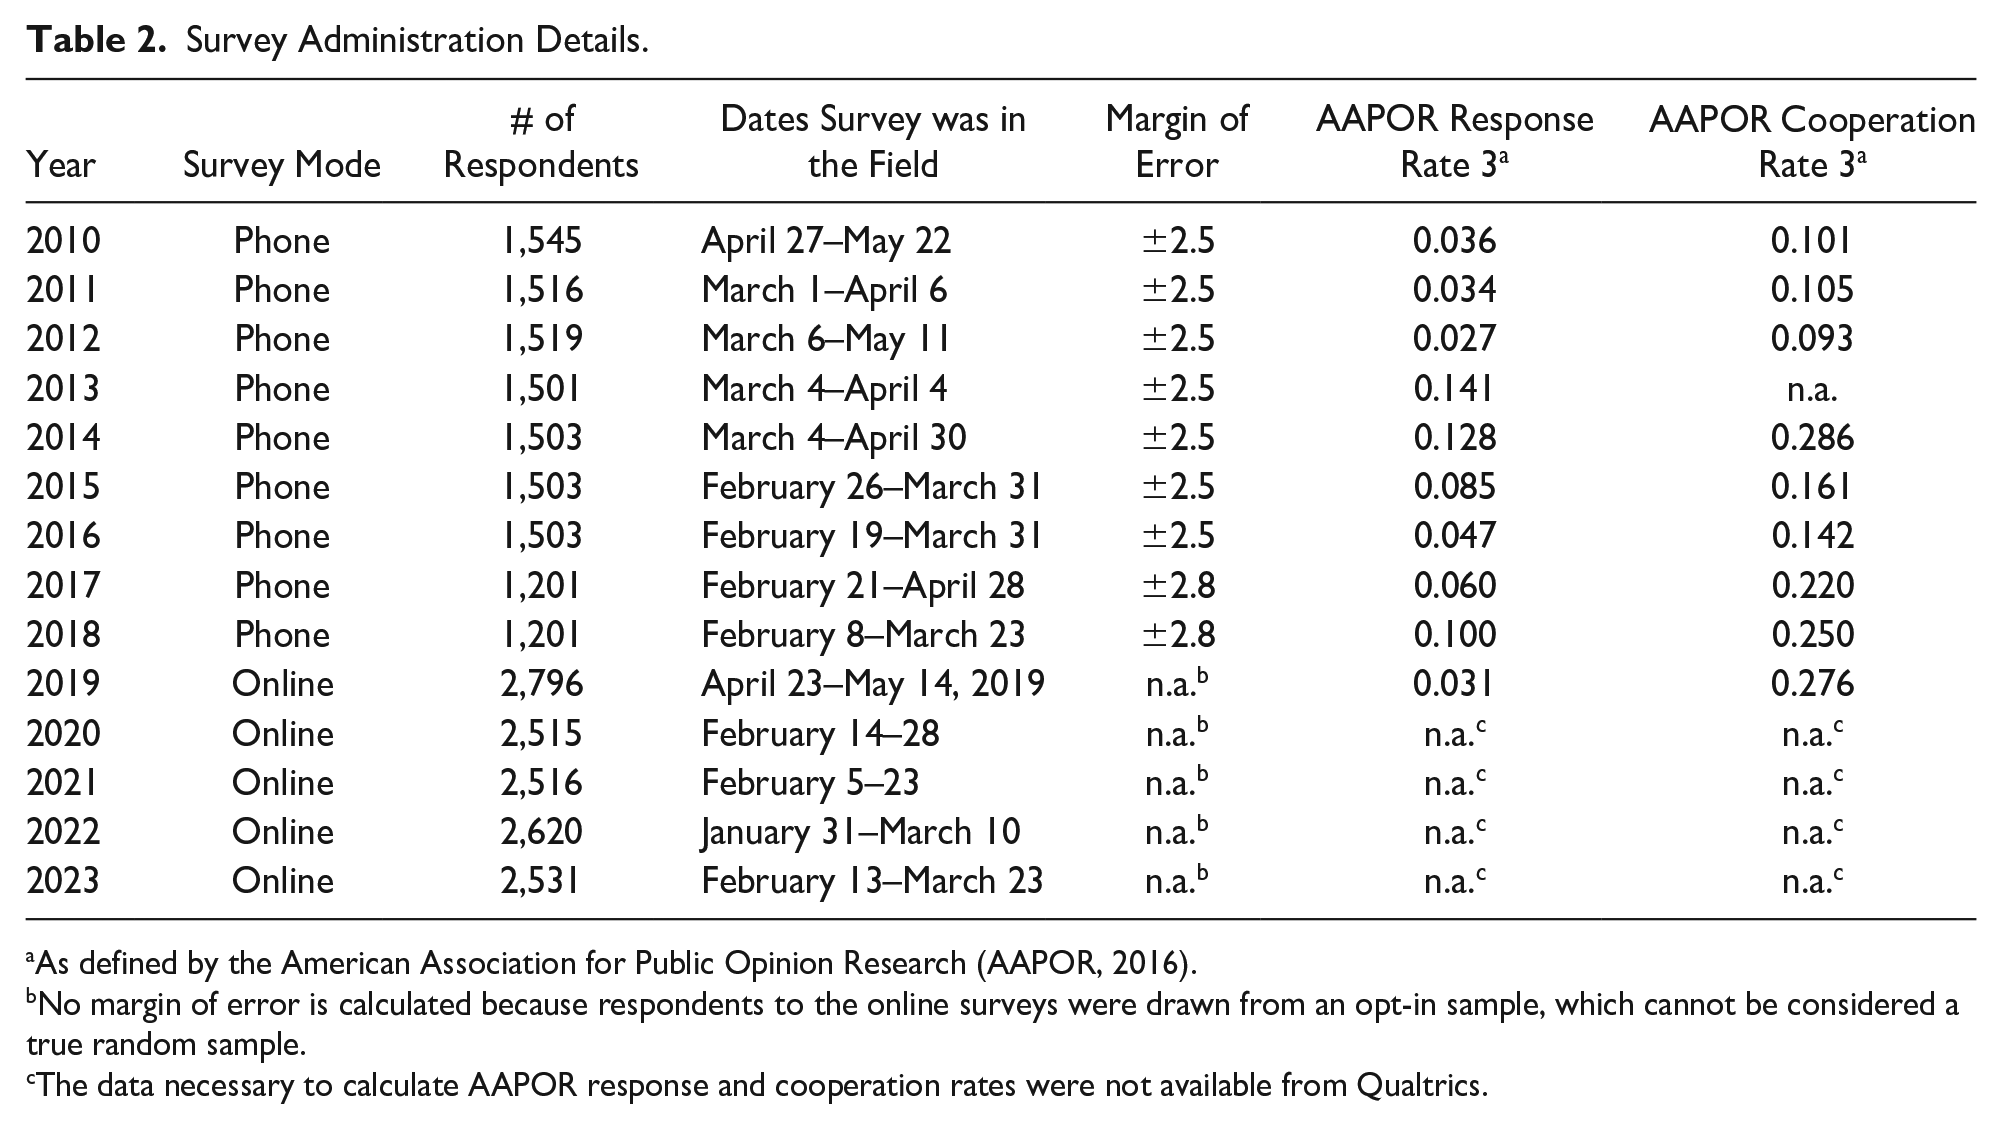
As defined by the American Association for Public Opinion Research (AAPOR, 2016).
No margin of error is calculated because respondents to the online surveys were drawn from an opt-in sample, which cannot be considered a true random sample.
The data necessary to calculate AAPOR response and cooperation rates were not available from Qualtrics.
The surveys through 2018 were administered as RDD phone surveys by several different survey firms. Then in 2019, when the cost of phone surveys became unsustainable, we shifted to online administration to take advantage of the many benefits of online surveys. In addition to their much lower cost, online surveys are more convenient for respondents and can include question design options that are difficult or impossible to implement via telephone or mail surveys (Sue & Ritter, 2012). A 2021 analysis from the Pew Research Center found that 93% of Americans are online (Perrin & Atske, 2021), evidence that online surveys are currently a reasonable method to reach a representative sample of U.S. adults, even though some population subgroups are often underrepresented in online surveys. Groups that are less well-represented online include people who are older, have low income, have less formal education, live in rural communities, and do not have high-speed internet access at home (Pew Research Center, no date). As discussed below, we addressed this potential limitation with a quota sampling strategy.
Survey mode can influence the way respondents answer questions, so readers are cautioned that when trends are discussed in this report’s findings, the change in survey mode could account for some of the difference between responses before and after 2019. A study by the authors of this report, for example, found higher support levels for some of the same tax options described here when responses were collected from an online panel of respondents than when responses were collected with a RDD phone survey (Nixon & Agrawal, 2018). However, research suggests that questions about abstract policy matters like those in this survey are less affected by survey mode than questions about potentially embarrassing personal topics where respondents may feel pressured to give socially acceptable answers. Researchers have also found that rating questions typically receive lower scores from online respondents than from phone survey respondents (Kennedy & Deane, 2019).
Sampling Approach
Sampling for all 14 surveys was designed to reach a representative sample of adults living in the United States. Both the phone and online surveys established minimum quotas for key population characteristics, including age, gender, income, race, and ethnicity. We oversampled selected small subgroups of the population, including Black and Asian residents, to ensure that there would be enough respondents from those groups to allow for detailed analysis and statistical testing.
The data for each survey year were lightly weighted to match American Community Survey population estimates based on gender, ethnicity, race, education, income, and age. With minor exceptions, the differences between the sample and the U.S. population are small. Readers wishing to see a comparison of the respondent demographics to the full U.S. population for each survey year will find this in the project reports for each survey (Agrawal, Nixon, & Azevedo, 2023, and earlier surveys cited therein). Appendix A of this paper provides a detailed overview of respondents’ characteristics for each year of the survey.
Data Processing
The dataset for each online survey was scrubbed to remove respondents who exhibited suspicious behaviors such as finishing the survey in less than half the median survey completion time, straight-lining through a survey, or providing gibberish answers to open-ended questions. This step is important because a recent study by the Pew Research Center found that opt-in online panels can have a larger difference between the measured value and the true compared to probability-based panels (Pew Research Center, 2023). However, much of the differences can be eliminated with careful screening of the survey responses to eliminate the fake respondents who contribute to much of the error reported for opt-in samples.
To facilitate analysis and ensure consistency across all survey years, a consolidated dataset that combined all 14 years of data was developed. As part of creating the consolidated dataset, variables of interest for this paper were re-coded as shown in Tables 1 and 3, and the dataset was cleaned to remove any extreme outliers. In addition, treatment of missing observations for analysis was standardized across the years. As a result of this last step, there may be very slight differences when comparing the analysis in this paper to findings from the annual survey reports published previously.
Personal Characteristics Used for Analysis
Analytic Approach
This paper focuses on exploratory data analysis using both non-graphical and graphical techniques. We examined relationships between variables and created data visualizations to identify patterns and gain insight into the data across two primary dimensions: (1) longitudinal trends in support for the flat-rate and green mileage fee options and six gas tax alternatives, including how support varies across subgroups of the population, and (2) public opinion regarding mileage fee program design and rate structure alternatives for 2023, the most recent year of survey data. We chose this analytical approach in order to provide policymakers and researchers with an understanding of how support for taxes may change with time and also how different personal characteristics correlate with opinions. This approach also provides insight into possible relationships to explore in more depth through future multivariate and repeated cross-sectional analyses.
Longitudinal Trends in Support
We first examined overall support for mileage fees and gas tax rate increases across the 14 years of survey data. Using a simple data visualization, we compared trends in support for a flat-rate and green mileage fee as well as for support for the six gas tax rate increase options.
Support by Personal Characteristics
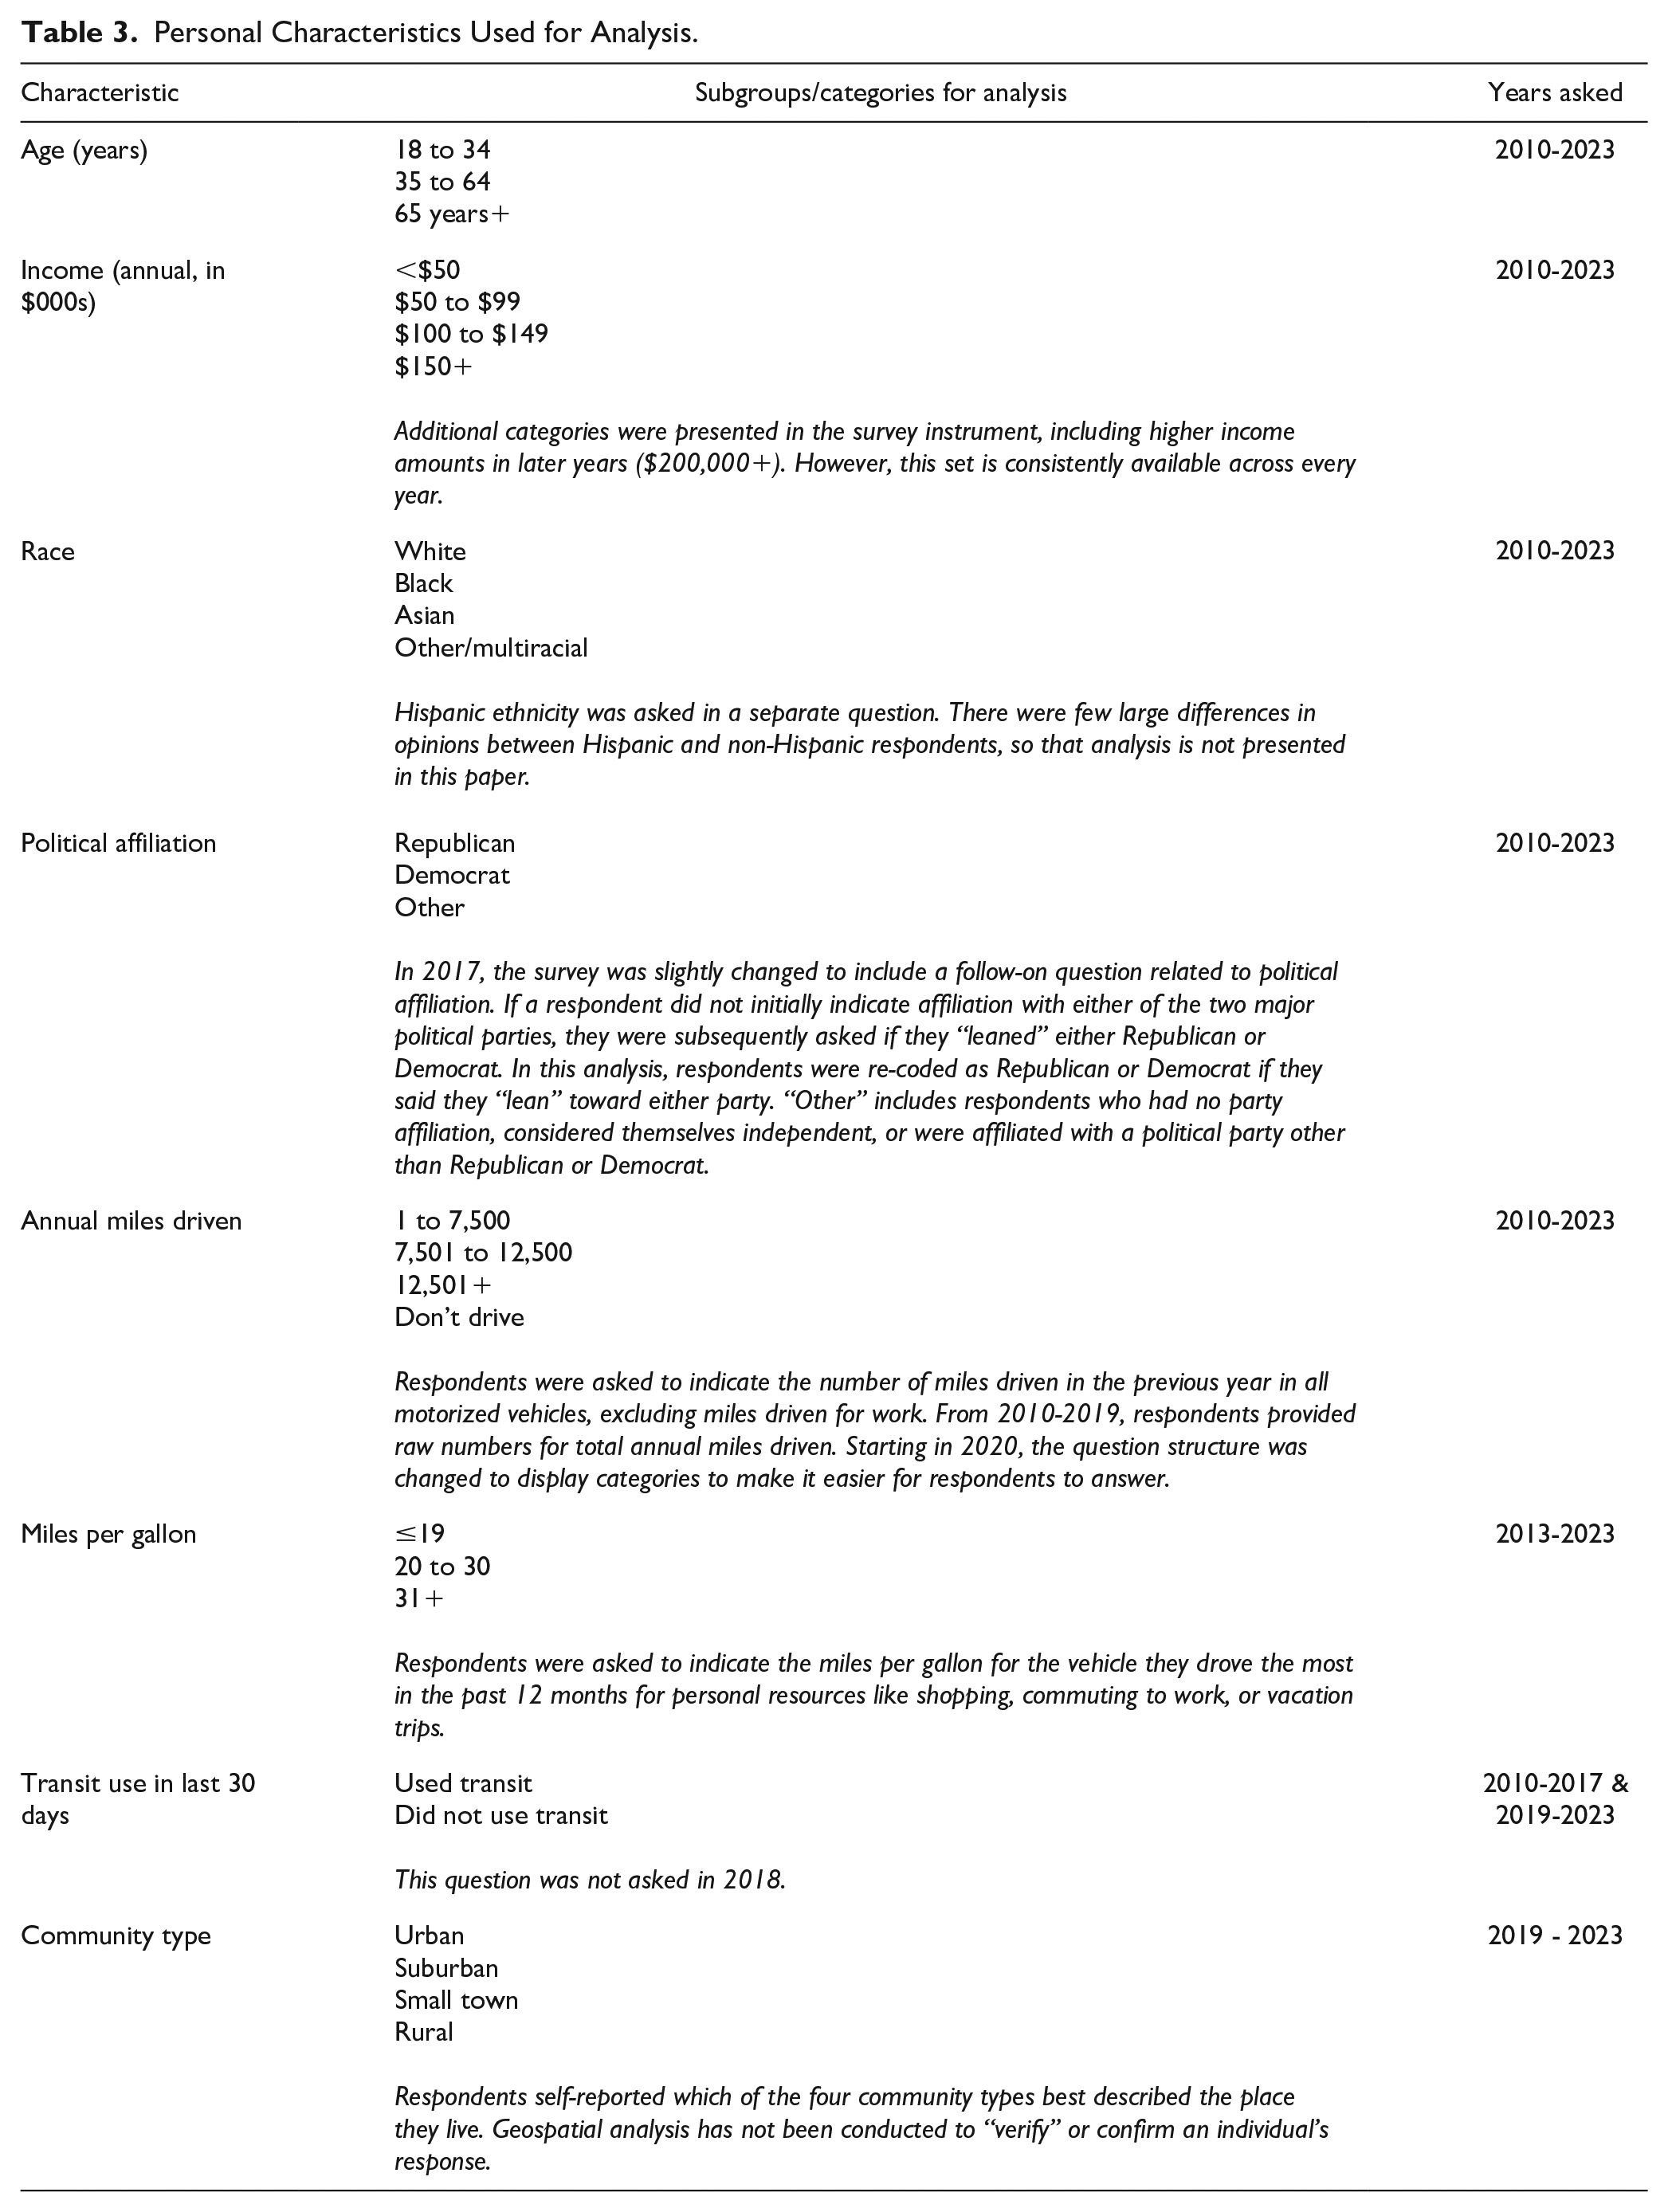
For the analysis by personal characteristics, we first reviewed the results from all 14 annual survey reports and selected a set of eight key variables to explore in more depth for this analysis: three demographic characteristics (age, income, and race), political affiliation, three travel behavior characteristics (annual VMT, fuel efficiency of the respondent’s primary vehicle, and transit use), and residential community type (see Table 3). These characteristics were chosen either because prior analysis of the annual survey series found the characteristic to be associated with particularly large variations in opinions among subgroups (age, political party, and community type) or because there is wide-spread policy interest in whether opinions vary by that characteristic (income, race, and travel behavior). In addition, data for some of these variables are readily available from the American Community Survey in communities across the United States, so policy makers could use the results from our analysis to get a sense regarding how their community might respond to similar tax options.
We eliminated from the analysis those personal characteristics for which prior analysis in the survey series found few statistically significant patterns in support for the tax options. Although in some years the survey included questions about attitudes related to transportation funding questions, we did not include those variables in this paper because the questions had been asked for only a small subset of the survey years. Thus, there was not enough data for the trend analysis that is the focus of this paper. 1
We used the statistical test of two proportions to determine whether differences in opinion between subgroups of the respondents are statistically significant (see detailed tables in Appendix B). For example: were older adults more or less likely to support a mileage fee option compared to younger adults? Although we do not discuss the results of the statistical testing, readers interested in more closely evaluating differences in opinion across subgroups can consult these tables in Appendix B.
Program Design Preferences
The last dimension we focused on for this paper was an in-depth look at public opinion on mileage fee program design and rate structure alternatives from the 2023 survey data. This set of questions has only been included in recent survey years, so a full longitudinal analysis is not possible. Appendix B includes the detailed results from the statistical test of two proportions for subgroups of the population for these questions.
Findings: Support for Adopting a Mileage Fee
Every survey in the series asked respondents about their support for adopting flat-rate and green-rate mileage fee options to replace the federal gas tax. Through 2018, the surveys specified that the flat-rate mileage fee would assess a charge of 1¢ per mile of travel and the green mileage fee would assess a fee that averages 1¢ per mile but varies depending on “how much the vehicle pollutes.” In 2019, we modified the questions in two ways: the rate was changed from 1¢ to 3¢ per mile, and language was added to specify that the mileage fee would replace the gas tax.
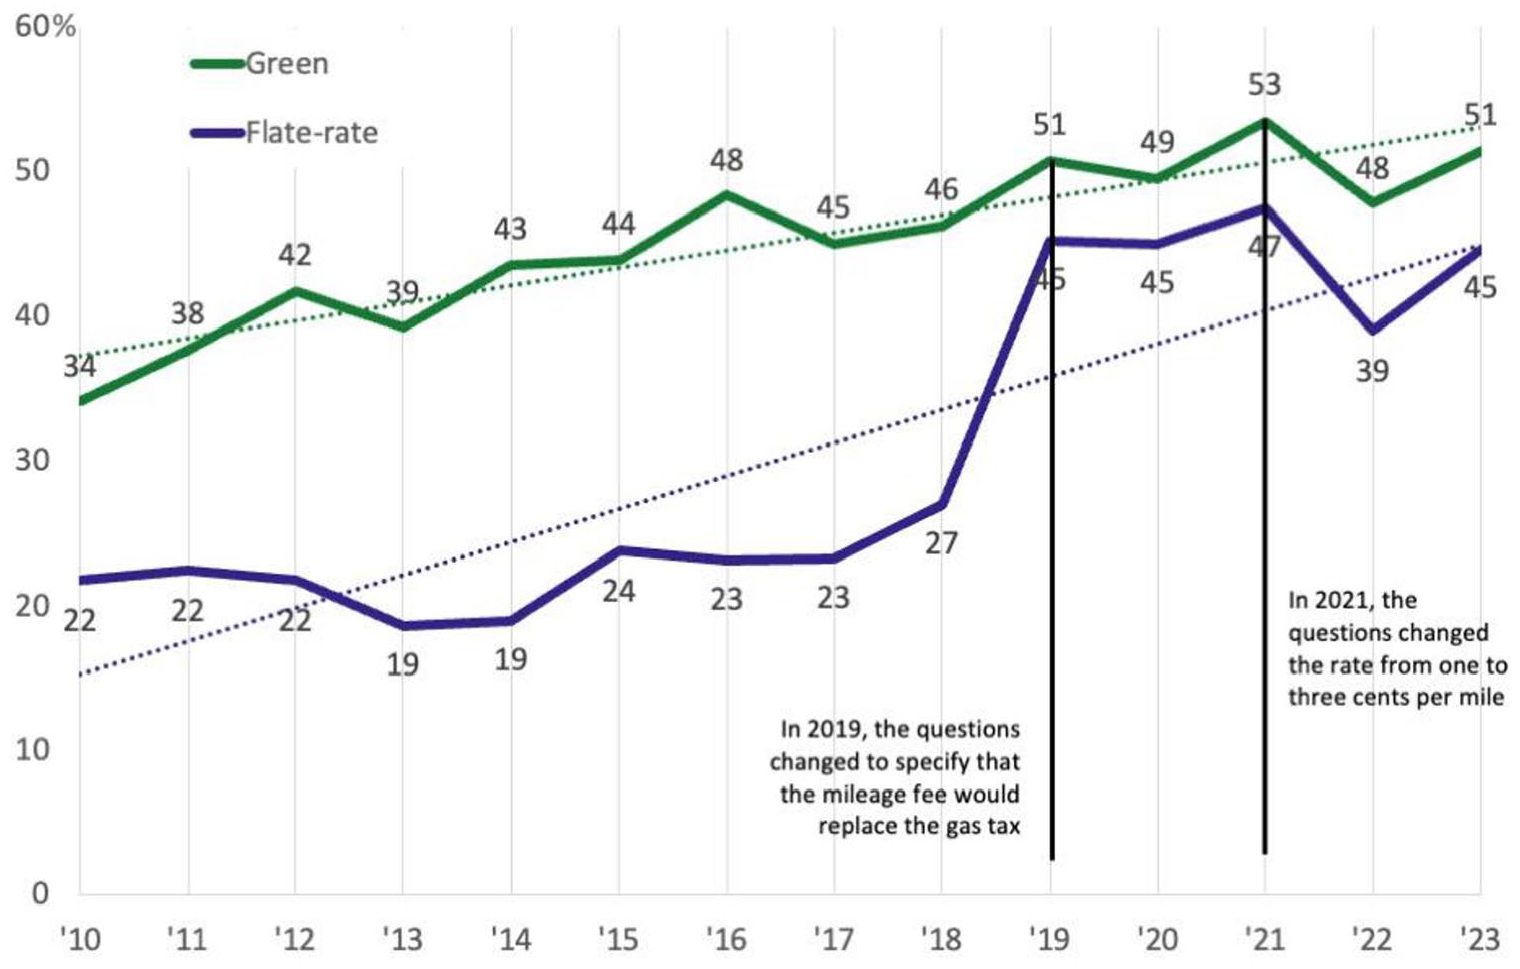
In the 2023 survey, the green mileage fee variant was modestly more popular than the flat-rate option. Fifty-one percent of respondents supported replacing the gas tax with a mileage fee where the average rate would be 3 cent per mile, but vehicles that pollute less would be charged less and vehicles that pollute more would be charged more. Support for the flat-rate mileage fee was 6 percentage points lower (45%).
Trends in Support Over Time
Support for both mileage fees has risen over time (Figure 1). Support for the flat-rate mileage fee doubled between 2010 and 2023, rising from 22% in 2010 to 45% in 2023. Support remained quite low through 2017 (from 19% to 23% support), rose slightly in 2018, and jumped sharply in 2019. That year, support rose from 27% to 45%. This jump may be explained by a survey language change: starting in 2019, the survey explicitly stated that the mileage fee would replace the gas tax. In 2021, the stated rate increased from 1 to 3 cents, but this change did not obviously reduce support. As of 2019, support has remained around 45%, though it declined to 39% for 1 year.
Percent Support for the Flat-Rate and Green Mileage Fees (2010–2023)
Support for the green mileage fee started at 34% in 2010 and peaked at 53% in 2021. Although support dipped slightly up and down over the period, there was an average annual increase of 1.2 percentage points, as illustrated by the trendline. Unlike for the flat-rate mileage fee, there was no notable change in support in 2019, the year that the survey question changed to specify that the mileage fee would replace the gas tax and the survey method switched from phone to online. Like the flat-rate fee, when the survey question changed to the higher rate in 2021, there was no discernable impact on support among the full sample.
Trends in Support by Personal Characteristics
Figures 2 and 3 present support for the two mileage fees among each subgroup of the eight personal characteristics analyzed: age, income, race, political affiliation, transit use, annual mileage driven, fuel efficiency of primary vehicle driven, and community type. For each figure, we looked for patterns over time for any population subgroup. Specifically, we looked to see if support diverged or converged over time and whether there are particularly large differences in support across subgroups. This approach revealed the following patterns in support:
Age: The young respondents were always more supportive of the green mileage fee, and for most years the spread in support was fairly large. The same pattern holds for the flat-rate mileage fee only since 2020. Prior to 2020, there were only small differences by age in support for the flat-rate fee. Another notable pattern is that the overall increase in support from 2010 to 2023 more than doubles for the young and middle-age respondents, while the increase for older adults is less than 50%.
Household income: Income is the characteristic associated with by far the least variation in support for both taxes. No income group was always the most or least supportive. Also, the spread in support among the different income groups was small for many years and never more than 16 percentage points for either tax. The spread was slightly larger, on average, for the green tax than for the flat-rate tax.
Race: There have been wide variations in support for both taxes by race, with the spread ranging from 8 to 37 percentage points and at least 15 or more percentage points for half the years. White respondents were almost always less supportive than Asian and black respondents, for both tax options, though sometimes the spread was modest. There was more divergence in opinions by race for the green than flat-rate mileage fee.
Political affiliation: Democrats were always more supportive of both mileage fee options than Republicans or people with “other” affiliation. The differences were larger for the green than flat-rate mileage fee, with the spread for the former ranging from 10 to 28 points and usually at least 15 points. By contrast, for the flat-rate mileage fee, the spread in support among respondents of different political affiliation ranged from 4 to 25 but was below 15 points more than half the time.
Fuel efficiency: For the flat-rate mileage fee, there was no clear trend in support linked to fuel efficiency until 2020. Since then, drivers of the most fuel-efficient vehicles have been somewhat more supportive of the flat-rate fee. For the green mileage fee, drivers of the most fuel-efficient vehicles have been more supportive for all but 1 year.
Annual miles driven: For both mileage fee options, there was little difference in support according to whether people were low, middle, or high-mileage drivers. However, in the early years of the survey, people who reported that they didn’t drive at all were typically the most supportive of the mileage fees, often by a considerable amount. By 2019, respondents who didn’t drive were no longer notably more supportive than drivers for either tax option.
Transit use: For both mileage fee options, transit riders were more supportive for all but 1 year. Further, for the green-rate tax the difference was usually at least 15 percentage points, and for the flat-rate tax the spread was at least 15 points almost as often.
Community type: Urbanites were the most supportive for both mileage fee options. Support among the other three groups clustered together, though the rural respondents were usually less supportive than suburban and small-town respondents.
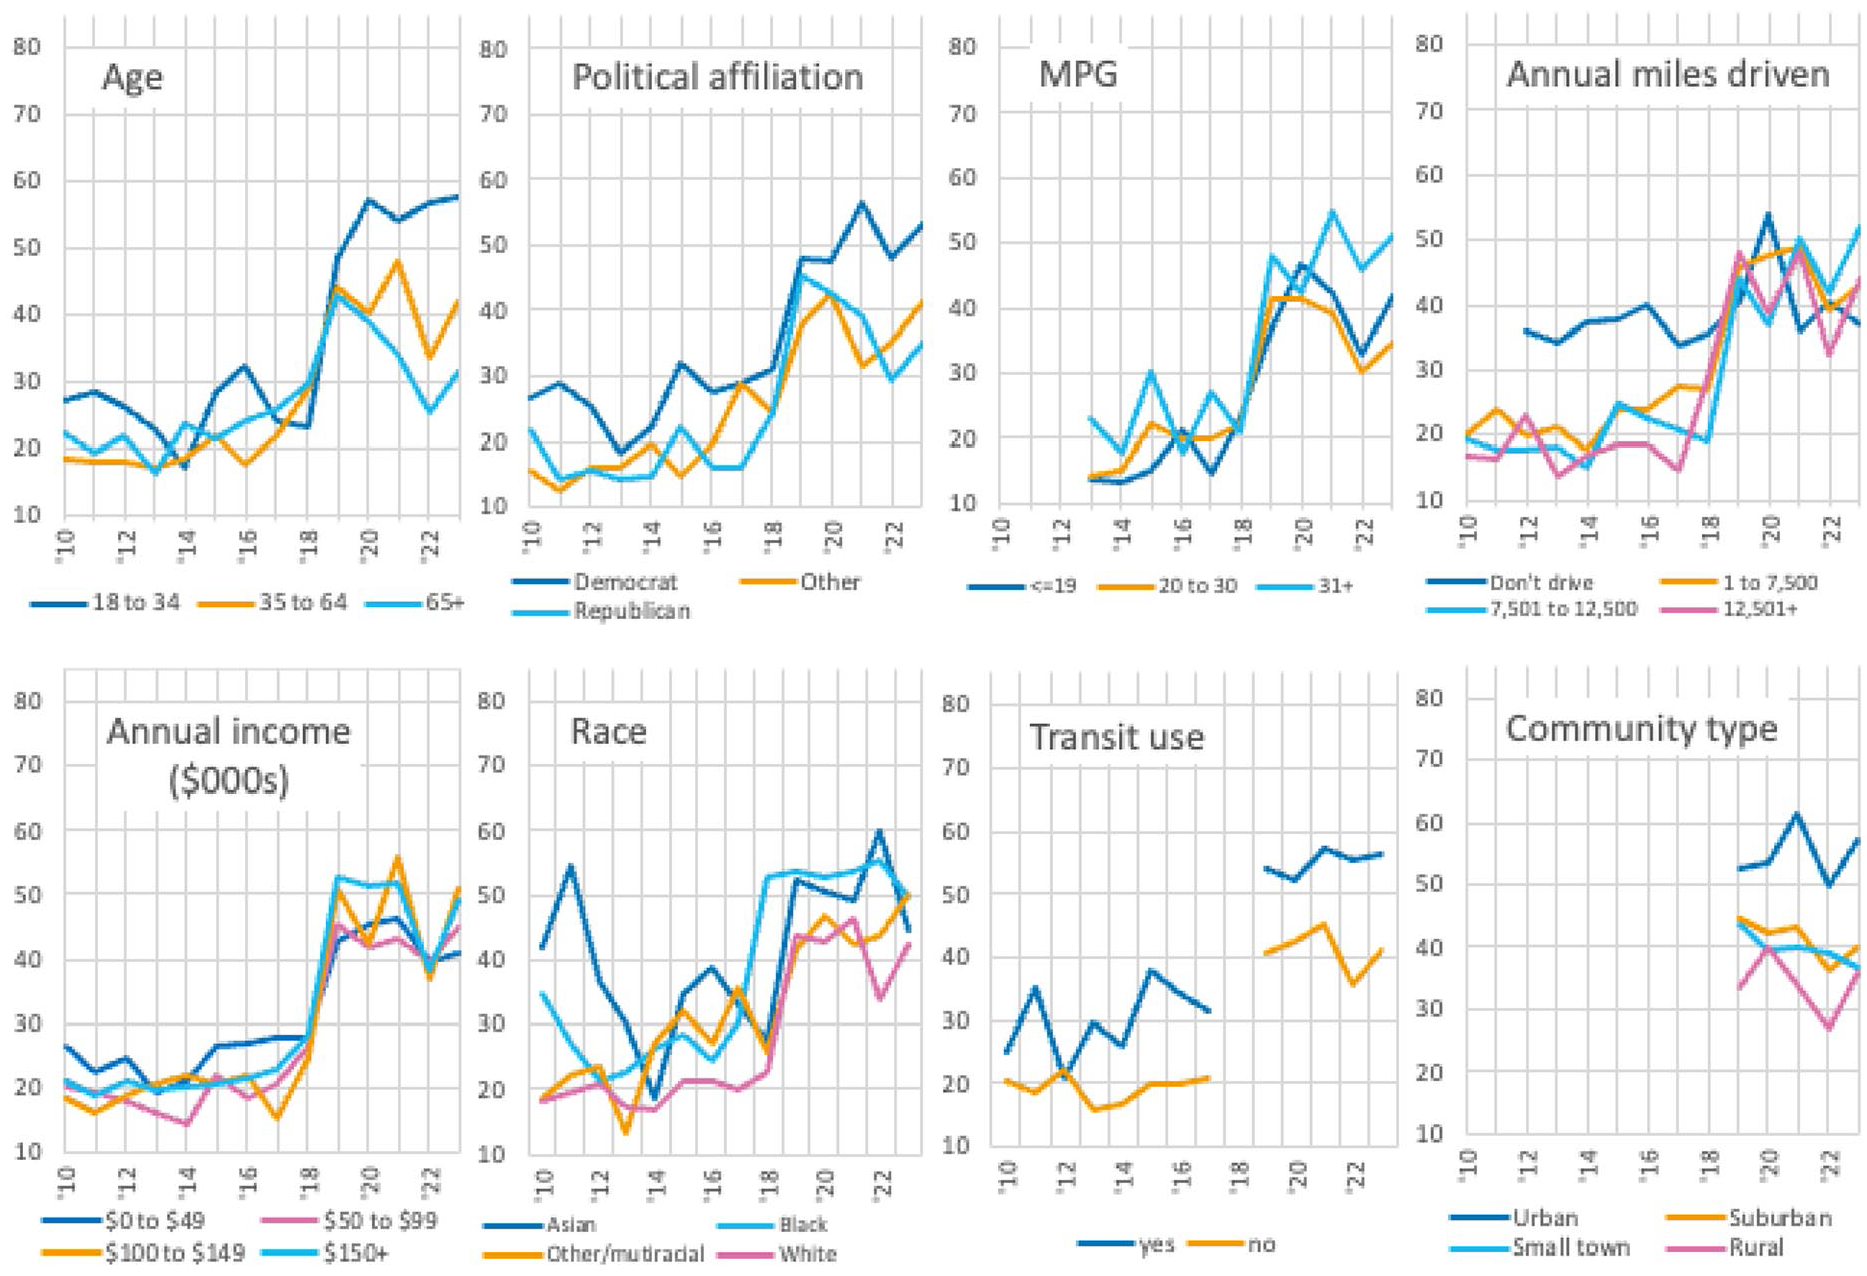
Support for the Flat-Rate VMT Fee by Personal Characteristics, 2010–2023
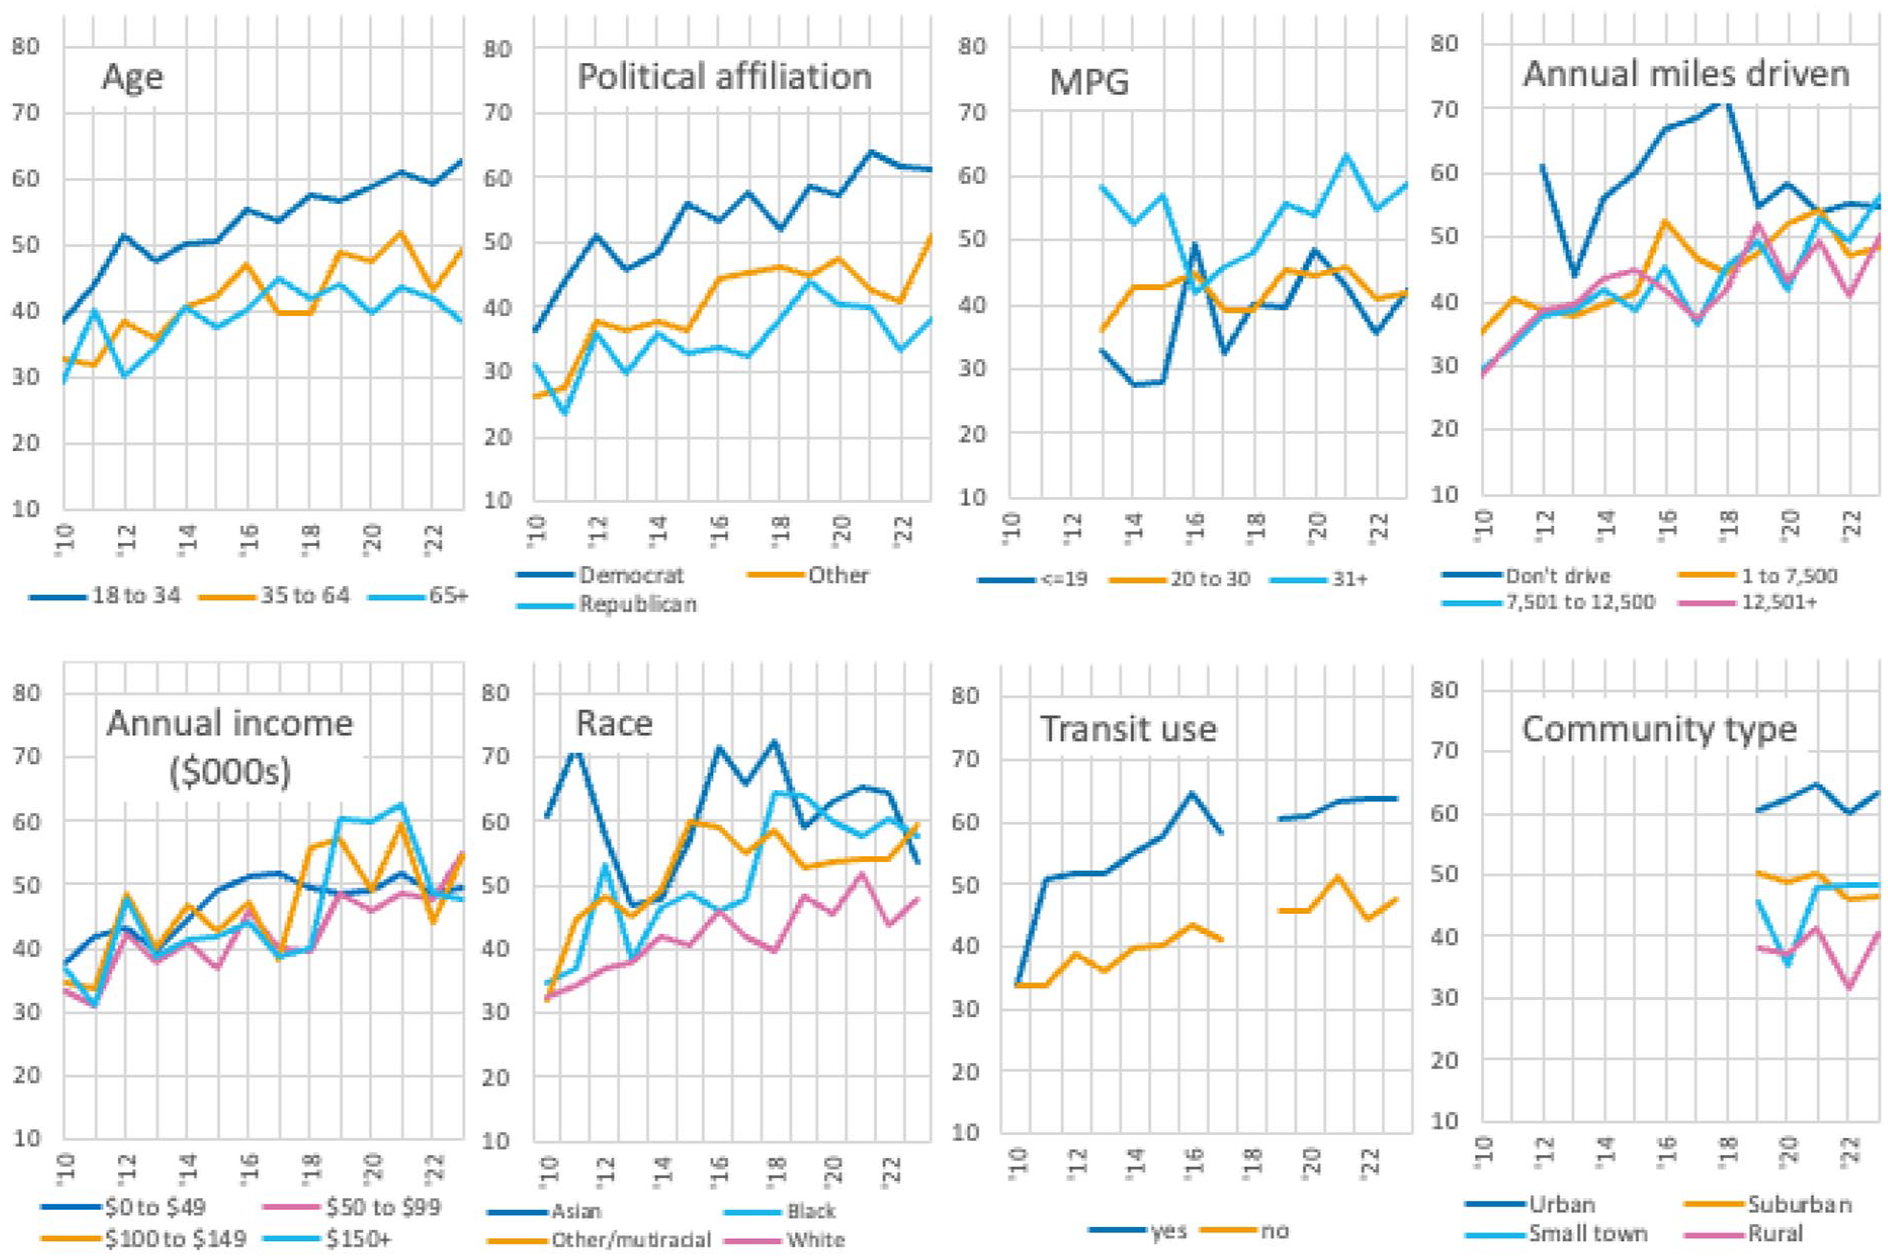
Support for the Green Mileage Fee by Personal Characteristics (2010–2023)
Findings: Questions Testing Road-User Charges Design Preferences
This section focuses on four questions that asked respondents to choose between different mileage fee design options. Three questions asked about different rate structure options and the fourth about how frequently payments should be collected.
Rate for EVs
The survey asked respondents their opinion on what rate EVs should pay if Congress were to implement a mileage fee on all travel. The answer options were to charge EVs the same rate as gas/diesel vehicles, half the rate, or nothing at all. This question was included on the survey because a number of research studies have found that some members of the public dislike the idea of a flat-rate mileage fee on the grounds that, unlike gas taxes, this version of a mileage fee provides no incentive to purchase and drive more sustainable vehicles (Agrawal, Nixon, & Hooper, 2016). Some pro-environment advocacy organizations have also advocated for research and mileage fee pilot programs rates that discount the charge for less polluting vehicles. For example, the State of California is about to begin a mileage fee pilot program that tests charging half the participants a rate “equal to the state per-gallon fuel tax divided by the United States Environmental Protection Agency’s estimated fuel economy rating for that vehicle based on the manufacturer, model, and year of the vehicle” (California State Senate, 2021).
Just under half of 2023 survey respondents (49%) thought EVs should pay the same rate as gas and diesel vehicles, slightly more than a third (36%) preferred charging EVs only half, and a small minority (16%) preferred that there be no fee at all for EVs. Three earlier surveys asking the same question found quite similar results.
Rate for Low-Income Drivers
Another survey question asked respondents, “If Congress adopts a mileage fee, would you support or oppose charging a lower rate to low-income drivers?”
This rate structure question was included on the survey to test support for an option to address widespread concern about the impact that mileage fees would have on low-income drivers. Further, there is precedent within the transportation and utilities sectors for charging discounted rates to low-income travelers; some tolling authorities and public transit agencies offer this type of discount, as well as most power utilities. In California, for example, the California Alternate Rates for Energy (CARE) program discounts electric bills for low-income ratepayers by 30% to 35%, depending on income and household size (California Public Utilities Commission, 2021).
In 2023, well over half of survey respondents (62%) preferred to offer a discounted low-income rate, instead of charging the same rate to all drivers (Table B4). Two previous surveys asking the question had very similar results.
The analysis of 2023 findings by personal characteristics found that the concept was widely popular. The low-income rate was favored by the majority in every subgroup except the oldest respondents (65 or older). There was supermajority support from Democrats, 18 to 34-year-old respondents, transit users, urbanites, respondents who identified their race as either black or multiracial, and respondents in the middle income group ($50,000–$99,000). Characteristics associated with particularly large spreads in support were age (25 percentage points) and political party (22 percentage points). The smallest spread was associated with annual miles driven (5 percentage points).
Block Rate
The survey also tested support for the concept of a block-pricing rate structure. The survey described the block rate option as a rate that is lower for the first 5,000 miles driven annually and higher for all additional miles driven that year.
This option was included in the survey because block-rate pricing provides low-income drivers the option to drive some amount of mileage at low cost yet does not require the administrative complexity of varying the rate by vehicle owner or driver characteristics. Within transportation, there is precedent for block rate pricing at parking garages that raise the hourly rate for vehicles parked for more hours. Further, there is also precedent in water and power utilities. Within utilities, for example, Southern California Edison charges 31¢ per kWhs up to a “baseline” consumption level, 40¢ per kWh for kWhs consumed between 101% and 400% of the baseline, and a “high-usage” rate of 50¢ per kWh for usage beyond 400% of the baseline allocation (Southern California Edison, 2023).
The 2023 respondents were almost evenly split on whether they preferred a block-rate or flat-rate mileage fee structure, with 48% considering the block rate fairer versus 52% who thought it fairer to charge the same rate for every mile driven during the year. Responses were very similar the previous year.
The analysis of how preferences differed by personal characteristics found that by far the largest spread (20 percentage points) shows up when comparing responses by people driving different total annual miles. Preference for the block rate was 53% among people who drive 1 to 7,500 miles annually but only 33% among people who drive the most (12,501 or more miles annually). The groups with at least 50% support for the block rate were respondents 65 or older (56%), those drivers covering the fewest miles annually (53%), suburban respondents (52%), those driving a primarily vehicle with fuel efficiency of 20 to 30 mpg (51%) or 31+ mpg (50%), and Democrats (51%). The characteristics with the least spread in support were income (4 percentage points), race (3 percentage points), and vehicle fuel efficiency (3 percentage points).
Payment Frequency
Another survey question asked respondents to select their preferred frequency to pay for a mileage fee, should one be introduced. The options were to pay at the time of purchasing fuel or charging an EV, pay a monthly bill, or pay an annual bill.
Payment frequency is important to both the agency administering a mileage fee and drivers. For agencies, more frequent payments add complexity and cost to program administration. For drivers, however, large, infrequent payments are much harder for low-income households to afford, and many equity advocates oppose annual payments for this reason.
The most popular payment frequency option in 2023, selected by 45% of respondents, was to “Pay each time I purchase gas/diesel or charge an EV.” Thirty percent preferred a monthly bill, and one quarter preferred an annual bill.
To examine how support varies by characteristics, we collapsed the three answer options into just two: support for frequent payments versus annual payments. There were relatively few large differences by characteristic in 2023 (Table B6). There is only an 18 percentage point difference between the subgroup with the lowest proportion of support for paying when refueling/recharging (38%) and the highest (56%). Characteristics with the largest spread are age (17 points), community type (14 points), and fuel efficiency (12 points). That same year the subgroups with support at or above 50% for paying when refueling/recharging are respondents aged 65 and older, people living in small towns, Republicans, and people driving a primary vehicle with a fuel efficiency of 20 to 30 mpg.
Findings: Spending Plans Matters
Although the focus of this paper is to understand support for mileage fees, we can draw lessons from survey questions about gas taxes as well as from the questions directly about mileage fees. As will be explained later, mileage fee implications can be drawn from comparing support across a series of questions asking about different priorities for how federal gas tax revenue could be spent if the rate is raised.
The survey asked respondents about their support for six different versions of a 10-cent-per-gallon increase in the federal gas tax rate, from 18 to 28 cents per gallon. (The current rate is actually 18.4 cents per gallon, but the survey rounded the rate to a whole number to make the question simpler to understand.) The first option presented, labeled the “base-case” option, asked respondents if they would support raising the gas tax rate “to raise money for transportation.” No other information was given about how the revenue would be spent. The other five gas tax rate increase options each specified a targeted use of the revenue raised. These asked about support for the gas tax rate increase if revenue would be spent on projects to:
Maintain streets, roads, and highways
Reduce accidents and improve safety
Reduce the transportation system’s contribution to global warming
Reduce local air pollution caused by the transportation system
Reduce traffic congestion
The 2023 survey found that a majority of Americans would support paying a higher gas tax—under certain conditions (Figure 4). Only 40% supported the base-case option presented, the 10¢-per-gallon gas tax increase to raise money “for transportation.” However, the five variants on that idea of a 10¢-per-gallon gas tax increase each received from 50% to 70% support. For these variants, respondents were told that the revenue from the increase would be dedicated to a specific type of spending. The two most popular options among the variants were for a gas tax increase with the proceeds dedicated to better maintenance and safety improvements. Seventy percent of respondents supported these options, a major increase compared to the 40% support for the base-case gas tax increase. The next most popular option was a gas tax increase with funds devoted to reducing congestion (67%). As for the two options that linked a gas tax increase to environmental objectives—reducing local air pollution or global warming emissions—both had majority support (55% and 50%, respectively).
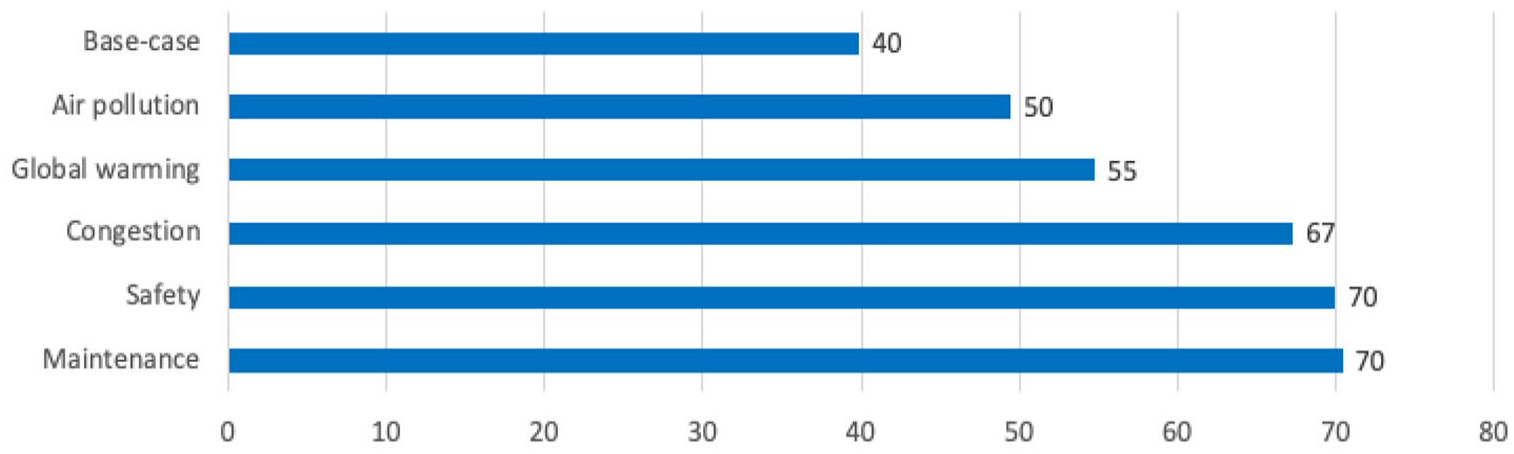
Percent of Resondents Supporting the Gas Tax Rate Increase Options in 2023
Trends Over Time in Support for Gas Tax Rate Increases
Support for all the gas tax rate increase options has risen overall since 2010 (Figure 5). The changes from year to year are small, usually no more than a few percentage points. The largest increases across the full-time period have been in support for the base-case option (17 percentage points) and the air pollution option (20 percentage points). For the base-case option, support grew from 23% to 40%. In contrast, the smallest increase (9 percentage points) has been for the most popular option, the maintenance variant. For the past 3 years, support for all the taxes has dropped slightly.
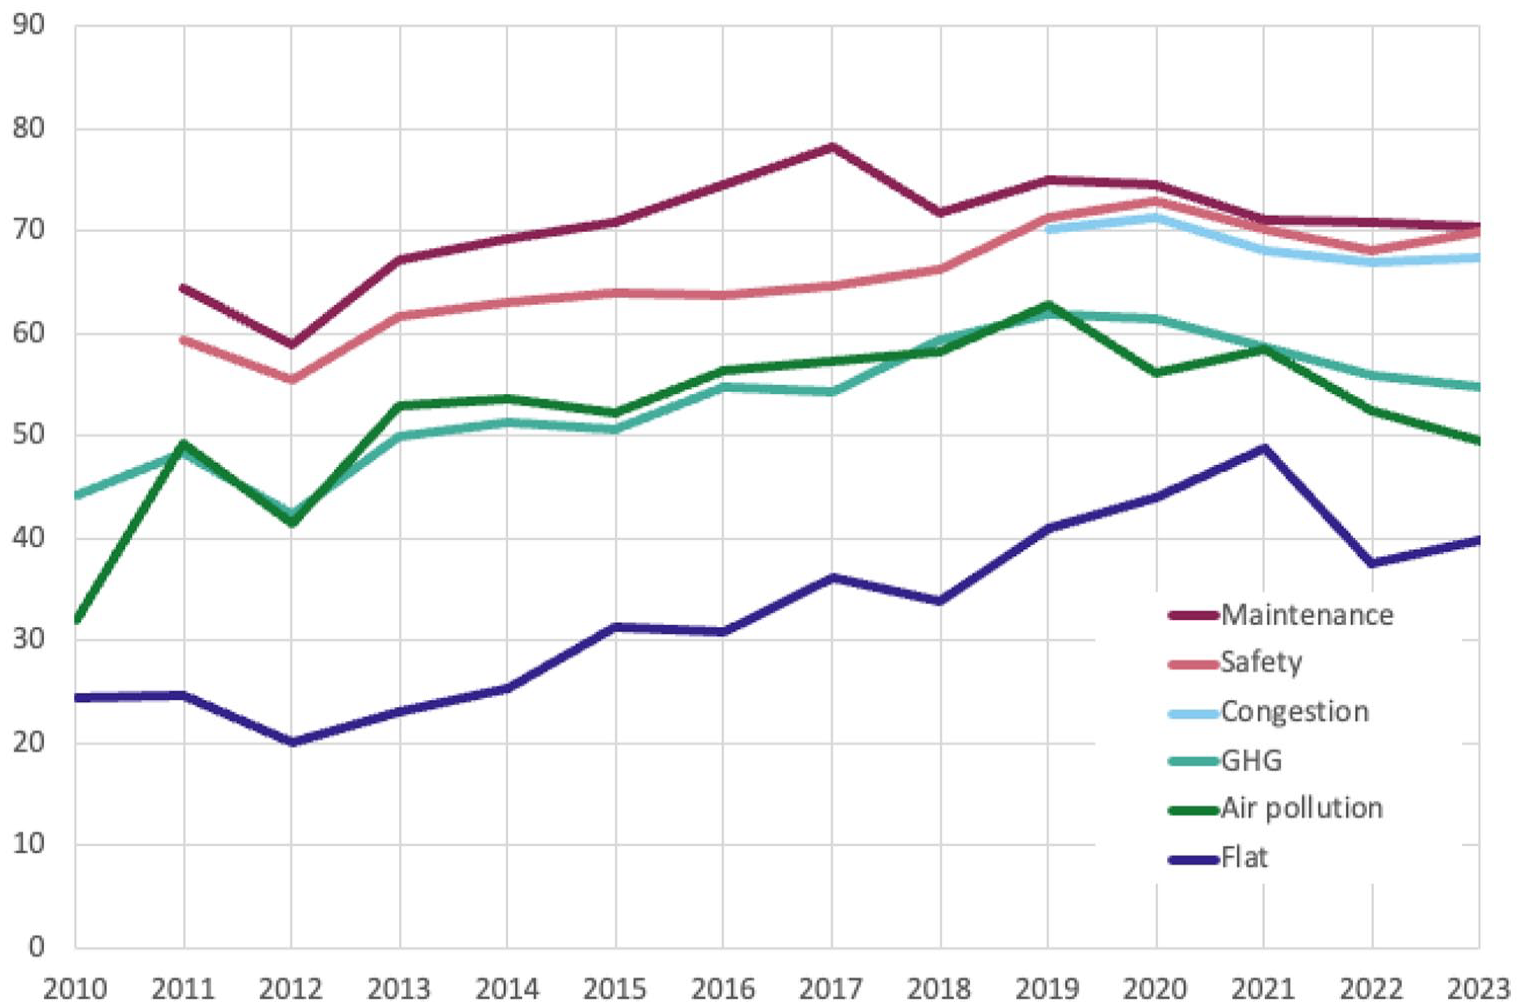
Percent of Respondents Supporting the Gas Tax Rate Increase Variants (2010–2023)
Support for the Gas Tax Increases by Personal Characteristics
We analyzed trends in support for each of the gas tax rate increase options by all eight personal characteristics. As with the analysis of support over time for the mileage fees, we looked for whether support diverged or converged over time for any subgroups and also identified tax options where there was a particularly large difference in support across subgroups. Figures C1 to C6 in Appendix C display the trends in support for the gas tax options.
Base-case (Figure C1): The size of variation in support among subgroups varied by characteristic. There were few variations by income and annual miles driven, but larger variations by other characteristics.
Maintenance (Figure C2): The variations among subgroups for each characteristic were very small.
Safety (Figure C3): The amount of variation in support among subgroups varied by characteristic. There was little variation by vehicle fuel efficiency, but modestly larger variation for other characteristics.
Congestion (Figure C4): The variations among subgroups for each characteristic were small.
Air pollution (Figure C5): There was a large amount of variation in support among subgroups for most characteristics, with especially large differences by age, political affiliation, annual miles driven, and race.
Green-house gas emissions (Figure C6): There was a large amount of variation in support among subgroups for most characteristics. The spread in support among subgroups was more modest for income, fuel efficiency, and community type.
Findings: Trends by Characteristics
The last component of analysis explores whether personal characteristics like age or household income correlate with strong differences in opinion across both mileage fees and the six gas tax questions. For each personal characteristic, we analyzed the survey results to identify whether there were large differences in support between subgroups (i.e., among people of different ages), as well to identify whether support levels for that subgroup differed by tax type (i.e., whether different age groups respond differently to the flat-rate vs. green mileage fees). Appendix D presents figures showing the detailed results of support for each of the tax options, by personal characteristics. The following key findings emerge for each characteristic:
Age (Figure D1): The youngest respondents were usually the most supportive age group for all the tax options. There were just a few exceptions, most notably since 2019 for the maintenance, safety, and congestion gas taxes. The other exception is for the flat mileage fee until 2020. Support was very similar for the middle-aged and oldest groups on all taxes, though the spread is slightly larger as of 2020 for the two least popular tax options, the flat mileage fee and base-case gas tax rate increase.
Annual household income (Figure D2): Income was the characteristic with the smallest variation among subgroups; the spread in support among groups for each characteristic was always small. Further, no one income group was consistently the most or least supportive, though the lowest-income group was often the most supportive (by a small amount) for the air pollution, greenhouse gas, and safety gas taxes.
Race (Figure D3): There are few large or consistent differences in support by race. The one exception is that white respondents are at or near the bottom in support for all except two taxes. These two exceptions are the maintenance gas tax (the most popular gas tax option) and the base gas tax (the least popular gas tax option).
Political affiliation (Figure D4): Democratic-leaning respondents were always more supportive than Republicans, though not always by a large spread. There was the most variation between the political parties for the environmentally-oriented taxes, as well as the least popular gas tax increase, the one with revenue “for transportation.” Conversely, for the most popular gas tax increase, the maintenance gas tax, there were very small differences in support by political affiliation. Support from respondents who leaned toward neither the Republican nor Democratic tended to fall between the parties, though often closer to the support levels among Republicans.
Annual miles driven (Figure D5): The clearest pattern for this characteristic is that respondents who don’t drive at all were typically more supportive. However, among the respondents who did drive, there was only a small spread in support according to annual mileage.
Fuel efficiency (Figure D6): There were modest differences in support according to the fuel efficiency of the respondent’s primary personal vehicle for the maintenance, safety, and congestion gas tax increases, but more spread for the green mileage fee and two environmentally-focused gas taxes. For these taxes, respondents with the more fuel-efficient vehicles were more supportive.
Transit users (Figure D7): This set of graphs presents perhaps the simplest picture of all: respondents who had used transit in the previous 30 days were notably more supportive of all but one tax option. The spread in support was particularly large for the three environmentally-oriented taxes. The one exception to the overall pattern is that support for the maintenance gas tax was very similar for transit riders and non-riders, although for most years the riders were slightly more supportive.
Community type (Figure D8): This question was only asked for four years, but over that time period urban respondents were significantly more supportive of all the taxes except the three most popular ones: the maintenance, safety, and congestion gas tax rate increases. For these three taxes, the spread was quite small and the urban respondents were not the most supportive every single year. The other three groups–suburban, small town, and rural respondents—had very similar support levels, although rural respondents were usually less supportive for all but the maintenance gas tax.
Conclusions
This section begins with a discussion of key study findings and their policy implications, and then concludes with reflection on the study limitations and options for future research.
Discussion of Findings and Policy Implications
The Public Is Growing Open to Mileage Fees
The primary evidence for this claim comes from the survey questions about the flat-rate and green mileage fees. Support for both fees has been increasing for more than a decade, and in 2023 a majority supported the green mileage fee (51%). While no other study analyzes a similar multi-year trend survey about mileage fees, the meta-analysis by Agrawal, Nixon, and Hooper (2016) also found evidence to suggest that support for mileage fees has increased over time.
Additional evidence suggesting that the public is growing more likely to support mileage fees comes from the survey findings about the growth in support for gas taxes since 2010. For example, by 2023 support for increasing the gas tax rate to support either better maintenance or safety had risen to 71% and 70%, respectively. The growing gas tax support suggests that more and more of the public believes there is a need for additional revenue to support better transportation.
Careful Program Design Will Increase Support for Mileage Fees
Similar to findings from Duncan, Li, and Graham (2020), we find that program design and different rate structures can influence support. The survey results presented here underscore three reasons to have confidence that public support will vary according to the specific choices made about how the mileage fee program is designed.
First, policymakers should consider rate structure carefully and explore options beyond just a flat-rate per mile, the rate option that has been most commonly discussed and piloted in the United States. The survey series findings suggest that other rate structures may be more popular. The difference in support between the flat-rate and green mileage fees provides the clearest evidence both that public support varies according to program design and that a flat rate for all is not most people’s first choice. Further, the concept of a low-income discount had strong support for the 3 years the survey asked about the option (63% in 2023). Finally, roughly half of respondents supported a reduced rate for EVs (51% in 2023) or a block-rate pricing structure (48%).
A second key program design choice is the frequency with which drivers pay a mileage fee. The survey found that only a quarter of respondents preferred an annual payment. The most popular option was to mimic the gas tax, with payment due whenever a driver purchases fuel or charges an EV (45% support). Mileage fee programs are likely to be more acceptable to the public if payments are due in small, frequent amounts.
Finally, findings on support for the different gas tax increase options show that support is closely tied to how the revenue will be spent. For all 14 years of the survey, far fewer respondents supported a federal gas tax rate increase if the money would be spent generically “for transportation” than supported that same rate increase if the money were dedicated to a narrower transportation purpose they supported. The two most popular uses for gas tax revenue were always to improve maintenance and safety, so it seems very likely that a mileage fee proposal will earn stronger support if the public believes the funds will target those or other high-priority needs. Evidence from a voter referendum that supports this claim comes from the history of California’s most recent gas tax increase, Senate Bill 1: The Road Repair and Accountability Act of 2017, legislation that states in the very title that “repair” (maintenance) is a primary purpose (Caltrans, n.d.). Not only did the law pass the legislature in 2017 but it survived a state referendum the following year (Proposition 6), with 57% of voters choosing to keep Senate Bill 1 in place (California Secretary of State, 2018).
There Is Considerable Variation in Support by Some Personal Characteristics, Though Not All, and This Varies by Tax Option
Four subgroups of respondents were more likely to support all the mileage fee and gas tax increase options: respondents who were in the youngest group, leaned Democratic, rode transit, and lived in urban communities. However, for some tax options there was little variation in support according to those characteristics of age, political learning, transit use, and community type. In particular, for the most popular tax options there was little variation in support by subgroups. For example, in 2023 66% of Republicans and 73% of Democrats supported the maintenance gas tax, a small variation. In sum, it is possible to craft tax options that will likely be widely popular across people with very different personal characteristics.
The study findings also highlight three personal characteristics that were the least likely to be associated with varying levels of support among subgroups. Counterintuitively, these are the characteristics that have generated the most policy discussion and concern about fairness: income, annual miles driven, and fuel efficiency. The surveys consistently found the least variation in tax support among respondents with different household incomes. Further, there was also little variation in support according to the two characteristics included in the survey that directly determine how much people would pay in either a mileage fee or higher gas taxes: the number of miles the respondent drove annually and the fuel efficiency of the vehicle the respondent drove most for personal use.
The final characteristic explored, race, was often associated with large variations in support, but these were often inconsistent, with people of each racial group sometimes more and sometimes less likely to support a particular tax option. However, in general white respondents were less supportive of the taxes than respondents of other races.
Study Limitations and Suggestions for Future Research
Readers considering the results of this research and the associated policy implications should keep in mind that the sample differs slightly from the general population (as with any survey), so the results should be generalized with caution. In addition, the surveys were designed to explore people’s relative preferences for different types of tax proposals, so the results should not be assumed to accurately predict support for any specific tax proposal put forward for an actual public vote.
A second limitation of this research is that the survey questions do not provide evidence of why people supported some taxes and opposed others. Additional surveying can explore what factors are most important. For example, it would be worth investigating if support for the mileage fees is related to people’s trust in the accuracy of odometers or other technologies used to track miles driven.
Future research could expand on the findings in this paper by using a multivariate approach that predicts how support varies within the context of multiple factors. As noted in the literature review, past studies have shown that an individual’s attitudes and beliefs are often more important factors for predicting support for mileage fees than socio-demographic characteristics (e.g., Agrawal, Dill, & Nixon, 2010; Nelson & Rowangould, 2023). Ajzen’s (1991) Theory of Planned Behavior could provide a useful theoretical framework for developing such a line of study. The theory has been widely used in the field of transportation to predict use of public transportation (Heath & Gifford, 2002), willingness to pay tolls (Yusuf et al., 2018), and voting intention (Hennessy et al., 2015). The latter two examples have clear parallels with understanding people’s attitudes toward mileage fees.
Finally, it is worth noting that economic and policy conditions changed over the years of the annual surveys, which could impact people’s attitudes toward transportation taxes and fees. Also, many states increased their gasoline tax rates during the years of this study, and related media coverage likely raised public awareness about transportation funding. Multivariate models that combine personal characteristics and attitudes with variables that capture changing macroeconomic and political conditions would allow for a more detailed and nuanced understanding of the factors that influence support for mileage fees and mileage fee program design. Factors to consider in such work include gas prices, state gas tax rates, and federal and state EV policies.
Footnotes
Appendix A: Respondent Demographic Characteristics,2010 to 2023
Table A1 presents respondent characteristics for key variables used for analysis for each survey year. Missing and refused responses have been removed from the dataset prior to analysis. Data are rounded to whole numbers, so columns for individual characteristics may not sum to 100%.
Appendix B: Data Tables for Subgroup Analysis
Appendix B presents a series of tables showing how different subgroups within the full set of respondents answered the survey questions each year. For example, we compare the percent support for the flat-rate mileage fee for adults aged 18 to 34 versus those aged 35 to 64, and those 65 and older, or for urban vs. suburban, small town, and rural residents.
The statistical test of two proportions was used to check whether differences between pairs of subgroups in a category (e.g., Republican vs. Democrat) are statistically significant at the 95% and 99% confidence levels. In the tables, the first subgroup listed for each category (e.g., age, annual miles driven, or political affiliation) is the reference case to which the proportion of respondents in other subgroups in that category is compared.
Where the response between the reference case and another subgroup in that category is statistically significant, this is indicated as follows: *Statistically significant at p < .05. **Statistically significant at p < .01.
Missing and refused responses were removed from the dataset before analysis.
Data are rounded to whole numbers. As a result, columns for individual characteristics may not sum to 100%. Also, two identical whole numbers likely mask a slight difference (for example, 2.01 and 2.49 will both round to 2).
Appendix C: Support Over Time for the Gas Tax Increase Options
Appendix C presents figures showing trends in support for each of the six gas tax options, by the eight personal characteristics that were a focus of this analysis.
Table 3 presents definitions for legend labels and years of data available.
Appendix D: Trends Over Time in Support for the Mileage Fee and Gas Tax Options
Appendix D presents figures showing trends in support for the two mileage fee options and six gas tax rate increase options, by the eight personal characteristics that were a focus of this analysis.
Table 3 presents definitions for legend labels and years of data available.
Declaration of Conflicting Interests
The author(s) declared no potential conflicts of interest with respect to the research, authorship, and/or publication of this article.
Funding
The author(s) disclosed receipt of the following financial support for the research, authorship, and/or publication of this article: We thank the International Center for Public Policy at the Andrew Young School of Policy Studies, Georgia State University, for supporting the development of this paper through its Conference on Contemporary Challenges in Infrastructure Finance (2023). We received valuable feedback from conference participants as well as from two peer reviewers of this journal. Finally, we thank the Mineta Transportation Institute for funding the survey series through a grant from the U.S. Department of Transportation’s University Transportation Center program.