
Abstract
Previous research has established that peer relationships are important for student success, yet little research has examined connections made in the classroom, as opposed to residence life or extracurricular activities. This project utilized social network analysis in two cohorts of science and mathematics majors to investigate the degree to which students take multiple courses with the same peers. Results showed (1) wide variability in student networks, (2) course selection by students included more repeated connections than random course selection, (3) networks did not vary much by demographic variables (gender, race, first-generation status, and income), and (4) student networks significantly predicted graduation and grades. This correlational research provides a foundation for future experimental research testing the causal impact of classroom-based student networks. This research also serves as a model for how other institutions may analyze institutional data to understand patterns of peer connections and course enrollment at their institution.
How often do college students take courses with the same peers, and does taking courses together relate to student success? Imagine a typical student signing up for courses for their first semester; the selected courses are largely guided by the course requirements at their university and for their intended major, influenced by their preferred times for taking courses and which courses have seats open. Then as they take those courses, they may become acquainted with peers through the formation of study groups, assigned group work, or even just informal chatting before or after class. If the student is confused about a course assignment or just wants to double-check a due date, they may reach out to peers for help, and they may find class more enjoyable and be more motivated to attend when they are friendly with their classmates. When it becomes time to sign up for classes for the next semester, they may share their intentions with these acquaintances and even collaborate together to try to sign up for the same classes the next semester.
The purpose of this study was to use institutional data to characterize and explore the degree to which students take courses together at a mid-sized regional university, and to test whether taking courses together was related to student success. Our approach was to examine incoming first-year students majoring in science and mathematics (STEM) who began studies in Fall 2015 and Fall 2016. Broadly, we adapted ideas from social network analysis where networks are formed by students taking classes together (including labs or required small group sessions). We drew data from official university records, including demographic information, the full list of courses taken by students, the grades students received in those classes, and their long-term outcomes in terms of graduation. These data were used to understand student networks and how they relate to student success.
Background
Survey research has consistently shown that students’ connectedness with peers is correlated with their success and retention in college (e.g., Skahill, 2002; Swenson Goguen et al., 2011). In their review of research on retention, Pascarella and Terenzini (2005) go so far as to say that peer relationships are “probably the most pervasive and powerful force in students’ persistence and degree completion” (p. 615). More recently, Bronkema and Bowman (2019) empirically demonstrated that just having one close friend by the end of sophomore year is related to both retention and higher academic performance, and having three or more friends provides an even stronger link. While most of this research is correlational, experimental evidence also supports the notion that peer friendships can have a positive impact on student success. One study showed that a values affirmation completed in an introductory biology course effectively increased the number of friends students made in the course, which in turn increased the likelihood that students enrolled in the next biology course in the two-semester sequence (Turetsky et al., 2020). Another study tested an intervention that paired classmates at the beginning of the semester and had them ask each other a series of increasingly personal questions so they could quickly develop closeness (Rasco et al., 2023). Students who received the intervention were about half as likely to drop out of college by the next academic year compared to students in the control group; this effect was largely driven by the positive impact of the intervention on students of color in particular. Given this correlational and experimental evidence, it appears that connectivity among college students can improve student success.
There are several theoretical explanations as to why connectivity among college students improves student success. First, connections with peers may increase students’ sense of belonging, thus tapping into the basic human need for acceptance by fellow group members (Leary & Baumeister, 1995). Sense of belonging has been demonstrated to be an important predictor of student success in a number of studies (e.g., Good et al., 2012; Gopalan & Brady, 2020; Ostrove & Long, 2007). Connecting with others may also increase one's social capital (Putnam, 2001), allowing students to exchange information about the university or their classes that help them succeed (McEwan, 2014). A strong social network may contribute to the feeling of a more collectivist culture in college, which may especially benefit students who have a more collectivist or interdependent culture at home (e.g., working-class students, students of color, etc.; Stephens et al., 2012). For many students, a collegiate culture where classmates are familiar with one another more closely mimics their K-12 educational experience, and thus may provide a sense of comfort and familiarity. Each of these possible mechanisms strengthens the argument that peer connections are meaningfully connected to student success.
Social Networks Based on Course Registration Patterns
Much of the research on peer connections in higher education focuses on primarily residential colleges and universities, where university efforts to encourage peer connections are often located in student activities and residential life. This focus excludes campuses with a large commuter student population, who may not be on campus much beyond their class requirements. In these contexts, connections made within classrooms are crucial to encourage widespread connectedness among students. Connections made early, as in the first 2 years of college, may be especially important as students acclimate to the campus and university culture while making key choices (e.g., course enrollment) that will determine their degree. Specifically, understanding the degree to which students take classes with the same peers in the first 2 years may help us understand the degree of connectedness among students, and in turn, how that connectedness relates to measures of student success.
Social network analysis (SNA) is a relatively new statistical technique for understanding how members of a network (such as students in a college) are connected. SNA has been applied in higher education to understand a variety of phenomena, including how to group majors together to create guided pathways for community college students (Baker, 2018), networks among faculty collaborating to improve teaching and learning (e.g., Quardokus Fisher et al., 2019; Hayward & Laursen, 2018), and networks among scholars based on collaborations and citations (e.g., Abbasi et al., 2011; Cimenler et al., 2014).
In 2014, Grunspan and colleagues (2014) called for researchers to utilize SNA to better understand how students are connecting in their classes. One such project used SNA to understand how engineering students divide into groups to work on projects (Putnik et al., 2016). Though the context in this study was a highly specific project-based curriculum, rather than a more typical classroom environment, it is noteworthy that they found that students who were more central in their networks and had stronger ties in the network earned higher final grades. Turetsky et al. (2020) used SNA to conclude that a values affirmation exercise caused more peer connections among introductory biology students, which in turn increased STEM persistence (as measured by enrollment in the next biology course). These projects establish the utility of SNA for understanding student connectedness in classroom settings, yet the present project is novel in its use of course registration patterns to assess student networks.
The Current Study
Our aim for the current study was to characterize and assess the degree to which students cluster (i.e., take courses with the same peers) and how that relates to their grades and retention. The study took place at Bridgewater State University (BSU), a public Master's Comprehensive University in southeastern Massachusetts with approximately 10,000 full-time students. All first-time, full-time students with declared majors in biology, computer science, or mathematics were included in the analysis. These majors are the largest majors within the College of Science and Mathematics (CoSM), and the courses taken by students in these majors have multiple sections each term, allowing for the possibility of students clustering within the same section by choice.
The peer networks in this study are based on enrollment in course sections as drawn from institutional records. Generally, lecture sections at BSU have 25–32 students; lab sections have 16 students; and required small group sessions have 8 students. Network connections form between students through enrollment in the same class section. Our analyses were motivated by the following research questions:
What do peer networks in the CoSM look like? How do students’ actual peer networks compare to peer networks that would arise based on random course selection? How do peer networks vary by race, gender, first-generation status, and commuter status? How do a student's peer connections in the first 2 years relate to student success measures, including graduation rates and GPA?
The particular SNA measures that we found to be the most relevant to understanding the impact of connections with peers to student success measures are the number of connections (known as degree in SNA) and the number of repeated connections (known as the weighted degree in SNA). We posit that a student who knows more students in the major, because they have made more connections through taking classes with more students, may have found a wide peer network helping them develop a sense of belonging. Similarly, the number of times a student repeats a connection by taking multiple classes with the same peers may provide an intense connection the student can use for specific help.
Method
Participants
The sample for this analysis was all students who started as first-time, full-time first-year students with declared majors in Biology, Computer Science, or Mathematics majors in the CoSM in Fall 2015 (N = 169) or Fall 2016 (N = 169). These cohorts were chosen so that we could include 6-year graduation rates as an indicator of student success. Institutional data was gathered regarding every class each student took, grades earned, graduation, and demographic characteristics. Characteristics of the sample can be found in Table 1. Students self-identify at admission (and can update later) their preference of racial and ethnic backgrounds, gender, and whether their parents completed a 4-year degree (first-generation status). Students are listed as White in Table 1 if they only selected “White” as their race and did not indicate Hispanic heritage. For gender, students are given the option of listing female or male. We did not have access to data regarding students’ sexual orientation or identification outside of a binary understanding of gender. Students are considered commuter students if they did not live on campus in their first semester. Low-income students are identified from the Estimated Family Contribution from the FAFSA form.
Demographic Characteristics of the Sample.
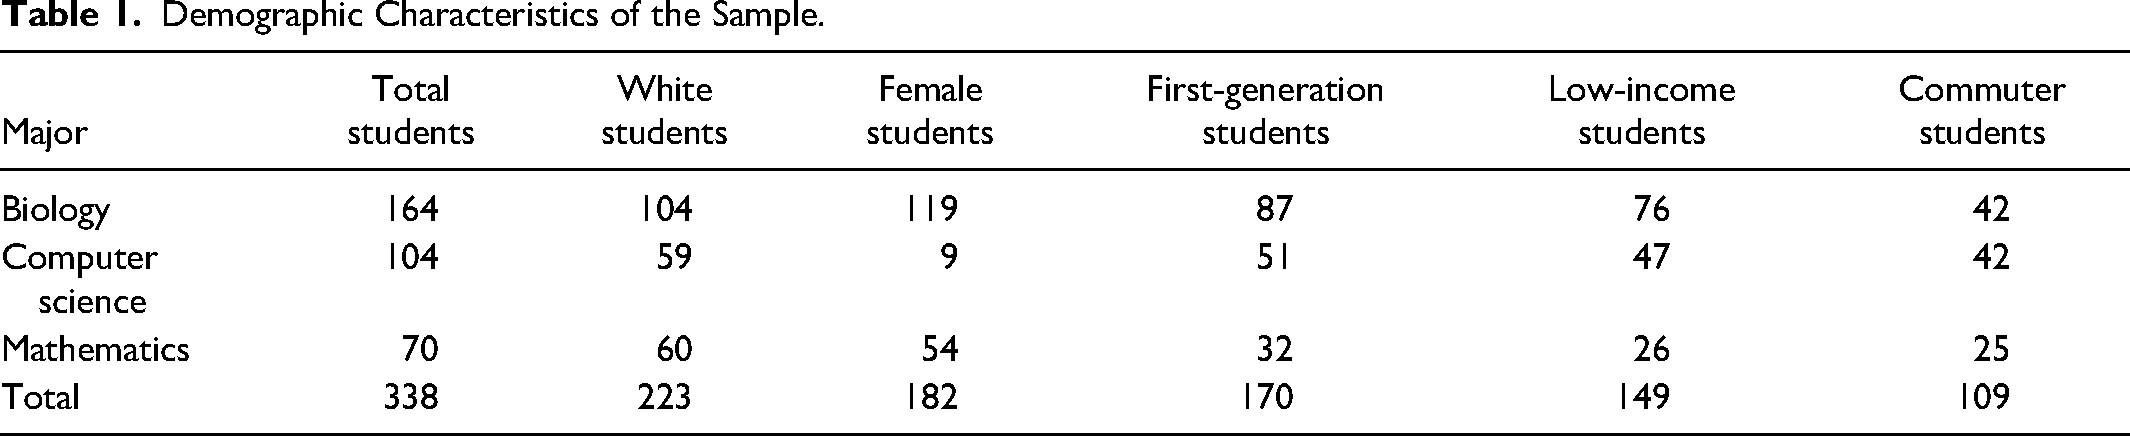
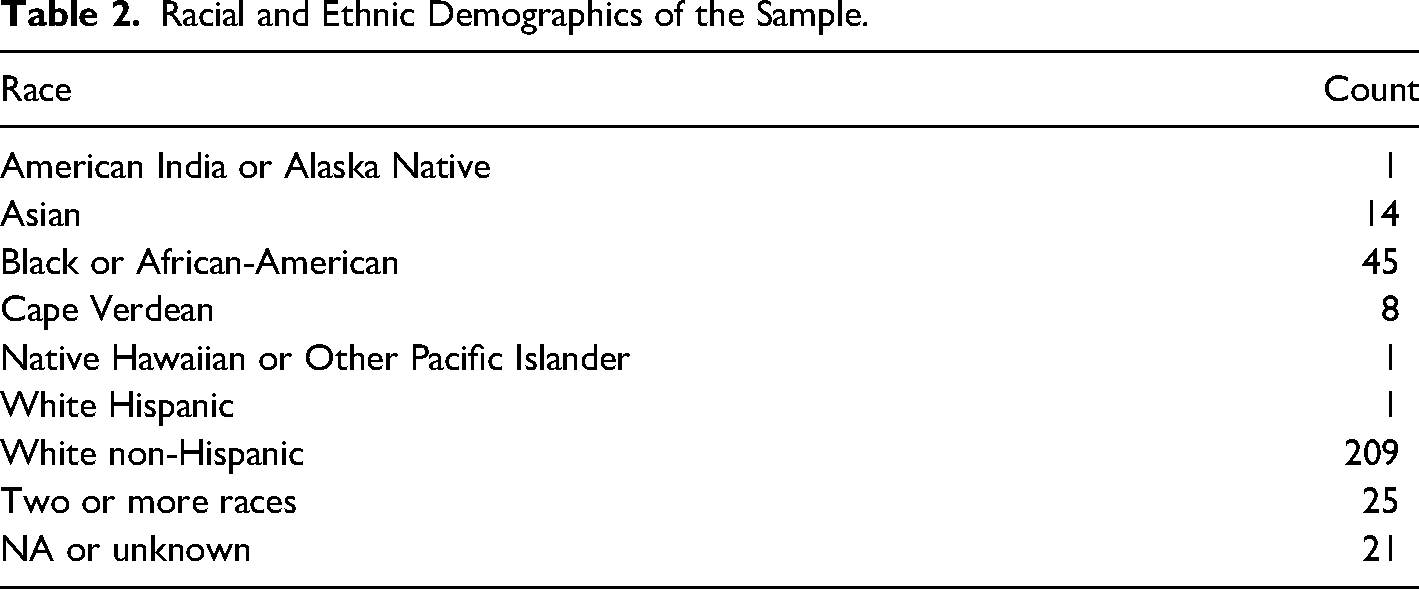
Table 2 provides a breakdown of the race and ethnic background of the students. Because [redacted] serves a region with a large number of Cape Verdean immigrants, this category is listed separately.
Racial and Ethnic Demographics of the Sample.
Analytical Approach
Guided by our research questions (described above), we first conducted a series of exploratory analyses of the 2015 cohort (i.e., those students who started college as biology, computer science, or mathematics majors in Fall 2015). An exploratory approach was necessitated by the large and complex nature of the dataset, as well as the open-ended nature of our research questions. After determining which analyses seemed most pertinent in the 2015 cohort, we ran the same analyses in the 2016 cohort (i.e., those students who started college in these majors in Fall 2016) in order to confirm our findings. This replication with the 2016 dataset allowed us to reduce the Type I errors (i.e., overestimating the number of statistically significant findings) that are common in exploratory analyses, thus increasing confidence in our findings. After confirming the findings in the 2016 cohort, we combined the 2015 and 2016 cohorts in order to present the results below in a streamlined fashion.
SNA was performed based on the courses taken by each student in their first 2 years at the university. Originally, we examined networks across 4 years, but we realized that 4-year social networks were severely confounded by whether students continue or leave the major or the university, rendering any analyses less meaningful, and thus we do not report those analyses here.
A pair of students were considered connected if they took a course together, and their connection was repeated if they took multiple courses together. In the parlance of SNA, the students were the nodes in the network, and taking courses together created the edges of the network. All required course elements for which students formally enroll were considered distinct opportunities for connections. Students register for each element by entering a specific Course Registration Number (CRN) which is kept as part of the student records. For a class with only a lecture section, all the students in the class would have the same CRN in their student record. Some classes combined lecture sections with specific small-group learning sessions (recitations), and other classes had either laboratory sections with or without additional recitation sections. In these cases, the lecture, recitation, and laboratory sessions were separate CRNs, and thus would constitute opportunities for connections.
The SNA was conducted separately by major in order to control for differences in size and structure of majors that would influence the opportunity for peer connections. For example, the biology major requires many courses that combine lectures and labs, allowing for a greater number of connections over the 2 years of study, whereas labs and recitations are not as common in the computer science or mathematics major. Thus, all social network variables are calculated within a student's major, and standardized versions of these variables are used for analyses conducted with the whole sample. Analyses for the smallest majors in the CoSM (e.g., physics, chemistry, geology) are not included in the results reported below because they often offer only a single section of many of the required courses, and therefore most or all of their students take the same classes, leading to a severely restricted range for any of the social network variables.
We focus on two kinds of social network measures in our analyses: connections and repeated connections. The number of connections (also known as degree in SNA) is a count of how many peers in the network with which another student has taken classes. Thus, a student who has been in classes with 30 different peers would have a higher number of connections than a student who has been in classes with 10 different peers. We include both the raw number of connections (i.e., degree) and a version standardized by major (i.e., degree centrality); the former is easier to interpret at a glance, while the latter is more meaningful given the differences in majors described above. The standardized version of the variable was calculated by dividing the total number of connections by the total number of students in the major (i.e., possible connections), such that a student who was connected with every other student in their major would have a score of 1, and a student who had no connections with fellow students in their major would have a score of 0.
We also analyze a version of the weighted degree, which we will refer to as repeated connections. This variable is a measure of how many courses a student took with the same peer, thus repeating the same peer connection multiple times. Accordingly, if a pair of students took three courses together, they would have a higher repeated connection compared to a pair of students who took two courses together. In our analysis, we compute the repeated connection variable by counting the raw number of connections with the same peer (taking different class sections together) and subtracting one, since the first time students take a class together they are not repeating a connection. Hence, two students who only take one class section together have a repeated connection value of zero because they never repeated their connection.
There are two aspects of the repeated connection which we posit may relate to student success: The total number of repeated connections with all peers and the maximum number of repeated connections with a single peer. The total repeated connections (TRCs) was computed by summing repeated connections for each student, so that each student has a TRC score representing how many repeated connections the student made with all of their peers. We also examined the maximum connection (MC), which represents the number of courses that a student took with the peer they reconnected with the most times. In SNA terms, this is the weight of the thickest edge. Conceptually, TRC allows us to simultaneously test both the depth and breadth of a student's network, which we liken to a “familiar faces effect,” while MC allows us to analyze the intensity of the single strongest connection for each student, which we liken to a “best friend effect.” A mean-centered version of both TRC and MC were also calculated within each major to serve as the standardized version of the variable for use when analyzing all majors together.
To get a more concrete sense of these variables, imagine student A took 10 classes with student B, 4 classes with student C, and 1 class with student D. Student A's total number of connections would be 3, since they have taken classes with three other peers. Student A's TRC would be 13, because (10-1) + (4-1) + (1-1) = 13; in other words, Student A has seen a known peer in a class 13 times (9 times it was Student B and 3 times it was Student C). Student A's MC is 9, because the most times they’ve repeated a connection (which in this case is with Student B) is 9.
SNA also allowed us to analyze eigenvector centrality, which accounts for how well-connected a student's peers are (i.e., connecting to someone who is connected to a lot of other peers leads to a higher eigenvector centrality than connecting to someone who is connected to only a couple other peers). However, we did not find a meaningful pattern with the eigenvector centrality variable, and we could not determine a conceptual reason that being more central in the network of class registrations would or would not lead to increased student success. Therefore, we do not report on eigenvector centrality in the results section below.
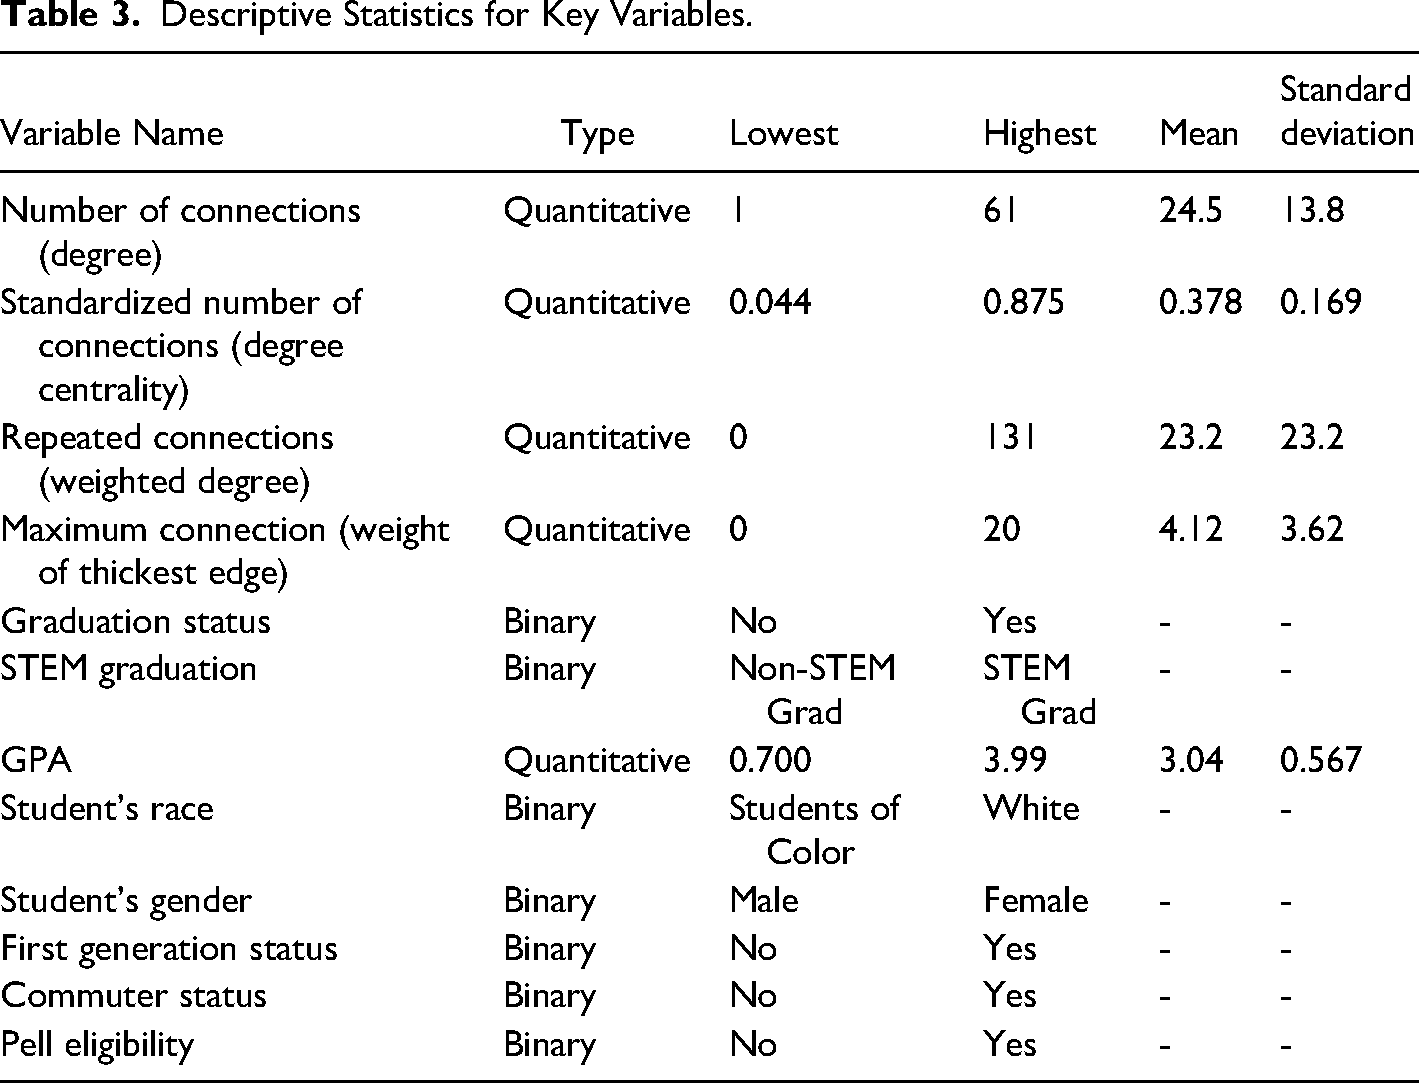
The student success variables chosen for analysis were graduation, graduation with a STEM degree, and final GPA for the courses at [redacted]. These variables allowed us to assess how the students’ social networks (namely, connections and repeated connections) related to student success. We also collected several demographic variables (race, gender, first-generation status, and commuter status) that allowed us to compare the social networks of different types of students. The demographic variables were guided by the literature as well as what data was available from the institution.
Results
What Do Peer Networks in the College of Science and Math look like?
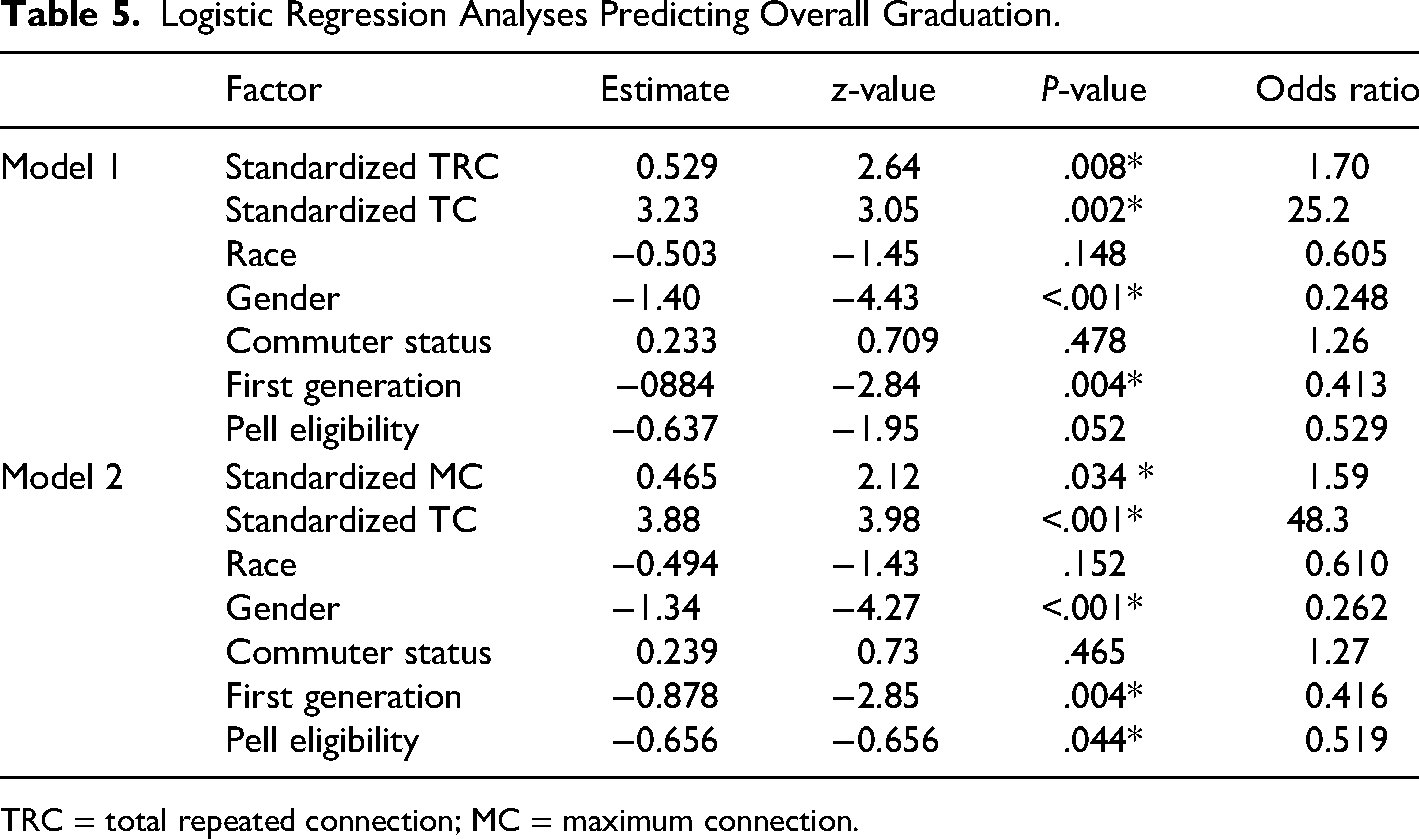
Figure 1 contains a few graphs depicting networks found in the CoSM among first-year students admitted in 2015. Each circle represents a student, and the lines indicate connections between pairs of students. The size of the circle represents the number of connections that each student has (i.e., a larger circle indicates more connections), and the weight of each line indicates the repeated connection (i.e., heavier lines indicate more classes taken together). These visualizations allow us to see at a glance that the biology network is denser than the computer science or mathematics networks.
Based on this SNA, we can see that students’ networks in their first 2 years of college varied greatly, ranging from connecting with one other peer to 61 other peers. Connections varied by major, such that the average number of connections (i.e., average degree) of Mathematics students (M = 14.8, SD =6.16) was statistically similar to that of Computer Science students (M = 22.2, SD =5.68; p = .11), both of which were significantly smaller than that of Biology students (M = 36.0, SD =16.7; p < .001), F(2,140) = 28.02, p < .001.
Students showed a wide range of TRCs (i.e., weighted degree), from 0 to 131. The TRCs also varied by major, following the same pattern as the number of connections. On average, Mathematics students had the fewest repeated connections (M = 14.2, SD = 12.6); Computer Science students had a similar number (M = 16.6, SD = 9.53; p = .94); and Biology students had the most (M = 39.7, SD = 32.0; p < .001), F(2,140) = 15.44, p < .001.
The maximum repeated connections ranged from 0 to 20, with a slightly different pattern by major. On average, the maximum repeated connection of Computer Science students was smaller (M = 3.18, SD = 1.84) than that of Biology (M = 5.55, SD = 4.42; p < .003), while the mathematics students (M = 3.95, SD = 3.13) were not significantly different from either computer science (p = .73) or biology students (p = .20), F(2,140) = 5.96, p = .003.
The analysis of the 2016 data revealed similar findings; see online Supplementary Appendix A for analysis details and additional SNA graphs. Once the 2015 and 2016 data were combined for the sake of parsimony, we calculated some basic descriptive statistics for each variable in order to get a sense of the networks overall (see Table 3).
Descriptive Statistics for Key Variables.
How Do Peer Networks Compare to Random Course Selection?
Upon conducting these social network analyses, the question arose as to how these networks compare to networks that would emerge from a random selection of classes, which could provide insight into whether students are purposefully choosing to take classes with known peers. To answer this question, we created department-level simulations that took into account the number of students in the major, the pathways through the major (courses students could take, including order of courses and timing), the range of math placements and initial science courses for the students, the average rates of students leaving the major under good or poor academic standing, and the availability of class seats at the time of registration. Details of the assumptions made in the model are presented in online Supplementary Appendix B.
We then randomly assigned students to course sections and repeated the SNA presented above to obtain the average number of connections, the average TRCs, and average MC for students in each major in the simulation. These Monte Carlo simulations were run 10,000 times for each major to account for natural variations in the random selections, with the results from each simulation averaged. As shown in Table 4, our model of random selection of classes generally yields significantly lower values for the TRCs and MC in each department, while the results for the number of connections were less consistent. This might imply the random selection of students roughly mixes students the same way as occurs naturally, but that students are making specific connections intentionally.
Actual Connections Compared to Simulated Connections.
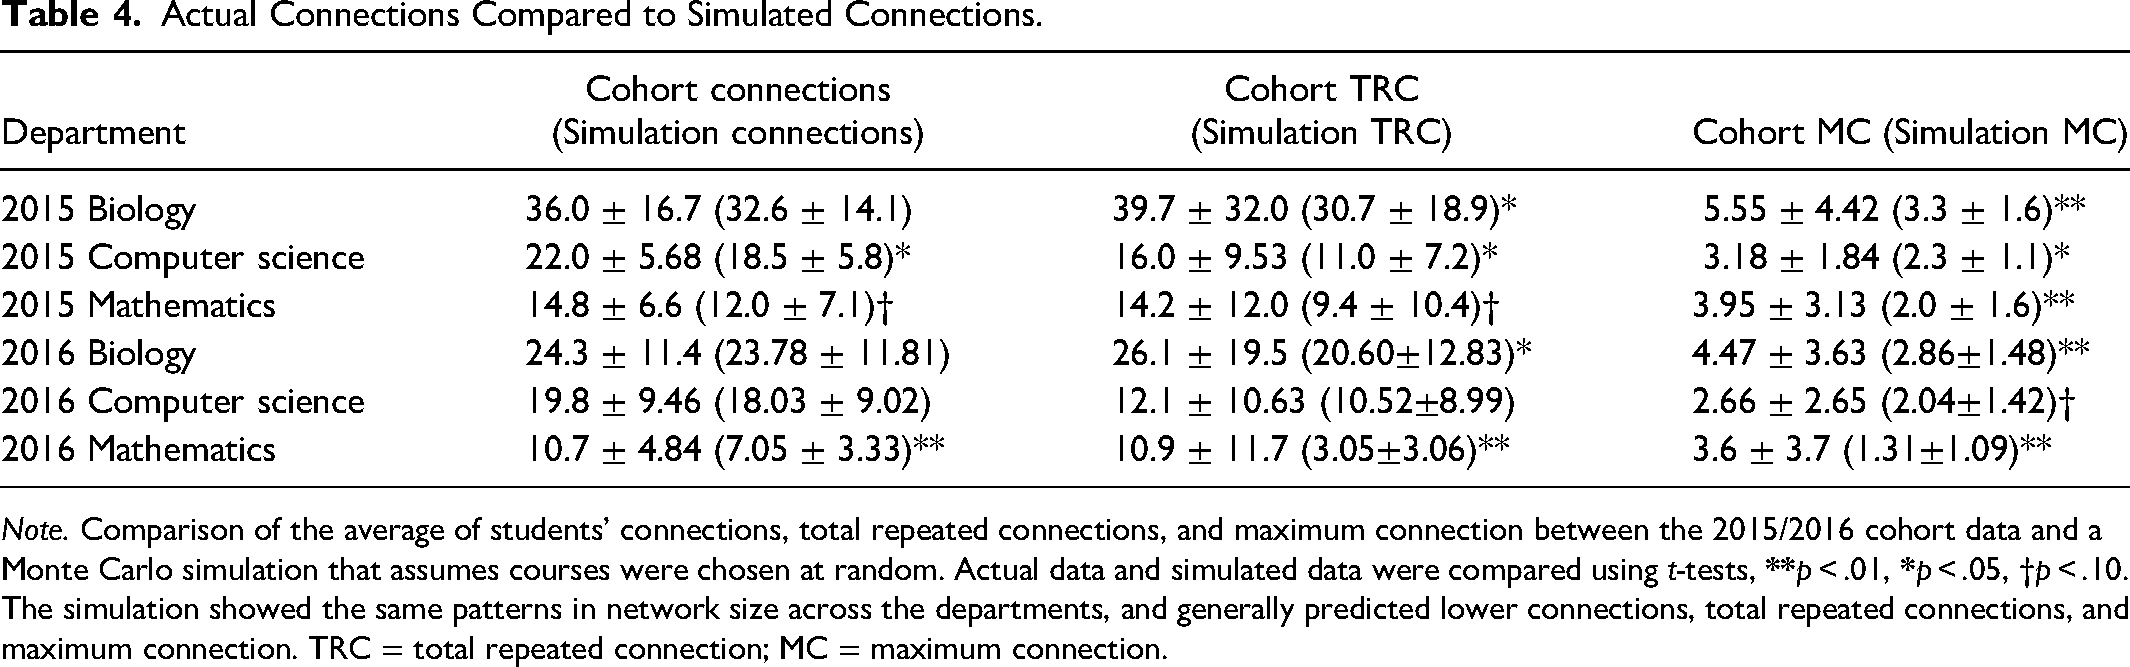
Note. Comparison of the average of students’ connections, total repeated connections, and maximum connection between the 2015/2016 cohort data and a Monte Carlo simulation that assumes courses were chosen at random. Actual data and simulated data were compared using t-tests,
How Do Peer Networks Vary by Race, Gender, First-Generation Status, and Commuter Status?
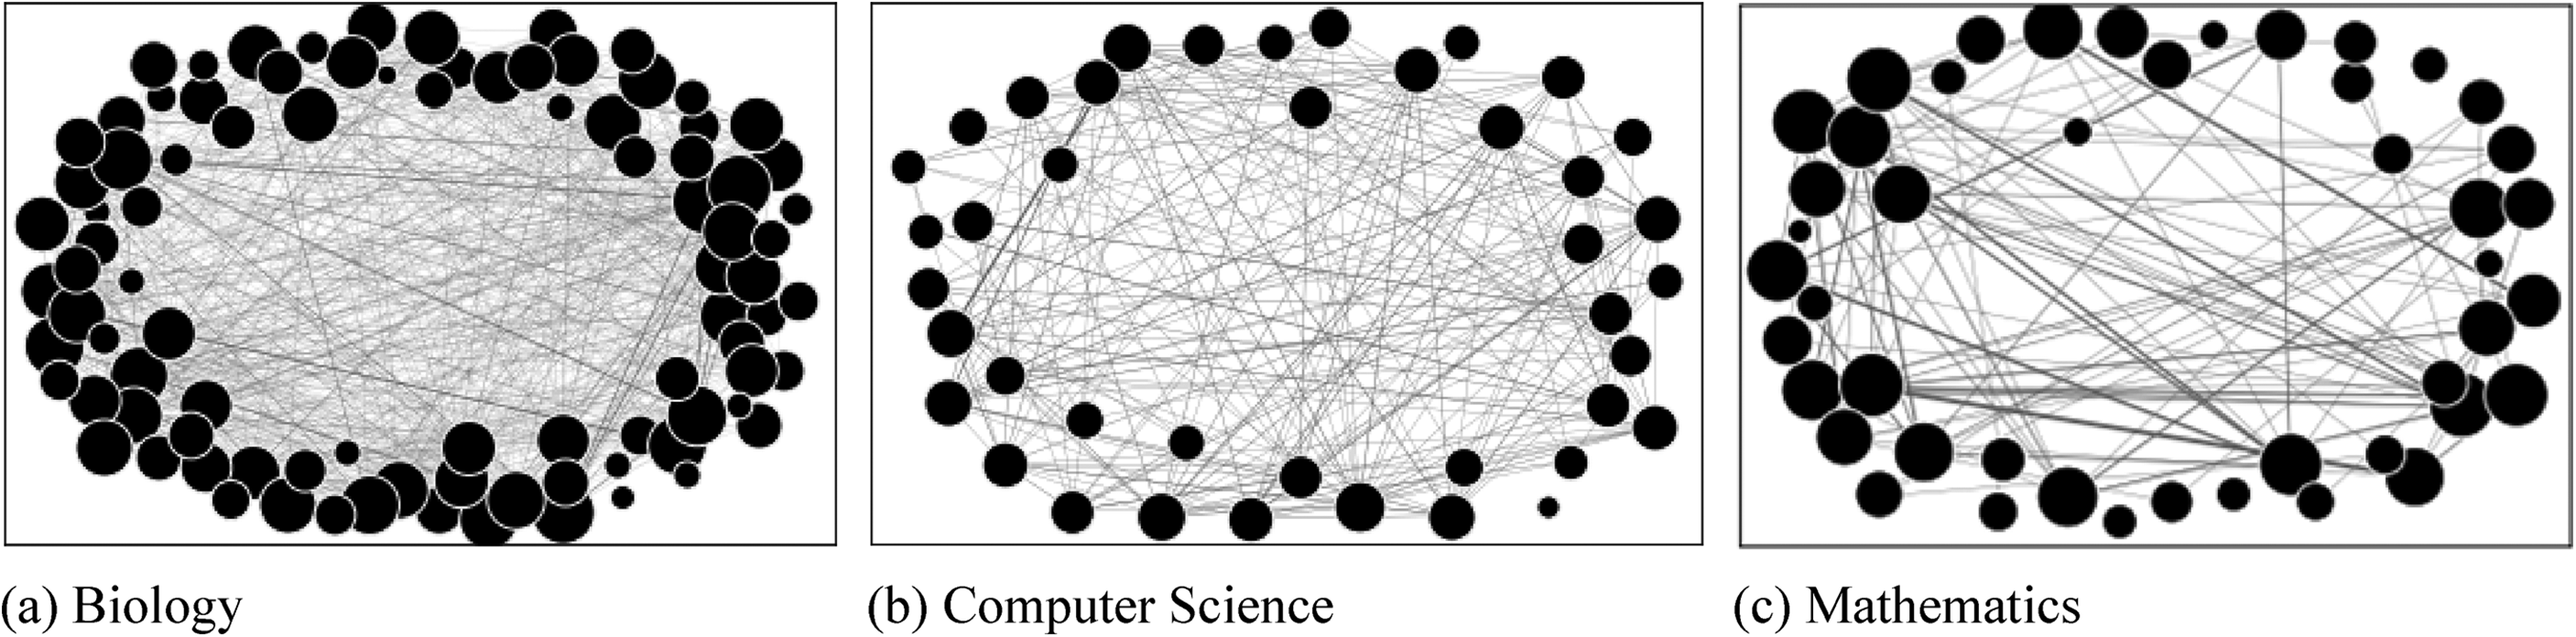
To visualize demographic differences in the peer networks, we depicted various demographic characteristics with different colors in the social network graphs. Examples from 2015 are shown in Figure 2 for race and gender. online Supplementary Appendix A contains similar graphs for commuter status, low-income status, and the 2016 data. These visualizations allow us to compare at a glance which group of students seem to have more connections.
We also used t-tests to assess whether the social network variables varied by demographic groups (race, gender, first-generation status, and commuter status). We found minimal differences; the complete analyses are presented in online Supplementary Appendix C. We also looked to see if students who are underrepresented in their major (i.e., women in computer science and students of color in mathematics) connected more often with similar underrepresented peers, but we found no evidence of that effect when examining the demographics of the MCs. Altogether, we concluded that meaningful differences among demographic groups are unlikely.
How Do a Student's Peer Connections in the First 2 Years Relate to Student Success Measures, Including Graduation Rate, STEM Graduation Rate, and GPA?
To test how the social network variables related to student success, we ran a series of regressions. Because a wealth of research has shown that demographics correlate with graduation rates and GPA, we included all of the demographic variables as covariates in each regression model. We could not include all of the social network variables in each regression analysis because of concerns of multicollinearity. Given the high correlation (r = 0.808) between the repeated connections and MC, we did not include TRC and MC in the same regression models. TC had comparatively lower correlations with the other social network variables; TC was moderately correlated with TRC (r = 0.510) and MC (r = 0.402). Therefore, for each success variable, we created two sets of models: One with TRCs and total connections (Models 1, 3, and 5), and another with MC and total connections (Models 2, 4, and 6).
Graduation Rates
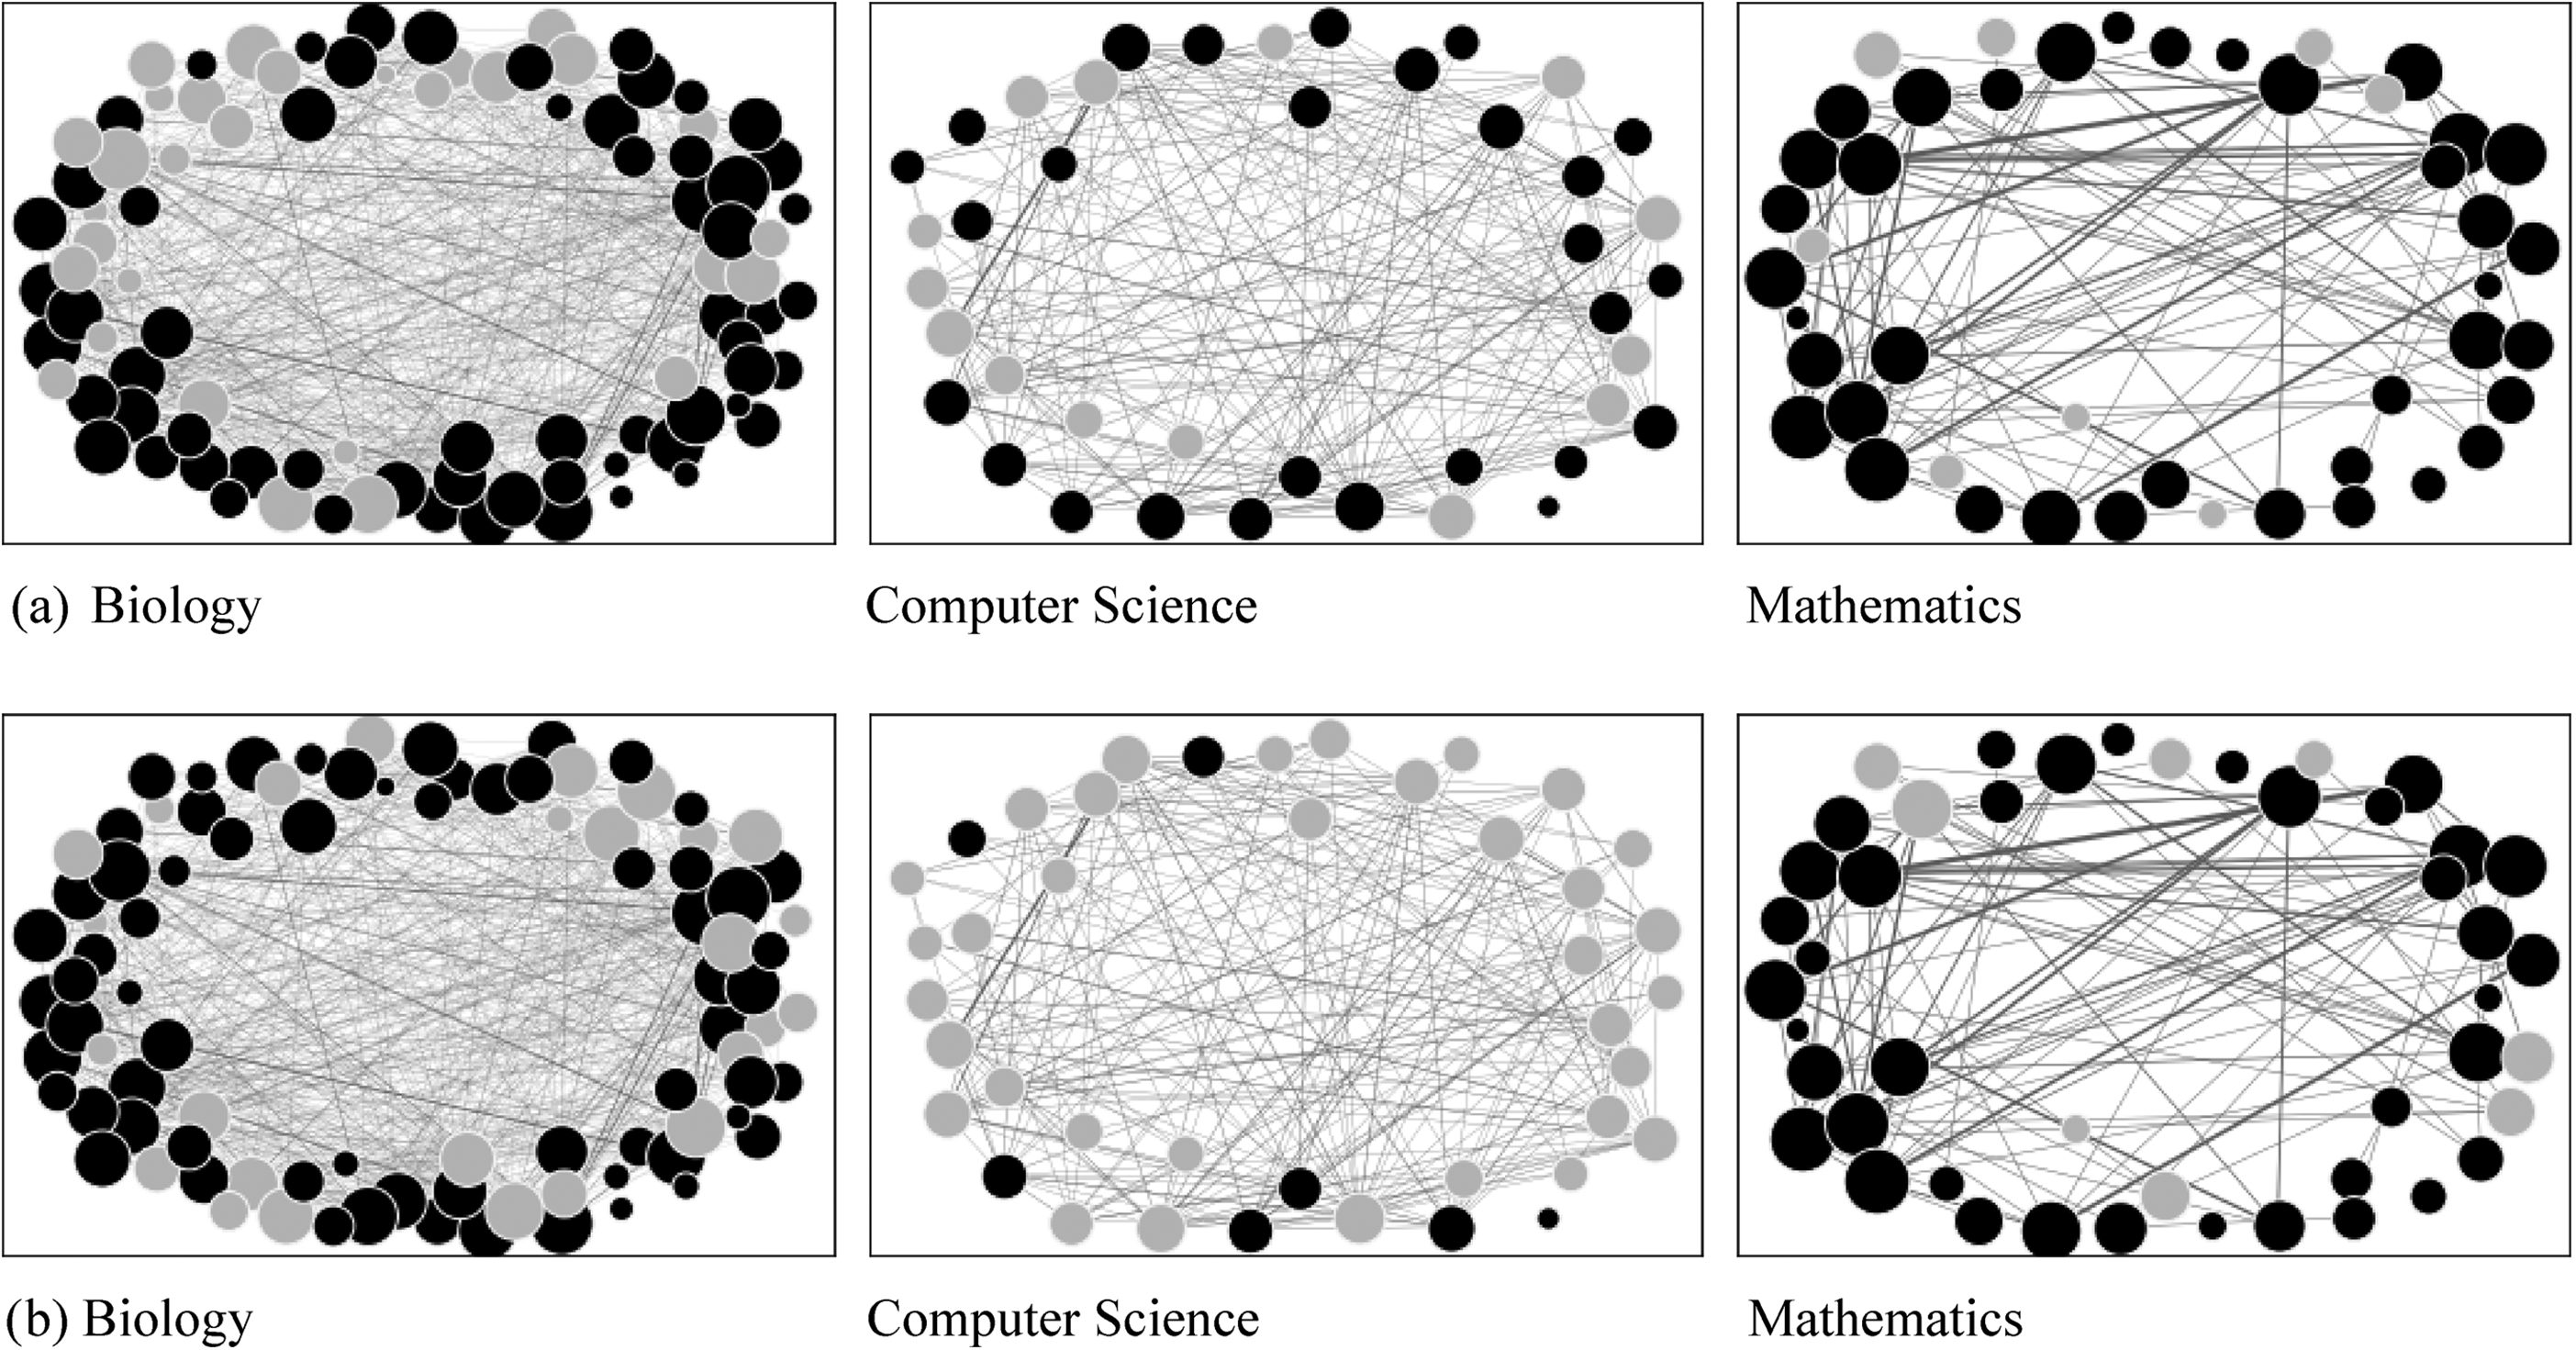
To analyze the relationship between peer networks and overall graduation rates (i.e., graduating with any degree), we conducted separate logistic regressions for Model 1 and Model 2 (see Table 5). Model 1 results showed that students with a higher number of TRCs and total connections were more likely to graduate. Specifically, given other variables fixed, on average, students with one larger standardized TRC are 1.70 times more likely to graduate. Students with one larger standardized total connection are 25 times more likely to graduate, all else being equal. Note that because the standardized total connection variable ranges from 0 to 1, this particular odds ratio is a comparison between students with the very lowest number of connections and those with the very highest, hence the greater magnitude of the odds ratio value (this caveat applies to all of the logistic regression models). Also, female and non-first-generation students are more likely to graduate than male and first-generation students, respectively.
Logistic Regression Analyses Predicting Overall Graduation.
TRC = total repeated connection; MC = maximum connection.
Model 2 results showed that students with a higher number of maximum repeated connections and total connections were more likely to graduate. More precisely, if other variables are held constant, on average, students with one larger standardized maximum repeated connection are 1.59 times more likely to graduate. Students with one larger standardized total connection are 48 times more likely to graduate, all else being equal. As in Model 1, female and non-first-generation students were more likely to graduate than male and first-generation students, but additionally, non-Pell-eligible students were more likely to graduate than Pell-eligible students. Figure 3 graphically represents how the social network and demographic variables relate to overall graduation rate.
Visualization of social network analysis for connectivity of 2015 students in first 2 years.
Visualization of social network analysis of 2015 students by race and gender. Note. In (a) gray circle = students of color, black circle = White; In (b) gray circle = men, black circle = women.
Graduation predicted by standardized repeated connections and standardized maximum connection.
STEM Graduation Rates
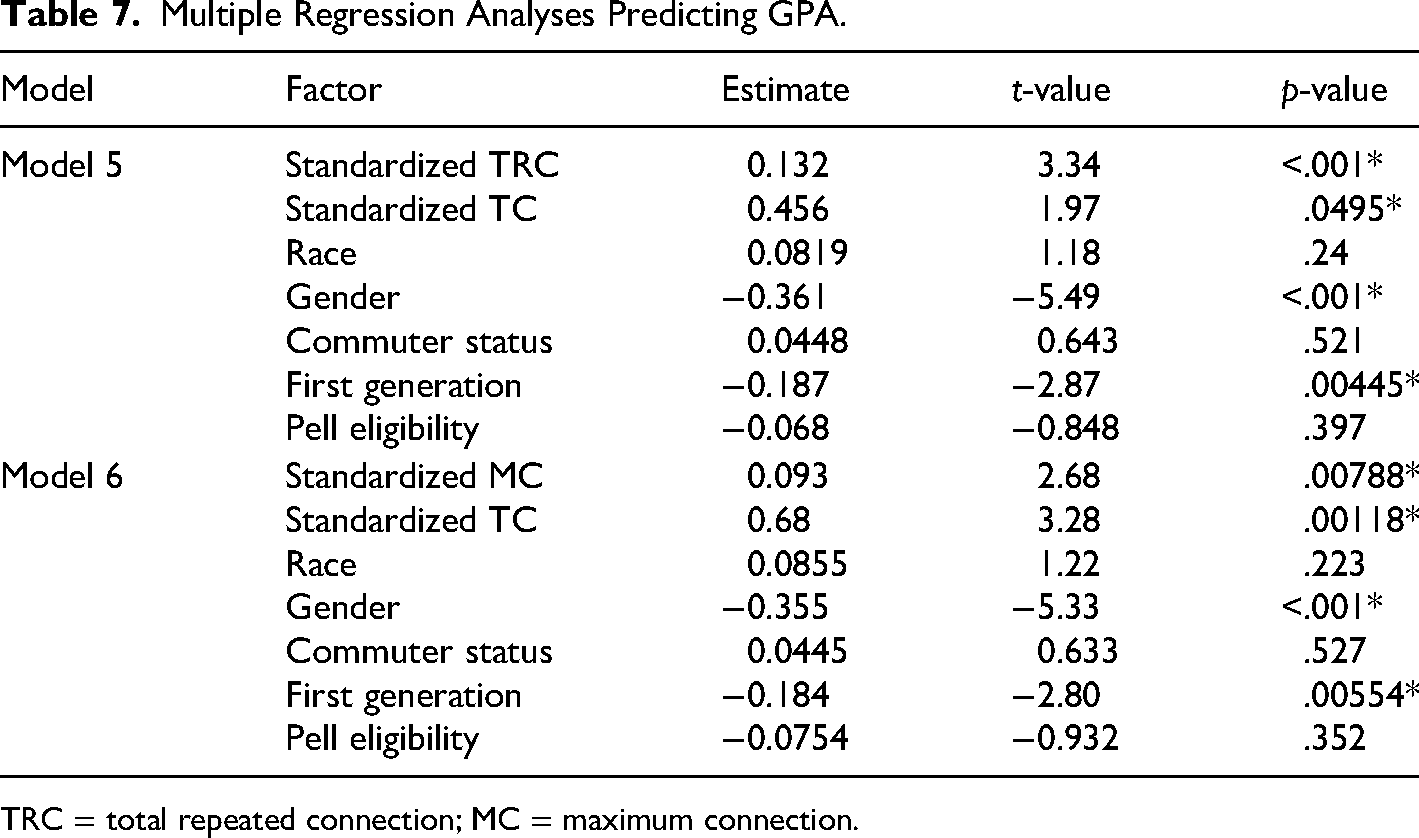
Next, we ran the same logistic regressions, but this time predicting STEM graduation rates (i.e., graduating with a major in STEM). See Table 6 for the results of Models 3 and 4. Model 3 results showed that students with a higher number of TRCs were more likely to graduate with a STEM degree, whereas the number of connections was not related to STEM graduation rates. More precisely, students with one bigger standardized repeated connection are 4.7 times more likely to graduate with a degree in STEM, if other variables are held constant. Also, commuter students are more likely to graduate with a STEM degree than residential students, while gender, race, and Pell eligibility were not related to STEM graduation rates. Model 4 results showed that students with a higher number of maximum repeated connections and total connections were more likely to graduate with a STEM degree. Specifically, given other variables fixed, on average, students with one larger standardized MC are 3.6 times more likely to graduate. As in Model 3, the only significant demographic variable was commuter status, with commuter students more likely to graduate with a STEM degree than residential students.
Logistic Regression Analyses Predicting STEM Graduation.
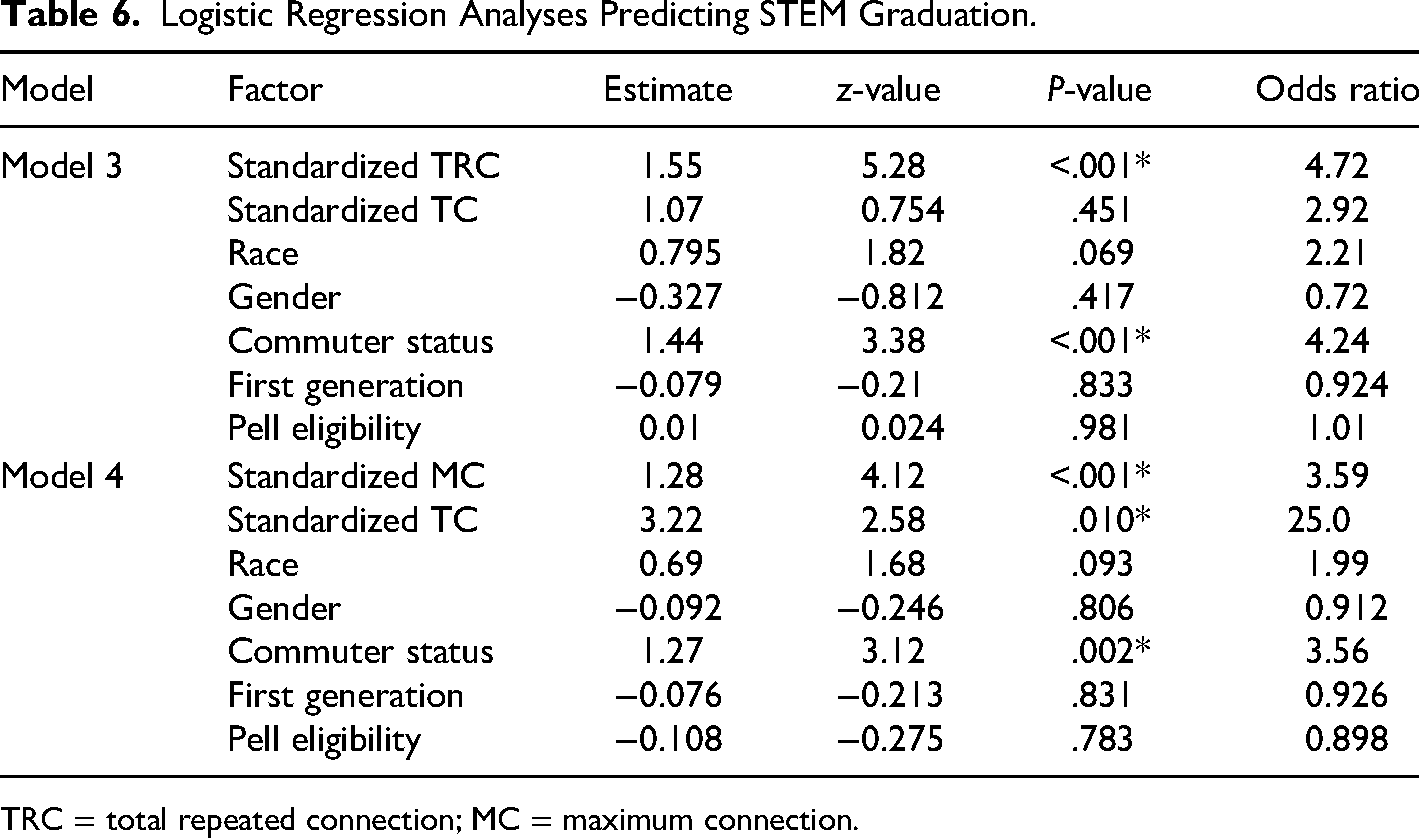
TRC = total repeated connection; MC = maximum connection.
Figure 4 displays the relationship between earning a STEM degree and the standardized social network variables. Because of the significance of students’ commuter status to STEM graduation, the lines for commuter and noncommuter students were added to the graphs. To attain an 80% STEM graduation rate utilizing the mean standardized total connections of 0.369, commuter students need to reach a standardized repeated connections of −0.05 and a standardized MC of 0.005. Conversely, residential students face significantly higher connection requirements, with 0.949 for the standardized repeated connections and 1.09 for the standardized MC. In other words, commuter students with the mean levels of TRC and MC are 80% likely to graduate, whereas residential students have to have one standard deviation above the mean for TRC and MC in order to reach the same graduation rate.
Graduating with a STEM degree predicted by standardized repeated connection and standardized maximum connection.
GPA
Finally, multiple regression analyses were conducted to predict students’ cumulative GPA. All the regression model assumptions were verified by a diagnostic check. See Table 7 for the detailed results of Models 5 and 6. Model 5 revealed that GPA was significantly predicted by more repeated connections and more total connections, and Model 6 revealed that GPA was significantly predicted by a higher maximum repeated connection and more total connections. Additionally, both models indicated that women's GPAs were 0.36 higher than men's, and first-generation students’ GPAs were 0.18 lower than that of the non-first-generation students. Figure 5 illustrates the modest but statistically significant linear relationship between GPA and standardized total connections, repeated connections, and MCs.
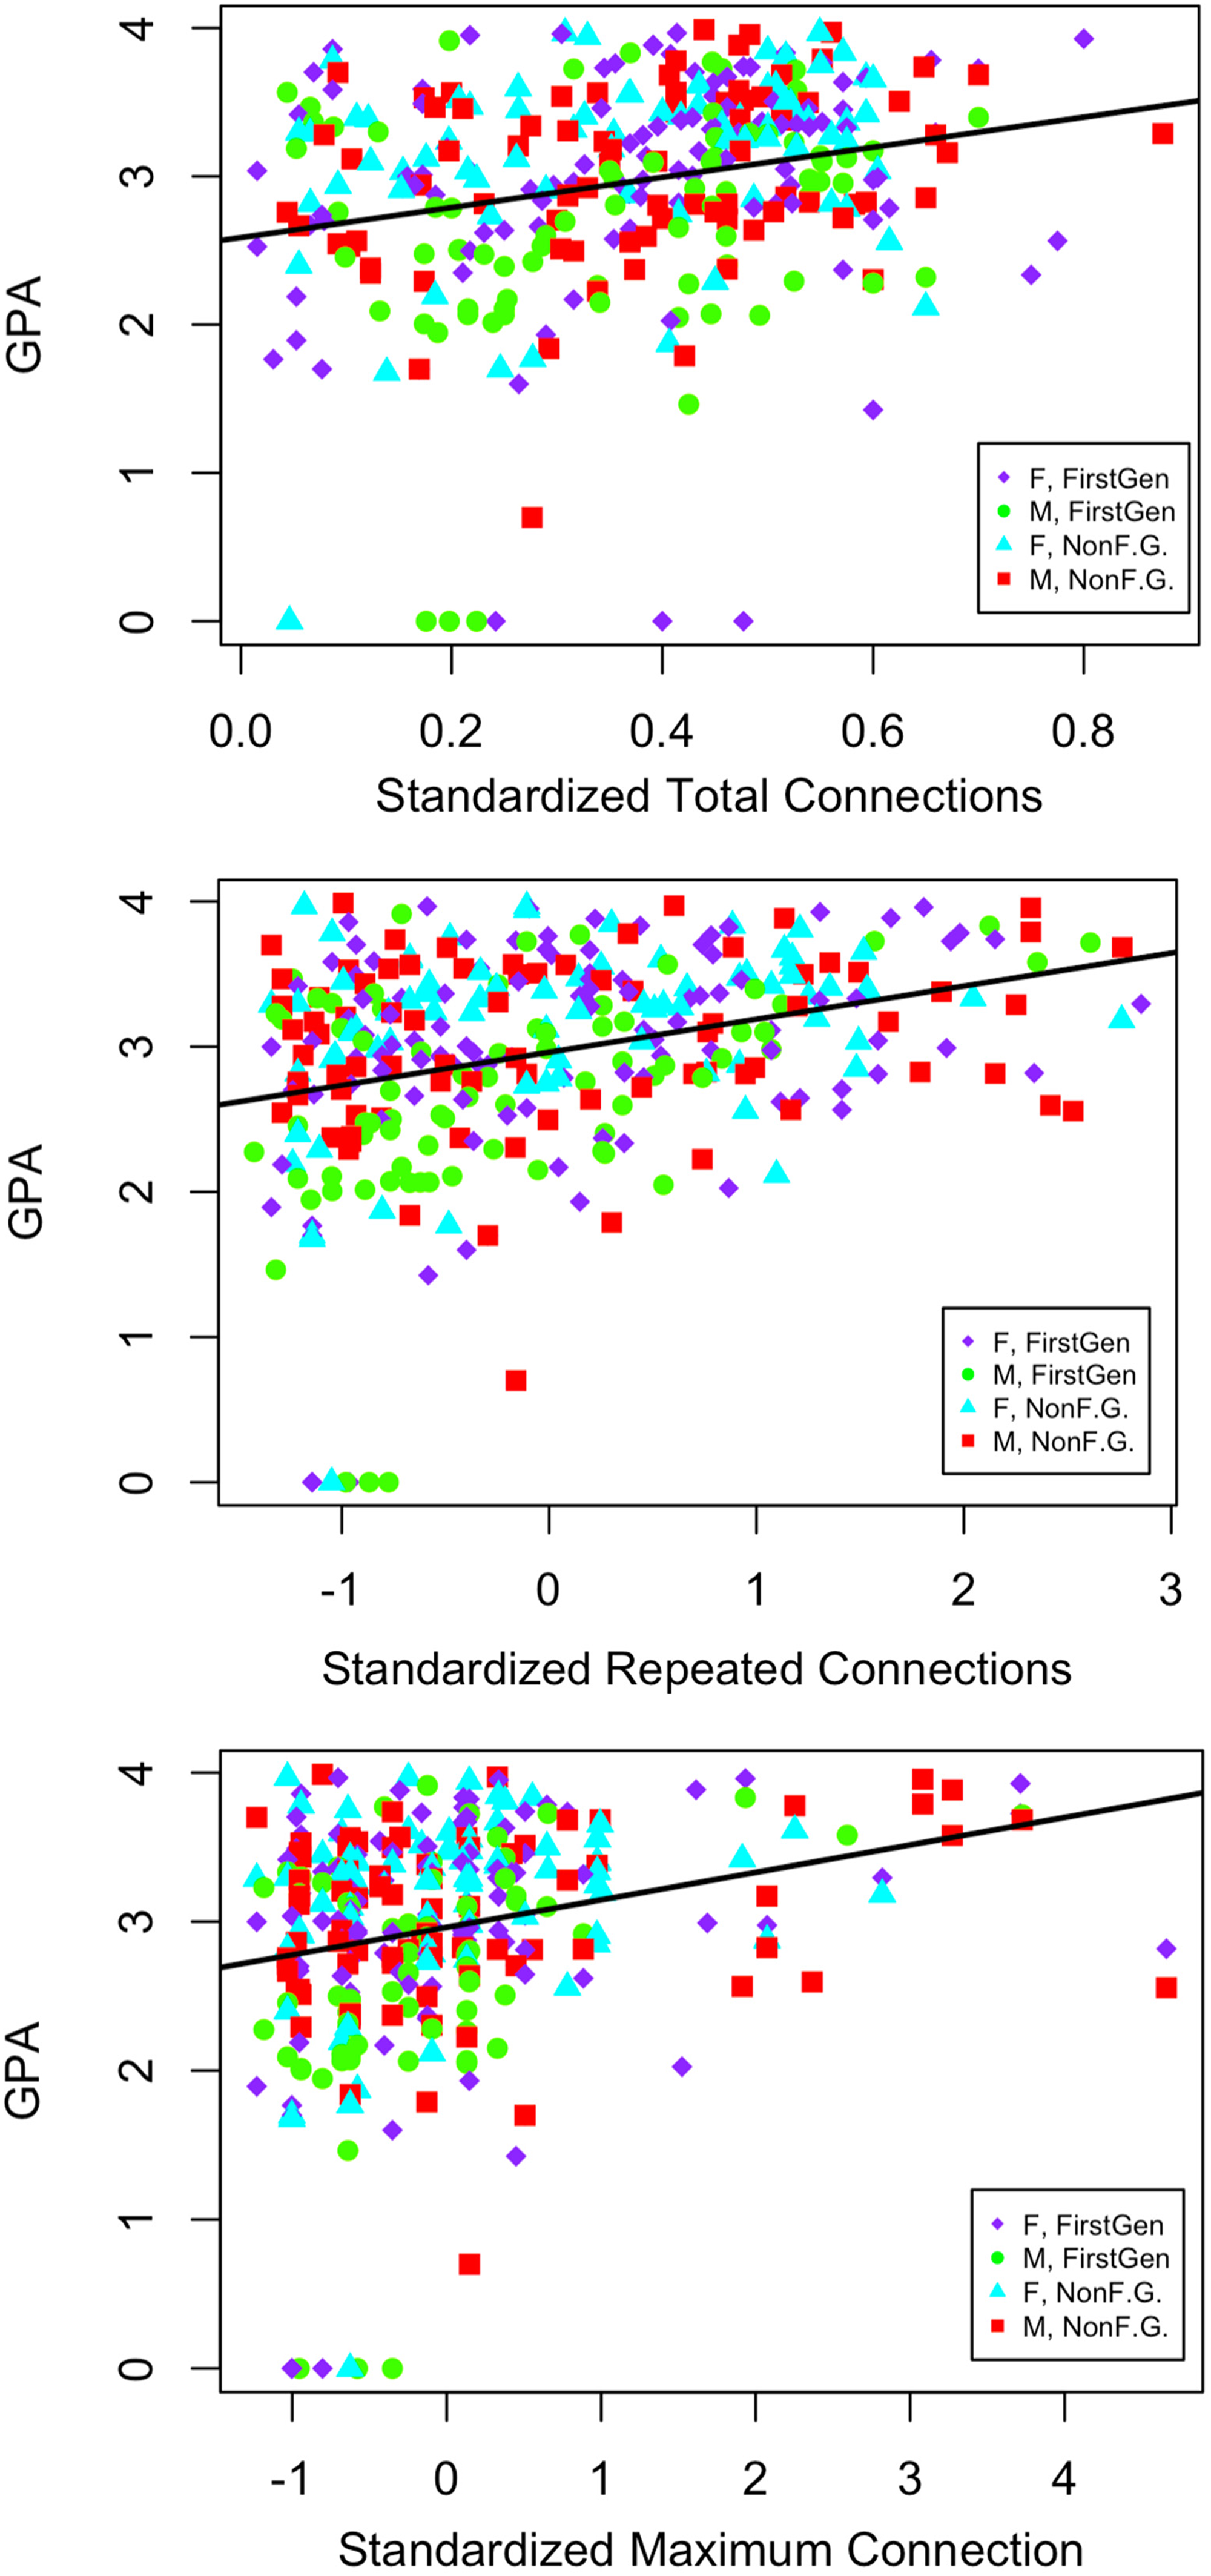
Linear relationship between cumulative GPA and standardized social network analysis (SNA) variables.
Multiple Regression Analyses Predicting GPA.
TRC = total repeated connection; MC = maximum connection.
Discussion
This project involved a SNA of institutional data for two cohorts of STEM students. By first conducting exploratory analyses with one cohort and then confirming those analyses with the second cohort, we were able to maximize the dataset while minimizing statistical errors. Broadly, we found that (1) there is wide variability in student networks in terms of the number of connections, repeated connections, and MC, (2) students make more repeated connections than a computer-generated random course selection would predict, (3) student networks do not vary much by demographic variables, and (4) more connections, more repeated connections, and a higher MC correlates with a higher GPA and increased likelihood of graduation.
This study is the first, to the best of our knowledge, to examine peer connections in the classroom using SNA. The wide variability in student networks indicates that SNA produces fruitful variables of interest to explore. Even more variability might emerge when examining these variables at a larger university. Interestingly, that variability cannot be explained by differences in gender, race, commuter status, or first-generation status, at least not in the present sample. The lack of demographic differences is surprising given previous literature that shows that peer connections are more critical for underrepresented groups (e.g., Rasco et al., 2023). Future research should continue to test for demographic differences in students’ social networks to see if they emerge in different majors or at different types of universities.
The comparison between computer-generated random course selection and students’ actual course selection revealed that students choose schedules with more repeated connections than random course selection would predict. This is true for both TRCs (i.e., taking multiple courses with lots of different peers) and the maximum repeated connection (i.e., the strongest connection in a student's network). One interpretation of this finding is that students connect with peers in their classes, and then purposefully take additional courses with those peers. Another possibility is that repeated connections occur due to some students favoring the same types of courses, perhaps those taught at a particular time or by a certain instructor, and thus some students end up in multiple courses together coincidentally. One could also imagine a scenario that combines these two interpretations, wherein a student coincidentally sees the same peer in multiple courses, providing multiple opportunities for them to connect, and then they eventually get to know each other and later purposefully choose courses together. While it is impossible to distinguish among these interpretations with the current dataset, future research could replicate and extend this study by adding qualitative data that directly ask students what role peers play in their course selection.
Our analysis also showed that students who were well-connected had greater student success, indicated by earning higher GPAs and graduation rates. Given that this is a correlational finding, there are three possible interpretations for this finding. First, it may be that peer connections cause student success, perhaps because students use those connections to stay up to date in their classes (e.g., share information when a peer is absent, etc.), form study groups, learn about resources, or gain a sense of belonging. This interpretation is consistent with previous literature that has shown that peer connections can have a positive impact on student success (e.g., Rasco et al., 2023; Turetsky et al., 2020). Second, it may be the case that success in college causes more peer connections to form. For example, perhaps more successful students attract peers who are especially invested in their education, forming groups of successful students who move through the curriculum together. This interpretation is consistent with previous research that shows the importance of similarity in forming friendships (e.g., Bahns et al., 2017). The third possible interpretation is that some other variable is causing both student connections and student success. We know that the third variable is not any of the demographic variables that we tested, but it could be something that we did not have in this dataset. For example, perhaps extroverted students are more likely to connect with peers, and they may also be more likely to speak up in class, thus getting the attention of instructors and more opportunities to learn and succeed.
With the current dataset, it is impossible to distinguish between these three interpretations, but future researchers could conduct experiments wherein they determine whether peer connections actually cause greater student success. For example, we were motivated to conduct the present study because we are currently running a randomized controlled trial of linked-learning communities, wherein we hypothesize that students in the communities will make stronger peer connections, which in turn will lead to greater student success. The SNA presented in this paper provides evidence that it is possible that peer connections cause student success, while our future work will be able to provide stronger evidence for that causal relationship.
One limitation of these findings is that the data is from a single university, but this study can serve as a blueprint for other universities that wish to utilize similar data to understand course registration patterns and how students move through the curriculum with their peers. Because we began with an exploratory approach, we learned many lessons along the way that would benefit other institutions replicating our analyses. For example, we figured out that we had to conduct analyses within each major rather than across all majors, since majors varied in how many linked courses they required (e.g., lectures with linked labs, etc.). Also, we started out conducting these analyses for every major in our College of Science and Math, but then realized that smaller majors couldn’t be fairly compared to larger departments, since they had fewer course sections and thus much more well-connected students. Larger universities may be able to examine smaller majors more successfully. We also figured out that we needed to focus on earlier connections (those made in the first 2 years of college) rather than connections across all 4 years if we wanted to predict graduation outcomes, given that students who drop out will inevitably have fewer connections because they will have taken fewer classes in their major. Other institutions may want to examine other social network variables, such as the eigendegree, which captures how well-connected one's peers are. This variable could be especially useful when looking at connections across different cohorts, where connections to an older peer mentor or senior research lab member who has more knowledge about the major and university could be especially meaningful for student success.
Altogether, these findings show that it is possible that connectedness within the curriculum may benefit students, though future research should systematically test the causal impact of peer connections on student success. Because this project has implications for the structural aspects of the university (e.g., registration processes, curriculum, how courses are structured to allow for peer interaction), it can contribute to student success efforts that recognize the role of the university in advantaging and disadvantaging certain kinds of students, rather than placing the full responsibility on students themselves. The present research may inspire other universities to examine their institutional data more thoroughly to better understand and influence students’ peer connections and student success.
Supplemental Material
sj-docx-1-csr-10.1177_15210251231215787 - Supplemental material for Classroom Connections: A Social Network Analysis of STEM Students at a Regional University
Supplemental material, sj-docx-1-csr-10.1177_15210251231215787 for Classroom Connections: A Social Network Analysis of STEM Students at a Regional University by Laura R. Ramsey, Wanchunzi Yu, Thomas Kling, and Audrey Kling in Journal of College Student Retention: Research, Theory & Practice
Footnotes
Declaration of Conflicting Interests
The author(s) declared no potential conflicts of interest with respect to the research, authorship, and/or publication of this article.
Funding
The author(s) disclosed receipt of the following financial support for the research, authorship, and/or publication of this article: This work was supported by the National Science Foundation's Division of Undergraduate Education (NSF-DUE 2020765).
Supplemental Material
Supplemental material for this article is available online.
Author Biographies
References
Supplementary Material
Please find the following supplemental material available below.
For Open Access articles published under a Creative Commons License, all supplemental material carries the same license as the article it is associated with.
For non-Open Access articles published, all supplemental material carries a non-exclusive license, and permission requests for re-use of supplemental material or any part of supplemental material shall be sent directly to the copyright owner as specified in the copyright notice associated with the article.