
Abstract
The Kalamazoo Promise (KPromise) is amongst the most well-known and generous tuition-free policies. This study advances the understanding of Promise student performance and persistence. We used a weighted-least square means and variance adjusted (WLSMV) SEM approach and k-nearest neighbors (k-NN) to deal with missing data. The main model suggested first-year college GPA (β = –.48) possessed the strongest effect on a first-year stop out followed by socioeconomic advantage (β = –.26), high school performance (β = –.25), immediate enrollment (β = –.22), and KPromise funding (β =.06). Model differences from 06–10 and 11–15 cohorts, illustrate that in the later cohorts socioeconomic advantage’s effect on a first-year stop out lessened.
Keywords
With college affordability a concern for many Americans, the debate over how to fund postsecondary education has pushed many institutions, local communities, states, and federal policymakers to embrace the development and implementation of tuition-free more strongly or Promise policies. Announced in 2005, the Kalamazoo Promise is one of the oldest and most generous Promise policies. Existing research has mostly focused on the impacts of KPromise on student behaviors in K-12 (Bartik & Lachowska, 2013), localized population impacts (Bartik & Sotherland, 2015), and changing patterns of college access (Bartik et al., 2019; Hershbein, 2015). However, recent studies have begun to examine college degree attainment (Bartik et al., 2019; Collier et al., 2020b; Collier & McMullen, 2020) and the experiences of KPromise students while in college (Collier et al., 2019). Newer studies focused on KPromise students’ stop out are limited – for example, may focus on a single 4-year institution (Collier et al., 2020b) or do not include a robust sample of stopped out students (Collier et al., 2019). While these studies may be a good first step towards understanding the factors that lead towards KPromise students (and by proxy potentially other Promise students) experiencing a stop out, more robust data and stronger analyses remain needed - particularly given the expansion of Promise scholarships, a convergence of trends amongst already cemented programs (see - Swanson & Ritter, 2020, p. 22), and recent critiques of Promise policies’ limitations and relative policy implications (see T. Jones & Berger, 2018).
Using data collected from the Kalamazoo Public Schools, combined with neighborhood features from the American Community Survey (U.S. Census Bureau, 2019) and student data from the National Student Clearinghouse Research Center (2019), this study used structural equation modeling (SEM) to answer the following questions:
What role does socioeconomic advantage play for Promise students in determining first-year stop out? How do grade and high school performance impact college performance and first-year stop-out? What is the impact of differing KPromise funding (which ranges from 65% to 100% of tuition and fees)? Do unique trends exist between the first five cohorts of KPromise students (06–10) to the next five (11–15)?
This study contributes to the literature in several ways. First, there remains limited published studies that have used SEM to examine effects on first-year retention (Bowman et al., 2019; Cabrera et al., 1993; Collier et al., 2020a; Sass et al., 2018). Furthermore, to our knowledge, incorporating pre-high school (in this case 3rd through 8th grade) performance in studies examining college enrollment, performance and persistence remains uncommon in the literature (Bui, 2005) and is essentially non-existent in studies using SEM– despite theorizations that middle-school performance may affect college enrollment and performance through high school performance (San Pedro et al., 2017). 1 Finally, this study contributes to the growing literature on tuition-free policies and the transition towards establishing trends across the various tuition-free policies (see Bartik et al., 2019; Swanson & Ritter, 2020) and our understanding of how adaptations to already cemented policies may produce stronger outcomes and guide newer (or future) tuition-free programs (Collier & McMullen, 2020).
Literature Review
The Promise Landscape
The U.S. has experienced a recent influx of interest in Promise policies across the U.S., with tabulations highlighting the increasing complexity of this landscape and suggesting that over 400 Promise programs currently exist (Perna & Leigh, 2019). This complexity is not just borne from the sheer number of established Promise programs but that these individual programs have unique and nonuniformed terms (Perna & Leigh, 2018). For example, some policies are more generous by applying the scholarship funds to tuition and fees before any grant or scholarship funds (known as first-dollar), whereas others assume the remaining tuition and fee-related costs after the grants and scholarships are applied (known as last-dollar). Additionally, Promise programs vary in the use of merit requirements, limits on years of funding, and enrollment in specific higher institutions or institutional types (e.g. Miller-Adams, 2015). The complexities of the Promise landscape make researching these policies difficult, as even strong studies may not be easily generalizable.
While published research remains extremely limited, especially beyond the scope of examining access and degree attainment (little remains known about what happens to students between those times), in some cases studies examining individual Promise policies have begun to converge on certain trends. For example, Bartik et al. (2019) found that KPromise increased overall access by 14% and increased bachelor’s degree attainment by 7%. Swanson and Ritter’s (2020) recent analysis found the El Dorado Promise (another universal, first-dollar policy) increased overall access by 14% and bachelor’s degree attainment by 9%. Page et al. (2019) found that the Pittsburgh Promise – which has more restrictive eligibility terms than KPromise and is last dollar – increased access by 5%. Additionally, the research on KPromise and El Dorado Promise has identified that these policies are beneficial for women (female) and underserved students (Bartik et al., 2019; Swanson & Ritter, 2020).
Given that trends may be converging around outcomes, studies that expand our understanding of what may affect Promise student performance and persistence – as well as how these effects change as Promises evolve – could be extraordinarily helpful to the research community, policymakers, and administrators intending to bolster outcomes. Moreover, as several scholars have recently called for other Promise policies to switch to a first-dollar model, like KPromise, to better serve disadvantaged students ( Jones & Berger, 2018), this study and others on the Kalamazoo Promise can be used as a point of comparison to identify how unique attributes across Promise policies may affect student performance and persistence.
The Kalamazoo Promise
The Kalamazoo Promise, announced in 2005, is the result of anonymous donors who aimed to produce an incentive that would improve the Kalamazoo Public School (KPS) system, bolster KPS students’ postsecondary enrollment and persistence, and lead to economic and community development (Miller-Adams, 2015). 2 The terms of the KPromise scholarship are intentionally simple and generous. The percentage of funding that students receive is based upon the time spent in the KPS district - high school graduates who resided within Kalamazoo and attended grades K-12 in the KPS district are awarded 100% of mandatory tuition and fees; whereas graduates who attended 9th-12th grades are awarded the lowest percentage of funding, 65% (The Kalamazoo Promise, 2019). KPromise is a first-dollar scholarship, meaning the funds are applied before students’ scholarships and grants, so that students may be able to use awards – like Pell – for other costs of college (e.g. books, rent, or food; Miller-Adams, 2015). To access funds, students must enroll in institutions in the State of Michigan – institutional choices include community colleges, 4-year public institutions, and a limited list of several private institutions like Kalamazoo College (The Kalamazoo Promise, 2019). To remain eligible, students must maintain an overall 2.0 college GPA, be enrolled in college full-time, 3 and must make progress towards certificate or degree completion. Finally, KPromise will fund up to 130-credits (a 4-year degree) and students can access the funds for up to 10-years post-high school graduation (The Kalamazoo Promise, 2019).
K-12
Highlighted by Bartik et al. (2010), KPromise produced an initial enrollment surge. The increases in KPS enrollments are largely attributed to KPromise influencing a reduction of out-migration (Bartik & Sotherland, 2015), and the scholarship may have also contributed to increased in-migration (Hershbein, 2013). Additionally, KPromise has been linked with stronger standardized testing scores in grades 3-8 (Bartik et al., 2010), a reduction of student behavioral issues, and possibly better high school performance (Bartik & Lachowska, 2013). Trends from MI School Data (2019) illustrate that from 2006 to 2017, the 4-year high school graduation rate climbed from 69% (21% drop out rate) to 75% (10% drop out rate). In the same time, the percentage of college-ready students increased from 12% to 19%.
Despite improving academic performance, the KPS district remains underperforming when compared to the State of Michigan as 3-8th grade test proficiency levels generally remain lower, the percentage of students deemed “college-ready” is less than the state average (19% v. 35%), and the 4-year high school graduation rate is 5% lower than the state average (75% v. 80%; MI School Data, 2019). In part, remaining behind state trends is likely explained by increased levels of economic disadvantage experienced by students within the KPS district. In KPS nearly 70% of students are considered economically disadvantaged as determined by the percentage of students eligible for free-and-reduced lunch (FRL), in comparison just 50% of students are FRL eligible in the State of Michigan. Importantly, the KPS district FRL percentage has increased from 63% of students in 2006 (MI School Data, 2019). Altogether, despite an increased share of socioeconomically disadvantaged students in KPS since 2006, positive trends in academic achievement are evident.
College Access
Undeniably KPromise has impacted the college-going rates of KPS students. According to data accessed from the W.E. Upjohn Institute’s (2019) Kalamazoo Promise data archives from 2006-2018, a total of 7,657 students have graduated from KPS – of these students, 90% have been eligible to access the KPromise funds, with 84% of eligible students using Promise funds. 4 At any time, 90% of students eligible to access KPromise funds have started college; while just 56% of ineligible students did so. 5 Furthermore, 82% of Promise eligible students started college within 12 months. Of Promise eligible students, 85% of White students have engaged the scholarship, as have high percentages of eligible Black (81%) and Hispanic/Latino students (80%; W.E. Upjohn Institute, 2019). KPromise has also assisted a higher percentage of economically disadvantaged students access college. Before KPromise, just 41% of FRL-eligible KPS students enrolled in college within 6-months (Hershbein, 2015); since the enaction of KPromise, 64% of FRL-eligible students have accessed the funds within 6 months of graduating high school – with 78% at any time (W.E. Upjohn Institute, 2019).
Beyond observational statistics, difference-in-difference analyses illustrated that KPromise has increased the likelihood of KPS students’ enrollment in any postsecondary institution within 6-months of high school graduation by 14-percent and enrollment in a 4-year institution by 23-percent (Bartik et al., 2019). Most KPromise scholars enroll in two local institutions, Kalamazoo Valley Community College (KVCC) and Western Michigan University (WMU). In total, KVCC has enrolled 43% of KPromise enrollments while WMU has enrolled 32%. 6 Other institutions of notable enrollment levels include Michigan State University (8%) and the University of Michigan (4%; W.E. Upjohn Institute, 2019).
College Performance and Persistence
Per performance and persistence (and access), Bartik et al. (2019) found that KPromise has been particularly helpful for women and less advantaged students. McMullen et al.’s (2020) recent differences-in-difference analysis indicated that despite widening access for less socioeconomically advantaged students, from pre-to-post KPromise implementation first-year stop-out decreased by 18%. This outcome seems reflected in a recent descriptive analysis illustrating that 78% of KPromise students are retained from the first to second year which is observably higher than national trends (62%). KPromise students also outperformed institutional trends as those enrolled in KVCC are retained from the first to second year at 57% (the institutional trend is 48%) and WMU at 88% (the institutional trend is 78%; Collier & McMullen, 2020). Whereas these statistics are encouraging, identifying the influences of stop out could help an increased share of students avoid this experience. For KPromise, avoiding a stop out should produce a higher percentage of students earning degrees and in less time. For other programs with less flexibility and “one and done” features – meaning upon stop out the opportunity to access promise funds is shut off (such as the Tennessee Promise) – identifying the influences of stop out and mitigating this experience is more critically important.
The available research suggests that KPromise student collegiate performance and persistence is linked with prior academic performance and socioeconomic advantage. Specifically, high school GPA is strongly correlated with collegiate performance and is explicitly tied with experiencing a stop-out, as is socioeconomic advantage (Collier et al., 2020b; Collier & McMullen, 2020). Collier et al.’s (2019) study also shows connections between KPromise students' socioeconomic disadvantage, measured by basic needs, and stopping out. Overall, the emergent but limited body of research on Promise students’ college performance and persistence connects socioeconomic advantage and prior performance to college outcomes.
Conceptual Structure
Given the lack of studies using SEM on student stop out, we have chosen to develop a model structure that borrows from the existing literature – including prior studies using SEM to model first-year stop out (Bowman et al., 2019; Cabrera et al., 1993; Collier et al., 2020a; Sass et al., 2018). First, there are long-standing connections between various indicators of socioeconomic advantage and K-12 performance (K. Jones et al., 2018; Yi et al., 2017) and college performance and persistence (Cabrera et al., 1993; Collier et al., 2020a). Together these trends highlight the need to examine the direct effects of socioeconomic advantage on the various levels of academic performance – in this case, pre-high school performance, high school performance, and first-year college performance – as well as indirect effects through prior performance (e.g. through pre-high school performance to high school performance). Socioeconomic advantages are usually connected to enrollment patterns (Belasco & Trivette, 2015) and college persistence (Bowman et al., 2019; Collier et al., 2020a), justifying our linkages from socioeconomic advantage to immediate college enrollment, first-year college GPA, and stopping out.
Although influenced by socioeconomic advantage, research has also highlighted that prior academic performance holds relationships with future performance (Bowman et al., 2019; Collier et al., 2020a; Johnson et al., 2020; McKee & Caldarella, 2015). As prior performance is correlated to and found to influence future performance, testing direct connections from prior performance to the next level (e.g. pre-high school performance to high school performance) is defensible. The temporal sequencing of pre-high school performance does not allow us to generate a direct connection to college-related behavior or high school performance to a stop out. However, direct pathways can be linked from high school performance to immediate college enrollment and first-year college GPA, allowing us to test for indirect effects of pre-high school performance on these outcomes as theorized by Bui (2005) and San Pedro et al. (2017). Finally, based upon the descriptive analysis of Collier and McMullen (2020) enrolling in college 6-months from high school graduation was directly correlated to a first-year stop out – see Figure 1.
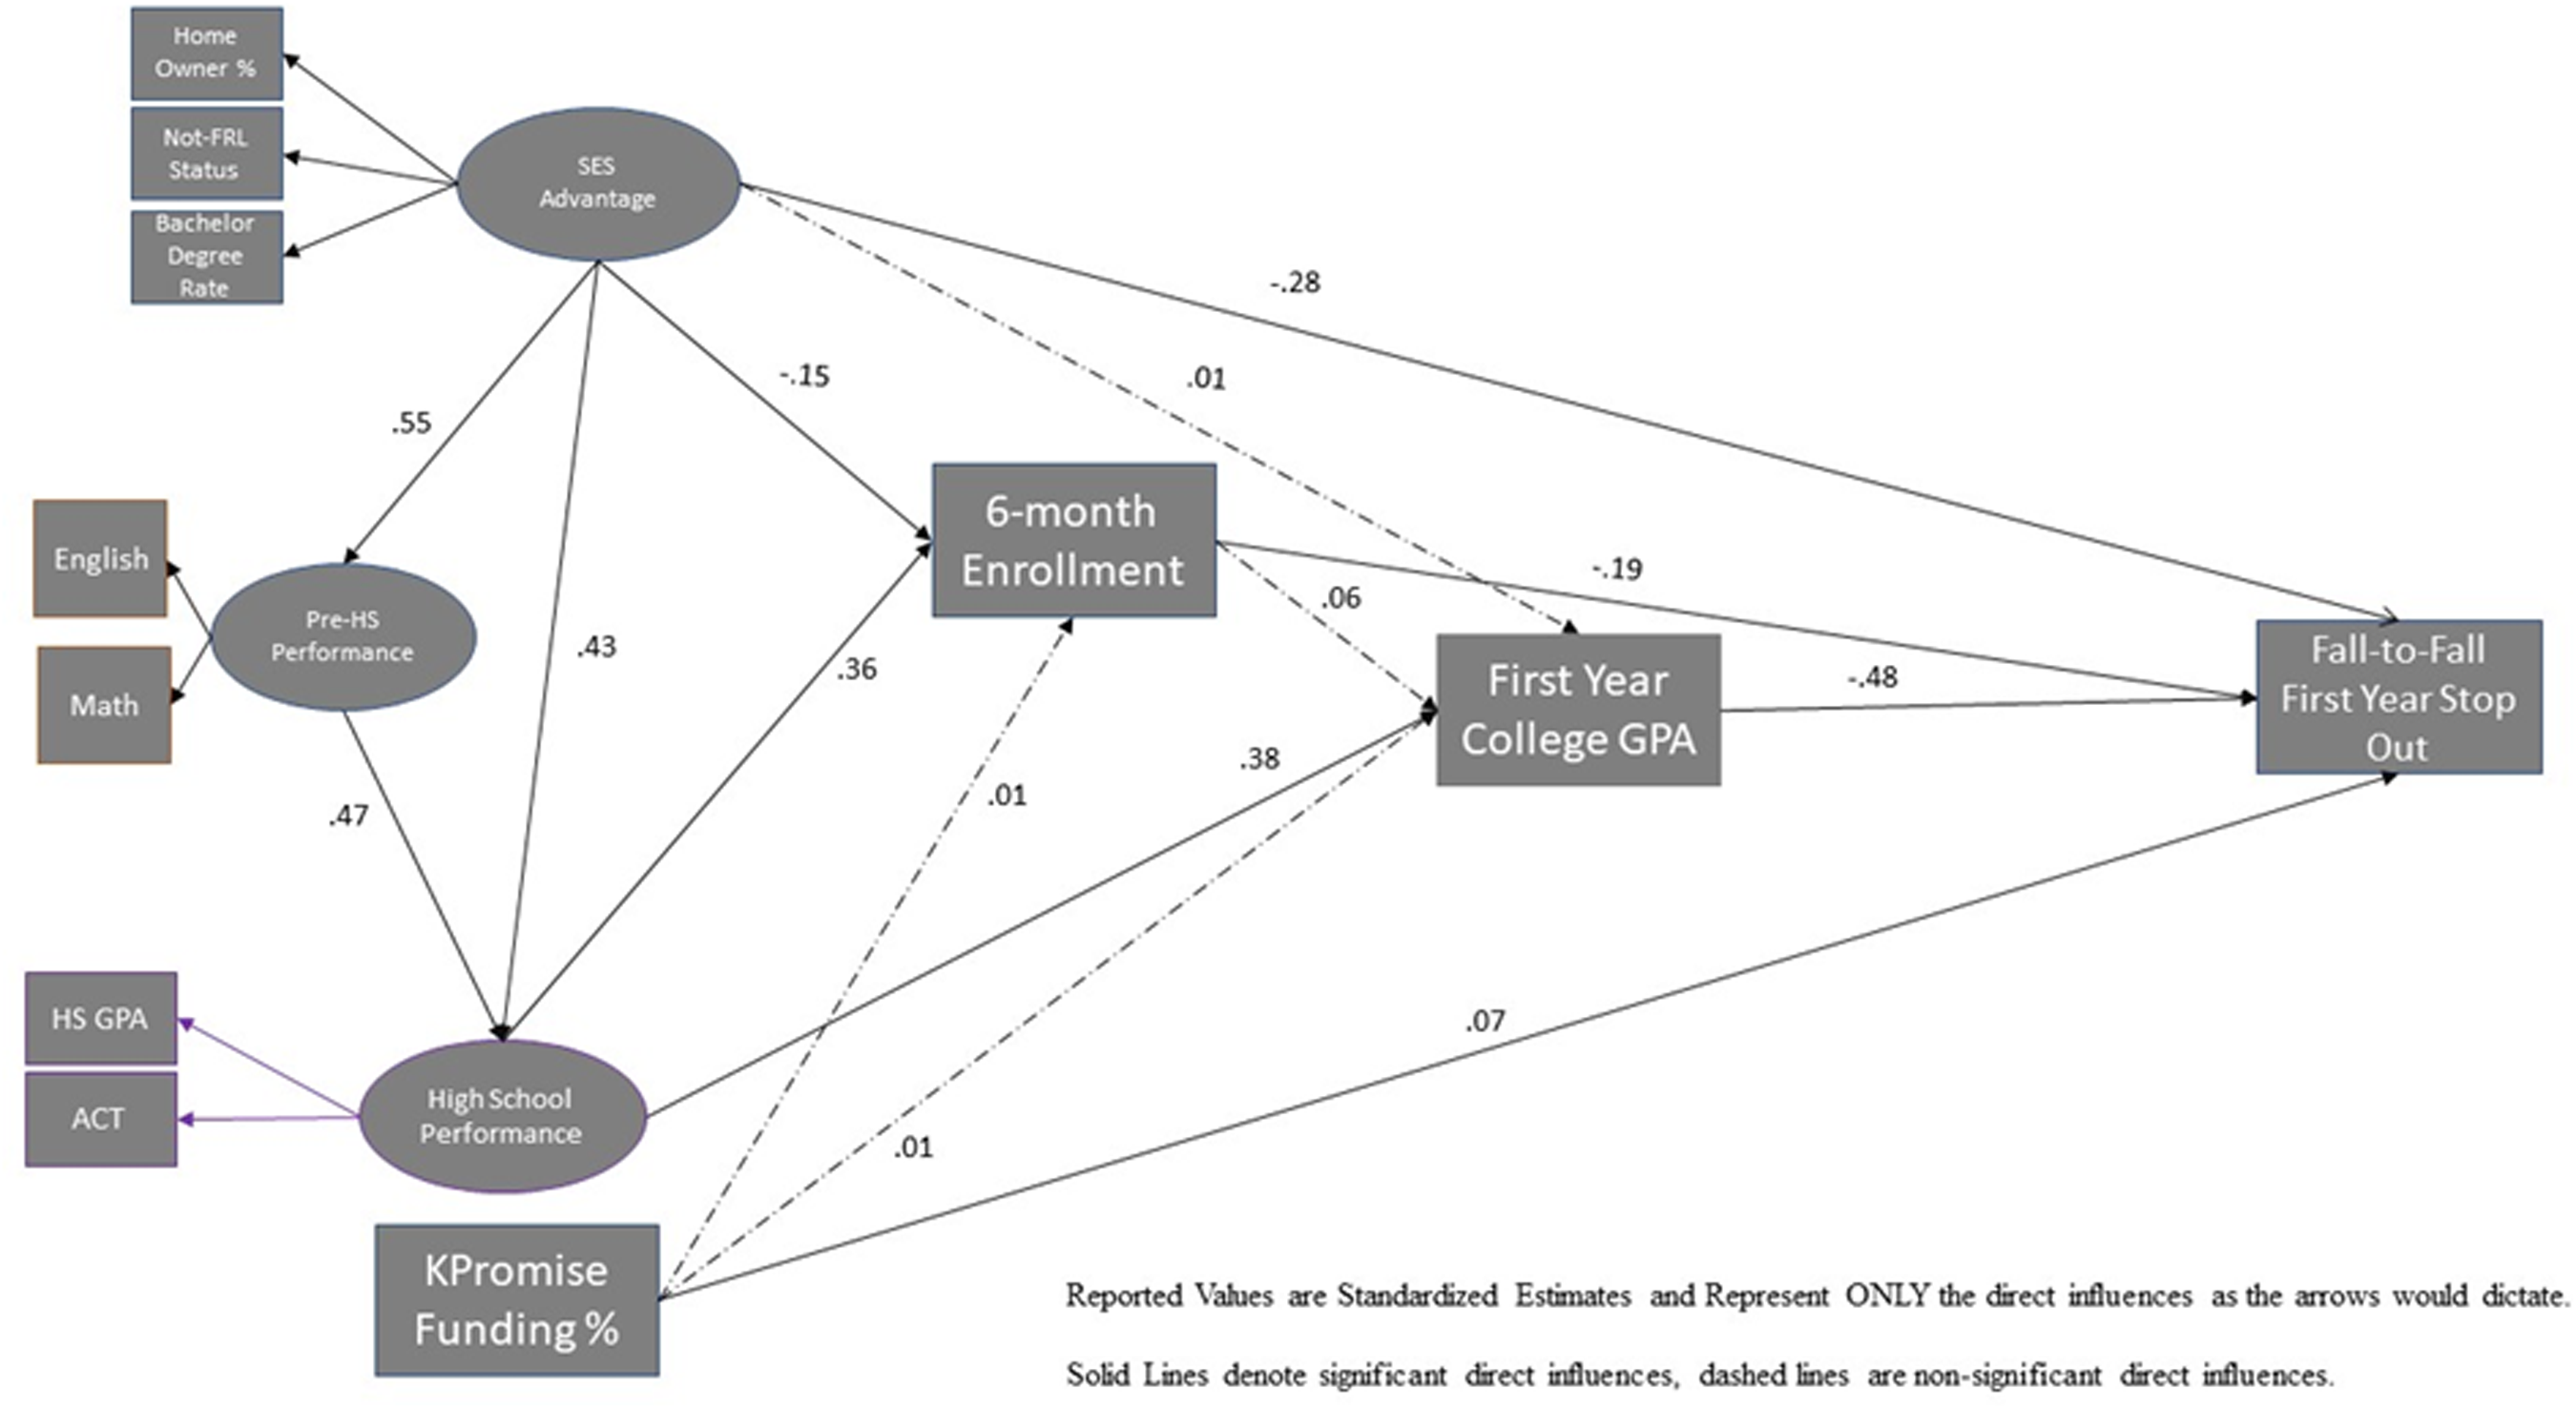
Accepted Model Stucture of Kalamazoo Promise First-Year Stop Out.
Methodology
Database and Observed Variables
The database is generated from data-sharing agreements with the Kalamazoo Public Schools district and The Kalamazoo Promise – which provides data to the Upjohn Institute from the National Student Clearinghouse Research Center (2019). This study includes students’ observed: (1) KPromise funding percentage (65%-100%), (2) 3-8th grade Math and English test scores, (3) free-and-reduced lunch status in high school, (4) high school GPA, (5) ACT composite score, (6) and permanent residency zip code. To supplement elements of students’ overall socioeconomic advantages, homeownership percentages, and rates of bachelor’s degree attainment of students’ last reported permanent residency census tracts from the 2017 five-year estimates of the American Community Survey (U.S. Census Bureau, 2019) were joined to the individual profiles.
Sample
The sample for this study included all Kalamazoo Promise students from the 2006-2017 cohorts who enrolled in college and accessed KPromise funds (N=5,642). Of the sample, most students graduated from either Loy Norrix High School (40%) or Kalamazoo Central High School (50%) – followed by other non-traditional schools like Phoenix High School (7%) and a collapsed group of non-traditional high school programs that KPS offers including a GED (3%). The sample leaned female (53%) and White (46%); however, a large percentage were Black/African-American (42%) – followed by Hispanic/Latino(a) (8%) and Asian American/Pacific Islander (3%). Students who qualified for free-and-reduced lunch in high school were identified and consisted of 53% of the sample.
For pre-high school performance, we used the Michigan Educational Assessment Program (MEAP) English Language Arts (ELA) and Math scores. MEAP tests were administered to grades 3 through 8 from the academic year 2005-2006 to 2012-2013. To appropriately interpret the MEAP scores, and account for any changes in test scaling or scoring across years, we standardized the available scores to the grade-subject level, across all available years. To do this, the scores were grouped by grade-subject-year and we calculated the mean and standard deviation of each of those groups. Next, z-scores were calculated for each student’s score using the formula: (student score – mean of the group)/(standard deviation of the group). Once each student score had a z-score relevant to the group in which it belonged, means of z-scores were generated by the original groups, and the mean of those means, by grade and subject. This final score, the pooled z-scores by grade and subject across all years, was then mapped on to the corresponding standardized scores from the Stanford Education Data Archive (SEDA), a collection of geographic school district achievement estimates (Reardon et al., 2016). The difference between the SEDA score and the observed pooled z-scores was established as a constant, which was in turn added to each student score. The tabulated mean pre-high school English score was .08 and the math score was .01.
The mean high school GPA was 2.65 and the composite ACT score was 19.04. 7 Most students enrolled in college within 6-months of high school graduation (82%), and the average first-year college GPA was 2.09. Forty-six percent of students first enrolled in Kalamazoo Valley Community College – followed by Western Michigan University (22%), Michigan State University (8%), and the University of Michigan (4%). Nearly a quarter of students stopped out during their first year of college. KPromise students’ residencies may be situated within fifteen neighborhood census tracts; the average matched census tract bachelor’s degree rate was M = .17 and the homeownership rate was M = .51.
Missing Data
We dealt with missing data using a k-Nearest Neighbor (k-NN) method. 8 The k-NN method identifies the nearest neighbors of profiles with missing data based on attributes chosen by researchers. Nearest neighbors were identified by the following characteristics: high school or degree program (e.g. GED), ever being a free-and-reduced lunch student in high school, gender, and ethnicity. Data were missing and therefore imputed within the neighborhood bachelor’s degree and homeownership rates, ACT comprehensive scores, high school GPA, and pre-high school performance measurements. Using assigned variables, this technique measures the Euclidian distance between profiles to identify the “nearest” profiles to cluster together. After the nearest neighbors were identified we could identify characteristics of these groups – for example, mean high school GPA – and then impute data into profiles possessing missing information. The k-NN method is particularly useful because the imputed values maintain the structure of the original dataset, and the method is non-parametric and therefore less likely to mis-specify models (Beretta & Santaniello, 2016).
The number of nearest neighbors (k) to cluster is programed by researchers – in this case, k = 75, which is the square root of the sample size and common practice in deciding k (Hassanat et al., 2014; Lantz, 2015). When k is set too low, finding nearest neighbors becomes restricted and mis-specifies the data; whereas, when k is set too high the data is over-smoothed and may result in being overfitted (reducing variance). Methodologists suggest running several models with k at unique settings to fine-tune the algorithm and to explore whether and how outcomes may change (Hassanat et al., 2014). We generated two additional models with settings at k = 25 and k = 51 - models over k = 75 were not created due to potential over-smoothing. 9 Given most trends remained the same, we reported the model of k = 75, as this model is generated from methodologically backed expectations (Lantz, 2015). Moreover, the k = 75 models produced overall better-combined goodness and badness of fit, explicitly related to the SRMR badness-of-fit statistic (see Appendix Table A2 for the k = 25 and k = 51 models). 10
Structural Equation Modeling
Structural Equation Modeling (SEM) is a technique used to examine the effect of one variable on another and any indirect influences from one variable through another (Klem, 2000). SEM is gaining in popularity within the social sciences; however, studies utilizing SEM are limited in higher education journals and almost none explicitly examine the outcome of student persistence (see Bowman et al., 2019; Collier et al., 2020a). To use SEM, Kline (2012) highlighted several assumptions that should be met. First, we attended to temporal sequencing. Consistent with Bowman et al. (2019) and Collier et al. (2020a), the intended outcome of first-year stop-out occurred after all other observed information. Furthermore, college-related variables occurred after high school performance and pre-high school performance before high school performance – following the usual sequencing of education performance. The free-and-reduced lunch variable was generated while students were in high school and could violate sequencing for pre-high school performance. However, given the general relative stability of family socioeconomic advantages and that we generated a latent variable including residency census tract homeownership rates and bachelor’s degree percentage rates, this free-and-reduced lunch measurement should remain a suitable observed proxy for financial and academic advantage (see Domina et al., 2018) for pre-high school performance. This sequencing also establishes the direction relationships examined.
Second, observed variables in the model should be statistically related to the outcome. A generated correlation matrix found significant relationships between all the observed variables and first-year stop-out. One variable violated this expectation, the percentage of KPromise funding – see Appendix Table A3. However, we kept the variable in this model to test hypotheses related to the percentage of funding (see question 3). As highlighted further on, the model fits remained acceptable when this variable was included.
Third, the method used must align with the outcome data. Because the primary outcome is binary in that either students had stopped out or not, we used a weighted-least square means and variance adjusted approach (WLSMV), as used in recent studies (see Bowman et al., 2019; Collier et al., 2020a). For binary outcomes, the WLSMV is a better approach than a Maximum Likelihood; as the WLSMV produces more accurate factor loadings, inter-factor correlations, and structural coefficient estimates (DiStefano & Morgan, 2014; Li, 2016).
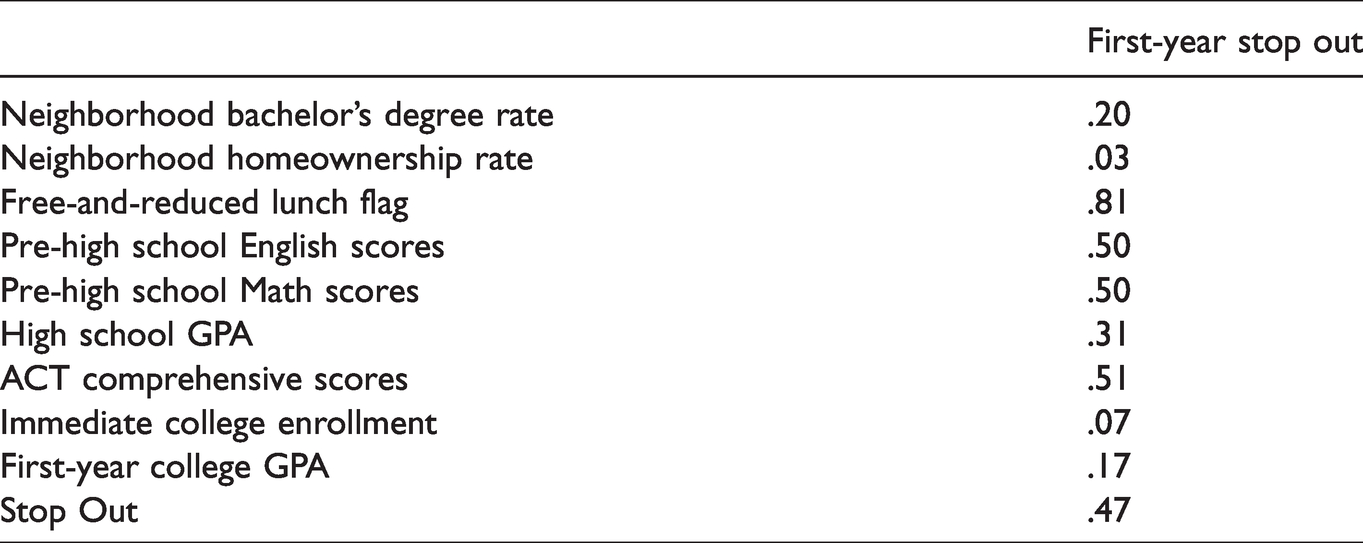
In SEM, variables can be observed or latent – meaning a variable that is unmeasured or unobserved. Before generating these latent variables, we conducted exploratory factor analyses (EFA) to test whether observed variables could be clustered together and predicted by the latent variable. EFA tests are used when researchers do not have an explicit hypothesis on the grouping of variables (Yong & Pearce, 2013). The EFA test was also chosen because CFA tests require at least three variables to confirm groupings and the EFA requires only two variables – given that some of our latent variables consist of only two variables, this is the correct test based on our data. To be noted, EFA would require the two observed variables that are predicted by the latent variable to be highly correlated with each other (Yong & Pearce, 2013). The EFA indicated that students’ high school FRL status and neighborhood bachelor’s degree and homeownership rates can be predicted by the latent variable we labeled as Socioeconomic Advantage, pre-high school English and math test scores can be predicted by Pre-High School Performance, and high school GPA and ACT scores can be predicted by High School Performance. When creating the socioeconomic advantage latent variable, we recoded the observed measurement of ever being an FRL-student to never being an FRL student – for ease of interpretation and to keep all measurements examining advantage, not disadvantage or a mixture of. Observed variables’ R2 values are reported in Table 1 – the R2 reports the fraction of variance explained by each observed variable.
Observable Variable R2 – k=75 Models.
We used the JASP freeware which includes the Lavaan module that is also commonly used for SEM in R. Reported values are robust standardized coefficients (β). Standardized coefficients report relative “size” of influence on the mean of the examined variable, allowing for comparisons by converting all variables to a mean of 0 and measuring the impact of a standard deviation (Kwan & Chan, 2011). For example, in the first-year stop-out model, pre-high school performance has a direct influence of β = .47 on high school performance; whereas socioeconomic advantage has a direct influence of β = .43 on high school performance. On a standardized scale, a movement of one standard deviation on pre-high school performance is more directly influential on high school performance than movement in socioeconomic advantage. However, because we also modeled an indirect influence of socioeconomic advantage through pre-high school performance, the total influence of socioeconomic advantage on high school performance is β = .69 – which is stronger than pre-high school performance at β = .47, as there is only a direct influence. Therefore, on a standardized scale, the movement of one standard deviation in socioeconomic advantage as determined by total influence is more influential than pre-high school performance. The direct, indirect, total effects, and fit statistics are reported in Table 2.
KPromise – First-Year Stop Out Main Model and Comparisons Between 06–10 to 11–15 Cohorts (Robust Standardized Coefficients Reported).
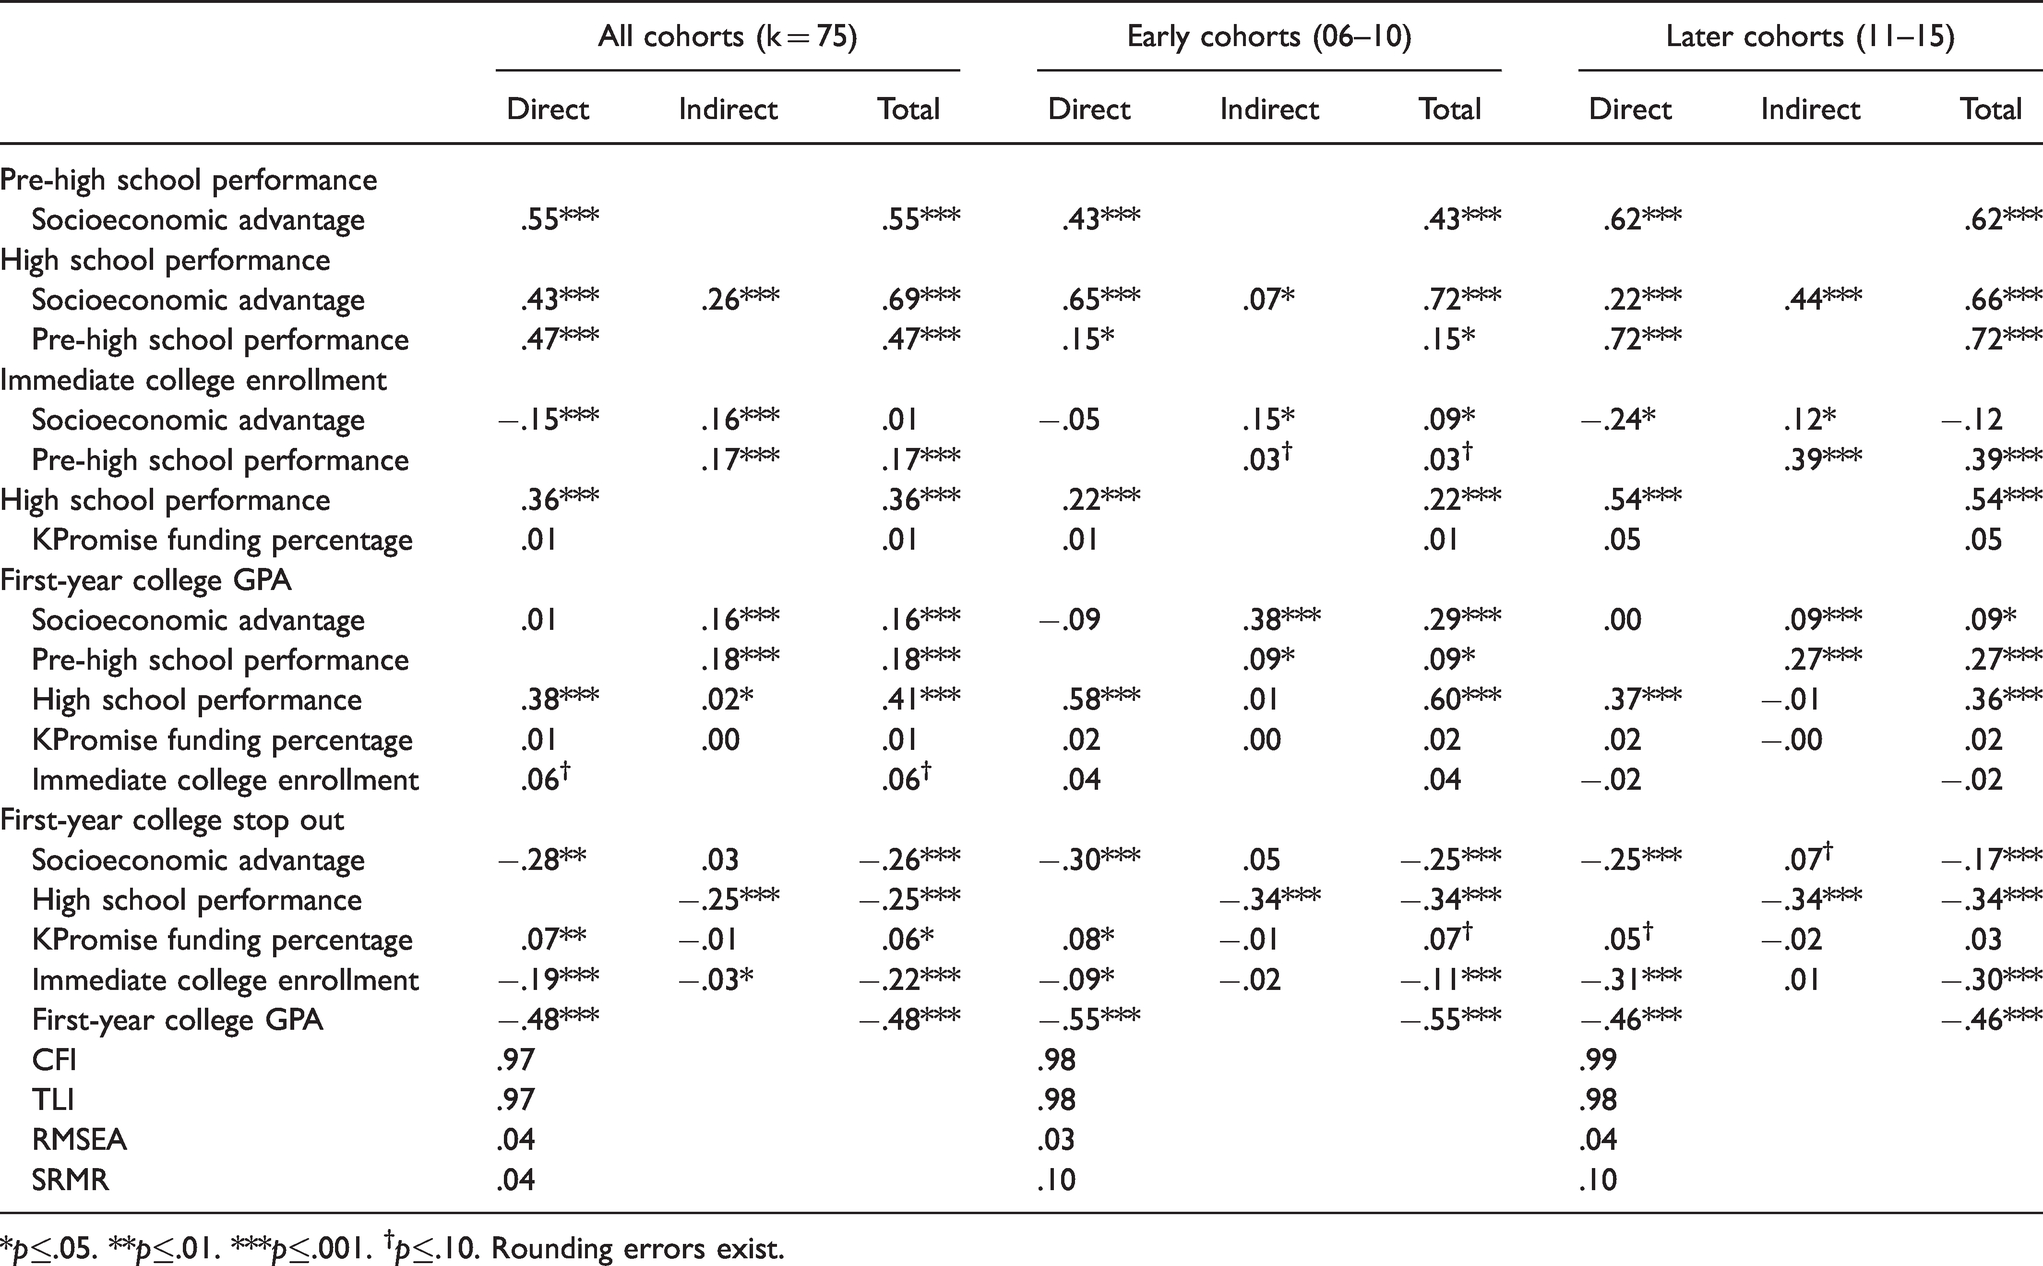
*p≤.05. **p≤.01. ***p≤.001. †p≤.10. Rounding errors exist.
Aligning with prior SEM studies (Bowman et al., 2019; Collier et al., 2020a), we reported two goodness of fit statistics – the Comparative Fit Index (CFI) and the Tucker-Lewis Index (TLI), and two badness of fit statistics – the Root Mean Square Error of Approximation (RMSEA) and the Standardized Root Mean Square Residual (SRMR). Methodologists suggest that models generated using SEM are of good fit if CFI≥.95, TLI≥.95, RMSEA≤.06, and SRMR≤.08 (Hu & Bentler, 1999; Shi et al., 2019). The k=75 reported model reached these thresholds as CFI=.97, TLI=.97, RMSEA=.04, and SRMS=.04. There is also an “optimal” range of fit where CFI≥.98, TLI≥.98, RMSEA≤.03, and SRMR≤.07 (Xia & Yang, 2019). None of the models were “optimal.” We do not report the Chi-Square statistic because Chi-Square is an inadequate gauge of model acceptance or rejection for SEM-generated models with large sample sizes (Kenny & McCoach, 2003).
Justifying Cohort Tests
Indicated by our last question, we tested for unique differences between the first (06-10) and second five (11-15) KPromise cohorts. From a statistical perspective, the developed models are of good fit for related to the CFI=.98/.99, TLI=.98/.98. RMSEA=.03/.04 but are outside of good fit for SRMR=.10/.10. We would prefer the models to be of good fit across all reported statistics; however, considering 3 of 4 fit thresholds meet the “optimal” range (Xia & Yang, 2019) we are comfortable in not rejecting these models. From a theoretical perspective, conversations with the Kalamazoo Promise administration and staff indicated that the first five years were unique from the next due to: (1) an increase of employed staff, (2) moving from the development of community and district-based relationship to a cemented structure and partner within the community, (3) identifying and developing key support structures for less advantaged students at WMU and KVCC – institutions with the highest enrollment rates, and (4) the relationship between the W.E. Upjohn Institute and Kalamazoo Promise informing administrator behavior and practices. Given these factors and that the initial cohorts of the Kalamazoo Promise could not shift their eligibility (meaning students were already locked in) and that students did not experience the aspirational effects of the Promise earlier on, it is generally agreed upon by the Kalamazoo Promise administrators that the first five cohorts are more of a baseline measurement and the next five represent an era where the Promise began to expand and gain enough influence to affect a variety of outcomes beyond providing students a scholarship. 11 We also decided that the ’15 cohort was a good cutoff as starting in 2016, the Kalamazoo Promise began another employment ramp-up based on information gained from more recent cohorts with the intention to reengage stopped out students, strengthening ties with college and universities, focus on the birth-to-college pipeline, and post-college outcomes including stackable credentials and employment. We attempted to test for unique trends for the 16-17 cohort, but the sample size is a limiting factor (see footnote 13).
Defining Stop Out
In step with prior SEM analyses, we defined stop out as disrupting continuous enrollment (Fall/Spring) at the institution students were first enrolled in (Bowman et al., 2019; Collier et al., 2020a). This study focuses on students who stopped out during their first year (n=1,298, 23% of the sample) because the highest rate of stop out occurs from the first-to-second year; of all students (n=3,130; 56% of the sample) who have ever stopped out by this definition, 42% do so from the first-to-second year. 12
Findings and Discussion
Our findings and discussion first highlight outcomes related to the underlying structure leading up to the main outcome of first-year stop-out. First, we detail the effect of socioeconomic advantage on academic performance and the decision to enroll in college within 6-months of high school graduation. Next, we report and discuss our findings testing the effect of KPromise funding on first-year college GPA. Afterward, we consider the effects on the main outcome of a first-year stop-out. Finally, we examine the differences in the first-year stop-out between the 2006-2010 and 2011-2015 cohorts. Table 2 reports the main, the 06-10, and the 11-15 models’ underlying structure and main outcome.
The Underlying Structure
Effects of Socioeconomic Advantage on Academic Performance
We found significant direct effects of socioeconomic advantage on pre-high school (β = .55) and high school performance measurements (β = .43) but no significant direct effect on first-year college GPA (β = .01). Regarding total effects, socioeconomic advantage remained an influence of pre-high school performance (β = .55), high school performance (β = .69) – and became a significant effect on first-year college GPA (β = .16). Socioeconomic advantage had a larger total effect on high school performance than did pre-high school performance (β = .47) but was similarly as strong of an effect on first-year college GPA as was pre-high school performance (β = .18).
Our findings that socioeconomic advantage exhibited both direct and indirect effects on first-year college GPA is aligned with prior SEM analyses (Bowman et al., 2019; Collier et al., 2020a) and illustrates the need for continued efforts to understand the full effects of socioeconomic advantage as related to college performance. Overall, linkages between socioeconomic advantage and all levels of academic performance align with various prior studies demonstrating such (Cabrera et al., 1993; Collier & McMullen, 2020; Yi et al., 2017) and highlight the ongoing need to identify students who are less socioeconomically advantaged to provide these students additional resources – before students reach high school.
Effects of Socioeconomic Advantage on College Enrollment
Next, socioeconomic advantage had direct effects on immediate college enrollment, counterintuitively the direct effect was negative (β = –.15). Whereas we found a negative direct effect, the indirect effect was positive and roughly as strong (β = .16) - therefore, suggestive of a moderation effect as the total influence is non-significant. Here, we may be uncovering the structure of “how” KPromise may be producing the access-related effects found by Bartik et al. (2019).
KPromise Funding Effects on College Enrollment and Performance
When examining total effects, changes in KPromise funding (from 65% to 100% of tuition and mandatory fees) had non-significant effects on immediate college enrollment. Findings on immediate college enrollment seem aligned with trends found via qualitative inquiry – in that access to any Promise funds, likely in combination with school- and community-based support structures, may provide to KPS students enough financial security and confidence to enter college immediately after high school. Previously, students indicated that without this complete intervention they would not have financial security and similar 13 college-going mentalities to access college (Collier & Parnther, 2018). We also found no significant direct (β = .01) or indirect (β = .00) effects from KPromise funding to first-year college GPA – which suggests that the percentage of KPromise funding does not seem linked with students’ first-year college GPA. This study is not alone in failing to establish links between the percentage of KPromise funding and college-related performance, as prior descriptive analysis on WMU students also found no link between KPromise funding percentage and students’ overall college GPA (Collier et al., 2019). Still, we suggest caution interpreting these findings as over 70% of students access funds covering 90% or more of mandatory tuition and fees.
The Main Outcome: Effects on First-Year Stop Out
Socioeconomic advantage remained a significant effect on a first-year stop out (β = –.26) – which was largely driven by the direct effect (β = –.28). Regarding total effects, socioeconomic advantage possessed similar effects on stop out as high school performance (β = –.25) and immediate college enrollment (β = –.22) – but was a much stronger effect than KPromise funding percentage (β = .06). The finding that socioeconomic advantage remains a strong effect on KPromise students’ college stop out was expected given longstanding linkages between socioeconomic advantages and college retention and persistence (see – Bowman et al., 2019; Collier et al., 2020a) and previously uncovered limitations of equalization that a tuition-free policy, even a rather generous one, could produce (see – Collier & McMullen, 2020). Whereas our model highlighted that KPromise cannot eliminate the influence of socioeconomic advantage on stopping out of college, we believe that when compared to less generous tuition-free models (e.g. last dollar), KPromise may ease the influence of socioeconomic advantages on stopping out to a higher degree. We believe testing our model’s structure on the El Dorado, Pittsburg, and Tennessee Promises could be one step towards uncovering different effects related to policy design.
Additionally, when considering a total effect, high school performance (β = –.25) and first-year college GPA (β = –.48) affected first-year stop out. The effect of high school and college performance on a stop out align with prior SEM analyses (Bowman et al., 2019; Collier et al., 2020a). Given the intertwining influence of socioeconomic advantage on all performance measurements and of performance on stopping out, comprehensive interventions intending to bolster socioeconomic advantages and academic performance of less advantaged students in 3rd-12th grades are still needed to produce better college outcomes. See for example, the Pathways to Education program in Toronto (Lavecchia et al., 2019) or the Gaining Early Awareness and Readiness for Undergraduate Programs (GEAR UP) that has previously produced positive middle-school and high school outcomes for less advantaged students (see Cabrera et al., 2006; Yampolskaya et al., 2006). As KPromise (and likely other tuition-free policies) may be helping pre-college academic performance play a stronger role in college outcomes, interventions addressing pre-college academic and socioeconomic needs may produce stronger effects on college performance and persistence for Promise students – especially given our findings in comparing the 2006-2010 and 2011-2015 cohorts.
Trends Between 06–10 and 11–12 Cohorts
Finally, based on the hypothesis that as the Kalamazoo Promise grows and evolves unique effects may be uncovered, we tested our model with the initial five cohorts (2006-2010) and the next five cohorts (2011-2015). In the early cohorts, as determined by total effect, socioeconomic advantage was significantly linked with all outcomes examined: pre-high school performance (β = .43), high school performance (β = .72), immediate college enrollment (β = .09), first-year college GPA (β = .29), and first-year stop out (β = –.25). In the latter cohorts (2011-2015), socioeconomic advantage became a non-significant effect on an immediate college enrollment (β = –.12). This finding suggests that over time, the KPromise produced a stronger equalization effect for college access. When comparing the earlier cohorts to the latter cohorts, the effects of pre-high school performance gained in strength as related to: (1) high school performance (β = .15 to .72), (2) immediate college enrollment (β = .03 to .39), and (3) first-year college GPA (β = .09 to .27) – and in every case possessed stronger effects than socioeconomic advantage. Specifically, in the latter cohorts, the effects of pre-high school performance were 3x stronger than the effects of socioeconomic advantage on immediate college enrollment, first-year college GPA, and were 2x stronger for first-year college stop out.
The differences between cohorts suggest that over time the entire intervention of the Kalamazoo Promise – being the scholarship funds in combination with community outreach and embeddedness in the KPS district and institutions that enroll the most students - may be easing the effects of socioeconomic advantage on performance at the high school and college levels. Yet, easing the effects of socioeconomic advantages has elevated the importance of grade school academic performance, which in the latter cohorts have become more strongly linked with socioeconomic advantages (β = .62). The strengthening of socioeconomic advantage on pre-high school performance for later cohorts may be representative of the demographic changes of KPS as a higher percentage of students became economically disadvantaged (FRL eligible) from the start of Promise (MI School Data, 2019). With socioeconomic advantage gaining in strength over pre-high school performance in later cohorts, if the interventions mentioned above were deployed before high school, pre-high school performance would likely be bolstered for many – which should positively impact future high school and college-related academic outcomes. While the Kalamazoo Promise cannot completely mitigate the effects of socioeconomic advantage on a stop out, we believe these encouraging findings point towards changes that may occur over time with interventions embedded in the community and school district and as students and their families fully realize the opportunities Promises present.
Limitations and Future Research
The current study only considers KPromise students who have enrolled in college; therefore, the generalizability of outcomes beyond KPromise students may be difficult. While “exact” outcomes may not be generalizable, the structure of our model could be tested with Promise and non-Promise students, and that trends related to significant effects could remain. Promise researchers could try an exact replication and non-Promise researchers could test a model with the percentage of promise funding deleted from the structure. Given that the structure was influenced by several SEM studies explicitly focused on higher education and that our outcomes exhibit similar trends related to significant effects on first-year college performance and persistence (Bowman et al., 2019; Collier et al., 2020a), we believe this model would be helpful to researchers interested in mapping effects on first-year stop out. Furthermore, given the lack of published studies mapping the indirect effects of pre-high school performance on college-related outcomes, despite calls for the need to do so (Bui, 2005; San Pedro et al., 2017), our study provides a testable structure for Promise and non-Promise researchers who intend to test for those effects.
This is the first study, we are aware of, that uses SEM to examine stop out among students benefiting from a Promise policy. We are certain this is the first study on KPromise students that includes pre-high school measures to test for effects of pre-high school performance on immediate college enrollment and first-year performance. As highlighted by our findings, pre-high school performance measures are significant variables linked with immediate college enrollment and first-year persistence. These outcomes widen our understanding of how to help Promise policies generate better outcomes and help more students earn degrees.
Next, this study did not consider students’ college-related socioeconomic status indicators (like food security and Pell eligibility), non-cognitive attributes, and social adjustment. Although students’ FRL status is a well-used and credible proxy for socioeconomic advantage (Domina et al., 2018), college-related financial aid variables would likely strengthen this research. Additionally, given the degree to which students’ non-cognitive attributes (Bowman et al., 2019) and basic needs (Collier et al., 2020a) affect first-year persistence, collecting these data and incorporating them into our model may generate stronger analyses.
Overall, these models require additional testing and modification. The Kalamazoo Promise is further expanding. Since 2015, KPromise has added staff who focus on persistence, dealing with various external events. Furthermore, since 2015, the Promise has been working towards influencing community partners - including KPS, postsecondary institutions, and local businesses - to provide more supports including but not limited to addressing basic needs and health (such as mobile dentistry), bolstering academic performance, and offering mentorship. Soon, the Kalamazoo Promise will be housed in a new building along with various community partners – and they plan on using this space to be a “one-stop-shop” to help Promise students. As such, this study can serve as a comparison point to examine how these interventions implemented during the next five cohorts may change the degree to which variables included in this study impact performance and persistence. 14 These evolutionary comparisons remain important to the Kalamazoo Promise, but thinking more widely, could also inform other policies (like El Dorado or Pittsburg) and help administrators evolve programs.
Finally, we have started testing the model based on whether students enrolled in KVCC or WMU – with trends generally remaining aligned with the main model. We have also tested student groups broken down by racial groups within the model and presented our initial findings at the Association for Education Finance and Policy (AEFP) 2021 national conference (Martinez et al., 2021). We see the contributions of the main model as a guidepost for future Promise researchers who intend to examine differences within subgroups and as a point of replication. In short, this study could help with identifying factors to the outcome and whether individual Promise policies are producing similar or divergent effects.
Implications and Conclusion
While the various positive effects of these policies are encouraging points from which to develop future programs, our analyses illustrate the limitations of Promise – in that arguably the most generous promise with widespread community support cannot eliminate the effects of socioeconomic advantage on academic performance. Such findings should be unsurprising and reaffirm prior theorizations of the limitations of Promise (see - Miller-Adams, 2015). Generally, this study signals that to bolster KPromise students’ college persistence, interventions aimed at helping less advantaged students strengthen academic performance before college remain needed. Although KPromise (and likely other tuition-free policies) may not fully mitigate the influence of socioeconomic advantage on pre-college or college academic performance, this analysis reinforces prior findings that KPromise has increased opportunities for less advantaged students by illustrating potential moderation of socioeconomic advantages on the decision to immediately enroll in college. Moreover, our study illustrated that as KPromise has evolved, the complete intervention may be tempering the effects of socioeconomic advantages on first-year college GPA and in stopping out. Although we promote caution with this finding, we believe the unearthed differences over time signal the potential power of a generous and adaptive Promise intervention.
Footnotes
Declaration of Conflicting Interests
The authors declared no potential conflicts of interest with respect to the research, authorship, and/or publication of this article.
Funding
The authors received no financial support for the research, authorship, and/or publication of this article.